Embed Size (px)
Citation preview
Surg Clin N Am 86 (2006) 1431–1456
Practical Issues of HemodynamicMonitoring at the Bedside
Patricio M. Polanco, MDa,Michael R. Pinsky, MD, CM, Dr hcb,*
aDivision of Trauma, Department of Surgery, University of Pittsburgh School of Medicine,
F1275 Scaife Hall, 3550 Terrace Street, Pittsburgh, PA 15261, USAbDepartment of Critical Care Medicine, University of Pittsburgh School of Medicine,
606 Scaife Hall, 3550 Terrace Street, Pittsburgh, PA 15261, USA
The hemodynamic monitoring of a surgical patient acquires a major rel-evance in high-risk patients and those suffering from surgical diseases asso-ciated with hemodynamic instability, such as hemorrhagic or septic shock;however, all surgical patients require the monitoring and evaluation, andsometimes benefit from optimizing their hemodynamic status. Therefore,all surgeons should have a basic understanding of the principles, indications,and therapeutic implications of hemodynamic monitoring.
Rationale for hemodynamic monitoring
The arguments to defend the use of specific types of monitoring techniquescan be roughly grouped into three levels based on their level of validation [1].At the basic level, the specific monitoring technique can be defended based onhistorical controls. At this level, prior experience using similarmonitoringwastraditionally used and presumed to be beneficial. Themechanismbywhich thebenefit is achieved need not be understood. The second level of defense comesthrough an understanding of the pathophysiology of the process beingtreated.This physiological argument canbe stated as ‘‘knowledgeofhowadis-ease process creates its effect and preventing the process from altering mea-sured bodily functions should prevent the disease process from progressingor injuring remote physiological functions.’’ Most of the rationale for
This work was supported by Grant federal funding HL67181 and HL0761570.
* Corresponding author.
E-mail address: [email protected] (M.R. Pinsky).
0039-6109/06/$ - see front matter � 2006 Elsevier Inc. All rights reserved.
doi:10.1016/j.suc.2006.09.003 surgical.theclinics.com
1432 POLANCO & PINSKY
hemodynamic monitoring resides at this level. It is not clear from recent clin-ical studies in critically ill patients that this argument is valid, primarily be-cause knowledge of the actual processes involved in the expression ofdisease and tissue injury is often inadequate. The third level of defense comesfrom documentation that the monitoring device, by altering therapy in other-wise unexpected ways, improves outcome in terms of survival and quality oflife. In reality, few therapies done in medicine can claim benefit at this level.Thus, we are left with the physiological rationale as the primary defense ofmonitoring of critically ill patients.
The physiologic basis for hemodynamic monitoring
On a philosophical level, one may consider the monitoring of criticallyill patients as serving a dual function. First, it can be used to documenthemodynamic stability and the lack of need for acute interventions, andsecond, it can be used to monitor when measured variables vary fromtheir defined baseline values. Accordingly, knowing the limits to whichsuch monitoring reflects actual physiological values is an essential aspectof its utility.
On the physical side, hemodynamic monitoring can be invasive or nonin-vasive, and continuous or intermittent. Monitoring devices can measurephysiologic variables directly, or derive these variables through signal pro-cessing. Signal processing does not minimize the usefulness of physiologicvariable analysis; it just separates the output data from the patient by theuse of the data processor. The most common signal processing physiologicvariable measured clinically is the electrocardiogram.
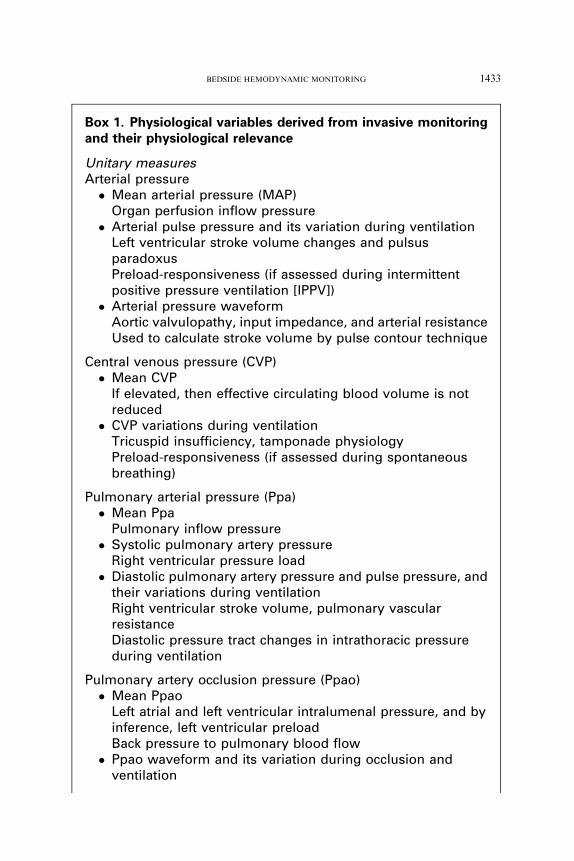
Variables that can be measured noninvasively include body temperature,heart rate, systolic and diastolic arterial blood pressure, and respiratoryfrequency. Processed noninvasive variables include the electrocardiogram,transcutaneous pulse oximetry (SpO2), expired CO2, trans-thoracic echo-cardiography, and noninvasive respiratory plethysmography. Invasivemonitoring reflects intravascular catheter insertion, transesophageal echo-cardiographic probe insertion, and blood component analysis. Invasive he-modynamic monitoring of vascular pressures is usually performed by thepercutaneous insertion of a catheter into a vascular space and transducingthe pressure sensed at the distal end. This allows for the continual displayand monitoring of these complex pressure waveforms. Similar intrapulmo-nary vascular catheters can be used to derive thermal signals and mixedvenous oxygen (O2) saturation (SvO2), needed to assess cardiac outputand the adequacy of O2 delivery, respectively. How useful this hemodynamicinformation is to diagnosis treatment and prognosis is a function of itsreliability, established treatment protocols, and guidelines, and the expertiseof the operator. Box 1 summarizes all the possible unitary and calculatedmeasures derived from invasive hemodynamic monitoring.
1433BEDSIDE HEMODYNAMIC MONITORING
Box 1. Physiological variables derived from invasive monitoringand their physiological relevance
Unitary measuresArterial pressure� Mean arterial pressure (MAP)
Organ perfusion inflow pressure� Arterial pulse pressure and its variation during ventilation
Left ventricular stroke volume changes and pulsusparadoxusPreload-responsiveness (if assessed during intermittentpositive pressure ventilation [IPPV])� Arterial pressure waveform
Aortic valvulopathy, input impedance, and arterial resistanceUsed to calculate stroke volume by pulse contour technique
Central venous pressure (CVP)� Mean CVP
If elevated, then effective circulating blood volume is notreduced� CVP variations during ventilation
Tricuspid insufficiency, tamponade physiologyPreload-responsiveness (if assessed during spontaneousbreathing)
Pulmonary arterial pressure (Ppa)� Mean Ppa
Pulmonary inflow pressure� Systolic pulmonary artery pressure
Right ventricular pressure load� Diastolic pulmonary artery pressure and pulse pressure, and
their variations during ventilationRight ventricular stroke volume, pulmonary vascularresistanceDiastolic pressure tract changes in intrathoracic pressureduring ventilation
Pulmonary artery occlusion pressure (Ppao)� Mean Ppao
Left atrial and left ventricular intralumenal pressure, and byinference, left ventricular preloadBack pressure to pulmonary blood flow� Ppao waveform and its variation during occlusion and
ventilation
1434 POLANCO & PINSKY
Arterial pressure monitoring
After pulse rate, arterial pressure is the most common hemodynamic vari-able monitored and recorded. Blood pressure is usually measured nonin-vasively using a sphygmomanometer and the auscultation technique.Importantly, very large and obese subjects in whom the upper arm circumfer-ence exceeds the width limitations of a normal blood pressure cuff will record
Mitral valvulopathy, atrial or ventricular etiology ofarrhythmia, accuracy of mean Ppao to measure intralumenalleft ventricle (LV) pressure, and pulmonary capillary pressure(Ppc)
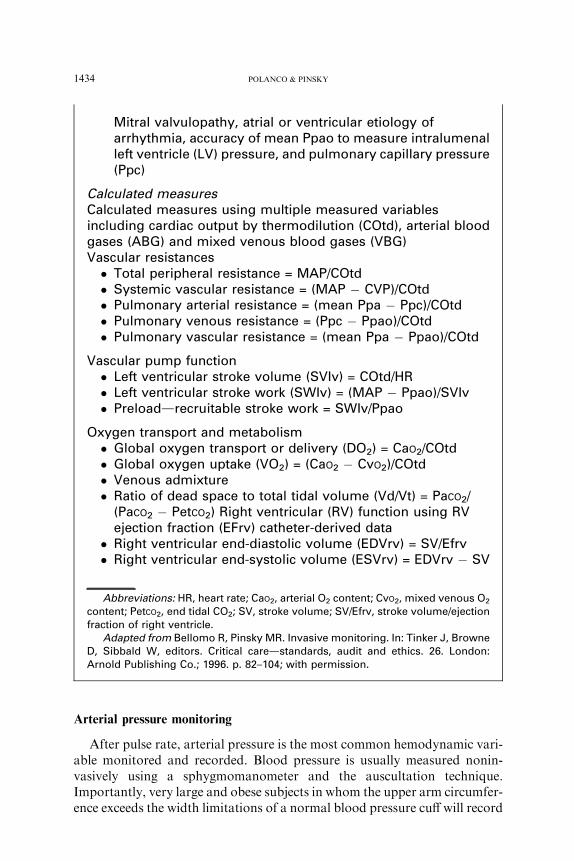
Calculated measuresCalculated measures using multiple measured variablesincluding cardiac output by thermodilution (COtd), arterial bloodgases (ABG) and mixed venous blood gases (VBG)Vascular resistances� Total peripheral resistance = MAP/COtd� Systemic vascular resistance = (MAP � CVP)/COtd� Pulmonary arterial resistance = (mean Ppa � Ppc)/COtd� Pulmonary venous resistance = (Ppc � Ppao)/COtd� Pulmonary vascular resistance = (mean Ppa � Ppao)/COtd
Vascular pump function� Left ventricular stroke volume (SVIv) = COtd/HR� Left ventricular stroke work (SWIv) = (MAP � Ppao)/SVIv� Preloaddrecruitable stroke work = SWIv/Ppao
Oxygen transport and metabolism� Global oxygen transport or delivery (DO2) = CaO2/COtd� Global oxygen uptake (VO2) = (CaO2 � CvO2)/COtd� Venous admixture� Ratio of dead space to total tidal volume (Vd/Vt) = PaCO2/
(PaCO2 � PetCO2) Right ventricular (RV) function using RVejection fraction (EFrv) catheter-derived data
� Right ventricular end-diastolic volume (EDVrv) = SV/Efrv� Right ventricular end-systolic volume (ESVrv) = EDVrv � SV
Abbreviations: HR, heart rate; CaO2, arterial O2 content; CvO2, mixed venous O2
content; PetCO2, end tidal CO2; SV, stroke volume; SV/Efrv, stroke volume/ejectionfraction of right ventricle.
Adapted from Bellomo R, Pinsky MR. Invasive monitoring. In: Tinker J, BrowneD, Sibbald W, editors. Critical caredstandards, audit and ethics. 26. London:Arnold Publishing Co.; 1996. p. 82–104; with permission.
1435BEDSIDE HEMODYNAMIC MONITORING
pressures that are higher than they actually are. In such patients, using thelarge thigh blood pressure cuff usually resolves this problem. Blood pressurecan be measured automatically using computer-driven devices (eg,Dynamat) that greatly reduce nursing time. Sphygmomanometer-derivedblood pressure measures display slightly higher systolic and lower diastolicpressures than simultaneously measured indwelling arterial catheters, butthe mean arterial pressure is usually similar, and the actual systolic and dia-stolic pressure differences are often small except in the setting of increased pe-ripheral vasomotor tone. If perfusionpressure of the finger is similar to arterialpressure, then both blood pressure and the pressure profile may be recordednoninvasively and continuously using the optical finger probe (FinapresMed-ical Systems BV, Amsterdam, The Netherlands). Finger perfusion is oftencompromised during hypovolemic shock and hypothermia, however, limitingthis monitoring technique to relatively well-perfused patients.
Accurate and continuous measures of arterial pressure can be donethrough arterial catheterization of easily accessible arterial sites in the arm(axillary, brachial, or radial arterial) or groin (femoral arterial). Usually nei-ther axillary nor brachial arterial sites are used because of fears of causingdownstream ischemia, although there are no data supporting these fears.Arterial catheterization displaying continuous arterial pressure waveformslends itself to arterial waveform analysis, essential in calculating pulse pres-sure, pulse pressure variations, and cardiac output.
Why measure arterial pressure?
Arterial pressure is the input pressure for organ perfusion. Organ perfu-sion is usually dependent on organ metabolic demand and perfusion pres-sure. With increasing tissue metabolism, organ blood flow proportionallyincreases by selective local vasodilation of the small resistance arterioles.If cardiac output cannot increase as well, as is the case with heart failure,then blood pressure decreases, limiting the ability of local vasomotor controlto regulate organ blood flow. If local metabolic demand remains constant,however, changes in arterial pressure are usually matched by changes in ar-terial tone so as to maintain organ blood flow relatively constant. This localvasomotor control mechanism is referred to as autoregulation. Cerebralblood flow over the normal autoregulatory range of 65 to 120 mm Hg is re-markably constant. Although autoregulation occurs in many organs, suchas the brain, liver, skeletal muscle, and skin, it is not a universal phenome-non. For example, coronary flow increases with increasing arterial pressurebecause the myocardial O2 demand increases as the heart ejects into a higherarterial pressure circuit. Furthermore, renal blood flow increases in a pres-sure-dependent fashion over its entire pressure for similar reasons. As renalflow increases, so does renal filtrate flow into the tubules, increasing renalmetabolic demand. Thus, a normal blood pressure does not mean that allorgans have an adequate amount of perfusion, because increases in local
1436 POLANCO & PINSKY
vasomotor tone and mechanical vascular obstruction can still induce asym-metrical vascular ischemia.
Determinants of arterial pressure
Arterial pressure is a function of both vasomotor tone and cardiac out-put. The local vasomotor tone also determines blood flow distribution,which itself is usually determined by local metabolic demands. For a con-stant vasomotor tone, vascular resistance can be described by the relationbetween changes in both arterial pressure and cardiac output. The body de-fends organ perfusion pressure above all else in its autonomic hierarchythrough alterations in a-adrenergic tone, mediated through baroreceptorslocated in the carotid sinus and aortic arch. This supremacy of arterial pres-sure in the adaptive response to circulatory shock exists because both coro-nary and cerebral blood flows are dependent only on perfusion pressure.The cerebral vasculature has no a-adrenergic receptors; the coronary circu-lation has only a few. Accordingly, hypotension always reflects cardiovascu-lar embarrassment, but normotension does not exclude it. Hypotensiondecreases organ blood flow and stimulates a strong sympathetic responsethat induces a combined a-adrenergic (increased vasomotor tone) and b-ad-renergic (increased heart rate and cardiac contractility) effect, and causesa massive adenrocorticotropic hormone (ACTH)-induced cortisol releasefrom the adrenal glands. Thus, to understand the determinants of arterialpressure one must also know the level of vasomotor tone.
In the intensive care unit setting, arterial tone can be estimated at the bed-side by calculating systemic vascular resistance. Using Ohm’s Law, resis-tance equals the ratio of the pressure to flow, usually calculated as theratio of the pressure gradient between aorta and central venous pressure(CVP) to cardiac output. Arterial tone can also be calculated as total periph-eral resistance, which is the ratio of mean arterial pressure to cardiac output.Regrettably, neither systemic vascular resistance nor total peripheral resis-tance faithfully describes arterial resistance. Arterial resistance is the slopeof the arterial pressure-flow relation. The calculation of systemic vascularresistance using CVP as the backpressure to flow has no physiological ratio-nale, and the use of systemic vascular resistance for clinical decision-makingshould be abolished. Regrettably, both systemic vascular resistance and to-tal peripheral resistance are still commonly used in hemodynamic monitoringbecause they allow for the simultaneous assessment of both pressure andflow, whereas the actual measure of arterial tone is more difficult to estimate.
The determinants of arterial pressure can simplistically be defined as sys-temic arterial tone and blood flow. Because blood flow distribution will varyamongst organs relative to their local vasomotor tone, and arterial pressureis similar for most organs, measurement of peripheral resistance, by anymeans or formula, reflects the lump parameter of all the vascular beds,and thus describes no specific vascular bed completely. If no hemodynamic
1437BEDSIDE HEMODYNAMIC MONITORING
instability alters normal regulatory mechanisms, then local blood flow willalso be proportional to local metabolic demand. Within this construct, theonly reason cardiac output becomes important is to sustain an adequateand changing blood flow to match changes in vasomotor tone, such that ar-terial input pressure remains constant. Because cardiac output is propor-tional to metabolic demand, there is no level of cardiac output thatreflects normal values in the unstable and metabolically active patient; how-ever, as blood pressures decreases below 60 mm Hg mean or cardiac indicesdecrease below 2.0 l/min/m2, organ perfusion usually becomes compro-mised, and if sustained, will lead to organ failure and death. Presently,only one clinical trial has examined the effect of increasing mean arterialpressure on tissue blood flow [2]. When patients with circulatory shockwere resuscitated with volume and vasopressors to a mean arterial pressurerange of 60 to 70, 70 to 80, or 80 to 90 mm Hg, no increased organ bloodflow could be identified above a mean arterial pressure of 65 mm Hg.Clearly, subjects who have prior hypertension will have their optimal perfu-sion pressure range increased over normotensive patients. Thus, there are nofirm data supporting any one limit of arterial pressure or cardiac outputvalues or therapeutic approaches based on these values as more beneficialthan any other. Accordingly, empiricism is the rule regarding target valuesof both mean arterial pressure and cardiac output. At present, the literaturesuggests that maintaining a previously nonhypertensive patient’s mean arte-rial pressure greater than 65 mm Hg by the use of fluid resuscitation andsubsequent vasopressor therapy is an acceptable target. Previously hyper-tensive subjects will need a higher mean arterial pressure to insure thesame degree of blood flow [2]. There is no proven value in forcing either ar-terial tone or cardiac output to higher levels to achieve a mean arterial pres-sure above this threshold. In fact, data suggest that further resuscitativeefforts using vasoactive agents markedly increase mortality [3], and the rel-atively new concept of ‘‘delayed’’ and ‘‘hypotensive resuscitation’’ for trau-matic hemorrhagic shock has shown improved outcome in some clinical andexperimental studies [4–6]. Those studies, however, were in trauma patientswho had penetrating wounds and no immediate access to surgical repair.Once a patient is in the hospital and the sites of active bleeding addressed,then aggressive fluid and pressor resuscitation is indicated.
Arterial pressure variations during ventilation
The majority of the critically ill surgical patients treated in the ICU areusually on mechanical ventilation. Ventilation-induced arterial pressure var-iations have been described since antiquity as pulsus paradoxus. Inspiratorydecreases in arterial pressure were used to monitor both the severity of bron-chospasm in asthmatics and their inspiratory efforts [7].
Recently renewed interest in the hemodynamic significance of heart-lunginteractions has emerged. The commonly observed variations in arterial
1438 POLANCO & PINSKY
pressure and aortic flow seen during positive- pressure ventilation have beenanalyzed as a measure of preload responsiveness [8]. The rationale for thisapproach is that positive-pressure ventilation–induced changes in either sys-tolic arterial pressure (used to describe pulsus paradoxus), arterial pulsepressure, or stroke volume can predict in which subjects cardiac outputwill increase in response to fluid resuscitation. Ventilation-induced changesin systolic arterial pressure (pulsus paradoxus) and arterial pulse pressureare easy to measure from arterial pressure recordings. The greater the degreeof systolic arterial pressure or pulse pressure variation over the respiratorycycle, the greater the increase in cardiac output in response to a defined fluidchallenge. Recently, measuring the mean change in aortic blood flow duringpassive leg raising in spontaneous breathing patients has also proven accu-rate in predicting preload responsiveness [9].
Although arterial pressure variations are a measure of preload-respon-siveness [10], the ‘‘traditional’’ preload measures, such as right atrial pres-sure (Pra), Ppao, RV end-diastolic volume, and intrathoracic bloodvolume, poorly reflect preload-responsiveness [11]. In essence, preload isnot preload-responsiveness.
Indications for arterial catheterization
The arterial catheter is frequently inserted as a ‘‘routine’’ at the admissionof patients to the ICU for continuous monitoring of blood pressure and re-petitive measurements of blood gases. There is no evidence to support thisexaggerated clinical practice. Although probably the only proven indicationfor arterial catheterization is to synchronize the intra-aortic balloon ofcounterpulsation, there are some others indications whereby the informa-tion obtained is valuable in the assessment and treatment of the patient,such as cardiovascular instability or the use of vasopressors or vasodilatorsduring resuscitation. The probable indications for arterial catheterizationare summarized in Box 2. Although arterial catheterization is an invasiveprocedure that is not free of complications, a recent systematic review ofa large number of cases [12] showed that most of the complications wereminor, including temporary vascular occlusion (19.7%) and hematoma(14.4%). Permanent ischemic damage, sepsis, and pseudoaneurysm forma-tion occurred in fewer than 1% of cases [12].
Central venous pressure monitoring
Methods of measuring central venous pressure
CVP is the pressure in the large central veins proximal to the right atriumrelative to atmosphere. In the ICUs, theCVP is usuallymeasured using a fluid-filled catheter (central venous line or Swan-Ganz catheter) with the distal tiplocated in the superior vena cava connected to a manometer, or more often to
1439BEDSIDE HEMODYNAMIC MONITORING
a pressure transducer of a monitor, displaying the waveform in a continuousfashion. CVP can also be measured noninvasively as jugular venous pressure,the height of the column of blood distending the internal and external jug-ular veins when the subject is sitting in a semireclined position; small ele-vations in CVP will be reflected by persistent jugular venous distention.
Determinants of central venous pressure
Starling demonstrated the relationship between cardiac output, venousreturn, and CVP, showing that increasing the venous return (and preload)
Box 2. Arterial catheterization
Indications for arterial catheterization� As a guide to synchronization of intra-aortic balloon counter
pulsation
Probable indications for arterial catheterization� Guide to management of potent vasodilator drug infusions
to prevent systemic hypotension� Guide to management of potent vasopressor drug infusions
to maintain a target MAP� As a port for the rapid and repetitive sampling of arterial
blood inpatients in whom multiple arterial blood samplesare indicated
� As a monitor of cardiovascular deterioration in patients at riskfor cardiovascular instability
Useful applications of arterial pressure monitoring in thediagnosis of cardiovascular insufficiency� Differentiating cardiac tamponade (pulsus paradoxus) from
respiration-induced swings in systolic arterial pressuredtamponade reduces the pulse pressure but keeps diastolicpressure constant. Respiration reduces systolic and diastolicpressure equally, such that pulse pressure is constant.
� Differentiating hypovolemia from cardiac dysfunction as thecause of hemodynamic instability. Systolic arterial pressuredecreases more following a positive pressure breath ascompared to an apneic baseline during hypovolemia. Systolicarterial pressure increases more during positive pressureinspiration when LV contractility is reduced.
Adapted from Bellomo R, Pinsky MR. Invasive monitoring. In: Tinker J,Browne D, Sibbald W, editors. Critical CaredStandards, Audit and Ethics. 26.London: Arnold Publishing Co., 1996. p. 82–104; with permission.
1440 POLANCO & PINSKY
increases the stroke volume (and cardiac output [CO]) until a plateau isreached. Although the CVP is clearly influenced by the volume of bloodin the central compartment and its venous compliance; there are severalphysiological and anatomical factors that can influence its measurementand waveform, such as the vascular tone, right ventricular function, intra-thoracic pressure changes, tricuspid valve disease, arrhythmias, and bothmyocardial and pericardial disease. These are summarized in Box 3.
Box 3. Factors affecting the measured CVP
Central venous blood volume� Venous return/cardiac output� Total blood volume� Regional vascular tone
Compliance of central compartment� Vascular tone� RV compliance� Myocardial disease� Pericardial disease� Tamponade
Tricuspid valve disease� Stenosis� Regurgitation
Cardiac rhythm� Junctional rhythm� Atrial fibrillation (AF)� Atrio ventricular (A-V) dissociation
Reference level of transducer� Positioning of patient
Intrathoracic pressure� Respiration� IPPV� Positive end-expiratory pressure (PEEP)� Tension pneumothorax
From Smith T, Grounds RM, Rhodes A. Central venous pressure: uses andlimitations. In: Pinsky MR, Payen D. Functional hemodynamic monitoring. Berlin,Heidelberg (Germany): Springer-Verlag; 2006. p. 101; with kind permission ofSpringer Science and Business Media.
1441BEDSIDE HEMODYNAMIC MONITORING
Monitoring central venous pressure
CVP has been used as a monitor of central venous blood volume and anestimate of the right atrial pressure for many years, being wrongly used asa parameter and sometimes goal for replacement of intravascular volumein shock patients. The validity of this measure as an index of RV preloadis nonexistent across numerous studies. It has been shown that CVP hasa poor correlation with cardiac index, stroke volume, left ventricular end-di-astolic volume, and right ventricular end-diastolic volume [13–15].
Although a very high CVP demands a certain level of total circulatingblood volume, one may have a CVP of 20 mm Hg and still have an under-filled left ventricle that is fluid responsive. For example, in the setting ofacute RV infarction, CVP can be markedly elevated, whereas cardiac outputoften increases further with volume loading. In reported series, some patientswho had low CVP failed to respond to fluids and some patients who had highCVP responded to challenge of fluids [16]. Based on this and the poor corre-lations described above, it is impossible to define ideal values of CVP; how-ever, there is some evidence that volume loading in patients who have CVPgreater than 12 mmHg is very unlikely to increase cardiac output [17]. Thus,the only usefulness of CVP is to define relative hypervolemia, because anelevated CVP only occurs in disease. Two clinical studies [18,19] showed apotential benefit in specific groups of surgical patients (hip replacementand renal transplant patients) in whom CVP was used to guide therapy; how-ever, there is no clinical evidence that CVP monitoring improves outcome incritically ill patients, and attempts to normalize CVP in early goal directedtherapy during resuscitation do not display any benefit [20].
Pulmonary artery catheterization and its associated monitored variables
Pulmonary arterial catheterization allows the measurement of many clin-ically relevant hemodynamic variables (see Box 1). One can measure the in-trapulmonary vascular pressures including CVP, Ppa, and by intermittentballoon occlusion of the pulmonary artery, Ppao and pulmonary capillarypressure (Ppc). Furthermore, by using the thermodilution technique andthe Stewart-Hamilton equation, one can estimate cardiac output andEFrv, global cardiac volume, and intrathoracic blood volume. Finally,one can measure mixed SvO2 either intermittently by direct sampling ofblood from the distal pulmonary arterial port or continuously via fiber opticreflectometry. Assuming one knows the hemoglobin concentration and cantract arterial O2 saturation (SaO2), easily estimated by noninvasively bypulse oximetry as SpO2, one can calculate numerous derived variablesthat describe well the global cardiovascular state of the patient. These de-rived variables include DO2, VO2, venous admixture (as an estimate of in-trapulmonary shunt), pulmonary and systemic vascular resistance, EDVrvand ESVrv, and both RV and LV stroke work index.
1442 POLANCO & PINSKY
Pulmonary artery pressure
The determinants of Ppa are the volume of blood ejected into the pulmo-nary artery during systole, the resistance of the pulmonary vascular bed, andthe downstream left atrial (LA) pressure. The pulmonary vascular bed isa low-resistance circuit with a large reserve that allows increases of cardiacoutput with minor changes in the Ppa. On the other hand, increases in thedownstream venous pressure (eg, left ventricular failure) or in the flow resis-tance (eg, lung diseases) raise the Ppa. Although increases in cardiac outputalone do not cause pulmonary hypertension, having an increased vascularresistance can lead to elevations in Ppa, with changes in cardiac output.Based on these considerations, the Ppa should not be used as a reliableparameter of ventricular filling under several lung diseases that causechanges in the vascular tone and cardiac output. The normal range of valuesfor Ppa are: systolic 15 to 30 mm Hg, diastolic 4 to 12 mm Hg, and mean9 to 18 mm Hg [21].
Pulmonary artery occlusion pressure
Methods of measuring pulmonary artery occlusion pressure
Numerous studies by physicians have demonstrated that the ability to ac-curately measure Ppao from a strip chart recording or a freeze-frame snap-shot of the monitor screen is poor. Many initiatives have been put into placeto educate physicians and nurses, but the reality is that because the pressuremeasured also reports changes in intrathoracic pressure, a value which isalways changing, the accuracy of Ppao measures is likely to remain poor.
The Ppao value is thought to reflect the LV filling because of the uniquecharacteristic of the pulmonary circulation. Balloon inflation of the pulmo-nary artery catheter (PAC) forces the tip to migrate distally into smaller ves-sels until the tip occludes a medium-sized (1.2 cm diameter) pulmonaryartery. This occlusion stops all blood flow in that vascular tree distal tothe occlusion site, until such time as other venous branches reconnect down-stream to this venous draining bed. The point where such parallel pulmo-nary vascular beds anastomose is about 1.5 cm from the left atrium.Thus, if a continuous column of blood is present from the catheter tip tothe left heart, then Ppao measures pulmonary venous pressure at this firstjunction, or J-1 point, of the pulmonary veins [22]. As downstream pulmo-nary blood flow ceases, distal pulmonary arterial pressure falls in a doubleexponential fashion to a minimal value, reflecting the pressure downstreamin the pulmonary vasculature from the point of occlusion. The Ppa valuewhere the first exponential pressure decay is overtaken by the second longerexponential pressure decay reflects Ppc measures, useful in calculating pul-monary arterial and venous resistances. Importantly, the column of waterat the end of the catheter is now extended to include the pulmonary vascular
1443BEDSIDE HEMODYNAMIC MONITORING
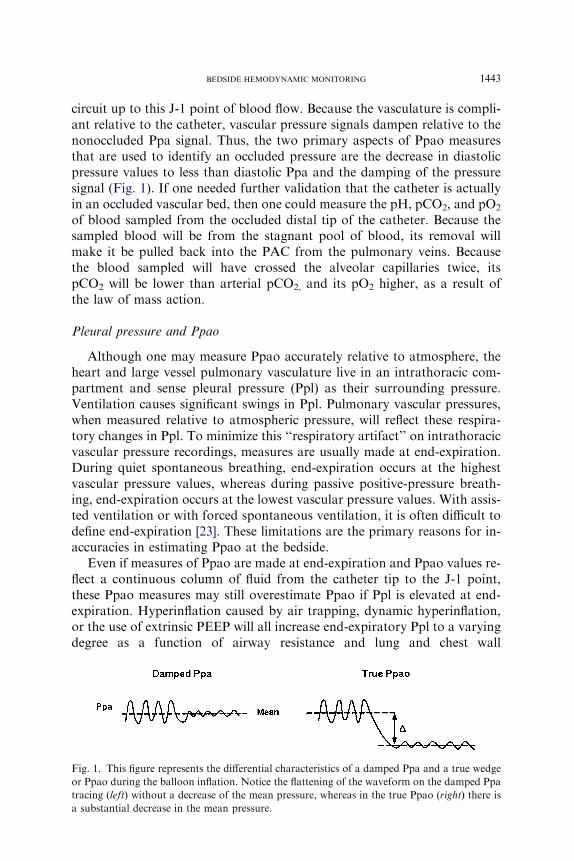
circuit up to this J-1 point of blood flow. Because the vasculature is compli-ant relative to the catheter, vascular pressure signals dampen relative to thenonoccluded Ppa signal. Thus, the two primary aspects of Ppao measuresthat are used to identify an occluded pressure are the decrease in diastolicpressure values to less than diastolic Ppa and the damping of the pressuresignal (Fig. 1). If one needed further validation that the catheter is actuallyin an occluded vascular bed, then one could measure the pH, pCO2, and pO2
of blood sampled from the occluded distal tip of the catheter. Because thesampled blood will be from the stagnant pool of blood, its removal willmake it be pulled back into the PAC from the pulmonary veins. Becausethe blood sampled will have crossed the alveolar capillaries twice, itspCO2 will be lower than arterial pCO2, and its pO2 higher, as a result ofthe law of mass action.
Pleural pressure and Ppao
Although one may measure Ppao accurately relative to atmosphere, theheart and large vessel pulmonary vasculature live in an intrathoracic com-partment and sense pleural pressure (Ppl) as their surrounding pressure.Ventilation causes significant swings in Ppl. Pulmonary vascular pressures,when measured relative to atmospheric pressure, will reflect these respira-tory changes in Ppl. To minimize this ‘‘respiratory artifact’’ on intrathoracicvascular pressure recordings, measures are usually made at end-expiration.During quiet spontaneous breathing, end-expiration occurs at the highestvascular pressure values, whereas during passive positive-pressure breath-ing, end-expiration occurs at the lowest vascular pressure values. With assis-ted ventilation or with forced spontaneous ventilation, it is often difficult todefine end-expiration [23]. These limitations are the primary reasons for in-accuracies in estimating Ppao at the bedside.
Even if measures of Ppao are made at end-expiration and Ppao values re-flect a continuous column of fluid from the catheter tip to the J-1 point,these Ppao measures may still overestimate Ppao if Ppl is elevated at end-expiration. Hyperinflation caused by air trapping, dynamic hyperinflation,or the use of extrinsic PEEP will all increase end-expiratory Ppl to a varyingdegree as a function of airway resistance and lung and chest wall
Fig. 1. This figure represents the differential characteristics of a damped Ppa and a true wedge
or Ppao during the balloon inflation. Notice the flattening of the waveform on the damped Ppa
tracing (left) without a decrease of the mean pressure, whereas in the true Ppao (right) there is
a substantial decrease in the mean pressure.
1444 POLANCO & PINSKY
compliance. It is not possible to predict with accuracy the degree to whichincreases in PEEP will increase Ppl. Because differences in lung and chestwall compliance exist among patients and within the same patient otherover time, one cannot assume a fixed relation between increases in airwaypressure (Paw) and Ppl [24].
Why measure pulmonary artery occlusion pressure?
Ppao is used most often in the bedside assessment of: (1) pulmonaryedema, (2) pulmonary vasomotor tone, (3) intravascular volume statusand LV preload, and (4) LV performance. These points were summarizedrecently and are restated below [25].
Pulmonary edema
Pulmonary edema can be caused by either elevations of pulmonary cap-illary pressure, referred to as hydrostatic or secondary pulmonary edema, orincreased alveolar capillary or epithelial permeability, referred to as primarypulmonary edema. Usually hydrostatic pulmonary edema requires a pulmo-nary capillary increase to greater than 18 mm Hg; however, if capillary oralveolar cell injury is present, alveolar flooding can occur at much lower pul-monary capillary pressures. Furthermore, in the setting of chronic pul-monary vascular congestion, increased pulmonary lymphatic flow andincreased respiratory excursions promote a rapid clearance of lung intersti-tial fluid, minimizing edema formation. Still, measures of Ppao are com-monly used to determine the cause of pulmonary edema. Ppao values lessthan 18 mm Hg suggest a nonhydrostatic cause, whereas values greaterthan 20 mm Hg suggest a hydrostatic cause of pulmonary edema [22]; how-ever, many exceptions to this rule exist. As mentioned above, if increasedlung permeability is present, then fluid-resuscitation–induced pulmonaryedema may occur at Ppao values much below 18 mm Hg, and treatmentstrategies aimed at reducing Ppao further will reduce pulmonary edema for-mation. Similarly, if pulmonary venous resistance is increased, then Ppc maybe much higher than the measured Ppao, inducing hydrostatic pulmonaryedema despite no increased lung permeability and a low Ppao. Similarly,Ppao may be greater than 20 mm Hg without any evidence of hydrostaticpulmonary edema, either because Ppl is also elevated or because of increasedpulmonary lymphatic flow.
Pulmonary vasomotor tone
The pulmonary circulation normally has a low resistance, with pulmo-nary arterial diastolic pressure only slightly higher than Ppao and mean pul-monary arterial pressure a few mm Hg higher than Ppao. Pulmonaryvascular resistance (PVR) can be estimated using Ohm’s Law as the ratioof the pulmonary vascular pressure gradient (mean pulmonary artery
1445BEDSIDE HEMODYNAMIC MONITORING
pressure minus Ppao) and cardiac output (ie, PVR ¼ (mean Ppa � Ppao)/CO). Normal pulmonary vascular resistance is between 2 and 4 mm Hg �l/min/m2. Usually these values are multiplied by 80 to give normal pulmo-nary vascular resistance range in dynes sec/cm5 of 150 to 250. Either an in-creased pulmonary vascular resistance or a passive pressure buildup fromthe pulmonary veins can induce pulmonary hypertension. If pulmonary hy-pertension is associated with an increased PVR, then the causes are primar-ily within the lung. Diagnoses such as pulmonary embolism, pulmonaryfibrosis, essential pulmonary hypertension, and pulmonary veno-occlusivedisease need to be excluded. If PVR is normal, then LV dysfunction is themore likely cause of pulmonary hypertension [26]. Because the treatmentsfor these two groups of diseases are quite different despite similar increasesin pulmonary arterial pressure, the determination of PVR in the setting ofpulmonary hypertension is very important. Regrettably, PVR poorly reflectstrue pulmonary vasomotor tone in lung disease states and during mechani-cal ventilation, especially with the application of PEEP. Alveolar pressure(Palv) can be the back pressure to pulmonary blood flow in certain lung re-gions during positive-pressure ventilation and in the presence of hyperinfla-tion, because Palv exceeds left atrial pressure. Furthermore, because lungdisease is usually nonhomogeneous, pulmonary blood flow is preferentiallyshifted from compressed vessels in West Zone 1 and 2 conditions (Ppao!Palv and Ppa ¼ Palv, respectively) to those circuits with the lowest resis-tance (West Zone 3; ie, Ppao O Palv), thus making the lung vascular pathol-ogy appear less than it actually is.
Left ventricular preload
Ppao is often taken to reflect LV filling pressure, and by inference, LVend-diastolic volume. Patients who have cardiovascular insufficiency anda low Ppao are presumed to be hypovolemic and initially treated with fluidresuscitation, whereas patients who have similar presentations but an ele-vated Ppao are presumed to have impaired contractile function. Althoughthere are no accepted high and low Ppao values for which LV underfillingis presumed to occur or not, Ppao values less than 10 mm Hg are usuallyused as presumed evidence of a low LV end-diastolic volume, whereasvalues greater than 18 mm Hg suggest a distended LV [27]. Unfortunately,there are very few data to support this approach. There are multiple docu-mented reasons for this observed inaccuracy that relate to individual differ-ences in LV diastolic compliance and contractile function [28]. First, therelation between Ppao and LV end-diastolic volume is curvilinear and is of-ten very different among subjects and within subjects over time. Thus, nei-ther absolute values of Ppao nor changes in Ppao will define a specific LVend-diastolic volume or its change [29]. Second, Ppao is not the distendingpressure for LV filling. It is only the internal pressure of the pulmonary veinsrelative to atmospheric pressure. Assuming Ppao approximated left atrial
1446 POLANCO & PINSKY
pressure, it will poorly reflect LV end-diastolic pressure, because it poorlyfollows the late diastolic pressure rise induced by atrial contraction anddoes not measure pericardial pressure, which is the outside pressure forLV distention. With lung distention, Ppl increases increasing pericardialpressure. Although we can estimate Ppl using esophageal balloon catheters,pericardial pressure is often different. Changes in pericardial pressure willalter LV end-diastolic volume independent of Ppao. Finally, even if oneknew pericardial pressure and Ppao did accurately reflect LV end-diastolicpressure, LV diastolic compliance can vary rapidly, changing the relationbetween LV filling pressure and LV end-diastolic volume. Myocardial ische-mia, arrhythmias, and acute RV dilation can all occur over a few heartbeats.Thus, is not surprising that Ppao is a very poor predictor of preload respon-siveness. Therefore, it is not recommended to use Ppao to predict responseto fluid resuscitation in critically ill patients.
Left ventricular performance
The four primary determinants of LV performance are preload (LVend-diastolic volume), afterload (maximal LV wall stress), heart rate,and contractility. Ppao is often used as a substitute for LV end-diastolicvolume when constructing Starling curves (ie, relationship between chang-ing LV preload and ejection phase indices). Usually one plots Ppao versusSWlv stroke work (SVlv � developed pressure). Using this construct, pa-tients who have heart failure can be divided into four groups, dependingon their Ppao (O or !18 mm Hg) and cardiac index values (O or!2.2 l/min/m2) [27]. Those patients who have low cardiac indices andhigh Ppao are presumed to have primary heart failure, and a low cardiacoutput and low Ppao, on the other hand, reflect hypovolemia. Those whohave high cardiac indices and high Ppao are presumed to be volume over-loaded, and having high cardiac output and low Ppao reflects increasedsympathetic tone. Although this maybe a useful construct for determiningdiagnosis, treatment, and prognosis of patients who have acute coronarysyndrome, it poorly predicts cardiovascular status in other patient groups.As described above, however, if LV end-diastolic volume and Ppao do nottrend together in response to fluid loading or inotropic drug infusion, theninferences about LV contractility based on this Ppao/SWlv relation may beincorrect. This is not a minor point. Volume loading may induce acute RVdilation, markedly reducing LV diastolic compliance, such that Ppao willincrease as SWlv decreases; however, the relationship between LV end-di-astolic volume and swLV need not have changed at all. Similarly, inotro-pic drugs such as dobutamine may reduce biventricular volumes bydecreasing venous return, decreasing LV diastolic compliance, even if theheart is not responsive to inotropic therapy. Thus, the same limitationson the use of Ppao in assessing LV preload must be considered when usingit to assess LV performance.
1447BEDSIDE HEMODYNAMIC MONITORING
Measuring cardiac output
Cardiac output can be estimated by many techniques, including invasivehemodynamic monitoring. Pulmonary blood flow using a balloon floata-tion PAC equipped with a distal thermistor, and transpulmonary bloodflow using an arterial thermistor, both with a central venous cold volumeinjection, can be used. Similarly, minimally invasive echo Doppler tech-niques can measure blood flow at the aortic value and descending aorticflow using esophageal Doppler monitoring. Cardiac output can be mea-sured intermittently by bolus cold injection, or continuously by cold infu-sion. The advantage of the continuous cardiac output technique and thetranspulmonary technique is that neither is influenced greatly by the ven-tilation-induced swings in pulmonary blood flow. Measurement of cardiacoutput by intermittent pulmonary artery flow measures using bolus coldindicator and monitoring the thermal decay curve is the most commonmethod to measure cardiac output at the bedside; however, such intermit-tent measures will show profound ventilatory cycle-specific patterns [30].By making numerous measures at random with the ventilatory cycle andthen averaging all measures with proper thermal decay profiles, regardlessof their values, one can derive an accurate measure of pulmonary bloodflow [31].
Recently, a renewed interest in pulse contour analysis to estimate SVlv,and therefore cardiac output, from the arterial pressure profile over ejectionhas acquired its own set of supporters [32]. Arterial pressure and arterialpulse pressure are a function of rate of LV ejection, SVlv and the resistance,compliance, and inertance characteristics of the arterial tree and blood. Ifthe arterial components of tone remain constant, then changes in pulse pres-sure most proportionally reflect changes in SVlv. Thus, it is not surprisingthat aortic flow variation parallels arterial pulse pressure variation [33],and pulse contour-derived estimates of stroke volume variation can beused to determine preload responsiveness [34,35]. Caution must be appliedto using the pulse contour method, because it has not been validated in sub-jects who have rapidly changing arterial tone, as often occurs in subjectswho have hemodynamic instability. Furthermore, it requires the applicationof abnormally large tidal volumes [34–36]. Thus, at the present time, thepulse contour-derived stroke volume variation technique represents a poten-tially great but still unproven clinical decision tool [37].
Currently three commercial devices that use pulse contour analysis of anarterial line waveform to obtain continuous cardiac output are approved forclinical use: PiCCO (Pulsion Medical Systems, Munich, Germany), LIDCO(Cambridge, United Kingdom), and Vigileo monitor (Edwards Lifesciences,Irvine, California) systems. Their benefit of being minimally invasive andthe correlation shown with ‘‘standard’’ methods of measuring cardiac out-put in some clinical and experimental studies make them promising toolsfor hemodynamic monitoring [38,39].
1448 POLANCO & PINSKY
Mixed venous oxygen saturation
Measuring venous oxygen saturation
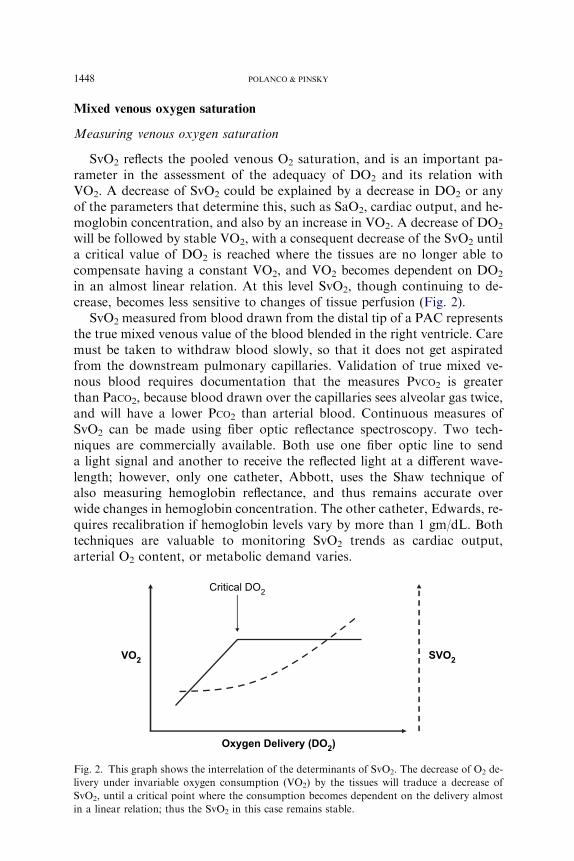
SvO2 reflects the pooled venous O2 saturation, and is an important pa-rameter in the assessment of the adequacy of DO2 and its relation withVO2. A decrease of SvO2 could be explained by a decrease in DO2 or anyof the parameters that determine this, such as SaO2, cardiac output, and he-moglobin concentration, and also by an increase in VO2. A decrease of DO2
will be followed by stable VO2, with a consequent decrease of the SvO2 untila critical value of DO2 is reached where the tissues are no longer able tocompensate having a constant VO2, and VO2 becomes dependent on DO2
in an almost linear relation. At this level SvO2, though continuing to de-crease, becomes less sensitive to changes of tissue perfusion (Fig. 2).
SvO2 measured from blood drawn from the distal tip of a PAC representsthe true mixed venous value of the blood blended in the right ventricle. Caremust be taken to withdraw blood slowly, so that it does not get aspiratedfrom the downstream pulmonary capillaries. Validation of true mixed ve-nous blood requires documentation that the measures PvCO2 is greaterthan PaCO2, because blood drawn over the capillaries sees alveolar gas twice,and will have a lower PCO2 than arterial blood. Continuous measures ofSvO2 can be made using fiber optic reflectance spectroscopy. Two tech-niques are commercially available. Both use one fiber optic line to senda light signal and another to receive the reflected light at a different wave-length; however, only one catheter, Abbott, uses the Shaw technique ofalso measuring hemoglobin reflectance, and thus remains accurate overwide changes in hemoglobin concentration. The other catheter, Edwards, re-quires recalibration if hemoglobin levels vary by more than 1 gm/dL. Bothtechniques are valuable to monitoring SvO2 trends as cardiac output,arterial O2 content, or metabolic demand varies.
VO2
Oxygen Delivery (DO2)
SVO2
Critical DO2
Fig. 2. This graph shows the interrelation of the determinants of SvO2. The decrease of O2 de-
livery under invariable oxygen consumption (VO2) by the tissues will traduce a decrease of
SvO2, until a critical point where the consumption becomes dependent on the delivery almost
in a linear relation; thus the SvO2 in this case remains stable.
1449BEDSIDE HEMODYNAMIC MONITORING
Superior vena caval oxygen saturation
Recent interest in superior vena caval O2 saturation (ScvO2) has evolvedover the past years with the positive results of the Rivers and colleaguesstudy [40], which demonstrated that in patients who had septic shock or se-vere sepsis admitted in the emergency department, an early and aggressiveresuscitation guided by ScvO2, CVP, and MAP reduced 28-day mortalityfrom 46.5% to 30.5%. Measures of SvO2, however, remain the gold stan-dard to reflect minimal O2 delivery. This is because although SvcO2 andSvO2 co-vary and seem to follow a parallel tracking, their differences can ex-ceed 5%. Furthermore, during dynamic changes in cardiac output, such asoccur in shock states, ScvO2 may exceed SvO2 by 5% or more, or be lessthan SvO2 by 5% or more [41]. Thus, using a defined threshold value forScvO2 to identify when to start or stop resuscitation in a critically ill patientis fundamentally flawed. Still, a low ScvO2 (!65%) is invariably associatedwith a low SvO2 (!72%), making it less sensitive but still clinically useful atlower threshold values.
The meaning of cardiac output and venous oxygen saturation as endpoints of resuscitation
Although one may potentially measure cardiac output accurately at thebedside, there is no such thing as a normal cardiac output. Cardiac outputis either adequate for the needs of the body or it is not. For example, thesame cardiac output and DO2 that is adequate at rest may be grossly inad-equate and not associated with life during periods of increased metabolic de-mand. Because the primary goal of the cardiorespiratory system is tocontinuously maintain adequate amounts of O2 (DO2) to meet the metabolicdemands of the tissues (VO2), neither cardiac output nor mean arterial pres-sure are sensitive or specific measures of adequacy of cardiovascular func-tion. Clearly, the best measures of adequacy of blood flow are thecontinued maintenance of normal end-organ function without evidence ofexcessive anaerobic metabolism. Normal urine output, gut activity, menta-tion, normal blood lactate levels, and spontaneous voluntary muscular ac-tivities reflect the most easily validated measures of body health [42].Regrettably, many patients present with coexistent organ-system dysfunc-tion, either pre-existent or caused by the insult. Furthermore, organ func-tion cannot be monitored quickly enough to allow for titration of care.Thus, one cannot rely on these absolute markers to direct therapy [43]. Per-haps a more functional marker of adequacy of DO2 to the tissues is SvO2
[44]. Although values of SvO2 greater than 70% do not ensure that all vas-cular beds are adequately perfused, SvO2 values less than 60% are associ-ated with oxidative impairment of tissues with a high metabolic rate, andvalues less than 50% are uniformly associated with evidence of anaerobicmetabolism in some vascular beds [45]. Thus, as a negative predictivemarker, preventing SvO2 from decreasing below 50% and keeping it above
1450 POLANCO & PINSKY
70% by fluid resuscitation, sedation, and ancillary support (eg, mechanicalventilation to reduce the work cost of breathing) all may improve O2 deliv-ery to metabolically active tissues.
If metabolic demand changes, cardiac output should co-vary with it [46].Because this puts an added variable on the analysis of hemodynamic stabil-ity, a common approach in the cardiovascular management of the criticallyill patient is to minimize the extraneous metabolic demands of the patientduring intervals in which therapeutic interventions and diagnostic processesare being performed, so as to maintain stable baseline O2 consumption forcomparison. Thus, minimizing the work cost of breathing by using mechan-ical ventilation and reducing sympathetic responses by infusion of sedativeagents reflect stabilizing processes that allow for accurate hemodynamic as-sessment. This is often more difficult to achieve than imagined [31]. Evena sedated and mechanically ventilated subject can be expending much effortassisting or resisting the ventilator-derived breaths. Muscular activities, suchas moving in bed or being turned, ‘‘fighting the ventilator,’’ and breathingspontaneously can easily double resting VO2 [47]. O2 supply and demandmust co-vary as a normal and expected aspect of homeostasis under almostall conditions. In cardiovascular insufficiency states, such as cardiogenicshock or hypovolemic shock, total cardiac output is often limited and can-not increase enough in response to increasing metabolic demand to matchthe demand. Under these severe conditions VO2 tends to remain constantby varying the extraction of O2 in the tissues rather than by varying totalblood flow. Thus, measures of SvO2 can be used to identify patients in cir-culatory shock. Furthermore, resuscitation efforts that increase SvO2 togreater than 70% should be associated with improved end-organ function.
The controversy of the pulmonary artery catheter
One would think that the clinical use of the PAC in the management of thehemodynamically unstable patient would be invaluable; however, that utilityhas not been documented. Although currently there are no proven indicationsfor the insertion of a PAC, there are potential indications (not yet proven) forits use based on the need to assess cardiac function, global DO2, intravascularvolume status, and pulmonary pressures, among others summarized in Box 4.
The controversy over the use of the PAC in the management of criticallyill patients continues to rage. Proponents of its use cite a physiologic ratio-nale to diagnosis and titration of complex treatments that may otherwise bedetrimental. Opponents of its use cite the almost total lack of data showingthat its use in the management of critically ill patients improves outcome.Still, one truth remains: no catheter will improve outcome unless coupledto a treatment that itself improves outcome.
Despite some exciting initial uncontrolled reports of markedly improvedoutcome in high-risk surgery patients [48,49], further well-controlled studiesin both high-risk surgical patients [50] and trauma patients [51,52] failed to
1451BEDSIDE HEMODYNAMIC MONITORING
document any improved survival when patients were treated based on pul-monary arterial catheter-derived data. In fact, the patients resuscitatedaggressively to increase O2 delivery into these survivor levels suffereda much higher mortality rate than did the control group treated conserva-tively [3]. Interestingly, as mentioned above, using only arterial pressureand ScvO2, but with a defined physiology-based treatment algorithm, Riversand coworkers [40] demonstrated a markedly improved survival in septicshock patients without the need of a PAC. On the other hand, a recent sta-tistical analysis of the National Trauma Data Bank that included over50,000 patients [53] showed for the first time a decrease in mortality in a se-lective group of trauma patients (severely injured, elderly, who arrived inshock) with the use of PAC.
Because of this unclear benefit on the use of PAC, the fact that it is aninvasive monitoring procedure with potential serious complications acquiresa major relevance when deciding about the risk-benefit of its use. Two recent
Box 4. Probable indications for pulmonary arterialcatheterization
Data necessary for diagnosisDistinguishing primary (noncardiogenic) from secondary
(cardiogenic) pulmonary edemaDiagnosis of acute ventricular septal defectDiagnosis of acute cardiac tamponade
Data necessary for managementVasoactive drug therapy for cardiogenic shock with or without
acute mitral regurgitationCardiac dysfunction with ischemia requiring intra-aortic balloon
counter-pulsationBalancing fluid and vasoactive therapy in acute lung injury states
(acute respiratory distress syndrome [ARDS])Assessing pulmonary pathology and response to ventilator
therapy in acute lung injury statesTo assess global cardiac output and systemic oxygen deliveryTo direct vasodilator therapy in the management of pulmonary
hypertension associated with acute cor pulmonaleTo continuously monitor mixed venous oxygen saturation as an
estimate of the adequacy of oxygen delivery to oxygenrequirements in hemodynamically unstable patients
Adapted from Bellomo R, Pinsky MR. Invasive monitoring. In: Tinker J, Browne D,Sibbald W, editors. Critical care: Standards, Audit and Ethics. London: Hodder-Arnold, 1996; with permission.
1452 POLANCO & PINSKY
large prospective multicenter studies showed incidence of 5% and 10% ofcomplications [54,55]. The most frequent complications described in theseseries were hematomas, arterial puncture, arrhythmias, and PAC-related in-fections, although a long list of complications has been described, as listed inBox 5. No deaths attributable to PAC were found on this series, but otherauthors had previously reported mortality generally due to right heart andpulmonary artery perforation [56,57].
Beyond the controversial use of the PAC, two recent randomized clinicaltrials using active protocols of hemodynamic monitoring and algorithms ofgoal-directed therapy guided by esophageal Doppler flowmetry [58] andpulse contour analysis for cardiac output [59] in postoperative surgical pa-tients showed a decreased duration of hospital stay and morbidity. Thusthe literature suggests that the generalized use of hemodynamic monitoringand aggressive goal-directed therapy could improve outcome, but that onedoes not need to use a PAC to achieve these goals. These arguments, how-ever, miss the point that the utility of hemodynamic monitoring is relativedno monitoring device, no matter how accurate, safe and simple to use, willimprove outcome unless coupled to a treatment that itself improves out-come. Thus, the question should not be, ‘‘Does the PAC improve outcome?’’but rather, ‘‘Do treatment protocols that require information only attain-able from pulmonary arterial catheterization improve outcome?’’ Further-more, the treatment protocol itself should also be shown to improveoutcome, because otherwise if the trial shows no difference in outcomewith or without a PAC, the results may well reflect the fact that there wasno benefit for the protocol in either arm of the study.
Summary
All surgical patients require monitoring to assess cardiovascular stability,and sometimes may benefit from optimization of their hemodynamic status.Therefore, all surgeons require a basic understanding of physiological
Box 5. Complications of the pulmonary artery catheter
ArrhythmiaComplete heart blockCatheter malpositioningExtracardiacCatheter knottingCatheter fragmentation and meteorismPulmonary infarctionPulmonary artery ruptureThrombosisVascular infection
1453BEDSIDE HEMODYNAMIC MONITORING
underpinnings of hemodynamic monitoring. The physiological rationale isstill the primary level of defense for monitoring critically ill patients.
Arterial catheterization to monitor arterial pressure is a safe procedurewith a low complication rate; however, it should be used only when clear in-dications exist. There is no evidence that achieving pressures over 65 mm Hgincreases organ perfusion or favors outcome. The analysis of pulse pressurevariation is a useful method to assess preload responsiveness and a potentialtool for resuscitation.
CVP has been wrongly used as a parameter of goal for replacement of in-travascular volume in shock patients. Volume loading in patients who haveCVP greater than 12 mmHg is unlikely to increase cardiac output, and at-tempts to normalize CVP in early goal-directed therapy during resuscitationhave no proven benefit.
The use of PAC provides direct access to several physiological parame-ters, both as raw data and derived measurements (CO, SvO2, DO2). At pres-ent, targeting specific levels of DO2 has proven effective only in high-risksurgery patients in the perioperative time. Ppao is often used as a bedsideassessment of pulmonary edema, pulmonary vasomotor tone, intravascularvolume status, and LV preload and performance. Several publications haveexplored the potential indications and benefits of the PAC to direct goaltherapies. Beyond this controversy, there is a trend toward less invasivemethods of hemodynamic monitoring, and current data support protocolsof monitoring and goal-directed therapy that could improve outcome inselected group of surgical patients.
References
[1] Bellomo R, Pinsky MR. Invasive monitoring. In: Tinker J, Browne D, Sibbald W, editors.
Critical caredstandards, audit and ethics. London: Arnold Publishing Co., 2006. p. 82–104.
[2] Ledoux D, Astiz ME, Carpati CM, et al. Effects of perfusion pressure on tissue perfusion in
septic shock. Crit Care Med 2000;28(8):2729–32.
[3] Hayes MA, Timmins AC, Yau EH, et al. Elevation of systemic oxygen delivery in the treat-
ment of critically ill patients. N Engl J Med 1994;330(24):1717–22.
[4] Bickell WH, Wall MJ Jr, Pepe PE, et al. Immediate versus delayed fluid resuscitation for
hypotensive patients with penetrating torso injuries. N Engl J Med 1994;331(17):1105–9.
[5] CaponeAC, Safar P, StezoskiW, et al. Improved outcome with fluid restriction in treatment
of uncontrolled hemorrhagic shock. J Am Coll Surg 1995;180(1):49–56.
[6] Kowalenko T, Stern S, Dronen S, et al. Improved outcome with hypotensive resuscitation of
uncontrolled hemorrhagic shock in a swine model. J Trauma 1992;33(3):349–53.
[7] Rebuck AS, Read J. Assessment and management of severe asthma. Am J Med 1971;51(6):
788–98.
[8] Michard F, Boussat S, Chemla D, et al. Relation between respiratory changes in arterial
pulse pressure and fluid responsiveness in septic patients with acute circulatory failure.
Am J Respir Crit Care Med 2000;162(1):134–8.
[9] Monnet X, RienzoM, OsmanD, et al. Passive leg raising predicts fluid responsiveness in the
critically ill. Crit Care Med 2006;34(5):1402–7.
[10] Gunn SR, PinskyMR. Implications of arterial pressure variation in patients in the intensive
care unit. Curr Opin Crit Care 2001;7(3):212–7.
1454 POLANCO & PINSKY
[11] Michard F, Teboul JL. Predicting fluid responsiveness in ICU patients: a critical analysis of
the evidence. Chest 2002;121(6):2000–8.
[12] Scheer B, Perel A, Pfeiffer UJ. Clinical review: complications and risk factors of peripheral
arterial catheters used for haemodynamic monitoring in anaesthesia and intensive care
medicine. Crit Care 2002;6(3):199–204.
[13] Michard F, Alaya S, Zarka V, et al. Global end-diastolic volume as an indicator of cardiac
preload in patients with septic shock. Chest 2003;124(5):1900–8.
[14] Godje O, Peyerl M, Seebauer T, et al. Central venous pressure, pulmonary capillary wedge
pressure and intrathoracic blood volumes as preload indicators in cardiac surgery patients.
Eur J Cardiothorac Surg 1998;13(5):533–9.
[15] Buhre W, Weyland A, Schorn B, et al. Changes in central venous pressure and pulmonary
capillary wedge pressure do not indicate changes in right and left heart volume in patients
undergoing coronary artery bypass surgery. Eur J Anaesthesiol 1999;16(1):11–7.
[16] Magder S, Georgiadis G, Tuck C. Respiratory variations in right atrial pressure predict-
response to fluid challenge. J Crit Care 2004;7:76–85.
[17] Magder S. How to use central venous pressure measurements. Curr Opin Crit Care 2005;
11(3):264–70.
[18] VennR, SteeleA,RichardsonP, et al. Randomized controlled trial to investigate influence of
the fluid challenge on duration of hospital stay and perioperative morbidity in patients with
hip fractures. Br J Anaesth 2002;88(1):65–71.
[19] Thomsen HS, Lokkegaard H, Munck O. Influence of normal central venous pressure on
onset of function in renal allografts. Scand J Urol Nephrol 1987;21(2):143–5.
[20] Shoemaker WC, Kram HB, Appel PL, et al. The efficacy of central venous and pulmonary
artery catheters and therapy based upon them in reducing mortality and morbidity. Arch
Surg 1990;125(10):1332–7.
[21] Sharkey SW. Beyond the wedge: clinical physiology and the Swan-Ganz catheter. Am JMed
1987;83(1):111–22.
[22] Swan HJ, GanzW, Forrester J, et al. Catheterization of the heart in man with use of a flow-
directed balloon-tipped catheter. N Engl J Med 1970;283(9):447–51.
[23] Hoyt JD, Leatherman JW. Interpretation of the pulmonary artery occlusion pressure in
mechanically ventilated patients with large respiratory excursions in intrathoracic pressure.
Intensive Care Med 1997;23(11):1125–31.
[24] Pinsky M, Vincent JL, De Smet JM. Estimating left ventricular filling pressure during
positive end-expiratory pressure in humans. Am Rev Respir Dis 1991;143(1):25–31.
[25] Pinsky MR. Clinical significance of pulmonary artery occlusion pressure. Intensive Care
Med 2003;29(2):175–8.
[26] Abraham AS, Cole RB, Green ID, et al. Factors contributing to the reversible pulmonary
hypertension of patients with acute respiratory failure studies by serial observations during
recovery. Circ Res 1969;24(1):51–60.
[27] Forrester JS, Diamond G, Chatterjee K, et al. Medical therapy of acute myocardial infarc-
tion by application of hemodynamic subsets (first of two parts). N Engl JMed 1976;295(24):
1356–62.
[28] Raper R, Sibbald WJ. Misled by the wedge? The Swan-Ganz catheter and left ventricular
preload. Chest 1986;89(3):427–34.
[29] Kumar A, Anel R, Bunnell E, et al. Pulmonary artery occlusion pressure and central venous
pressure fail to predict ventricular filling volume, cardiac performance, or the response to
volume infusion in normal subjects. Crit Care Med 2004;32(3):691–9.
[30] Jansen JR, Bogaard JM, Versprille A. Extrapolation of thermodilution curves obtained
during a pause in artificial ventilation. J Appl Physiol 1987;63(4):1551–7.
[31] Synder JV, Powner DJ. Effects of mechanical ventilation on the measurement of cardiac
output by thermodilution. Crit Care Med 1982;10(10):677–82.
[32] Wesseling K, Wit BD, Weber J, et al. A simple device for the continuous measurement of
cardiac output. Adv Cardiovasc Physiol 1983;(5):16–52.

1455BEDSIDE HEMODYNAMIC MONITORING
[33] Feissel M,Michard F,Mangin I, et al. Respiratory changes in aortic blood velocity as an in-
dicator of fluid responsiveness in ventilated patients with septic shock. Chest 2001;119(3):
867–73.
[34] Reuter DA, Felbinger TW, Schmidt C, et al. Stroke volume variations for assessment of car-
diac responsiveness to volume loading in mechanically ventilated patients after cardiac sur-
gery. Intensive Care Med 2002;28(4):392–8.
[35] Reuter DA, Felbinger TW, Kilger E, et al. Optimizing fluid therapy in mechanically venti-
lated patients after cardiac surgery by on-line monitoring of left ventricular stroke volume
variations. Comparison with aortic systolic pressure variations. Br J Anaesth 2002;88(1):
124–6.
[36] Berkenstadt H, Margalit N, Hadani M, et al. Stroke volume variation as a predictor of fluid
responsiveness in patients undergoing brain surgery. Anesth Analg 2001;92(4):984–9.
[37] Pinsky MR, Payen D. Functional hemodynamic monitoring. Crit Care 2005;9(6):566–72.
[38] LintonR,BandD,O’BrienT, et al. Lithiumdilution cardiac outputmeasurement: a compar-
ison with thermodilution. Crit Care Med 1997;25(11):1796–800.
[39] Kurita T, Morita K, Kato S, et al. Comparison of the accuracy of the lithium dilution tech-
nique with the thermodilution technique for measurement of cardiac output. Br J Anaesth
1997;79(6):770–5.
[40] Rivers E, Nguyen B, Havstad S, et al. Early goal-directed therapy in the treatment of severe
sepsis and septic shock. N Engl J Med 2001;345(19):1368–77.
[41] Reinhart K, Kuhn HJ, Hartog C, et al. Continuous central venous and pulmonary
artery oxygen saturation monitoring in the critically ill. Intensive Care Med 2004;30(8):
1572–8.
[42] Marik PE.Gastric intramucosal pH.A better predictor ofmultiorgan dysfunction syndrome
and death than oxygen-derived variables in patients with sepsis. Chest 1993;104(1):225–9.
[43] Pinsky MR. Beyond global oxygen supply-demand relations: in search of measures of
dysoxia. Intensive Care Med 1994;20(1):1–3.
[44] Kandel G, Aberman A. Mixed venous oxygen saturation. Its role in the assessment of the
critically ill patient. Arch Intern Med 1983;143(7):1400–2.
[45] MillerMJ, CookW,Mithoefer J. Limitations of the use of mixed venous pO2 as an indicator
of tissue hypoxia. Clin Res 1979;(27):401A.
[46] Pinsky MR. The meaning of cardiac output. Intensive Care Med 1990;16(7):415–7.
[47] Weissman C, Kemper M, DamaskMC, et al. Effect of routine intensive care interactions on
metabolic rate. Chest 1984;86(6):815–8.
[48] Tuchschmidt J, Fried J, Astiz M, et al. Elevation of cardiac output and oxygen delivery
improves outcome in septic shock. Chest 1992;102(1):216–20.
[49] Boyd O, Grounds RM, Bennett ED. A randomized clinical trial of the effect of deliberate
perioperative increase of oxygen delivery on mortality in high-risk surgical patients.
JAMA 1993;270(22):2699–707.
[50] Sandham JD, Hull RD, Brant RF, et al. A randomized, controlled trial of the use of pulmo-
nary-artery catheters in high-risk surgical patients. N Engl J Med 2003;348(1):5–14.
[51] McKinley BA, Kozar RA, Cocanour CS, et al. Normal versus supranormal oxygen de-
livery goals in shock resuscitation: the response is the same. J Trauma 2002;53(5):
825–32.
[52] VelmahosGC,DemetriadesD, ShoemakerWC, et al. Endpoints of resuscitation of critically
injured patients: normal or supranormal? A prospective randomized trial. Ann Surg 2000;
232(3):409–18.
[53] Friese RS, Shafi S, Gentilello LM. Pulmonary artery catheter use is associated with reduced
mortality in severely injured patients: a National Trauma Data Bank analysis of 53,312
patients. Crit Care Med 2006;34:1597–1601.
[54] Binanay C, Califf RM, Hasselblad V, et al. Evaluation study of congestive heart failure and
pulmonary artery catheterization effectiveness: the ESCAPE trial. JAMA 2005;294(13):
1625–33.

1456 POLANCO & PINSKY
[55] Harvey S, Harrison DA, Singer M, et al. Assessment of the clinical effectiveness of pulmo-
nary artery catheters in management of patients in intensive care (PAC-Man): a randomised
controlled trial. Lancet 2005;366(9484):472–7.
[56] DucatmanBS,McMichan JC, EdwardsWD.Catheter-induced lesions of the right side of the
heart. A one-year prospective study of 141 autopsies. JAMA 1985;253(6):791–5.
[57] Kearney TJ, Shabot MM. Pulmonary artery rupture associated with the Swan-Ganz cathe-
ter. Chest 1995;108(5):1349–52.
[58] McKendryM,McGloinH, Saberi D, et al. Randomised controlled trial assessing the impact
of a nurse delivered, flow monitored protocol for optimisation of circulatory status after
cardiac surgery. BMJ 2004;329(7460):258.
[59] Pearse R, Dawson D, Fawcett J, et al. Early goal-directed therapy after major surgery re-
duces complications and duration of hospital stay. A randomised, controlled trial
[ISRCTN38797445]. Crit Care 2005;9(6):R687–93.