Embed Size (px)
Citation preview

©Copyright2015VivitWorldwide©Copyright2015VivitWorldwide
“Be Proactive With Ops Analytics - Leverage your Splunk Investment” October 8, 2015

©Copyright2015VivitWorldwide
Brought to you by

©Copyright2015VivitWorldwide
Hosted by
MarkLairdBSMSIGLeader

©Copyright2015VivitWorldwide
Today’s Speakers
Clay Roach CTO
J9 Technologies
JonathanSampsonPrincipalConsultantJ9Technologies

©Copyright2015VivitWorldwide
Housekeeping
• This “LIVE” session is being recorded Recordings are available to all Vivit members
• Session Q&A: Please type questions in the Questions Pane

©Copyright2015VivitWorldwide
Webinar Control Panel
QuesIons
ToggleViewWindowbetweenFullscreen/windowmode.
Be Proactive With HP Ops Analytics - Leverage your Investment
www.J9Tech.com © 2015 J9 Technologies, Inc.
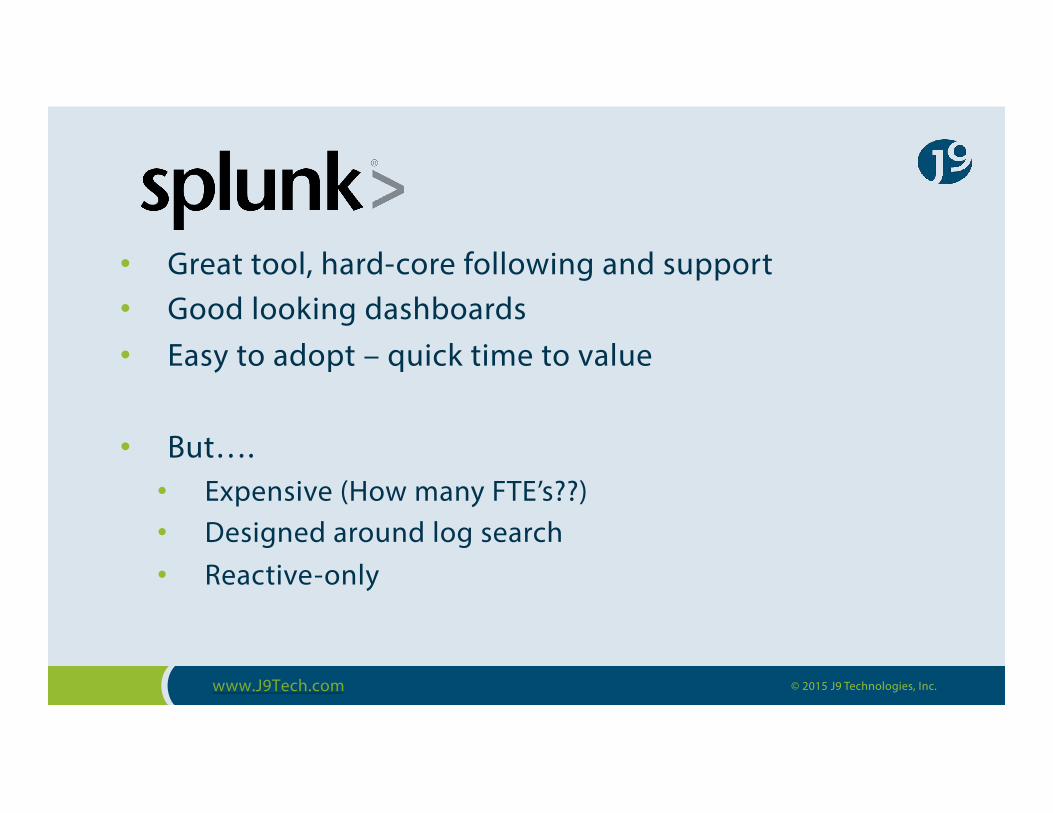
• Great tool, hard-core following and support • Good looking dashboards • Easy to adopt – quick time to value
• But…. • Expensive (How many FTE’s??) • Designed around log search • Reactive-only

© Copyright 2014 Hewlett-Packard Development Company, L.P. The information contained herein is subject to change without notice. 9
Log Searching Isn’t Enough… HP Ops Analytics Others
Log searches ü ü Statistics ü ü
Scalable data store
ü X Log analysis Automated X
Predictive analytics Automated X Anomaly detection Automated X
© Copyright 2015 Hewlett-Packard Development Company, L.P. The information contained herein is subject to change without notice.
© Copyright 2014 Hewlett-Packard Development Company, L.P. The information contained herein is subject to change without notice. 10
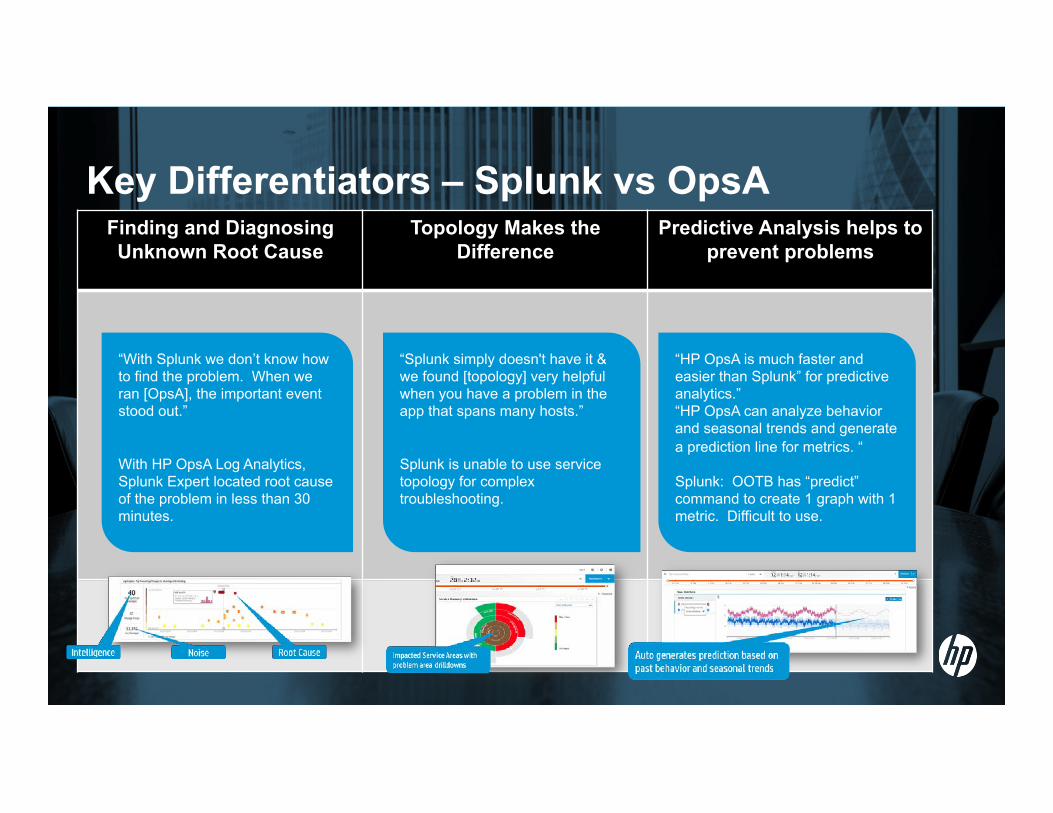
Key Differentiators – Splunk vs OpsA Finding and Diagnosing Unknown Root Cause
Topology Makes the Difference
Predictive Analysis helps to prevent problems
“With Splunk we don’t know how to find the problem. When we ran [OpsA], the important event stood out.” With HP OpsA Log Analytics, Splunk Expert located root cause of the problem in less than 30 minutes.
“Splunk simply doesn't have it & we found [topology] very helpful when you have a problem in the app that spans many hosts.” Splunk is unable to use service topology for complex troubleshooting.
“HP OpsA is much faster and easier than Splunk” for predictive analytics.” “HP OpsA can analyze behavior and seasonal trends and generate a prediction line for metrics. “ Splunk: OOTB has “predict” command to create 1 graph with 1 metric. Difficult to use.
www.J9Tech.com © 2015 J9 Technologies, Inc.
Poll Question • Regarding Splunk, what are the key challenges/
limitations that you are experiencing? • Cost• LogAnalyIcs• Dashboards• PredicIveanalyIcs,metriccorrelaIon&anomalyalerIng• NotusingSplunktoday
© Copyright 2014 Hewlett-Packard Development Company, L.P. The information contained herein is subject to change without notice. 12
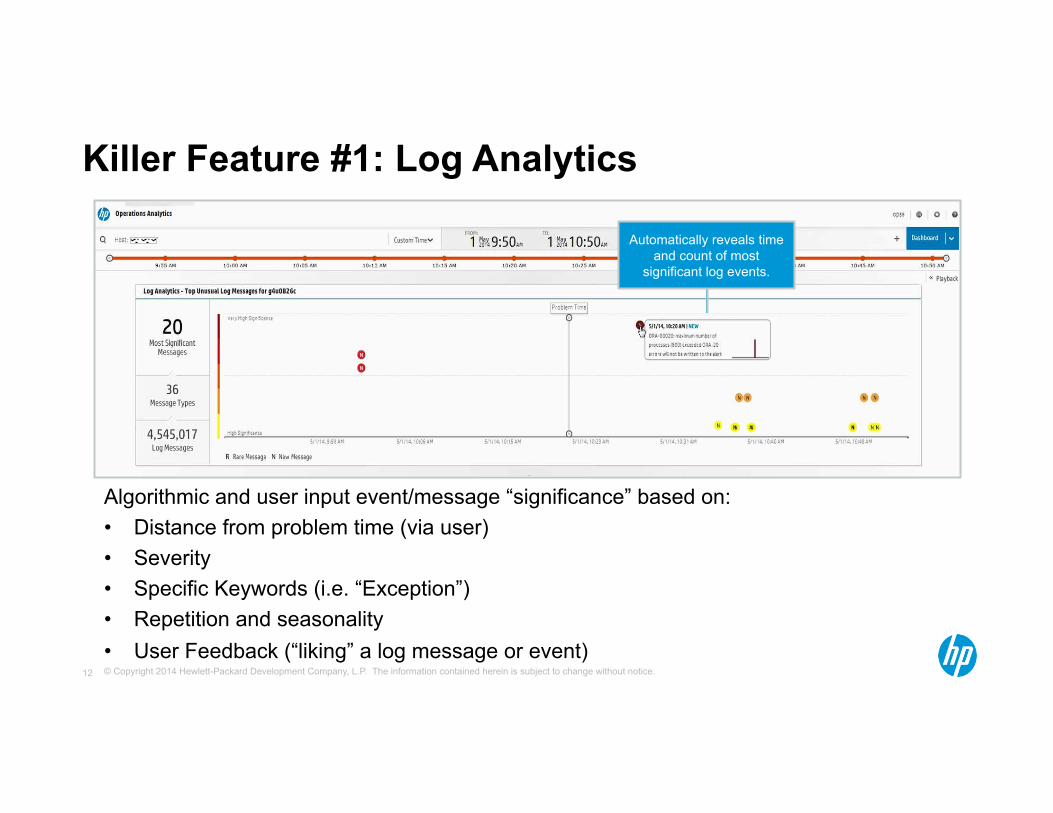
Killer Feature #1: Log Analytics
Automatically reveals time and count of most
significant log events.
Algorithmic and user input event/message “significance” based on: • Distance from problem time (via user) • Severity • Specific Keywords (i.e. “Exception”) • Repetition and seasonality • User Feedback (“liking” a log message or event)
© Copyright 2014 Hewlett-Packard Development Company, L.P. The information contained herein is subject to change without notice. 13
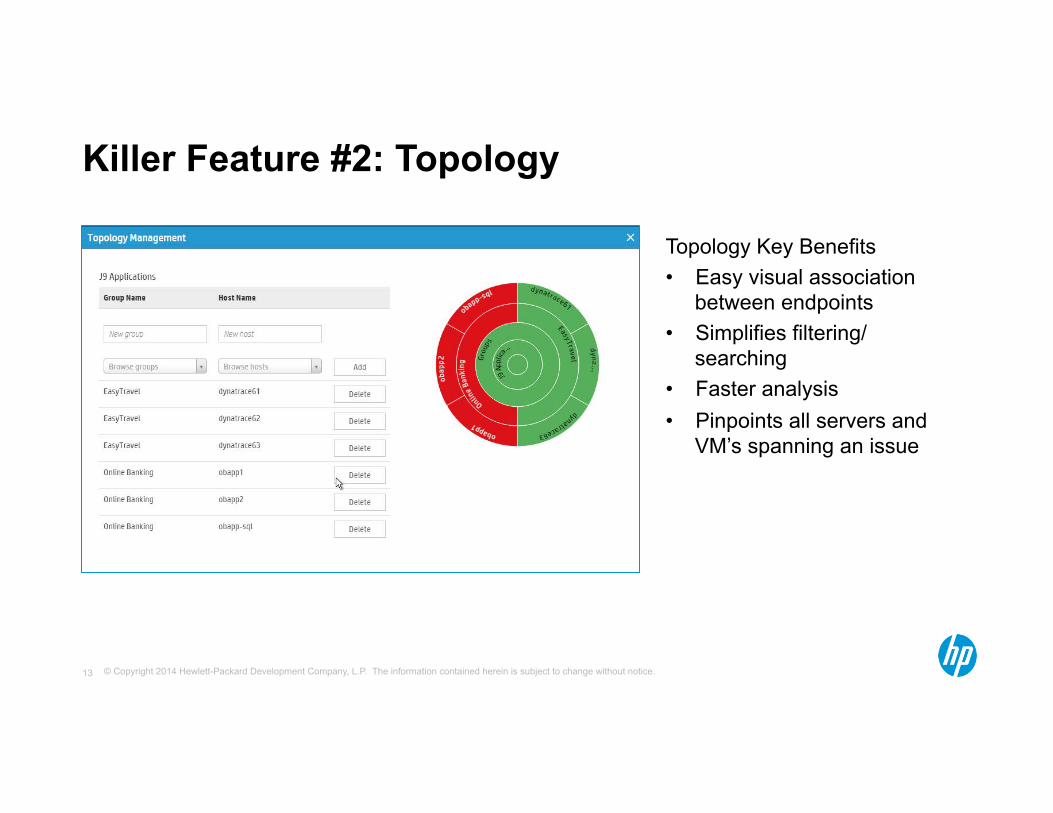
Killer Feature #2: Topology
Topology Key Benefits • Easy visual association
between endpoints • Simplifies filtering/
searching • Faster analysis • Pinpoints all servers and
VM’s spanning an issue

© Copyright 2014 Hewlett-Packard Development Company, L.P. The information contained herein is subject to change without notice. 14
Killer Feature #3: Predictive Analytics
• Automatically adjusts for Seasonality • Auto-baselining, no manual steps • Include/combine multiple metrics together
© Copyright 2014 Hewlett-Packard Development Company, L.P. The information contained herein is subject to change without notice. 15
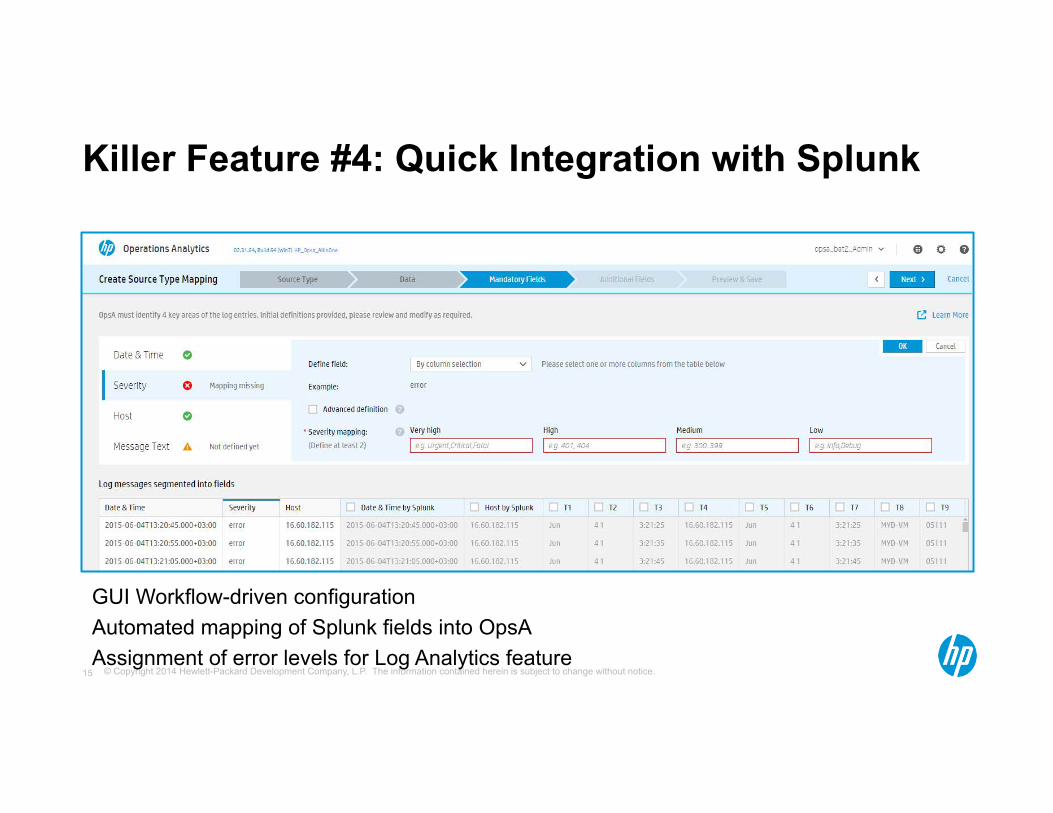
Killer Feature #4: Quick Integration with Splunk
GUI Workflow-driven configuration Automated mapping of Splunk fields into OpsA Assignment of error levels for Log Analytics feature
© Copyright 2014 Hewlett-Packard Development Company, L.P. The information contained herein is subject to change without notice. 16
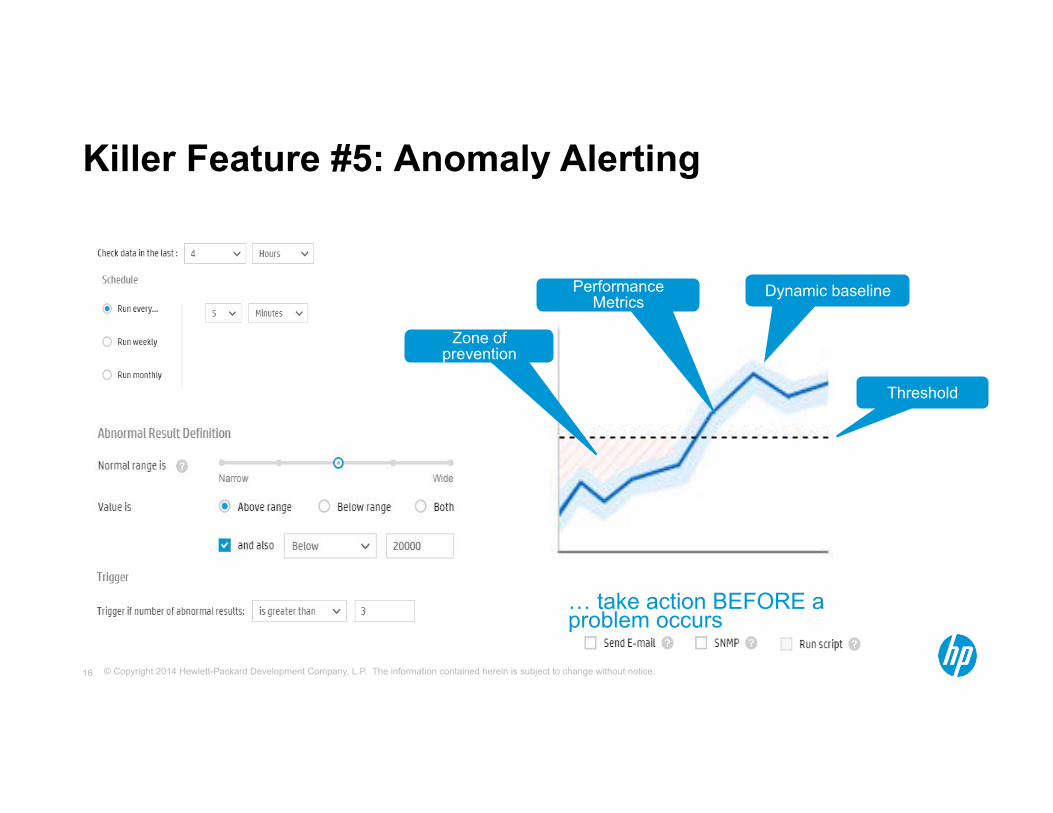
… take action BEFORE a problem occurs
Performance Metrics
Dynamic baseline
Threshold
Zone of prevention
Killer Feature #5: Anomaly Alerting
© Copyright 2014 Hewlett-Packard Development Company, L.P. The information contained herein is subject to change without notice. 17
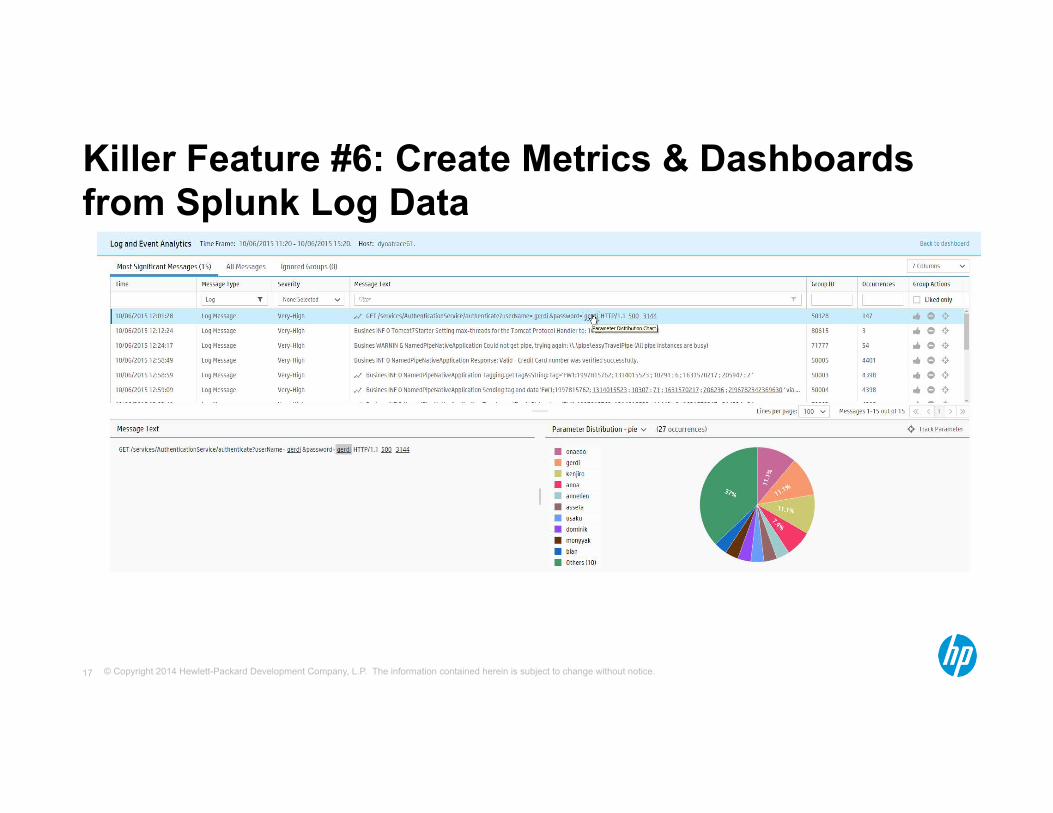
Killer Feature #6: Create Metrics & Dashboards from Splunk Log Data
www.J9Tech.com © 2015 J9 Technologies, Inc.
Poll Question • Have you installed, evaluated or already using Ops
Analytics? (Yes/No/In Future Plans)
www.J9Tech.com © 2015 J9 Technologies, Inc.
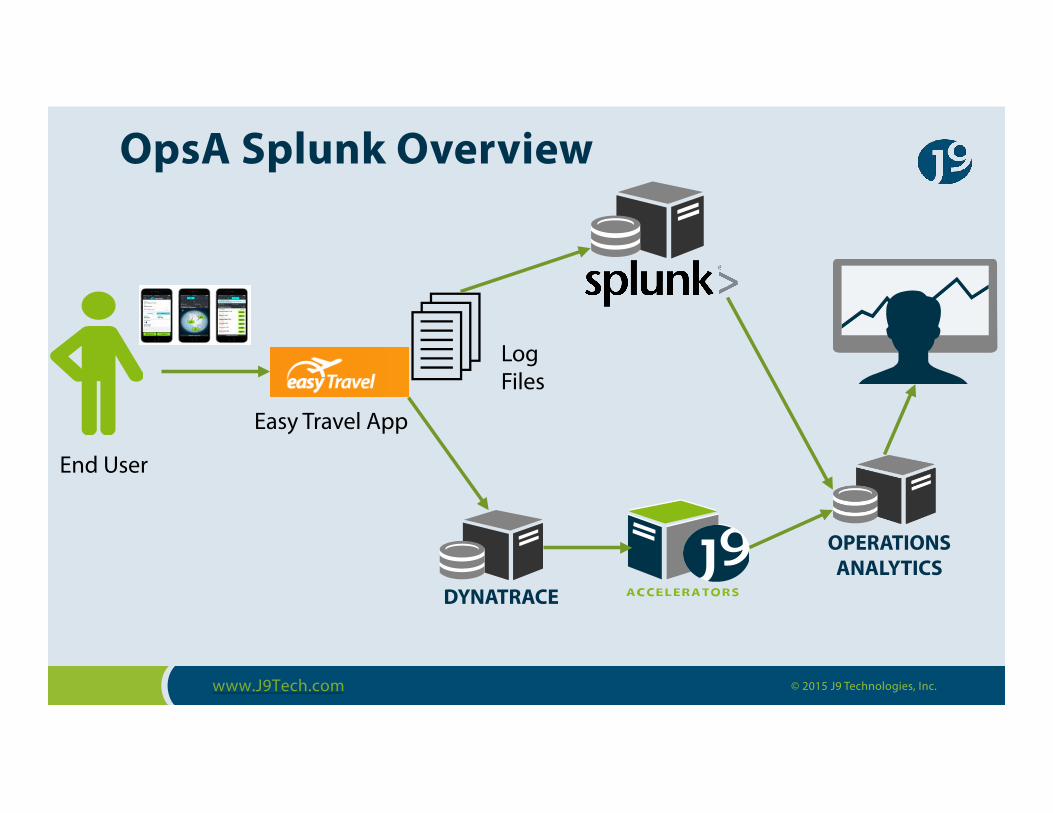
OpsA Splunk Overview
DYNATRACE
OPERATIONS ANALYTICS
Easy Travel App
End User
Log Files
4
www.J9Tech.com © 2015 J9 Technologies, Inc.
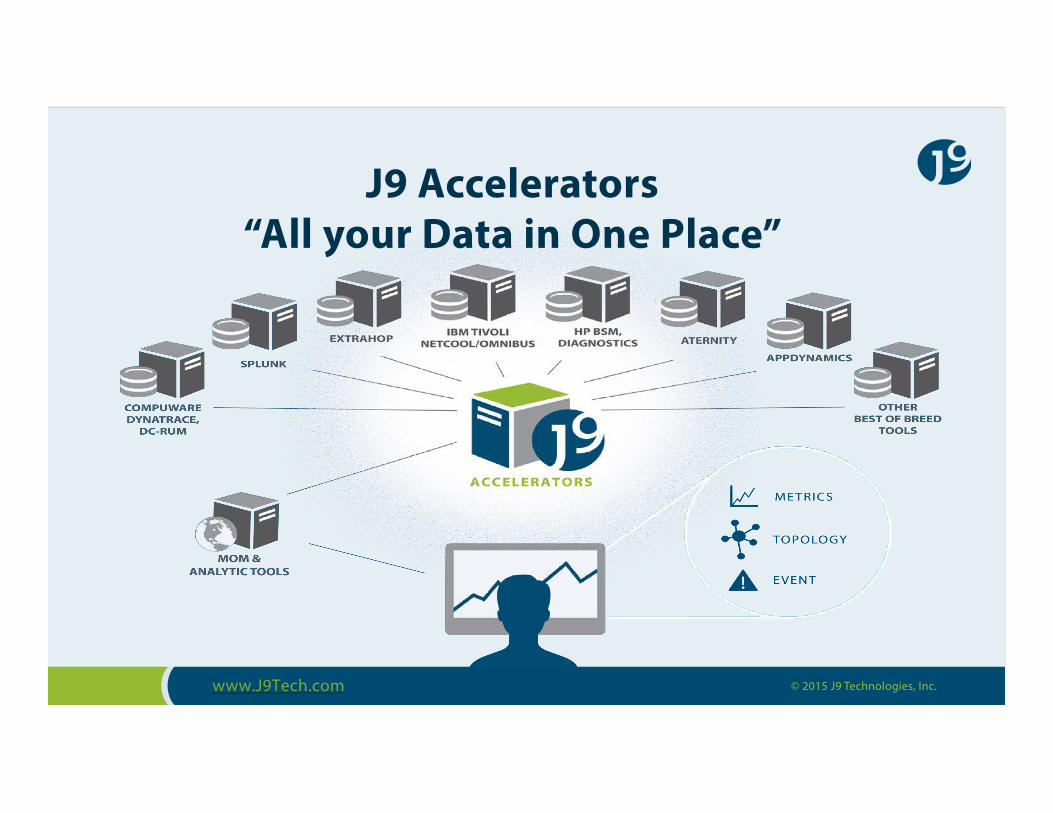
J9 Accelerators “All your Data in One Place”

www.J9Tech.com © 2015 J9 Technologies, Inc.
Q&A

©Copyright2015VivitWorldwide
HP Discover 2015 London
• December 1-3, 2015 - London
• Register Now via the unique Vivit link:
http://hpsw.co/y9T3Bzj
• Check out Vivit Breakout Session! Details to come.

©Copyright2015VivitWorldwide
Thank you • Complete the short survey and opt-in for more information from
J9 Technologies and a chance to win a Fitbit Surge!
www.j9technologies
www.vivit-worldwide.org