Embed Size (px)
DESCRIPTION
BCS Portfolio - A profile
Citation preview

www.bcs-hq.comGRAPHIC DESIGN PORTFOLIO
GRAPHIC DESIGN PORTFOLIO www.bcs-hq.com
Cover art, design and layoutU.S. Department of Energy, Office of Science
September 2011
RepoRt on the FiRst QuadrennialTechnology reviewQTr
DO
E QTR
Rep
ort o
n th
e First Qu
adren
nial Tech
no
log
y Review
September 2011
DOE/S-0001
GRAPHIC DESIGN PORTFOLIO www.bcs-hq.com
Cover art, design and layout (cont.)U.S. Department of Energy, Office of Science
GRAPHIC DESIGN PORTFOLIO www.bcs-hq.com
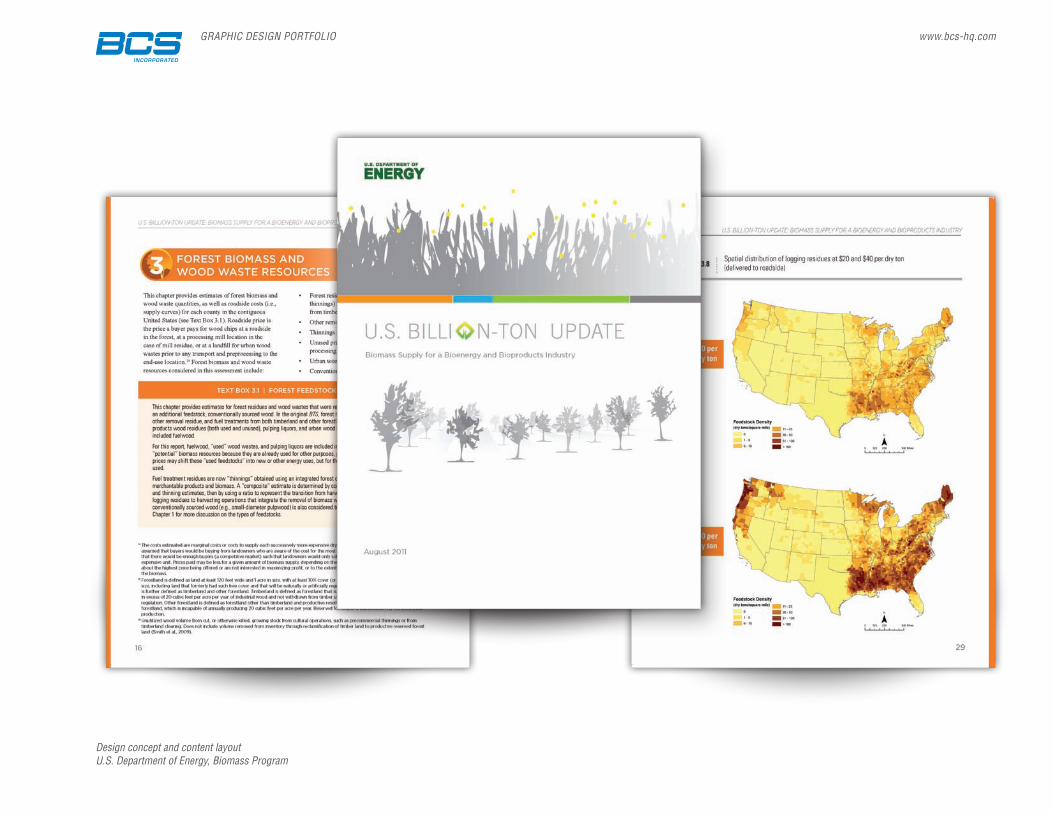
Design concept and content layoutU.S. Department of Energy, Biomass Program
GRAPHIC DESIGN PORTFOLIO www.bcs-hq.com
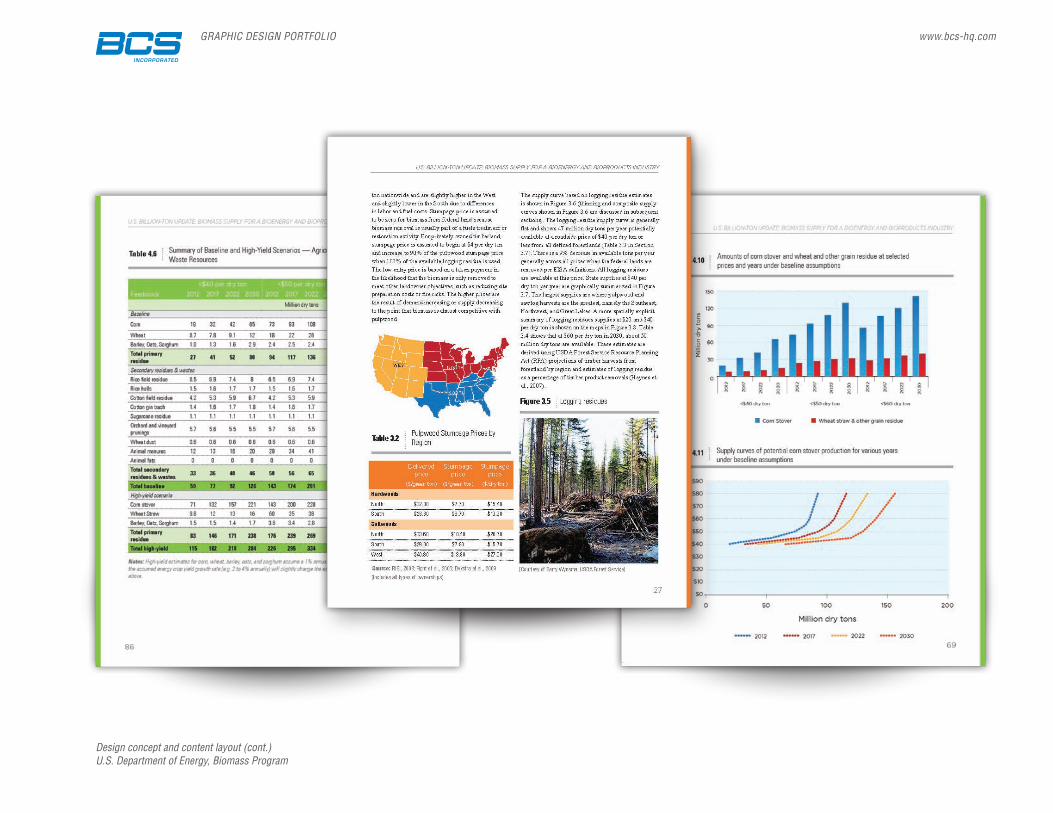
Design concept and content layout (cont.)U.S. Department of Energy, Biomass Program
GRAPHIC DESIGN PORTFOLIO www.bcs-hq.com
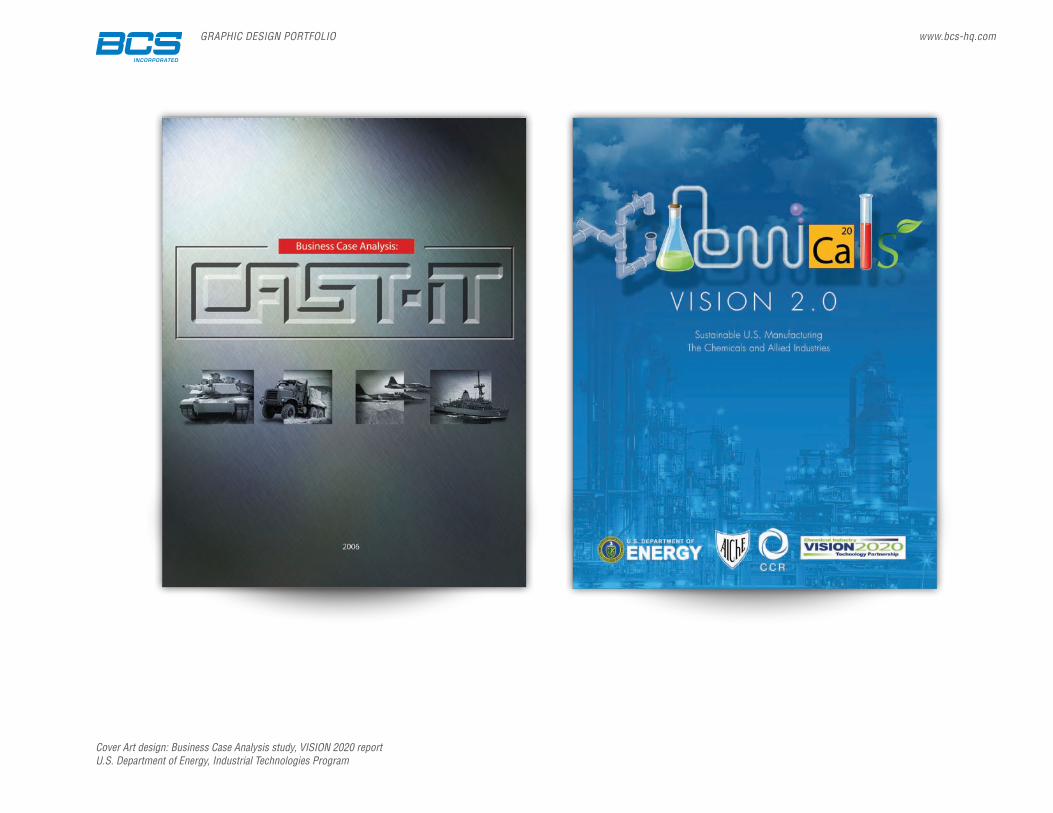
Cover Art design: Business Case Analysis study, VISION 2020 report U.S. Department of Energy, Industrial Technologies Program
GRAPHIC DESIGN PORTFOLIO www.bcs-hq.com
October 2008
A Case Study of Los Angeles Department of Water and Power
Establishing an In-House Wind Maintenance Program
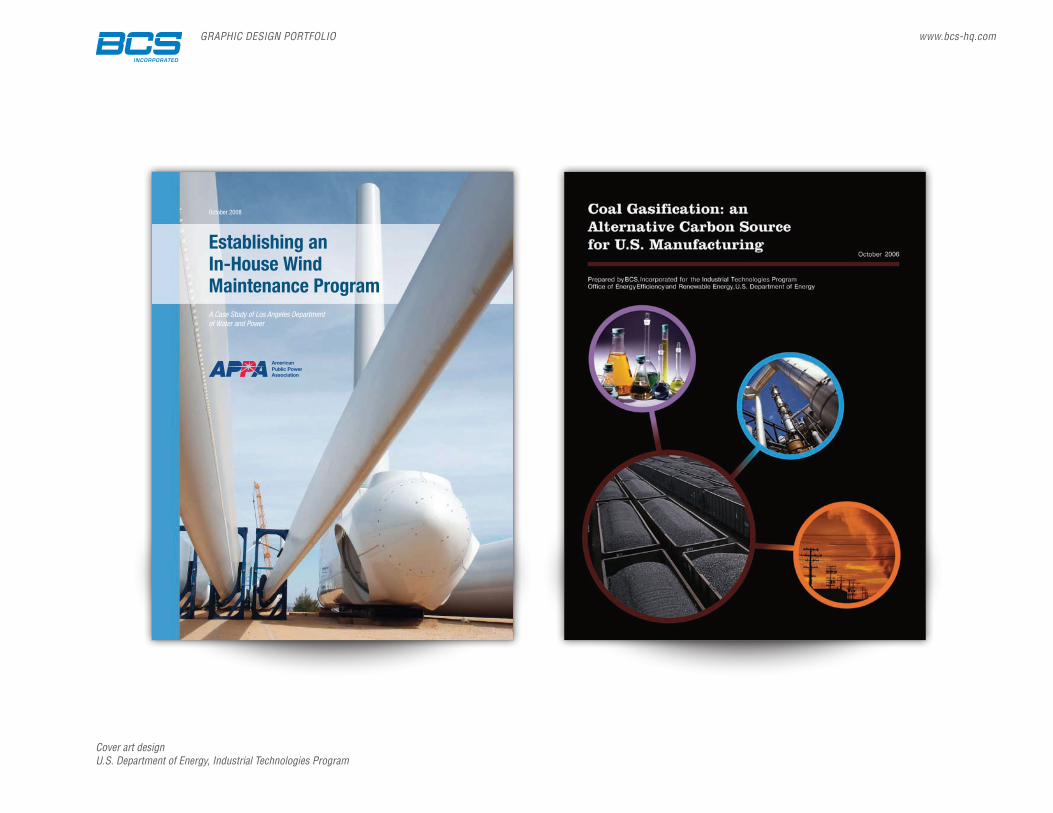
Cover art designU.S. Department of Energy, Industrial Technologies Program
GRAPHIC DESIGN PORTFOLIO www.bcs-hq.com
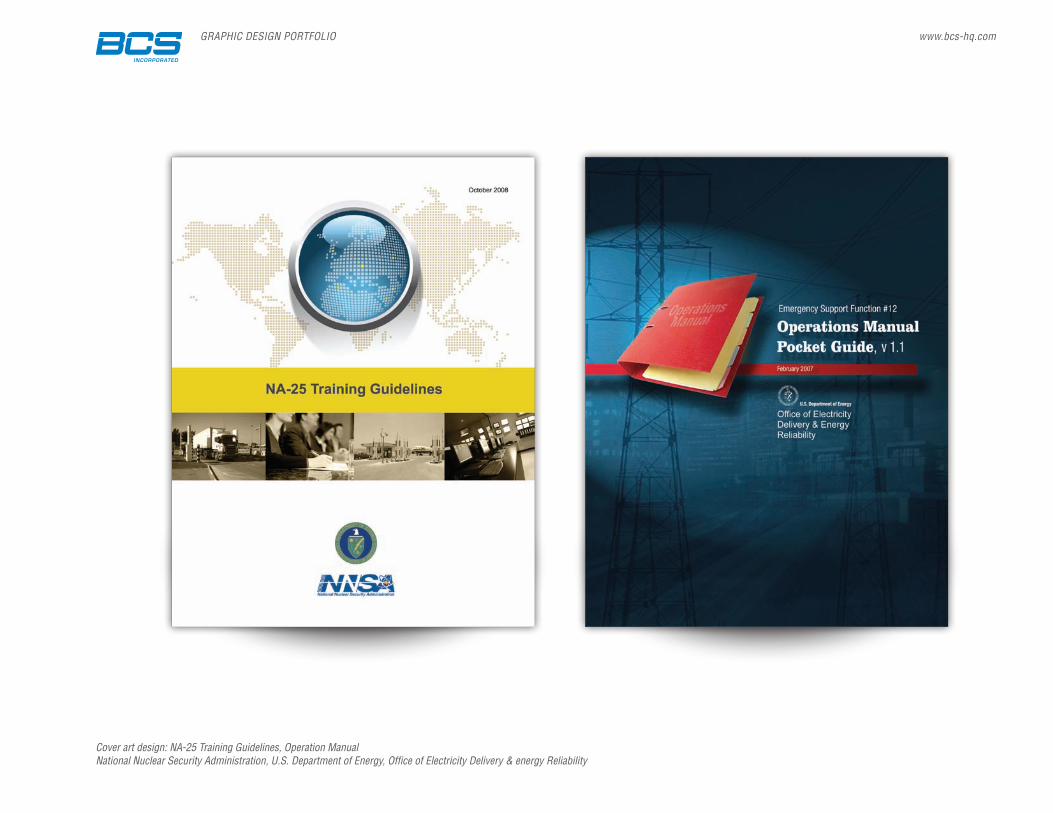
Cover art design: NA-25 Training Guidelines, Operation ManualNational Nuclear Security Administration, U.S. Department of Energy, Office of Electricity Delivery & energy Reliability
GRAPHIC DESIGN PORTFOLIO www.bcs-hq.com
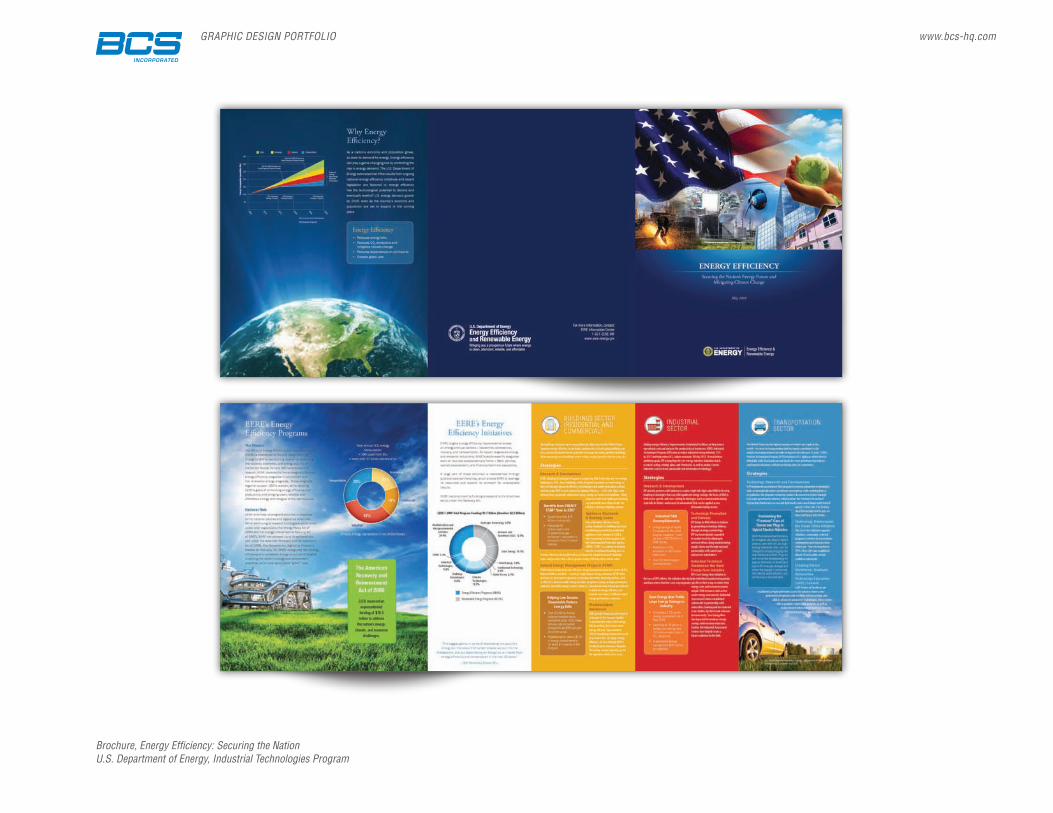
Brochure, Energy Efficiency: Securing the NationU.S. Department of Energy, Industrial Technologies Program
GRAPHIC DESIGN PORTFOLIO www.bcs-hq.com
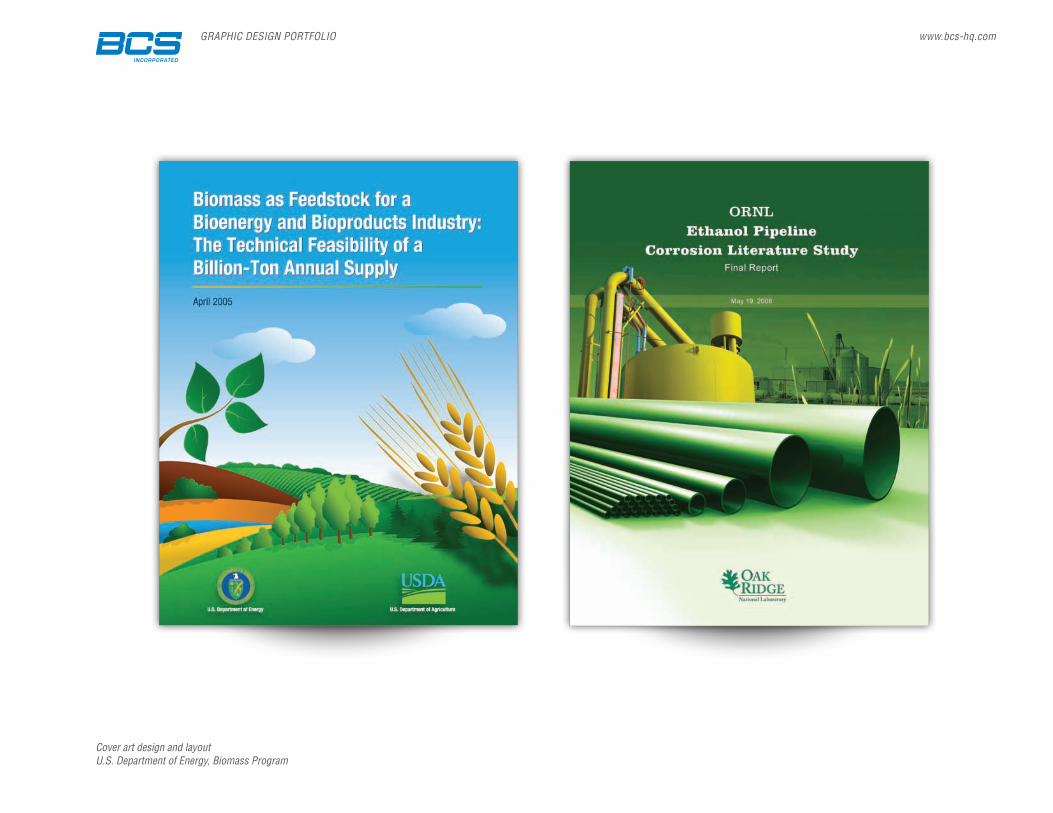
Cover art design and layout U.S. Department of Energy, Biomass Program
GRAPHIC DESIGN PORTFOLIO www.bcs-hq.com
2006
Inte
rnat
iona
l Min
eral
Ext
ract
ion
from
Geo
ther
mal
Brin
es C
onfe
renc
e Re
port
1
DRAFT
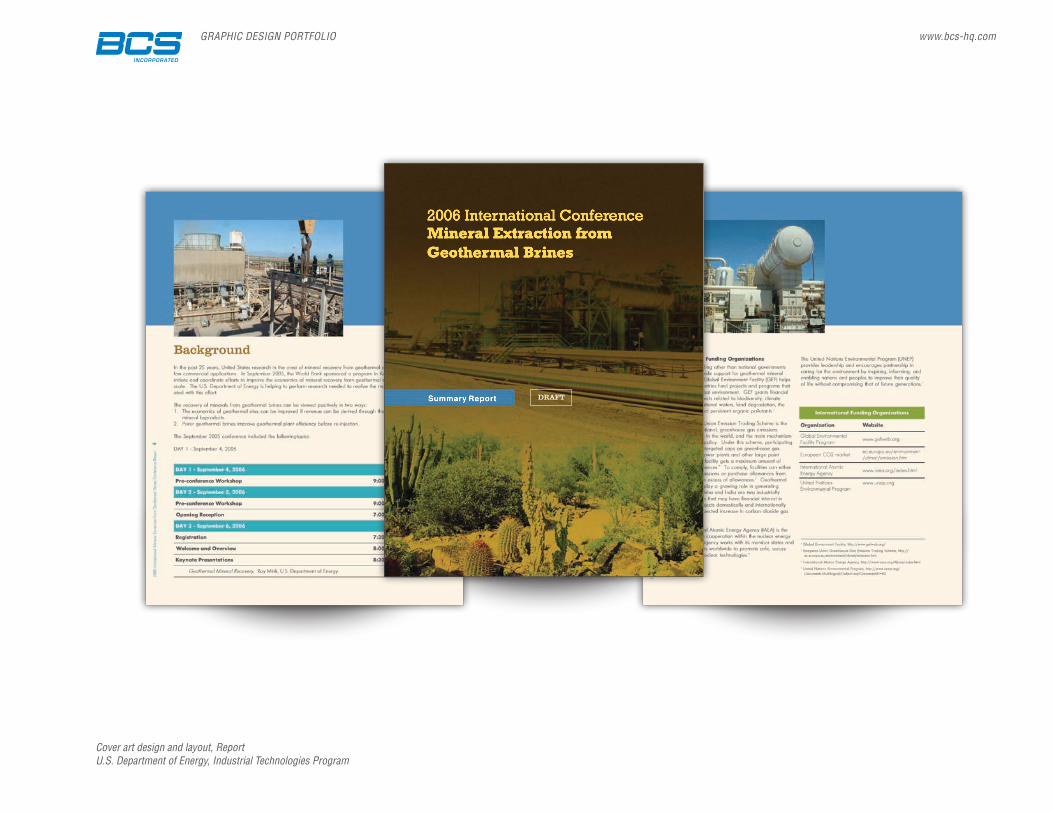
Cover art design and layout, ReportU.S. Department of Energy, Industrial Technologies Program

GRAPHIC DESIGN PORTFOLIO www.bcs-hq.com
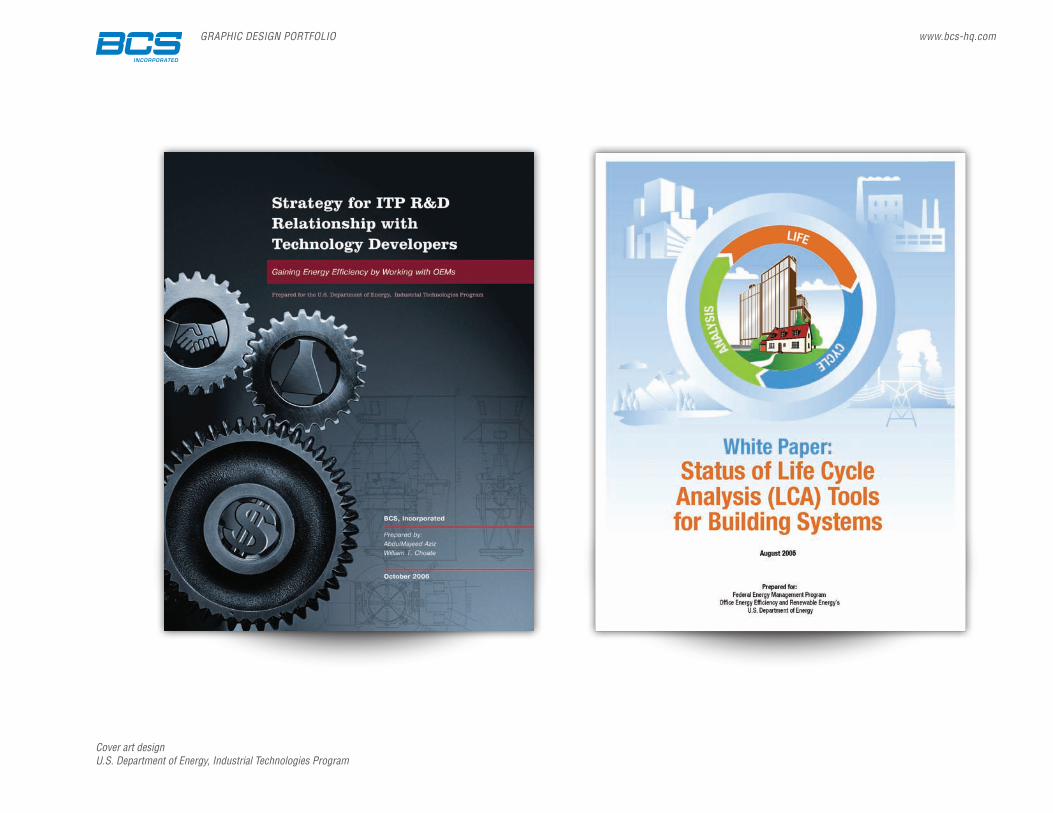
Cover art designU.S. Department of Energy, Industrial Technologies Program
GRAPHIC DESIGN PORTFOLIO www.bcs-hq.com
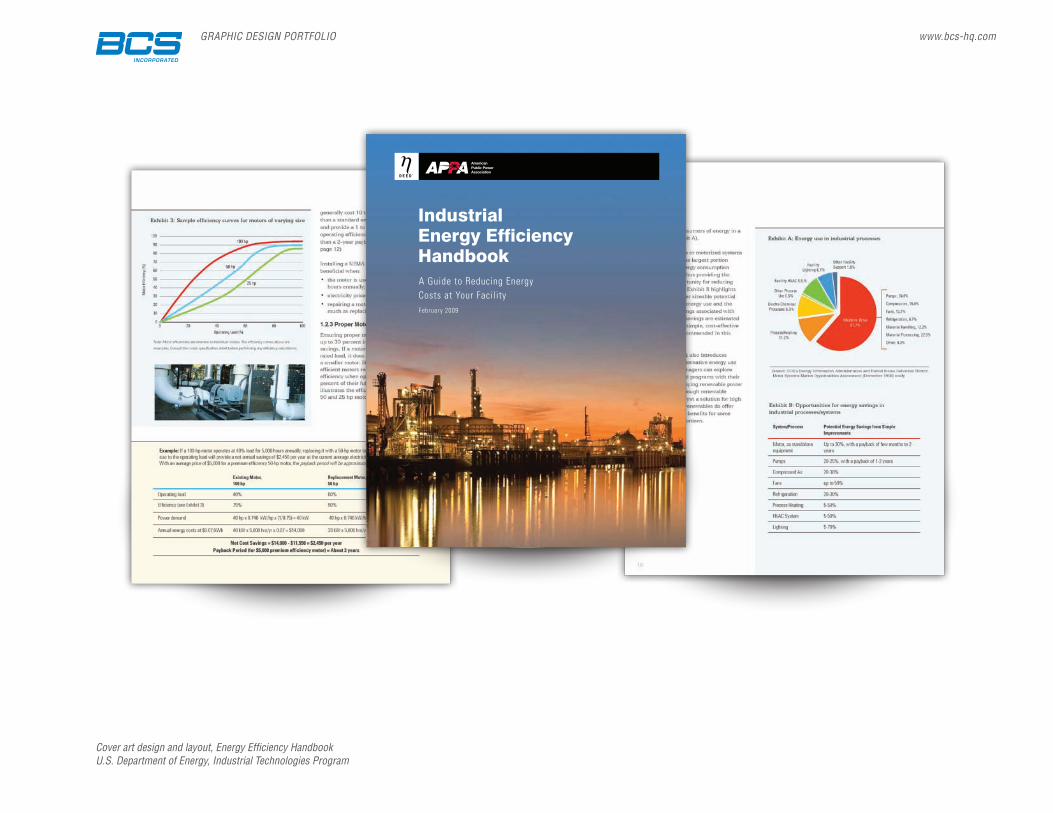
Cover art design and layout, Energy Efficiency HandbookU.S. Department of Energy, Industrial Technologies Program
1
Industrial Energy Efficiency HandbookA Guide to Reducing Energy Costs at Your FacilityFebruary 2009
GRAPHIC DESIGN PORTFOLIO www.bcs-hq.com
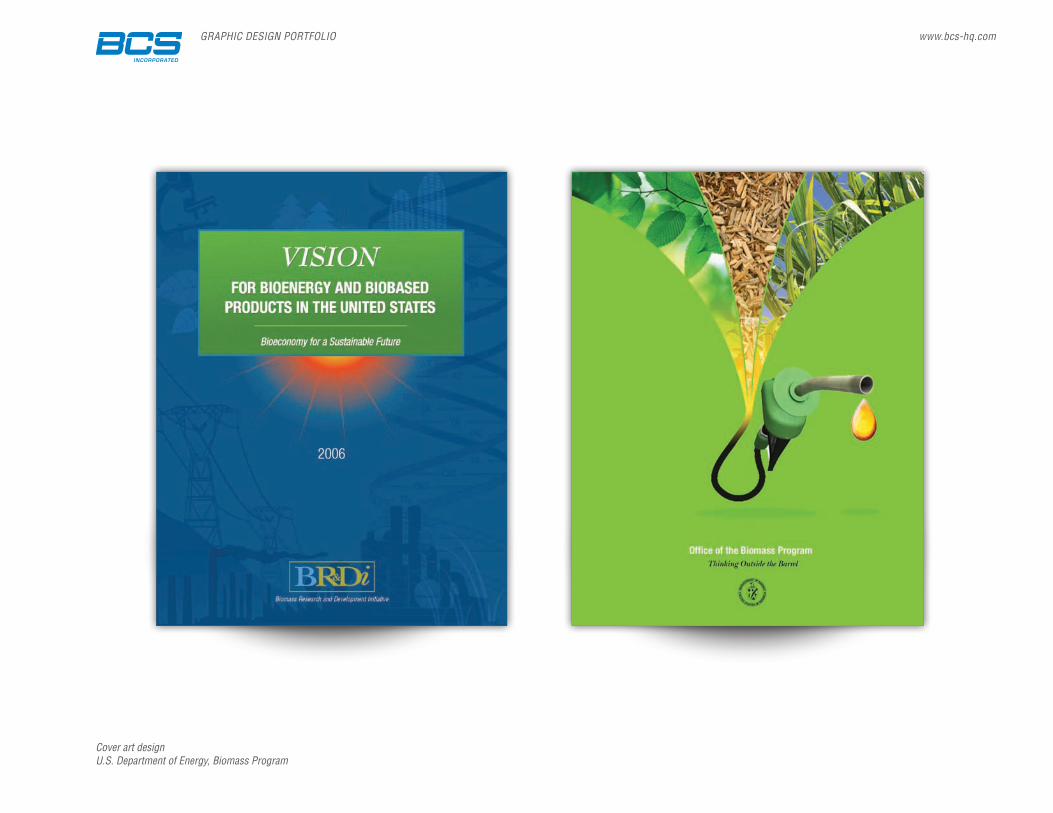
Cover art design U.S. Department of Energy, Biomass Program
GRAPHIC DESIGN PORTFOLIO www.bcs-hq.com
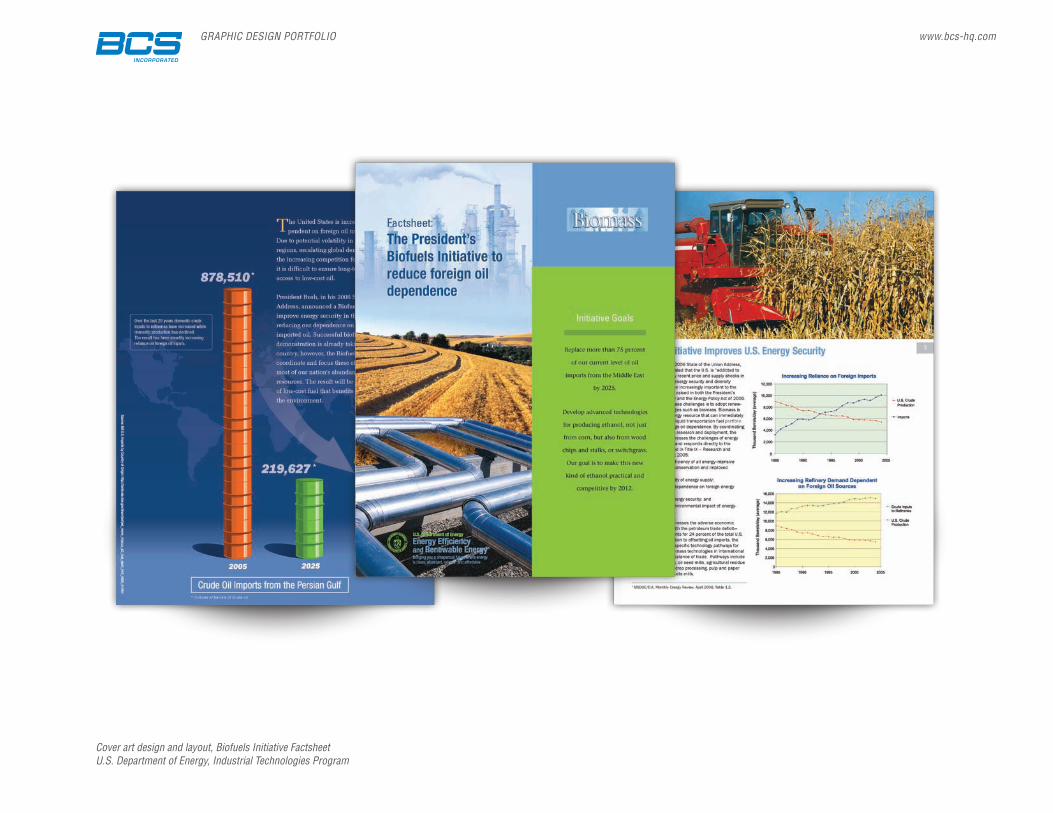
Cover art design and layout, Biofuels Initiative FactsheetU.S. Department of Energy, Industrial Technologies Program
GRAPHIC DESIGN PORTFOLIO www.bcs-hq.com
Cover art designU.S. Department of Energy, Industrial Technologies Program
GRAPHIC DESIGN PORTFOLIO www.bcs-hq.com
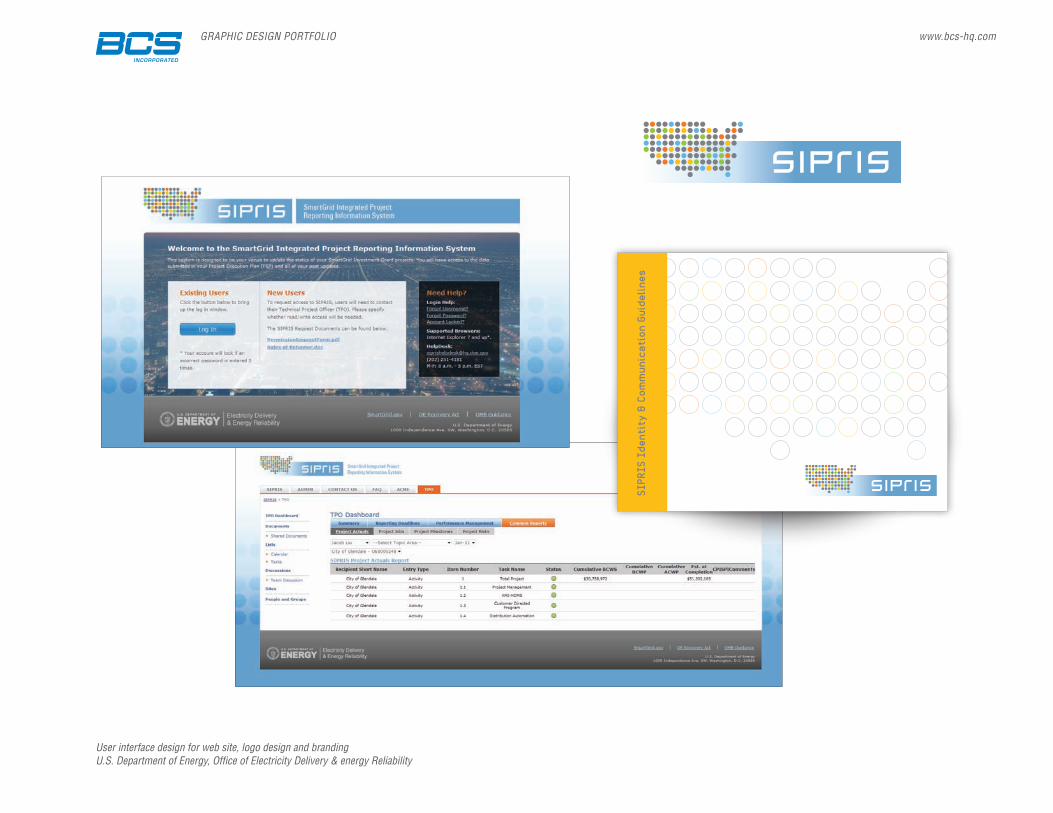
User interface design for web site, logo design and brandingU.S. Department of Energy, Office of Electricity Delivery & energy Reliability
SIPR
IS I
dent
ity
& Co
mm
unic
atio
n Gu
idel
ines
GRAPHIC DESIGN PORTFOLIO www.bcs-hq.com
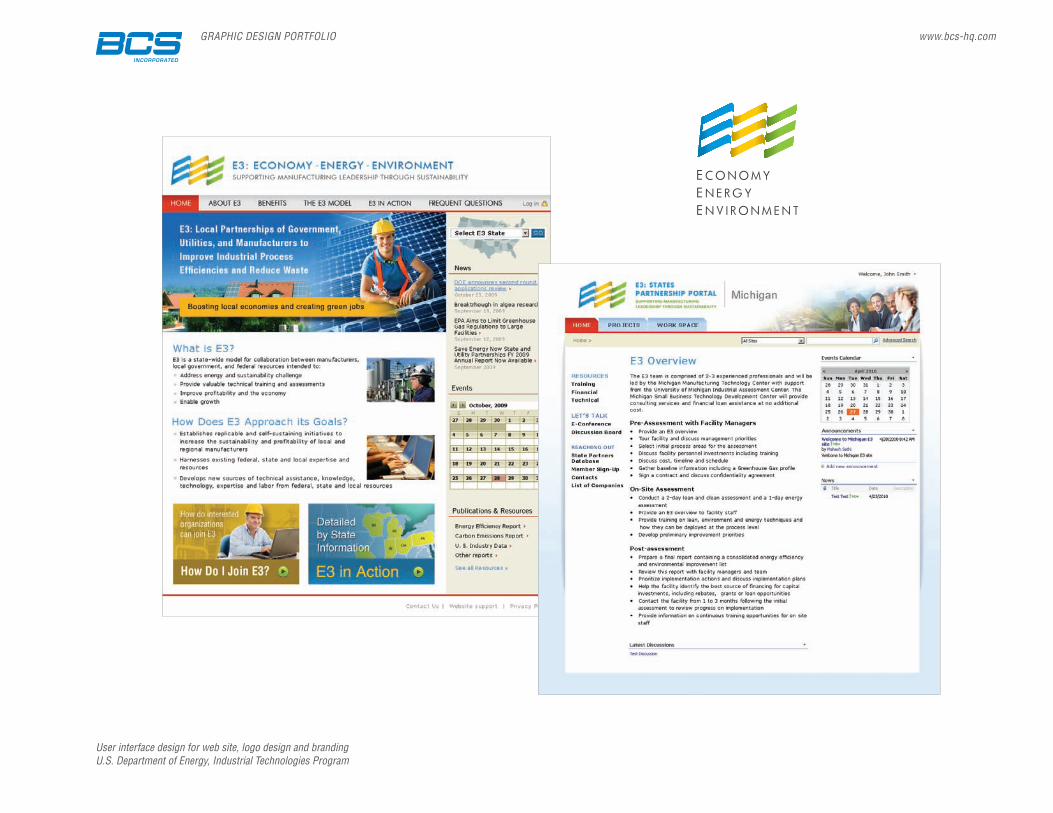
User interface design for web site, logo design and brandingU.S. Department of Energy, Industrial Technologies Program
GRAPHIC DESIGN PORTFOLIO www.bcs-hq.com
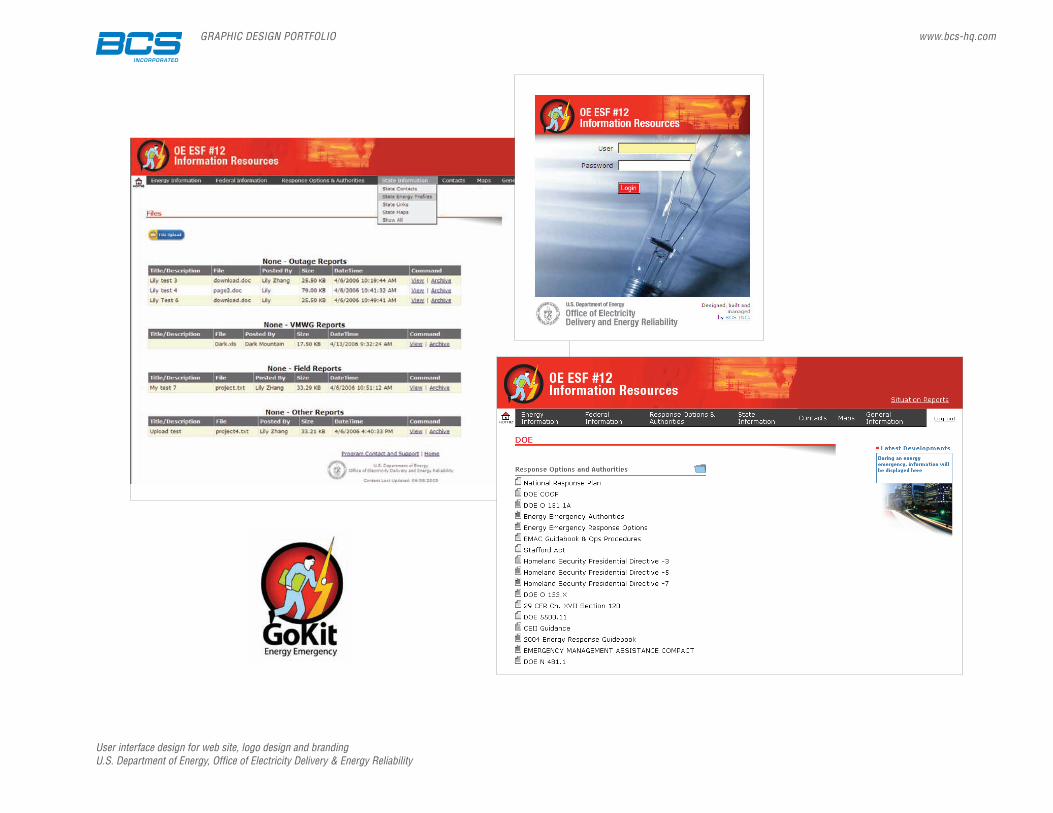
User interface design for web site, logo design and brandingU.S. Department of Energy, Office of Electricity Delivery & Energy Reliability
GRAPHIC DESIGN PORTFOLIO www.bcs-hq.com
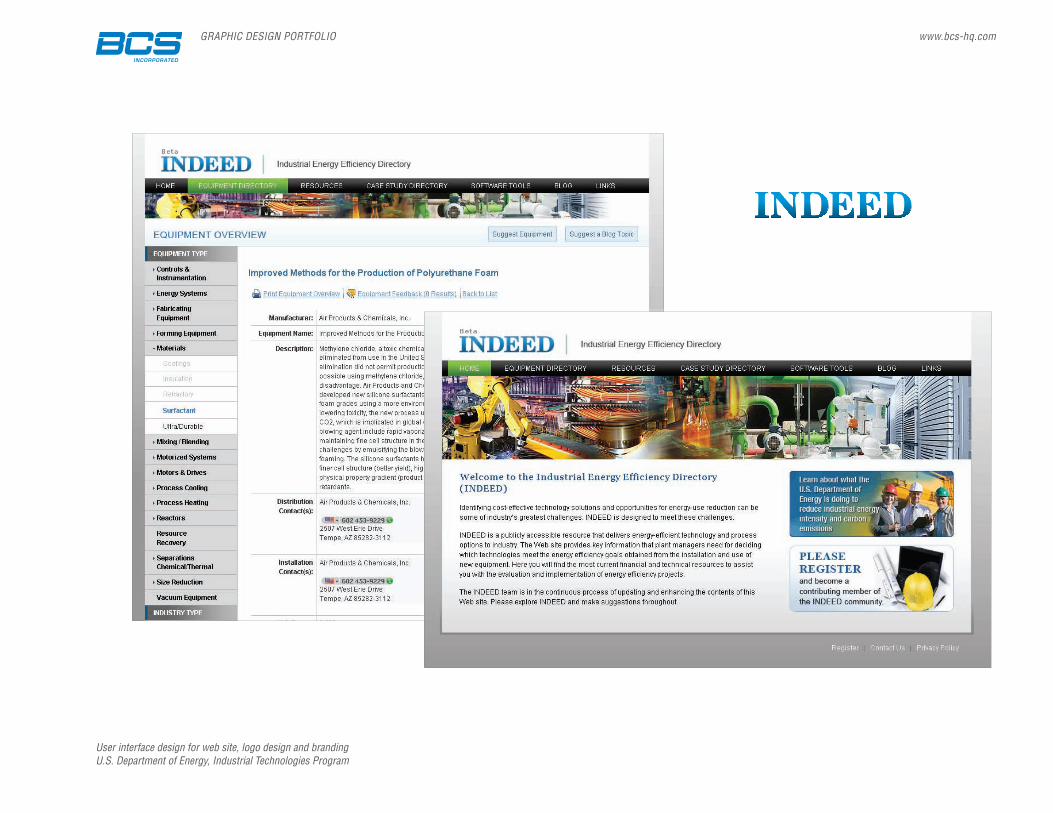
User interface design for web site, logo design and brandingU.S. Department of Energy, Industrial Technologies Program
GRAPHIC DESIGN PORTFOLIO www.bcs-hq.com
Logo design U.S. Department of Energy, University of Maryland
GRAPHIC DESIGN PORTFOLIO www.bcs-hq.com
Logo designSES Americom/GDP , WIC Michigan, U.S. Department of Energy,

GRAPHIC DESIGN PORTFOLIO www.bcs-hq.com
Interactive CDs + cover designU.S. Department of Energy, Office of Electricity Delivery & Energy Reliability, Industrial Technologies Program, Biomass Program; U.S. Department of Commerce
GRAPHIC DESIGN PORTFOLIO www.bcs-hq.com
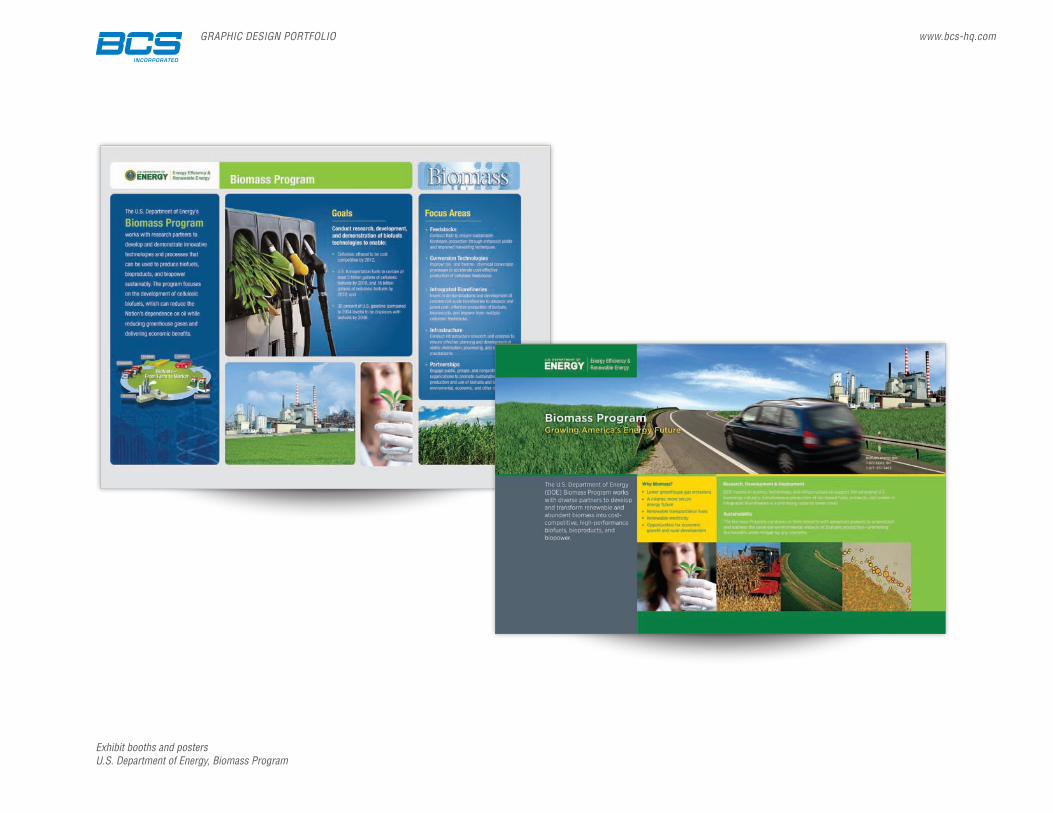
Exhibit booths and postersU.S. Department of Energy, Biomass Program
GRAPHIC DESIGN PORTFOLIO www.bcs-hq.com
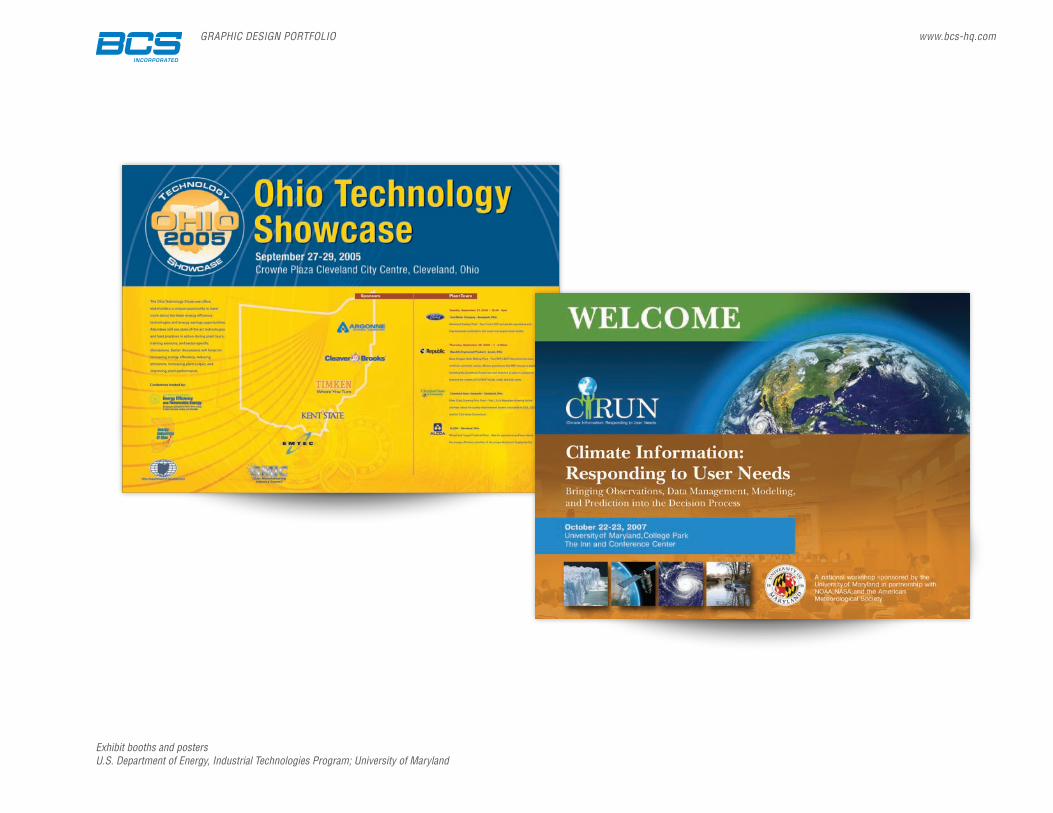
Exhibit booths and postersU.S. Department of Energy, Industrial Technologies Program; University of Maryland
GRAPHIC DESIGN PORTFOLIO www.bcs-hq.com
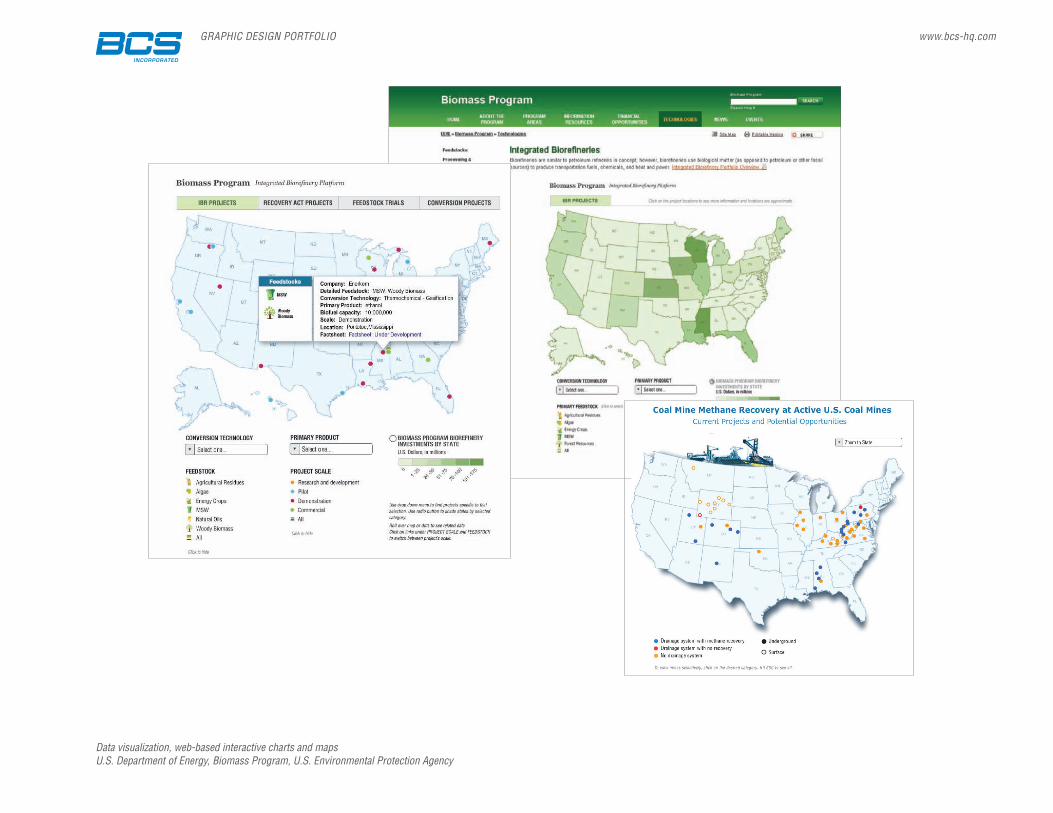
Data visualization, web-based interactive charts and mapsU.S. Department of Energy, Biomass Program, U.S. Environmental Protection Agency
GRAPHIC DESIGN PORTFOLIO www.bcs-hq.com
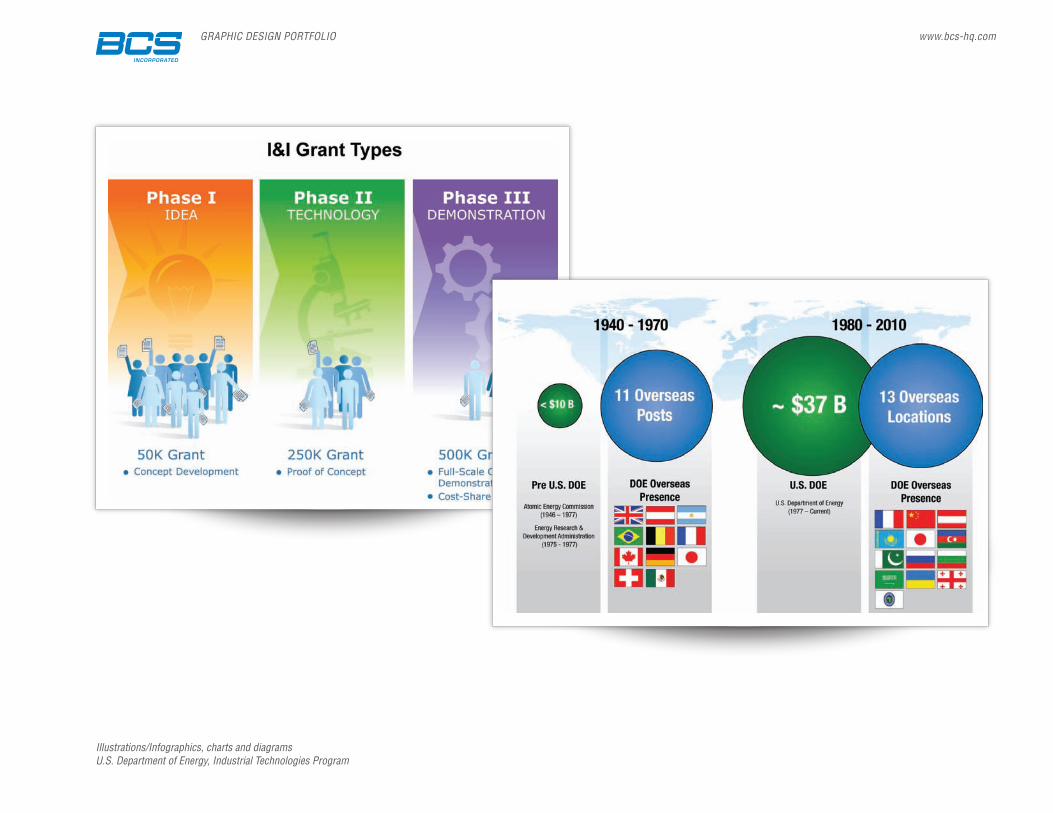
Illustrations/Infographics, charts and diagramsU.S. Department of Energy, Industrial Technologies Program
GRAPHIC DESIGN PORTFOLIO www.bcs-hq.com
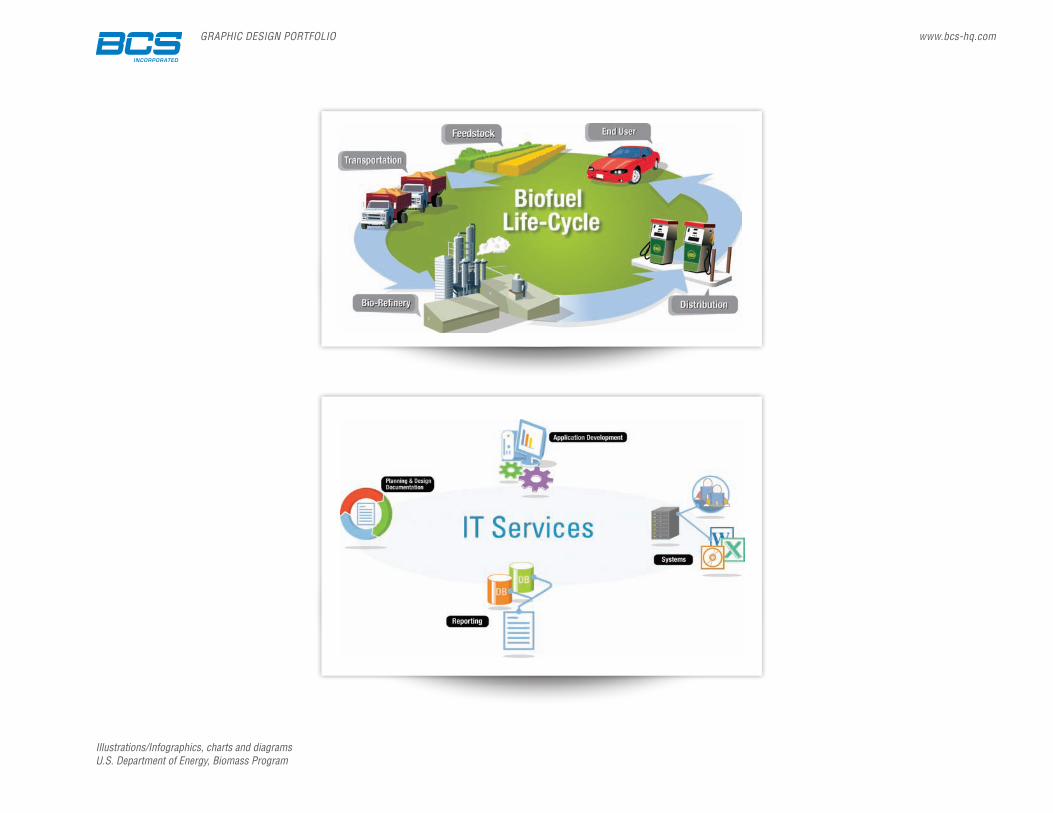
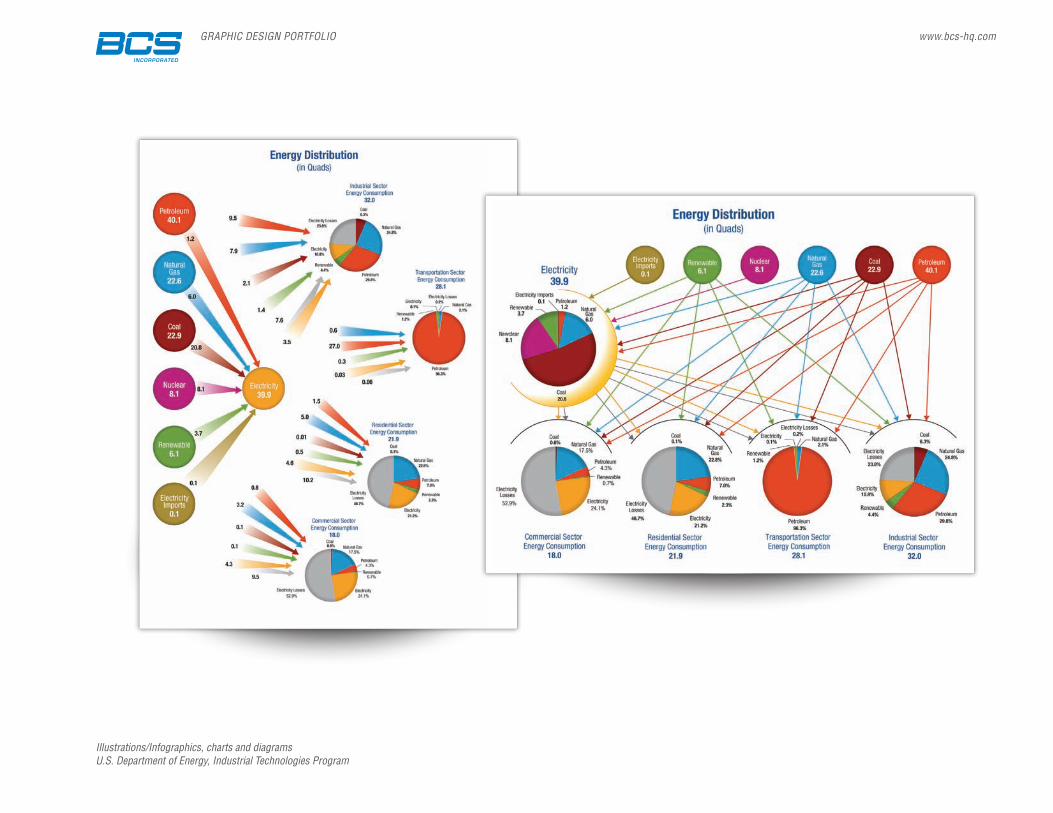
Illustrations/Infographics, charts and diagramsU.S. Department of Energy, Biomass Program
GRAPHIC DESIGN PORTFOLIO www.bcs-hq.com
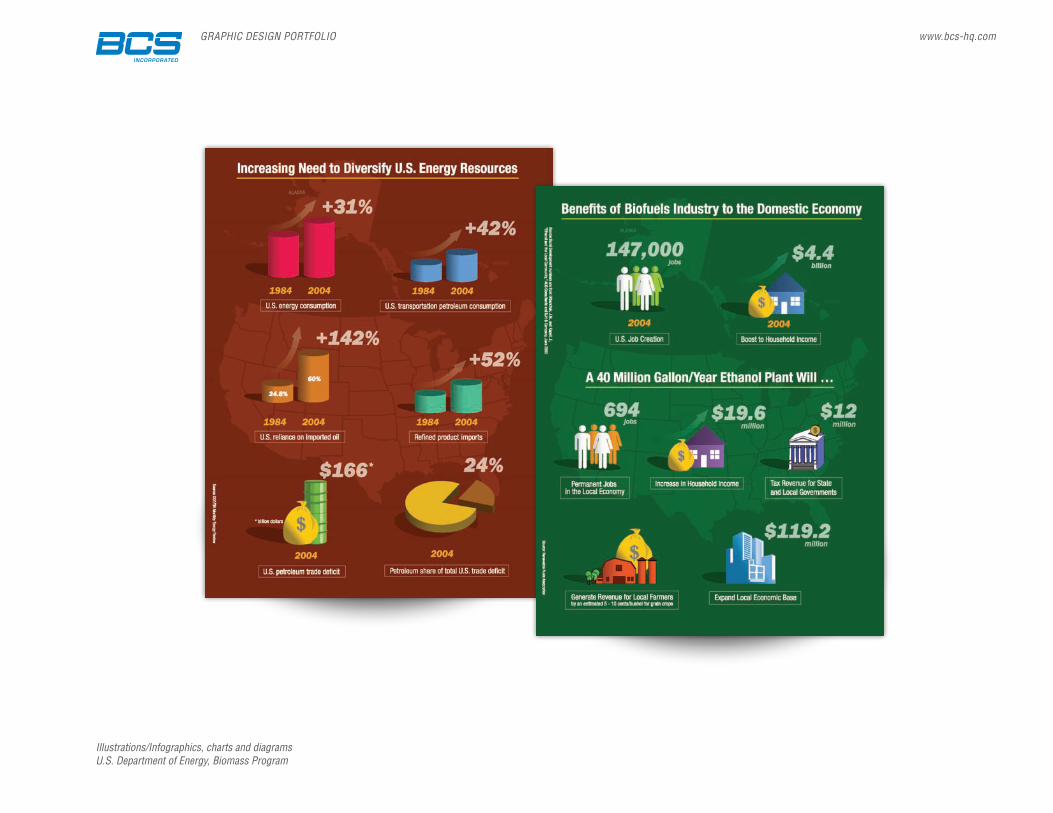
Illustrations/Infographics, charts and diagramsU.S. Department of Energy, Biomass Program
GRAPHIC DESIGN PORTFOLIO www.bcs-hq.com
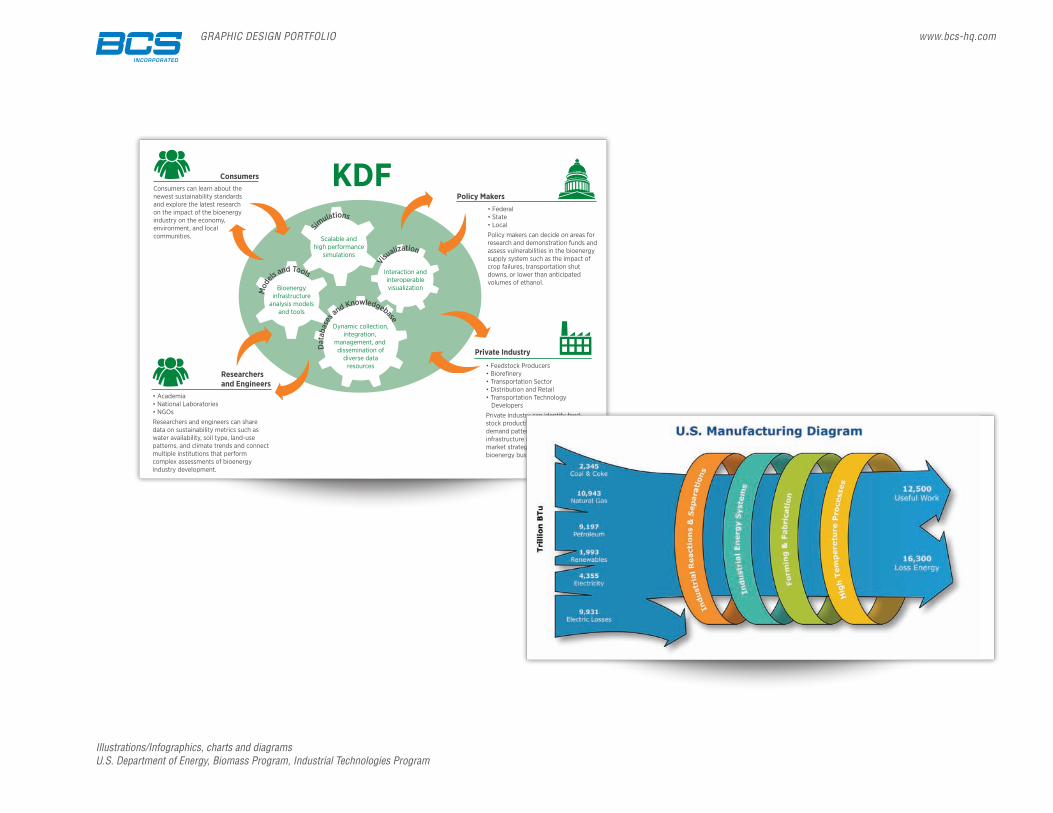
Illustrations/Infographics, charts and diagramsU.S. Department of Energy, Biomass Program, Industrial Technologies Program
Vi
sualization
Simulations
Mod
els and Tools
Dat
abas
es an
d Knowledgebase
• Feedstock Producers• Biorefinery• Transportation Sector• Distribution and Retail• Transportation Technology
DevelopersPrivate industry can identify feed-stock production potential, energy demand patterns, and available infrastructure in order to develop market strategies and invest in bioenergy business opportunities.
• Federal• State• LocalPolicy makers can decide on areas for research and demonstration funds and assess vulnerabilities in the bioenergy supply system such as the impact of crop failures, transportation shut downs, or lower than anticipated volumes of ethanol.
Consumers can learn about the newest sustainability standards and explore the latest research on the impact of the bioenergy industry on the economy, environment, and local communities.
• Academia• National Laboratories• NGOsResearchers and engineers can share data on sustainability metrics such as water availability, soil type, land-use patterns, and climate trends and connect multiple institutions that perform complex assessments of bioenergy industry development.
Consumers
Researchersand Engineers
Private Industry
Policy Makers
KDF
Scalable andhigh performance
simulations
Interaction andinteroperablevisualizationBioenergy
infrastructureanalysis models
and tools
Dynamic collection,integration,
management, and dissemination of
diverse dataresources
GRAPHIC DESIGN PORTFOLIO www.bcs-hq.com
Illustrations/Infographics, charts and diagramsU.S. Department of Energy, Industrial Technologies Program
GRAPHIC DESIGN PORTFOLIO www.bcs-hq.com
BCS boasts a talented team of skilled in-house graphic design professionals who produce a variety of striking visual communications products, including branding, print communications (brochures, manuals, reports), information design (charts, graphs, schedules), promotional design (posters, signs, exhibit booths), and digital communications (Web sites, interactive applications, and electronic newsletters). Our graphic services and products are distinguished by their high-level of quality and integrity. BCS is committed to investing in a solid understanding of our client’s objectives, utilizing state-of-the-art technologies and keeping current on trends and innovations, and ensuring that we produce the most effective communications for our client’s intended audience(s).
BCS also offers additional communications services in the areas of writing and outreach, event planning and implementation, and facilitation. We have over 10 years of experience serving clients in federal and state government agencies, as well as private sector organizations.
Logo Design and Brand Identity BCS has extensive experience designing identities for organizations, programs, and events, in addition to developing branding communications guidelines. We provide our clients with as much support as needed in developing identity goals and conducting competitive research, before moving on to creative design concepts and final logo design and branding elements.
PrintBCS has produced a wide variety of print materials, including fliers, brochures, fact sheets, case studies, reports, manuals, handbooks, course books, presentations, newsletters, posters, signs, and exhibit booths. Some of our recent clients include: U. S. Trade and Development Agency; Environmental Protection Agency (EPA), Coalbed Methane Outreach Program; The U.S. Department of Energy (DOE) and Office of Electricity Delivery & Energy Reliability, EERE’s Programs (Biomass Program, Industrial Technologies Program, Distributed Energy Program); State of Michigan, Department of Community Health, Women, Infants and Children Division; U.S. Department of Commerce; Maryland’s Department Of Natural Resources; Maryland’s Energy Administration.
Web BCS excels at the creative and technical aspects of designing and implementing electronic communications, including electronic newsletters, e-mail blasts, user interfaces for interactive applications and web sites. Our talented graphic professionals always design with the end-user in mind and conduct usability testing as needed. We produce source code that is section 508 and CSS/XHTML standards-compliant, test rigorously for cross-browser compatibility, and apply search engine optimization best practices.
Illustration and Infographics BCS recognizes that the effective visual display of quantitative information is integral to quality data analysis and reporting. We utilize the best practices available in data visualization and pride ourselves on the clean, clear, and rich presentation of complex information. BCS has created a number of compelling representations of data as static images, such as charts, maps, and technical illustrations.
Interactive Charts, Maps, GIS, and Custom Interactive ApplicationsInteractive charting and mapping is one of the most important components of effective data visualization. Such Web-based technologies are widely and successfully adopted by private (NYTimes), nonprofit (NPR Radio), and government (Recovery.gov) sectors. BCS has produced an array of striking interactive charts, maps, and technical illustrations, as well as interactive quizzes, utilizing a variety of tools and technologies, including Adobe Flash, Adobe Flex, XML, Google Maps, ArgGIS, Google Analytics, and Microsoft Analysis Services.
Awards and Recognition• 2009: APEX , Annual Award for Publication Excellence in Corporate Identity, “Biomass 2009—Fueling our Future” conference logo, Springfield, VA.• 2007: Certificate of Recognition of Valuable Contributions to Development of the I&I Applications Evaluation Tool, U.S. Department of Energy (DOE), Office of Energy Efficiency and
Renewable Energy (EERE).
A selection of our work can be viewed in our online portfolio: http://www.bcs-hq.com/portfolio/logos.html