Embed Size (px)
Citation preview
Health Profile 2017
Basingstoke and DeaneDistrict This profile was published on 4th July 2017
Health in summaryThe health of people in Basingstoke and Deane is variedcompared with the England average. Basingstoke andDeane is one of the 20% least deprived districts/unitaryauthorities in England, however about 12% (3,900) ofchildren live in low income families. Life expectancy formen is higher than the England average.
Health inequalitiesLife expectancy is 5.8 years lower for men and 4.5 yearslower for women in the most deprived areas ofBasingstoke and Deane than in the least deprivedareas.
Child healthIn Year 6, 17.4% (303) of children are classified asobese, better than the average for England. The rate ofalcohol-specific hospital stays among those under 18 is37*. This represents 14 stays per year. Levels ofbreastfeeding initiation and smoking at time of deliveryare better than the England average.
Adult healthThe rate of alcohol-related harm hospital stays is 393*,better than the average for England. This represents 646stays per year. The rate of self-harm hospital stays is229*, worse than the average for England. Thisrepresents 395 stays per year. The rate of people killedand seriously injured on roads is worse than average.Rates of sexually transmitted infections and TB arebetter than average. The rate of violent crime is worsethan average. Rates of statutory homelessness, longterm unemployment and early deaths from cancer arebetter than average.
Local prioritiesPriorities in Basingstoke and Deane include increasingphysical activity, mental wellbeing, positive healthybehaviours and social connections, and for residents tobe well informed. For more information see www.basingstoke.gov.uk and www.hants.gov.uk
* rate per 100,000 population
Basingstoke
N10 miles
Contains National Statistics data © Crown copyright and database right 2017Contains OS data © Crown copyright and database right 2017
This profile gives a picture of people’s health inBasingstoke and Deane. It is designed to help localgovernment and health services understand theircommunity’s needs, so that they can work togetherto improve people’s health and reduce healthinequalities.
Visit www.healthprofiles.info for more profiles, moreinformation and interactive maps and tools.
Follow @PHE_uk on Twitter
Basingstoke and Deane - 4 July 20171© Crown Copyright 2017
Deprivation map (page 2) revised on 4th April 2018
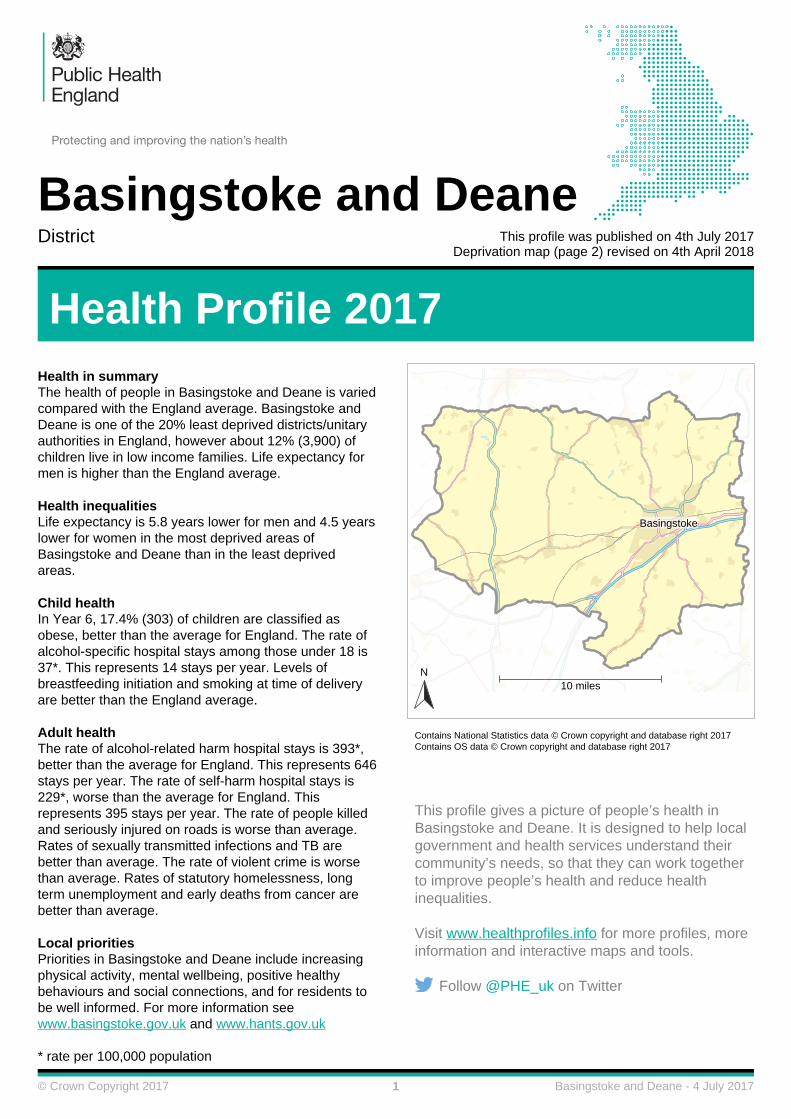
Population: summary characteristics
Deprivation: a national view
Age profile
Males Age Females
% of total population
0 02 2
0-4
5-9
10-14
15-19
20-24
25-29
30-34
35-39
40-44
45-49
50-54
55-59
60-64
65-69
70-74
75-79
80-84
85-89
90+
Basingstoke and Deane 2015 (Male)
Basingstoke and Deane 2015 (Female)
England 2015
Basingstoke and Deane 2020estimate
Males Females Persons
Basingstoke and Deane (population in thousands)
Population (2015): 86 88 174
Projected population (2020): 90 93 183
% people from an ethnicminority group:
9.2% 9.2% 9.2%
Dependency ratio (dependants / working population) x 100 60.2%
England (population in thousands)
Population (2015): 27,029 27,757 54,786
Projected population (2020): 28,157 28,706 56,862
% people from an ethnicminority group:
13.1% 13.4% 13.2%
Dependency ratio (dependants / working population) x 100 60.7%
The age profile and table present demographic information for the residents of thearea and England. They include a 2014-based population projection (to 2020), thepercentage of people from an ethnic minority group (Annual Population Survey,October 2014 to September 2015) and the dependency ratio.
The dependency ratio estimates the number of dependants in an area by comparingthe number of people considered less likely to be working (children aged under 16and those of state pension age or above) with the working age population. A highratio suggests the area might want to commission a greater level of services forolder or younger people than those areas with a low ratio.
Lines represent electoral wards (2016)
The map shows differences in deprivation in this areabased on national comparisons, using nationalquintiles (fifths) of the Index of Multiple Deprivation2015 (IMD 2015), shown by lower super output area.The darkest coloured areas are some of the mostdeprived neighbourhoods in England.
This chart shows the percentage of the populationwho live in areas at each level of deprivation.
Con
tain
s O
S d
ata
© C
row
n co
pyrig
ht a
nd d
atab
ase
right
s 20
17
0
10
20
30
40
50
60
70
80
90
100
% R
esid
ents
England Basingstoke andDeane
Most deprived quintile Least deprived quintile
Basingstoke and Deane - 4 July 2017, Revised 4 April 20181© Crown Copyright 2017
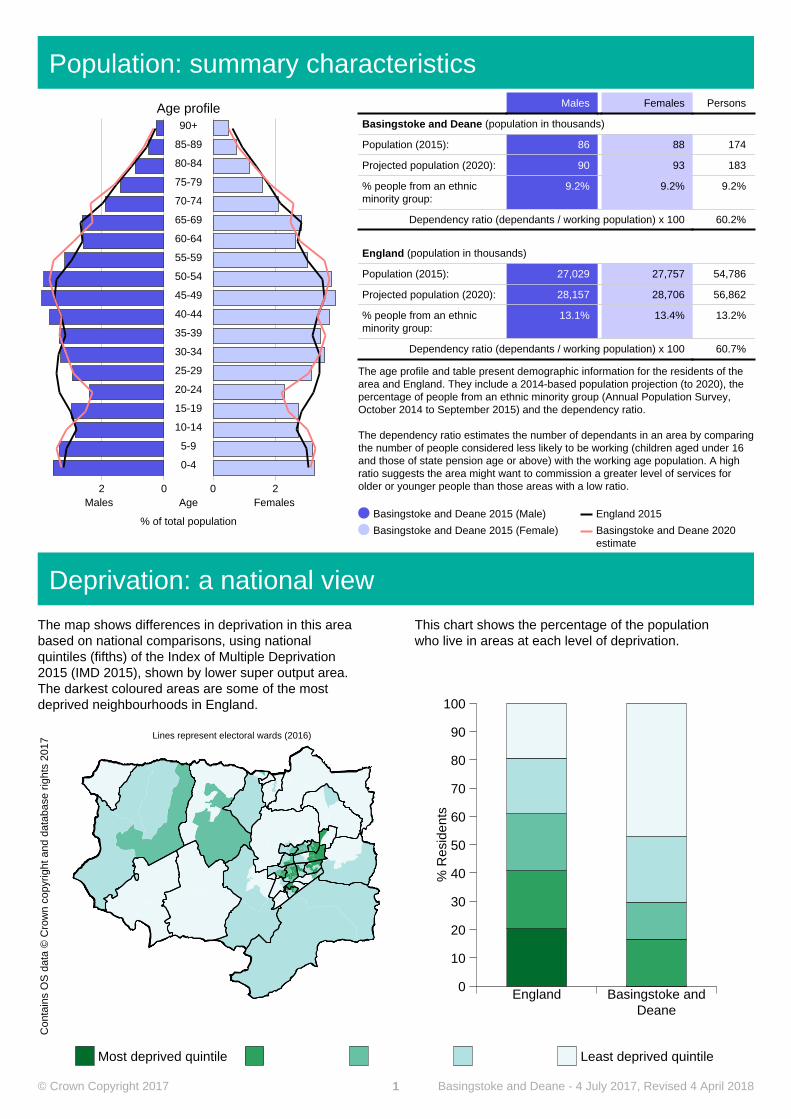
The charts show life expectancy for men and women in this local authority for 2013-15. The local authority is divided intolocal deciles (tenths) by deprivation (IMD 2015), from the most deprived decile on the left of the chart to the least depriveddecile on the right. The steepness of the slope represents the inequality in life expectancy that is related to deprivation inthis local area. If there was no inequality in life expectancy the line would be horizontal.
Life expectancy gap for men: 5.8 years
Life
exp
ecta
ncy
at b
irth
(yea
rs)
65
70
75
80
85
90
95
Most deprived Least deprivedInequality slope for men Life expectancy for men
Life expectancy gap for women: 4.5 years
Life
exp
ecta
ncy
at b
irth
(yea
rs)
65
70
75
80
85
90
95
Most deprived Least deprivedInequality slope for women Life expectancy for women
Life expectancy: inequalities in this local authority
Health inequalities: changes over time
Early deaths from all causes: men
Age
-sta
ndar
dise
d ra
tepe
r 10
0,00
0 po
pula
tion
Years
0
250
500
750
1000
1250
1500
2003 2004 2005 2006 2007 2008 2009 2010 2011 2012 2013 2014
IMD 2015IMD 2010
Early deaths from all causes: women
Age
-sta
ndar
dise
d ra
tepe
r 10
0,00
0 po
pula
tion
Years
0
250
500
750
1000
1250
1500
2003 2004 2005 2006 2007 2008 2009 2010 2011 2012 2013 2014
IMD 2015IMD 2010
Early deaths from heart disease and stroke
Age
-sta
ndar
dise
d ra
tepe
r 10
0,00
0 po
pula
tion
Years
0
50
100
150
200
250
2003 2004 2005 2006 2007 2008 2009 2010 2011 2012 2013 2014
Early deaths from cancer
Age
-sta
ndar
dise
d ra
tepe
r 10
0,00
0 po
pula
tion
Years
0
50
100
150
200
250
2003 2004 2005 2006 2007 2008 2009 2010 2011 2012 2013 2014
England average Local average Local least deprived Local most deprived Local inequality
Data points are the midpoints of three year averages of annual rates, for example 2005 represents the period 2004 to 2006. Where data are missing for local least or mostdeprived, the value could not be calculated as the number of cases is too small.
These charts provide a comparison of the changes in death rates in people under 75 (early deaths) between this areaand England. Early deaths from all causes also show the differences between the most and least deprived local quintile inthis area. Data from 2010-12 onwards have been revised to use IMD 2015 to define local deprivation quintiles (fifths), allprior time points use IMD 2010. In doing this, areas are grouped into deprivation quintiles using the Index of MultipleDeprivation which most closely aligns with time period of the data. This provides a more accurate way of discriminatingchanges between similarly deprived areas over time.
Basingstoke and Deane - 4 July 20173© Crown Copyright 2017
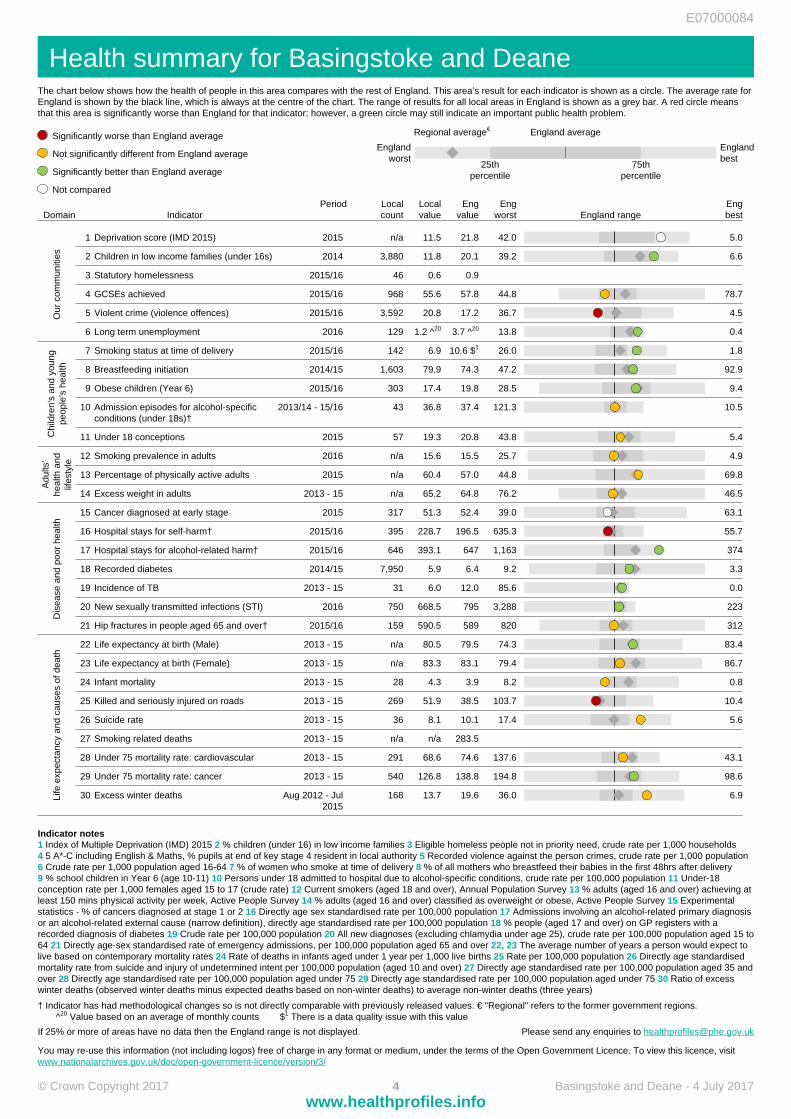
Health summary for Basingstoke and DeaneThe chart below shows how the health of people in this area compares with the rest of England. This area’s result for each indicator is shown as a circle. The average rate forEngland is shown by the black line, which is always at the centre of the chart. The range of results for all local areas in England is shown as a grey bar. A red circle meansthat this area is significantly worse than England for that indicator; however, a green circle may still indicate an important public health problem.
E07000084
Significantly worse than England average
Not significantly different from England average
Significantly better than England average
Not compared
Regional average€ England average
Englandworst
Englandbest
25thpercentile
75thpercentile
Domain IndicatorPeriod Local
countLocalvalue
Engvalue
Engworst England range
Engbest
1 Deprivation score (IMD 2015) 2015 n/a 11.5 21.8 42.0 5.0
2 Children in low income families (under 16s) 2014 3,880 11.8 20.1 39.2 6.6
3 Statutory homelessness 2015/16 46 0.6 0.9
4 GCSEs achieved 2015/16 968 55.6 57.8 44.8 78.7
5 Violent crime (violence offences) 2015/16 3,592 20.8 17.2 36.7 4.5
6 Long term unemployment 2016 129 1.2 ^20 3.7 ^20 13.8 0.4
Our
com
mun
ities
7 Smoking status at time of delivery 2015/16 142 6.9 10.6 $1 26.0 1.8
8 Breastfeeding initiation 2014/15 1,603 79.9 74.3 47.2 92.9
9 Obese children (Year 6) 2015/16 303 17.4 19.8 28.5 9.4
10 Admission episodes for alcohol-specificconditions (under 18s)†
2013/14 - 15/16 43 36.8 37.4 121.3 10.5
11 Under 18 conceptions 2015 57 19.3 20.8 43.8 5.4Chi
ldre
n's
and
youn
gpe
ople
's h
ealth
12 Smoking prevalence in adults 2016 n/a 15.6 15.5 25.7 4.9
13 Percentage of physically active adults 2015 n/a 60.4 57.0 44.8 69.8
14 Excess weight in adults 2013 - 15 n/a 65.2 64.8 76.2 46.5
Adu
lts'
heal
th a
ndlif
esty
le
15 Cancer diagnosed at early stage 2015 317 51.3 52.4 39.0 63.1
16 Hospital stays for self-harm† 2015/16 395 228.7 196.5 635.3 55.7
17 Hospital stays for alcohol-related harm† 2015/16 646 393.1 647 1,163 374
18 Recorded diabetes 2014/15 7,950 5.9 6.4 9.2 3.3
19 Incidence of TB 2013 - 15 31 6.0 12.0 85.6 0.0
20 New sexually transmitted infections (STI) 2016 750 668.5 795 3,288 223
21 Hip fractures in people aged 65 and over† 2015/16 159 590.5 589 820 312
Dis
ease
and
poo
r he
alth
22 Life expectancy at birth (Male) 2013 - 15 n/a 80.5 79.5 74.3 83.4
23 Life expectancy at birth (Female) 2013 - 15 n/a 83.3 83.1 79.4 86.7
24 Infant mortality 2013 - 15 28 4.3 3.9 8.2 0.8
25 Killed and seriously injured on roads 2013 - 15 269 51.9 38.5 103.7 10.4
26 Suicide rate 2013 - 15 36 8.1 10.1 17.4 5.6
27 Smoking related deaths 2013 - 15 n/a n/a 283.5
28 Under 75 mortality rate: cardiovascular 2013 - 15 291 68.6 74.6 137.6 43.1
29 Under 75 mortality rate: cancer 2013 - 15 540 126.8 138.8 194.8 98.6
30 Excess winter deaths Aug 2012 - Jul2015
168 13.7 19.6 36.0 6.9Life
exp
ecta
ncy
and
caus
es o
f dea
th
Indicator notes1 Index of Multiple Deprivation (IMD) 2015 2 % children (under 16) in low income families 3 Eligible homeless people not in priority need, crude rate per 1,000 households4 5 A*-C including English & Maths, % pupils at end of key stage 4 resident in local authority 5 Recorded violence against the person crimes, crude rate per 1,000 population6 Crude rate per 1,000 population aged 16-64 7 % of women who smoke at time of delivery 8 % of all mothers who breastfeed their babies in the first 48hrs after delivery9 % school children in Year 6 (age 10-11) 10 Persons under 18 admitted to hospital due to alcohol-specific conditions, crude rate per 100,000 population 11 Under-18conception rate per 1,000 females aged 15 to 17 (crude rate) 12 Current smokers (aged 18 and over), Annual Population Survey 13 % adults (aged 16 and over) achieving atleast 150 mins physical activity per week, Active People Survey 14 % adults (aged 16 and over) classified as overweight or obese, Active People Survey 15 Experimentalstatistics - % of cancers diagnosed at stage 1 or 2 16 Directly age sex standardised rate per 100,000 population 17 Admissions involving an alcohol-related primary diagnosisor an alcohol-related external cause (narrow definition), directly age standardised rate per 100,000 population 18 % people (aged 17 and over) on GP registers with arecorded diagnosis of diabetes 19 Crude rate per 100,000 population 20 All new diagnoses (excluding chlamydia under age 25), crude rate per 100,000 population aged 15 to64 21 Directly age-sex standardised rate of emergency admissions, per 100,000 population aged 65 and over 22, 23 The average number of years a person would expect tolive based on contemporary mortality rates 24 Rate of deaths in infants aged under 1 year per 1,000 live births 25 Rate per 100,000 population 26 Directly age standardisedmortality rate from suicide and injury of undetermined intent per 100,000 population (aged 10 and over) 27 Directly age standardised rate per 100,000 population aged 35 andover 28 Directly age standardised rate per 100,000 population aged under 75 29 Directly age standardised rate per 100,000 population aged under 75 30 Ratio of excesswinter deaths (observed winter deaths minus expected deaths based on non-winter deaths) to average non-winter deaths (three years)
† Indicator has had methodological changes so is not directly comparable with previously released values. € "Regional" refers to the former government regions. ^20 Value based on an average of monthly counts $1 There is a data quality issue with this value
If 25% or more of areas have no data then the England range is not displayed. Please send any enquiries to [email protected]
You may re-use this information (not including logos) free of charge in any format or medium, under the terms of the Open Government Licence. To view this licence, visit www.nationalarchives.gov.uk/doc/open-government-licence/version/3/
www.healthprofiles.infoBasingstoke and Deane - 4 July 20174© Crown Copyright 2017