Embed Size (px)
Citation preview
BASF Creditor Story November 2016 1
BASF Creditor Story
Ulf LoleitSenior Vice President
Treasury
Hong Kong
December 2016
BASF Creditor Story November 2016 2
150 years
Cautionary note regarding
forward-looking statements
This presentation may contain forward-looking statements that are subject to risks and
uncertainties, including those pertaining to the anticipated benefits to be realized from the
proposals described herein. Forward-looking statements may include, in particular, statements
about future events, future financial performance, plans, strategies, expectations, prospects,
competitive environment, regulation and supply and demand. BASF has based these forward-
looking statements on its views and assumptions with respect to future events and financial
performance. Actual financial performance could differ materially from that projected in the
forward-looking statements due to the inherent uncertainty of estimates, forecasts and
projections, and financial performance may be better or worse than anticipated. Given these
uncertainties, readers should not put undue reliance on any forward-looking statements. The
information contained in this presentation is subject to change without notice and BASF does
not undertake any duty to update the forward-looking statements, and the estimates and
assumptions associated with them, except to the extent required by applicable laws and
regulations.
BASF Creditor Story November 2016 3
BASF at a glance
Business review & outlook
Path forward
Financing highlights
BASF Creditor Story November 2016 4
150 years
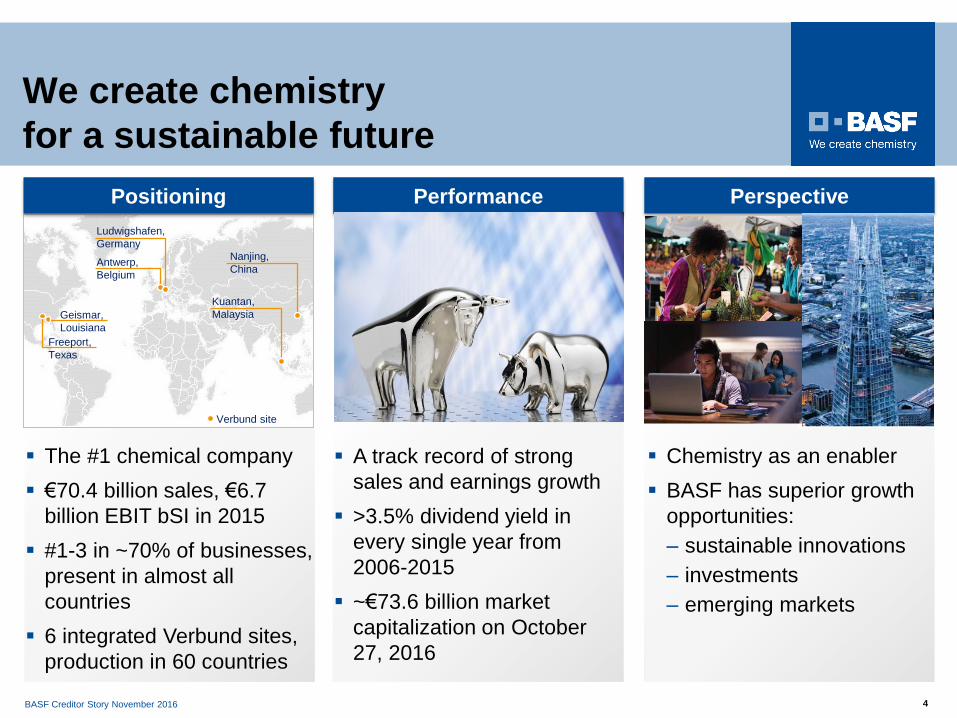
Chemistry as an enabler
BASF has superior growth
opportunities:
– sustainable innovations
– investments
– emerging markets
The #1 chemical company
€70.4 billion sales, €6.7
billion EBIT bSI in 2015
#1-3 in ~70% of businesses,
present in almost all
countries
6 integrated Verbund sites,
production in 60 countries
A track record of strong
sales and earnings growth
>3.5% dividend yield in
every single year from
2006-2015
~€73.6 billion market
capitalization on October
27, 2016
Perspective
Ludwigshafen,
Germany
Antwerp,
Belgium
Nanjing,
China
Kuantan,
MalaysiaGeismar,
Louisiana
Freeport,
Texas
Verbund site
Positioning
We create chemistry
for a sustainable future
Performance
BASF Creditor Story November 2016 5
150 years
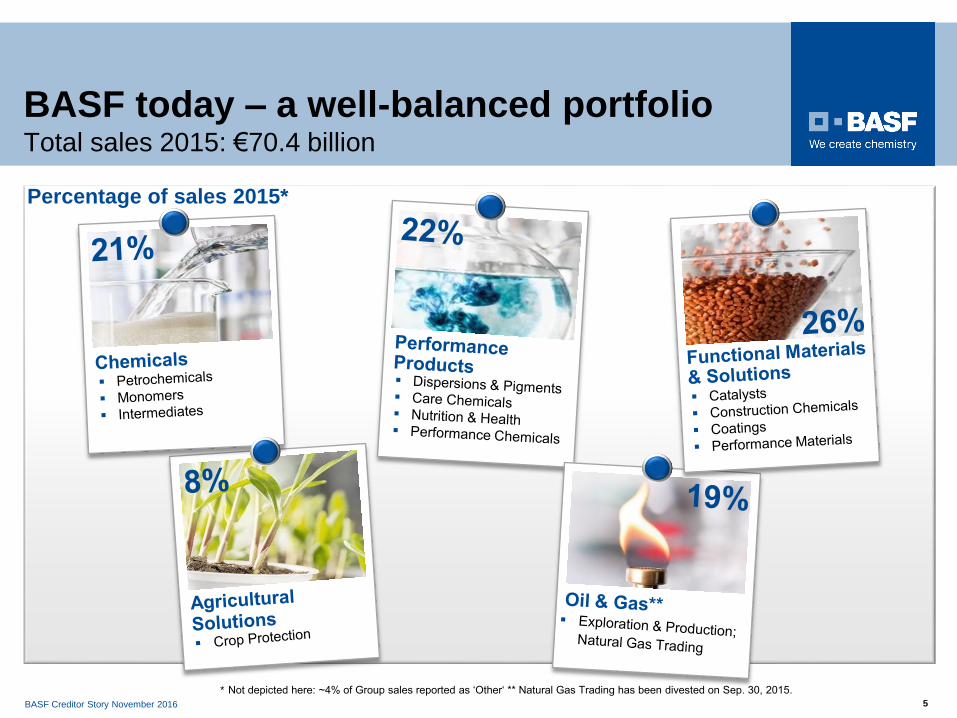
Percentage of sales 2015*
* Not depicted here: ~4% of Group sales reported as ‘Other‘ ** Natural Gas Trading has been divested on Sep. 30, 2015.
BASF today – a well-balanced portfolioTotal sales 2015: €70.4 billion

BASF Creditor Story November 2016 6
150 years
Global reduction in carbon
emissions of 6 million metric
tons p.a. and reduction of
waste
Example Ludwigshafen site:
avoidance of 7 million metric
tons of freight p.a.
= 280,000 fewer truckloads
Shared use of on-site facilities:
fire department, security, waste
water treatment and analytics
Verbund: Unique competitive advantage
* Savings include only tangible synergies. Additional (intangible) benefits and retained profits are not included.
Verbund generates >€1 billion p.a. global cost savings* and supports sustainability
BASF Creditor Story November 2016 7
BASF at a glance
Business review & outlook
Path forward
Financing highlights
BASF Creditor Story November 2016 8
150 years
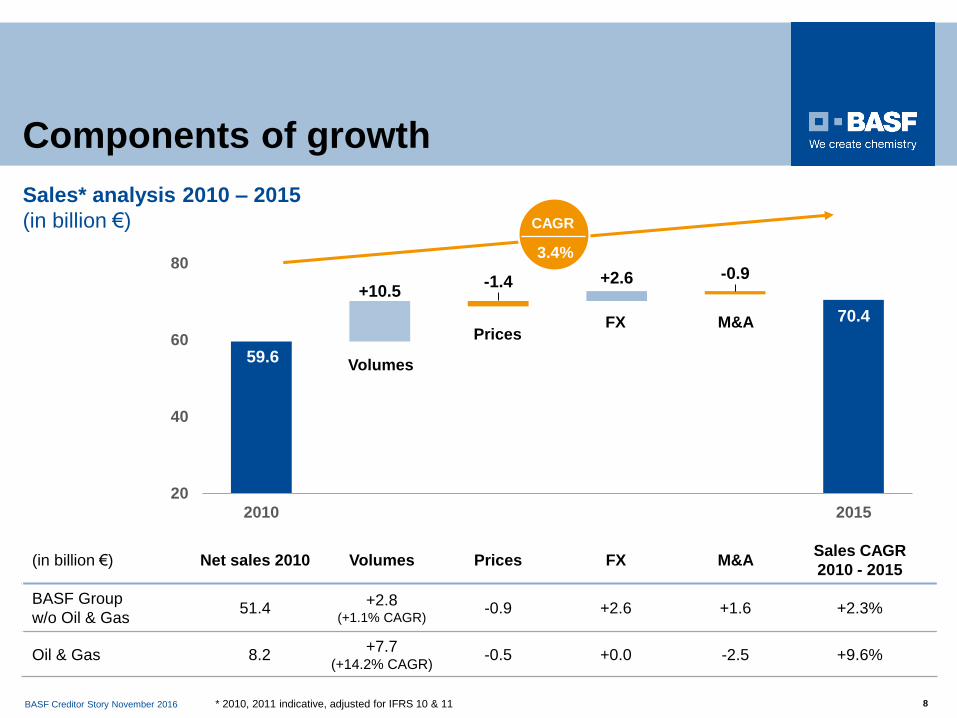
Components of growth
* 2010, 2011 indicative, adjusted for IFRS 10 & 11
59.6
70.4
+10.5-1.4 +2.6 -0.9
20
40
60
80
2010 2015
Volumes
PricesFX M&A
Sales* analysis 2010 – 2015
(in billion €)
(in billion €) Net sales 2010 Volumes Prices FX M&ASales CAGR
2010 - 2015
BASF Group
w/o Oil & Gas51.4
+2.8 (+1.1% CAGR)
-0.9 +2.6 +1.6 +2.3%
Oil & Gas 8.2+7.7
(+14.2% CAGR)-0.5 +0.0 -2.5 +9.6%
3.4%
CAGR
BASF Creditor Story November 2016 9
150 years
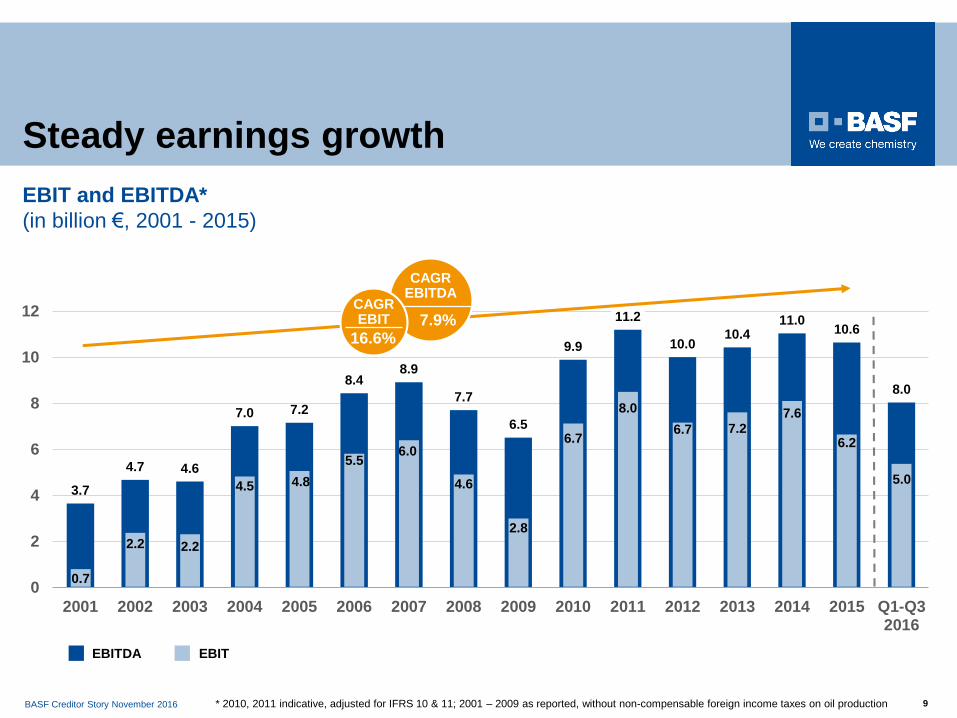
Steady earnings growth
* 2010, 2011 indicative, adjusted for IFRS 10 & 11; 2001 – 2009 as reported, without non-compensable foreign income taxes on oil production
EBIT and EBITDA*
(in billion €, 2001 - 2015)
3.7
4.7 4.6
7.0 7.2
8.48.9
7.7
6.5
9.9
11.2
10.010.4
11.010.6
8.0
0
2
4
6
8
10
12
2001 2002 2003 2004 2005 2006 2007 2008 2009 2010 2011 2012 2013 2014 2015 Q1-Q32016
EBITEBITDA
0.7
2.2 2.2
4.5 4.8
5.56.0
4.6
2.8
6.7
8.0
6.7 7.27.6
6.2
5.0
CAGREBITDA
7.9%CAGREBIT
16.6%
BASF Creditor Story November 2016 10
150 years
0
1
2
3
4
5
2007 2008 2009** 2010 2011 2012 2013 2014 2015 Q1-Q32016
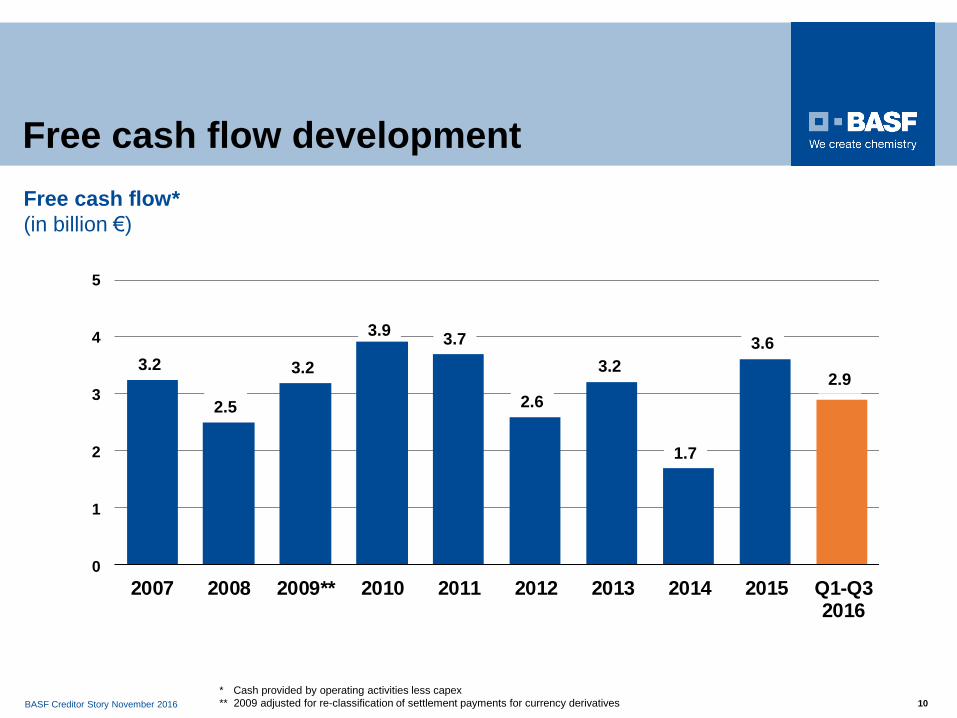
Free cash flow development
* Cash provided by operating activities less capex
** 2009 adjusted for re-classification of settlement payments for currency derivatives
Free cash flow*
(in billion €)
3.2
2.5
3.2
3.93.7
2.6
3.2
1.7
3.6
2.9
BASF Creditor Story November 2016 11
150 years
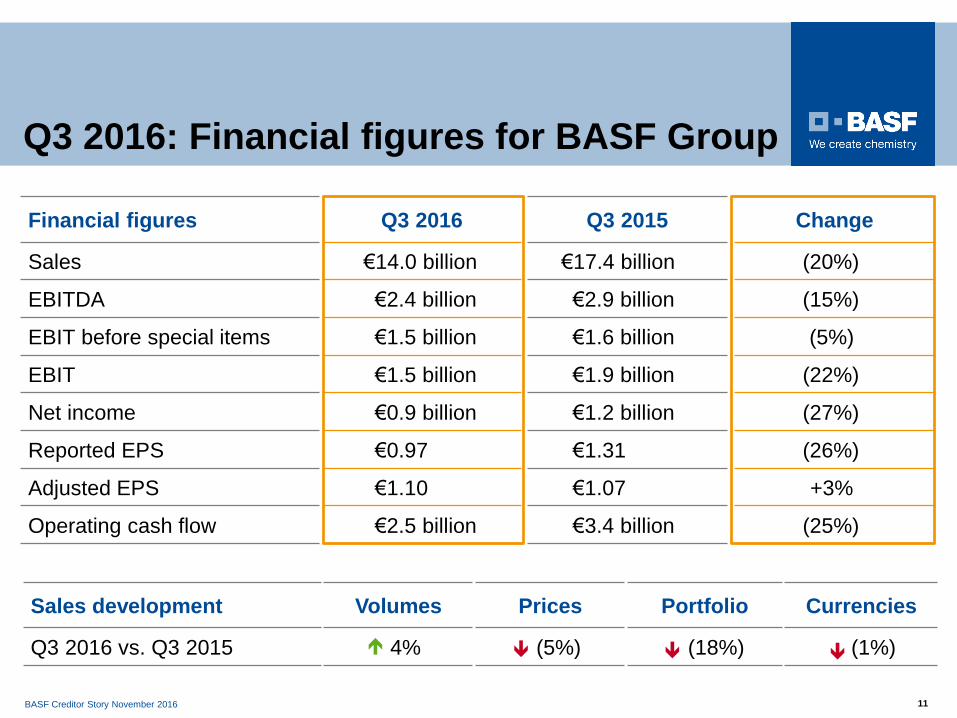
Q3 2016: Financial figures for BASF Group
Financial figures Q3 2016 Q3 2015 Change
Sales €14.0 billion €17.4 billion (20%)
EBITDA €2.4 billion €2.9 billion (15%)
EBIT before special items €1.5 billion €1.6 billion (5%)
EBIT €1.5 billion €1.9 billion (22%)
Net income €0.9 billion €1.2 billion (27%)
Reported EPS €0.97 €1.31 (26%)
Adjusted EPS €1.10 €1.07 +3%
Operating cash flow €2.5 billion €3.4 billion (25%)
Sales development Volumes Prices Portfolio Currencies
Q3 2016 vs. Q3 2015 4% (5%) (18%) (1%)
BASF Creditor Story November 2016 12
150 years
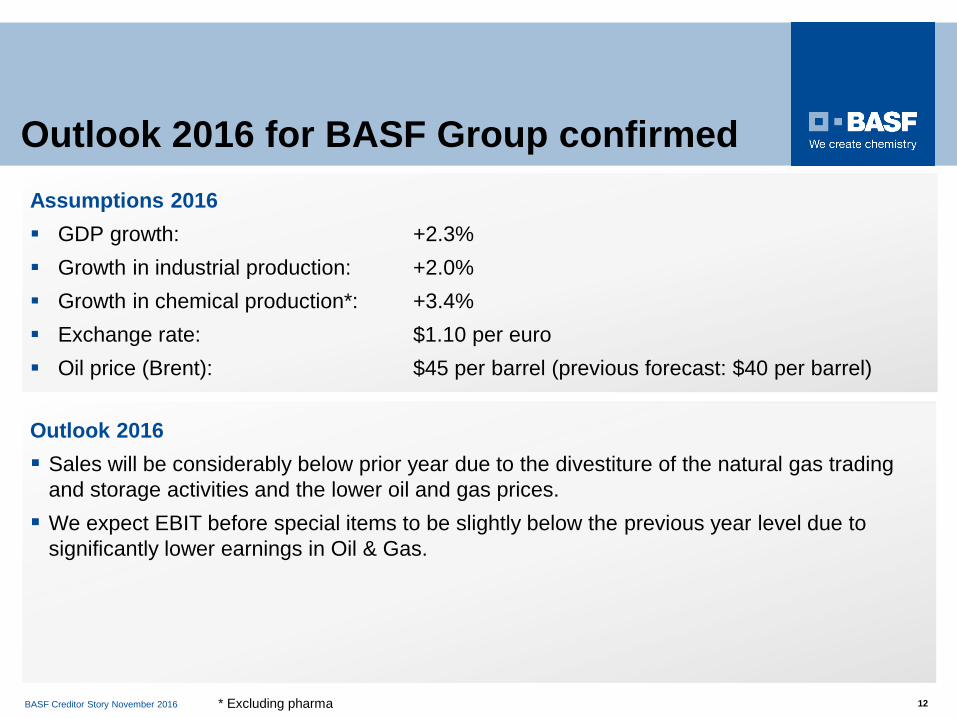
Outlook 2016 for BASF Group confirmed
Outlook 2016
Sales will be considerably below prior year due to the divestiture of the natural gas trading
and storage activities and the lower oil and gas prices.
We expect EBIT before special items to be slightly below the previous year level due to
significantly lower earnings in Oil & Gas.
Assumptions 2016
GDP growth: +2.3%
Growth in industrial production: +2.0%
Growth in chemical production*: +3.4%
Exchange rate: $1.10 per euro
Oil price (Brent): $45 per barrel (previous forecast: $40 per barrel)
* Excluding pharma
BASF Creditor Story November 2016 13
BASF at a glance
Business review & outlook
Path forward
Financing highlights
BASF Creditor Story November 2016 14
150 years
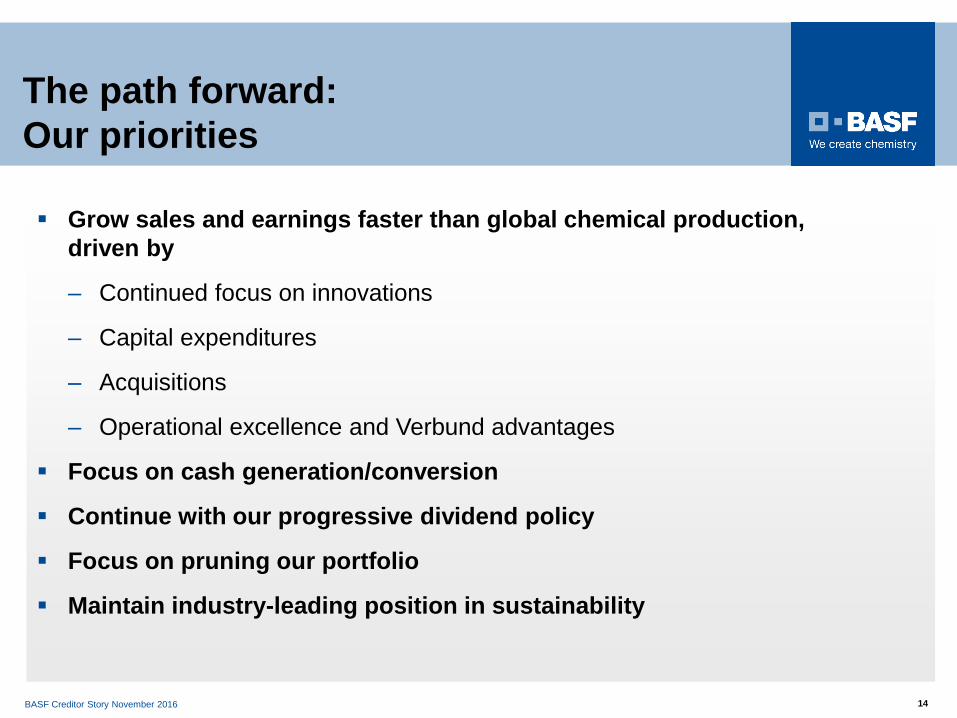
Grow sales and earnings faster than global chemical production,
driven by
– Continued focus on innovations
– Capital expenditures
– Acquisitions
– Operational excellence and Verbund advantages
Focus on cash generation/conversion
Continue with our progressive dividend policy
Focus on pruning our portfolio
Maintain industry-leading position in sustainability
The path forward:
Our priorities
BASF Creditor Story November 2016 15
150 years
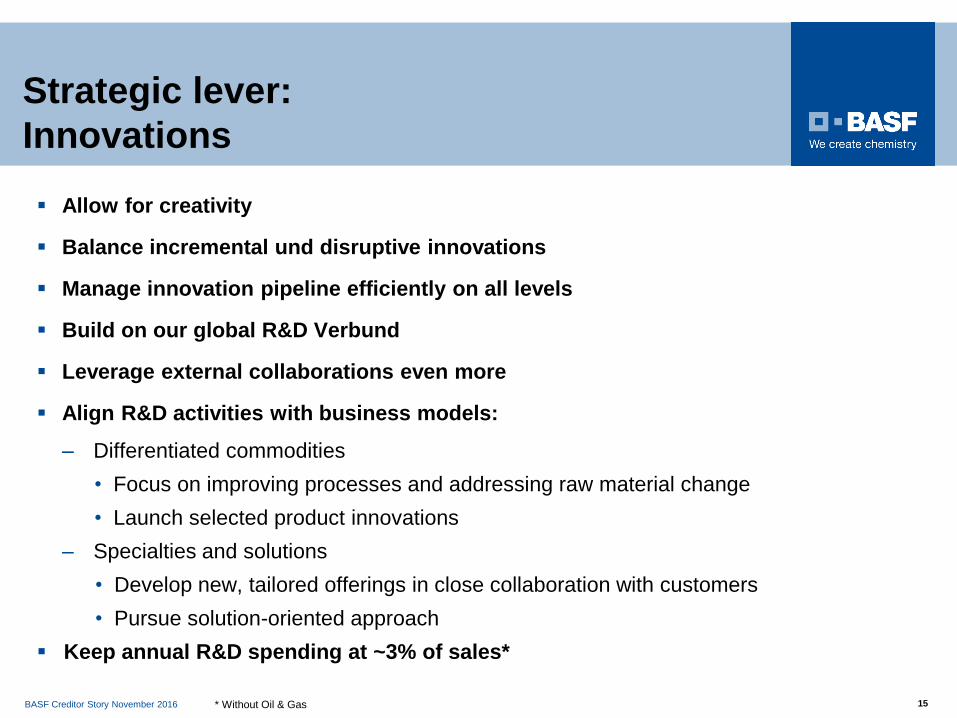
Strategic lever:
Innovations
Allow for creativity
Balance incremental und disruptive innovations
Manage innovation pipeline efficiently on all levels
Build on our global R&D Verbund
Leverage external collaborations even more
Align R&D activities with business models:
– Differentiated commodities
• Focus on improving processes and addressing raw material change
• Launch selected product innovations
– Specialties and solutions
• Develop new, tailored offerings in close collaboration with customers
• Pursue solution-oriented approach
Keep annual R&D spending at ~3% of sales*
* Without Oil & Gas
BASF Creditor Story November 2016 16
150 years
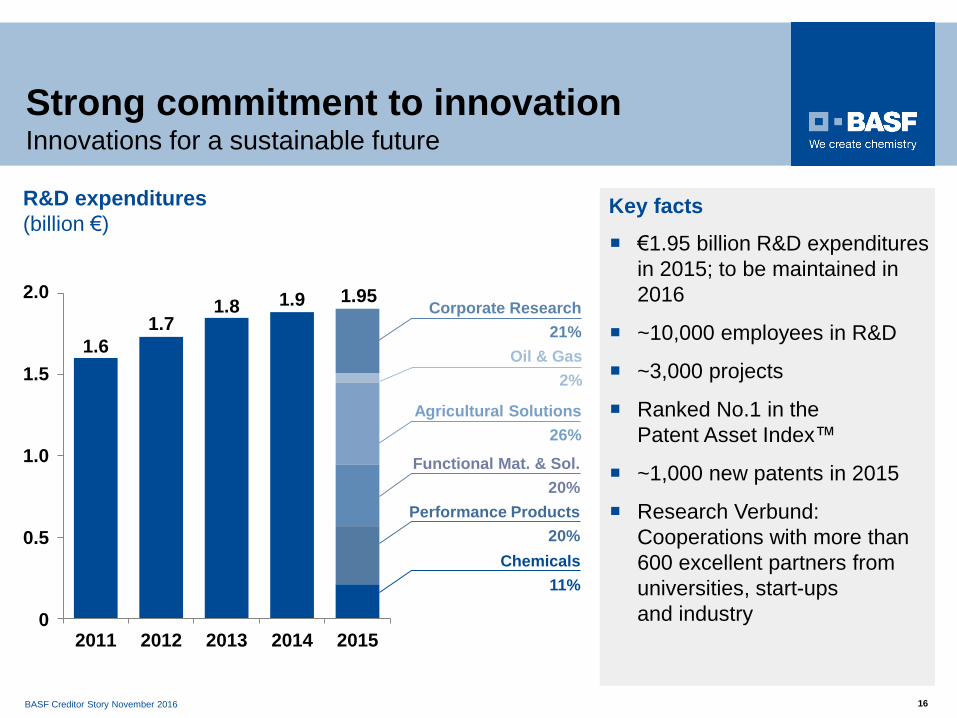
€1.95 billion R&D expenditures
in 2015; to be maintained in
2016
~10,000 employees in R&D
~3,000 projects
Ranked No.1 in the
Patent Asset Index™
~1,000 new patents in 2015
Research Verbund:
Cooperations with more than
600 excellent partners from
universities, start-ups
and industry
Strong commitment to innovationInnovations for a sustainable future
Key facts
1.6
1.71.8 1.9 1.95
0.0
0.5
1.0
1.5
2.0
2011 2012 2013 2014 2015
R&D expenditures
(billion €)
Chemicals
11%
Performance Products
20%
Functional Mat. & Sol.
20%
Agricultural Solutions
26%
Oil & Gas
2%
Corporate Research
21%
2.0
1.5
1.0
0.5
0
BASF Creditor Story November 2016 17
150 years
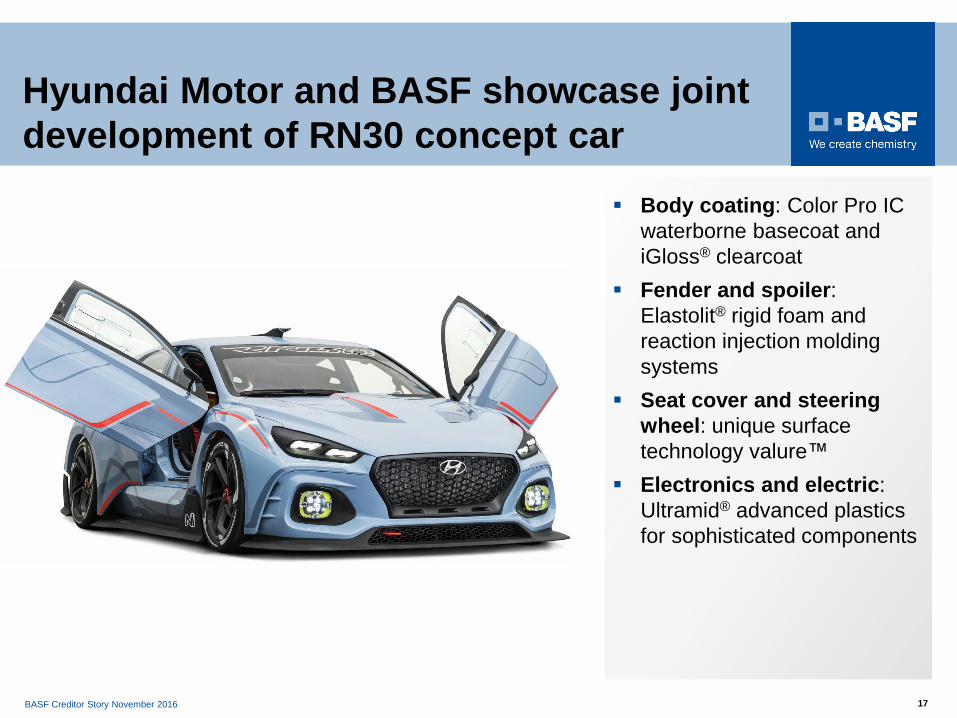
Hyundai Motor and BASF showcase joint
development of RN30 concept car
Body coating: Color Pro IC
waterborne basecoat and
iGloss® clearcoat
Fender and spoiler:
Elastolit® rigid foam and
reaction injection molding
systems
Seat cover and steering
wheel: unique surface
technology valure™
Electronics and electric:
Ultramid® advanced plastics
for sophisticated components
BASF Creditor Story November 2016 18
150 years
Strategic lever:
Capital expenditures
Differentiated commodities
With proprietary technology and/or Verbund advantages
Focus on:
– emerging markets
– backward integration in the U.S.
– upgrading our asset base in Europe
Specialties and solutions
Incremental investments for new products
Regional expansion of businesses
Oil & Gas
Focus investment budget by active portfolio optimization to secure free cash flow
Keep reserve-to-production ratio of approx. 10 years
BASF Creditor Story November 2016 19
150 years
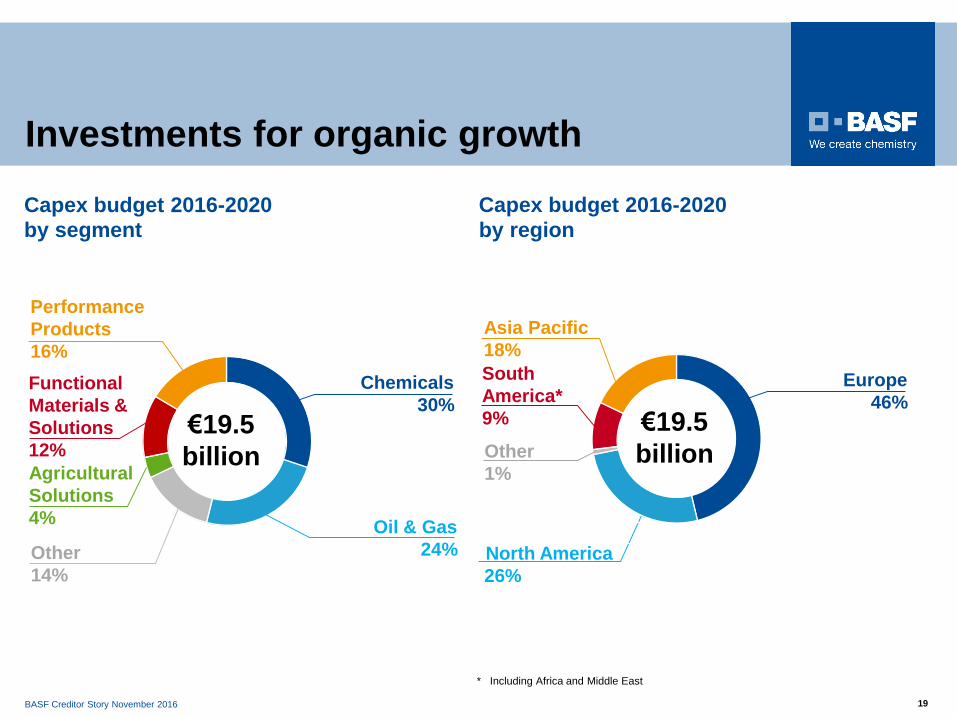
Investments for organic growth
Performance
Products
16%
Oil & Gas
24%
€19.5
billion
Functional
Materials &
Solutions
12%
Capex budget 2016-2020
Other
14%
Chemicals
30%
Capex budget 2016-2020
Asia Pacific
18%
€19.5
billion
South
America*
9%
North America
26%
Europe
46%
Agricultural
Solutions
4%
Other
1%
by segment by region
* Including Africa and Middle East
BASF Creditor Story November 2016 20
150 years
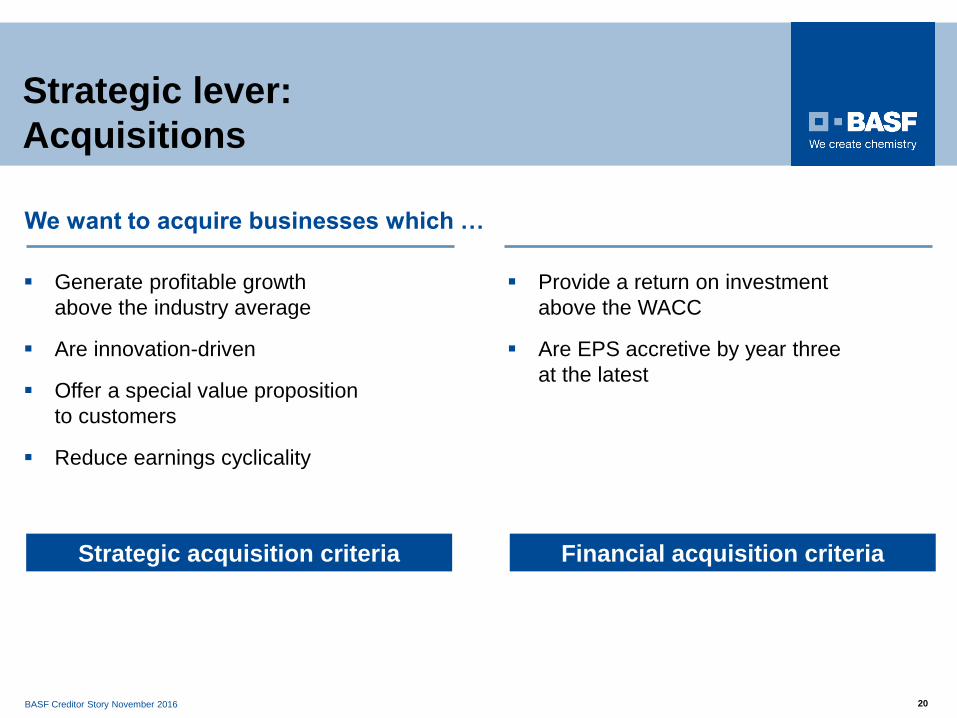
Provide a return on investment
above the WACC
Are EPS accretive by year three
at the latest
Financial acquisition criteria
Generate profitable growth
above the industry average
Are innovation-driven
Offer a special value proposition
to customers
Reduce earnings cyclicality
Strategic acquisition criteria
We want to acquire businesses which …
Strategic lever:
Acquisitions
BASF Creditor Story November 2016 21
150 years
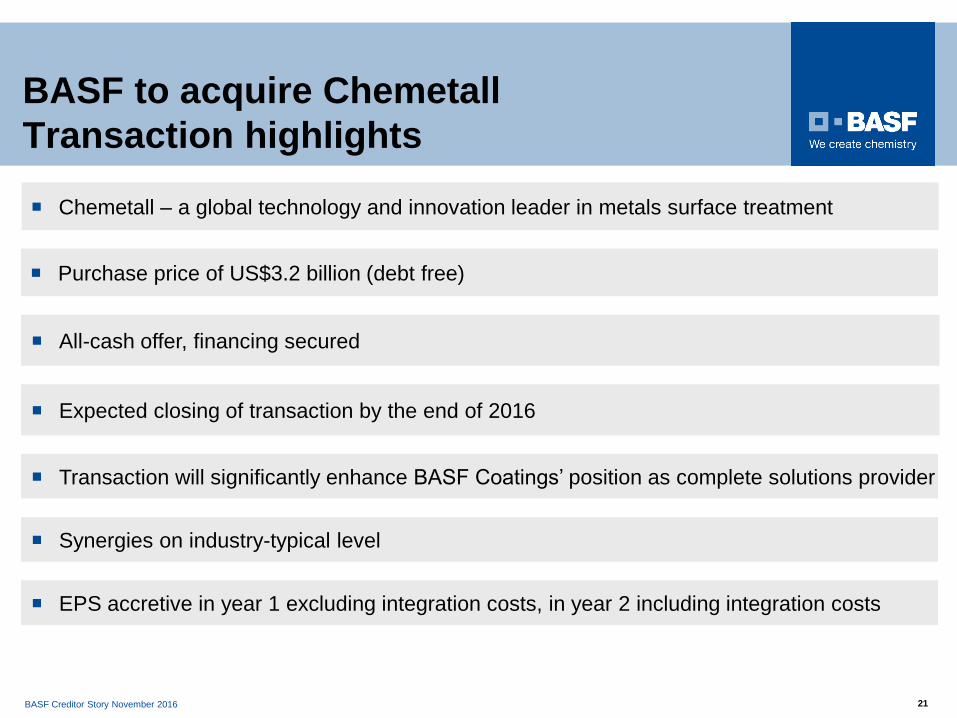
BASF to acquire Chemetall
Transaction highlights
Purchase price of US$3.2 billion (debt free)
All-cash offer, financing secured
Expected closing of transaction by the end of 2016
Synergies on industry-typical level
EPS accretive in year 1 excluding integration costs, in year 2 including integration costs
Transaction will significantly enhance BASF Coatings’ position as complete solutions provider
Chemetall – a global technology and innovation leader in metals surface treatment
BASF Creditor Story November 2016 22
150 years
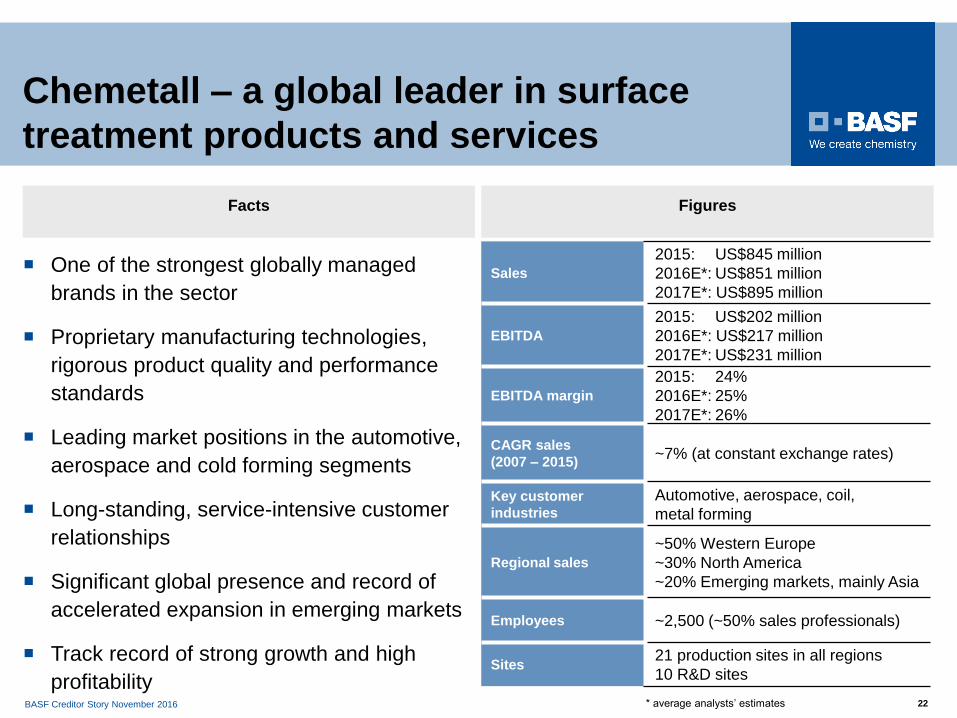
Chemetall – a global leader in surface
treatment products and services
FiguresFacts
Sales
2015: US$845 million
2016E*: US$851 million
2017E*: US$895 million
EBITDA
2015: US$202 million
2016E*: US$217 million
2017E*: US$231 million
EBITDA margin
2015: 24%
2016E*: 25%
2017E*: 26%
CAGR sales
(2007 – 2015)~7% (at constant exchange rates)
Key customer
industries
Automotive, aerospace, coil,
metal forming
Regional sales
~50% Western Europe
~30% North America
~20% Emerging markets, mainly Asia
Employees ~2,500 (~50% sales professionals)
Sites21 production sites in all regions
10 R&D sites
One of the strongest globally managed
brands in the sector
Proprietary manufacturing technologies,
rigorous product quality and performance
standards
Leading market positions in the automotive,
aerospace and cold forming segments
Long-standing, service-intensive customer
relationships
Significant global presence and record of
accelerated expansion in emerging markets
Track record of strong growth and high
profitability* average analysts’ estimates
BASF Creditor Story November 2016 23
150 years
0
1,000
2,000
3,000
4,000
2015 2018
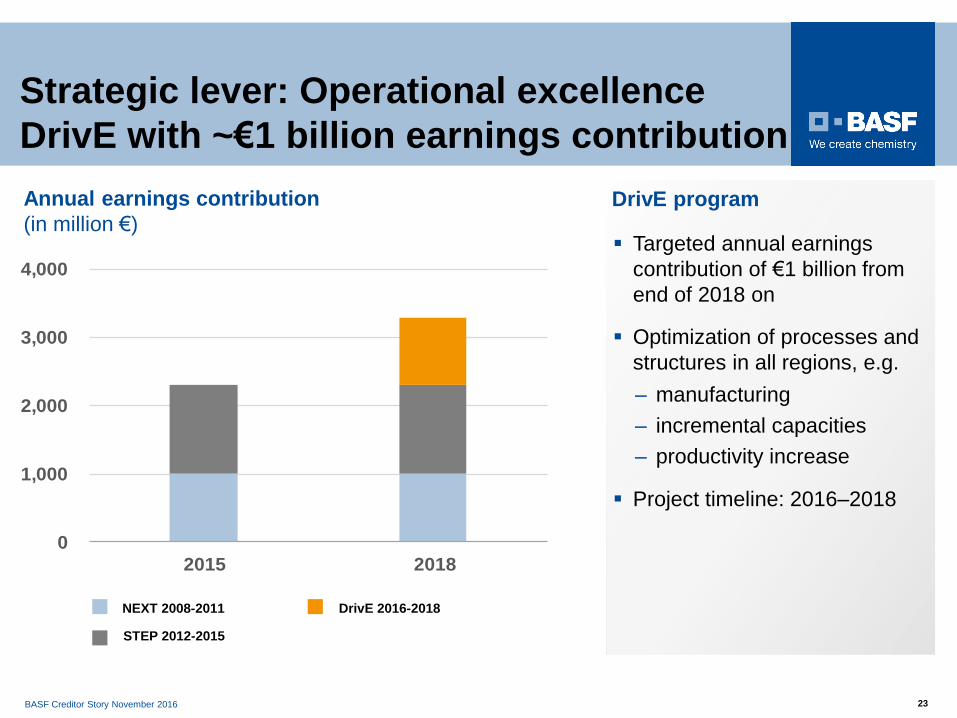
Annual earnings contribution
(in million €) Targeted annual earnings
contribution of €1 billion from
end of 2018 on
Optimization of processes and
structures in all regions, e.g.
– manufacturing
– incremental capacities
– productivity increase
Project timeline: 2016–2018
DrivE program
Strategic lever: Operational excellence
DrivE with ~€1 billion earnings contribution
NEXT 2008-2011 DrivE 2016-2018
STEP 2012-2015
BASF Creditor Story November 2016 24
150 years
50
100
150
200
250
300
350
2001 2002 2003 2004 2005 2006 2007 2008 2009 2010 2011 2012 2013 2014 2015
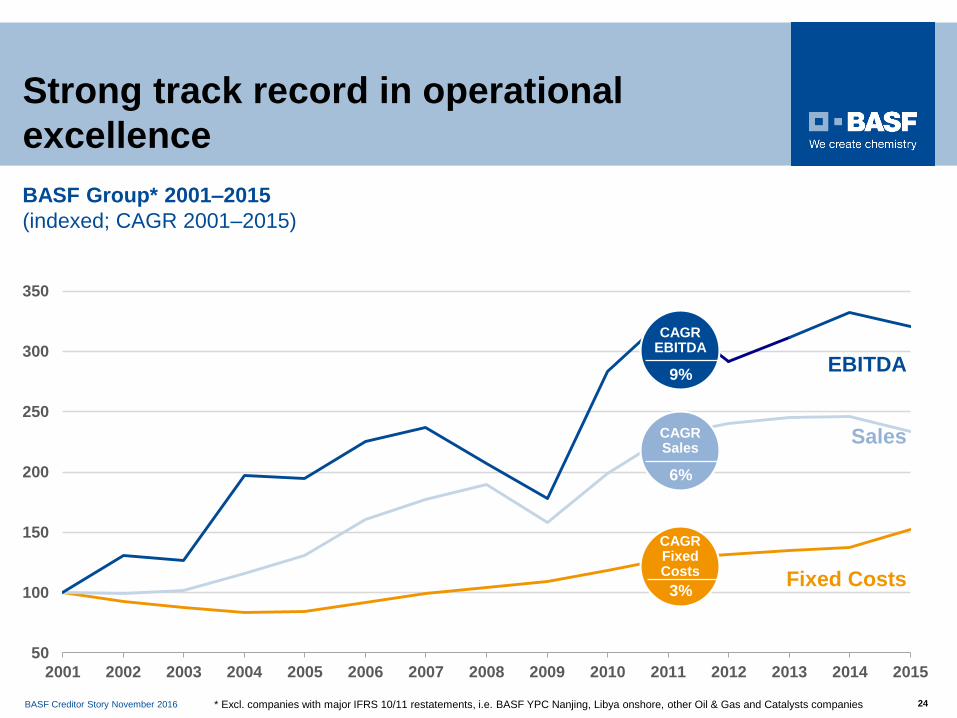
Strong track record in operational
excellence
EBITDA
Sales
* Excl. companies with major IFRS 10/11 restatements, i.e. BASF YPC Nanjing, Libya onshore, other Oil & Gas and Catalysts companies
BASF Group* 2001–2015
(indexed; CAGR 2001–2015)
Fixed Costs
CAGREBITDA
9%
CAGRSales
6%
CAGRFixed Costs
3%
BASF Creditor Story November 2016 25
150 years
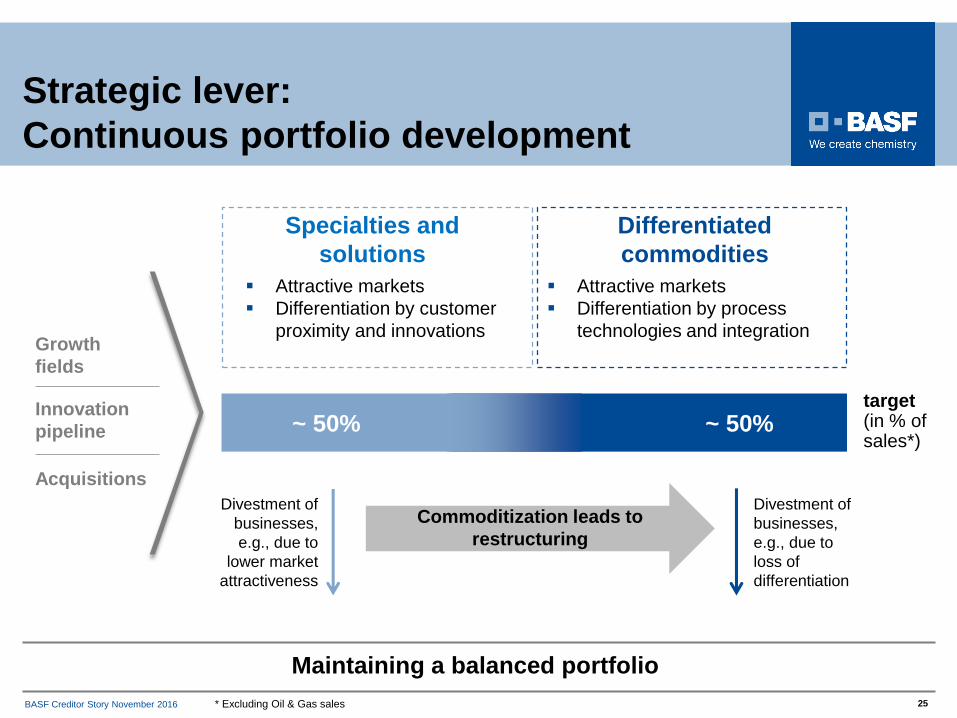
Strategic lever:
Continuous portfolio development
Specialties and
solutions
Differentiated
commodities
target(in % of sales*)
~ 50% ~ 50%
Maintaining a balanced portfolio
Divestment of
businesses,
e.g., due to
loss of
differentiation
Divestment of
businesses,
e.g., due to
lower market
attractiveness
Commoditization leads to
restructuring
Growth
fields
Innovation
pipeline
Acquisitions
* Excluding Oil & Gas sales
Attractive markets
Differentiation by process
technologies and integration
Attractive markets
Differentiation by customer
proximity and innovations
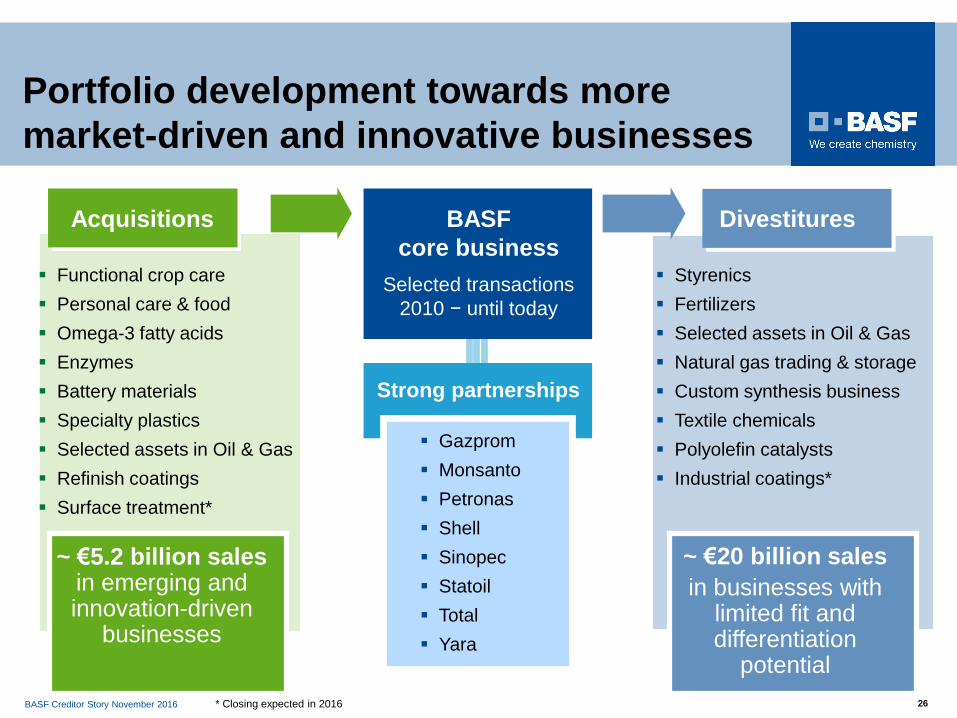
BASF Creditor Story November 2016 26
150 years
Functional crop care
Personal care & food
Omega-3 fatty acids
Enzymes
Battery materials
Specialty plastics
Selected assets in Oil & Gas
Refinish coatings
Surface treatment*
BASF
core business
Strong partnerships
Gazprom
Monsanto
Petronas
Shell
Sinopec
Statoil
Total
Yara
Selected transactions
2010 − until today
Acquisitions
~ €5.2 billion salesin emerging and innovation-driven
businesses
Divestitures
Styrenics
Fertilizers
Selected assets in Oil & Gas
Natural gas trading & storage
Custom synthesis business
Textile chemicals
Polyolefin catalysts
Industrial coatings*
~ €20 billion sales
in businesses with limited fit and differentiation
potential
Portfolio development towards more
market-driven and innovative businesses
* Closing expected in 2016
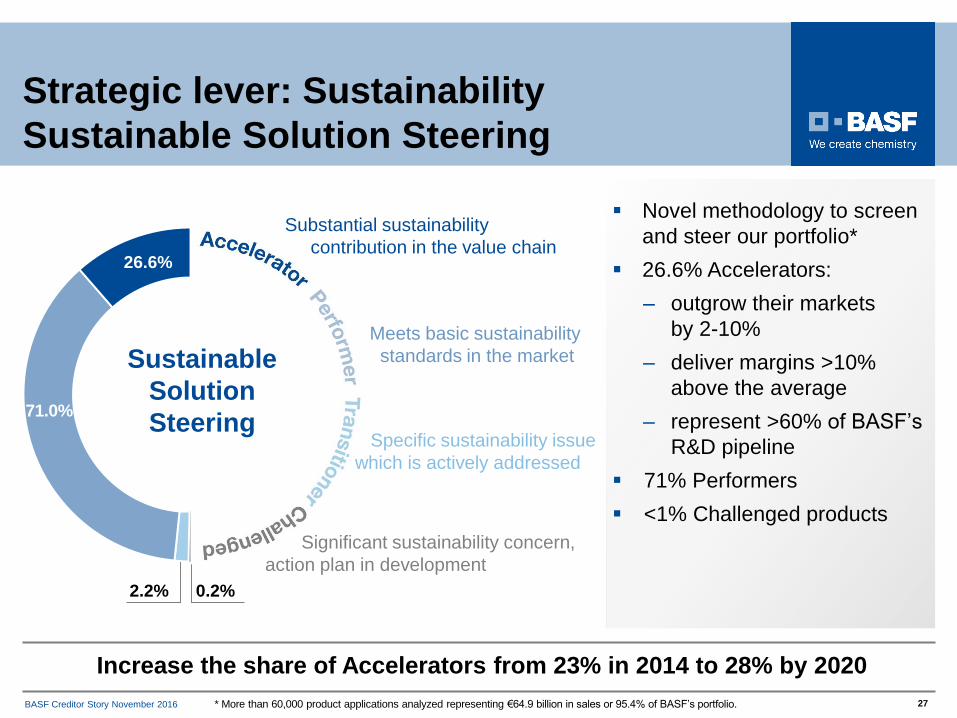
BASF Creditor Story November 2016 27
150 years
2.2% 0.2%
Novel methodology to screen
and steer our portfolio*
26.6% Accelerators:
– outgrow their markets
by 2-10%
– deliver margins >10%
above the average
– represent >60% of BASF’s
R&D pipeline
71% Performers
<1% Challenged products
* More than 60,000 product applications analyzed representing €64.9 billion in sales or 95.4% of BASF’s portfolio.
Increase the share of Accelerators from 23% in 2014 to 28% by 2020
Strategic lever: Sustainability
Sustainable Solution Steering
26.6%
71.0%
Substantial sustainability
contribution in the value chain
Meets basic sustainability
standards in the market
Specific sustainability issue
which is actively addressed
Significant sustainability concern,
action plan in development
Sustainable
Solution
Steering
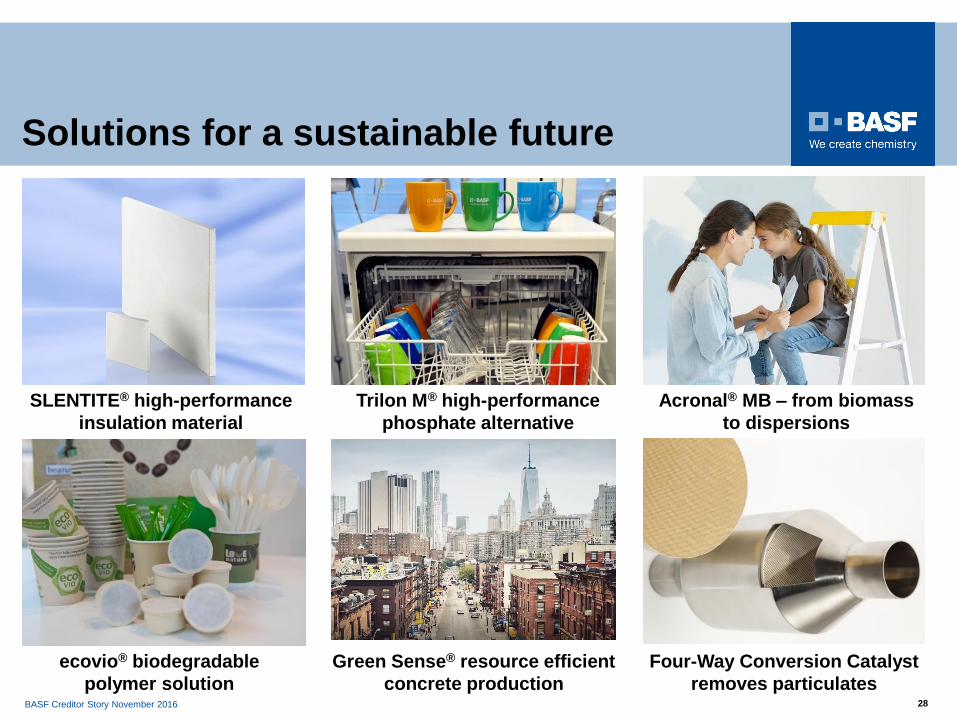
BASF Creditor Story November 2016 28
150 years
Four-Way Conversion Catalyst
removes particulates
Trilon M® high-performance
phosphate alternative
SLENTITE® high-performance
insulation material
ecovio® biodegradable
polymer solution
Green Sense® resource efficient
concrete production
Solutions for a sustainable future
Acronal® MB – from biomass
to dispersions
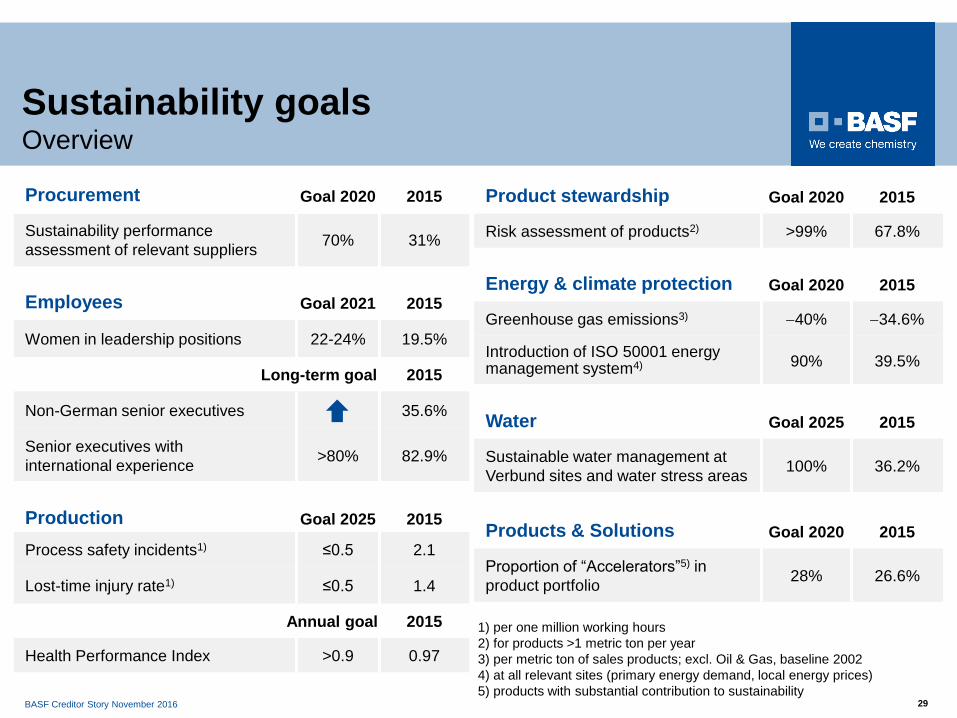
BASF Creditor Story November 2016 29
150 years
Sustainability goalsOverview
Procurement Goal 2020 2015
Sustainability performance
assessment of relevant suppliers70% 31%
Employees Goal 2021 2015
Women in leadership positions 22-24% 19.5%
Long-term goal 2015
Non-German senior executives 35.6%
Senior executives with
international experience >80% 82.9%
Production Goal 2025 2015
Process safety incidents1) ≤0.5 2.1
Lost-time injury rate1) ≤0.5 1.4
Annual goal 2015
Health Performance Index >0.9 0.97
Product stewardship Goal 2020 2015
Risk assessment of products2) >99% 67.8%
Energy & climate protection Goal 2020 2015
Greenhouse gas emissions3) -40% -34.6%
Introduction of ISO 50001 energy management system4) 90% 39.5%
Water Goal 2025 2015
Sustainable water management at
Verbund sites and water stress areas100% 36.2%
Products & Solutions Goal 2020 2015
Proportion of “Accelerators”5) in
product portfolio28% 26.6%
1) per one million working hours
2) for products >1 metric ton per year
3) per metric ton of sales products; excl. Oil & Gas, baseline 2002
4) at all relevant sites (primary energy demand, local energy prices)
5) products with substantial contribution to sustainability
BASF Creditor Story November 2016 30
150 years
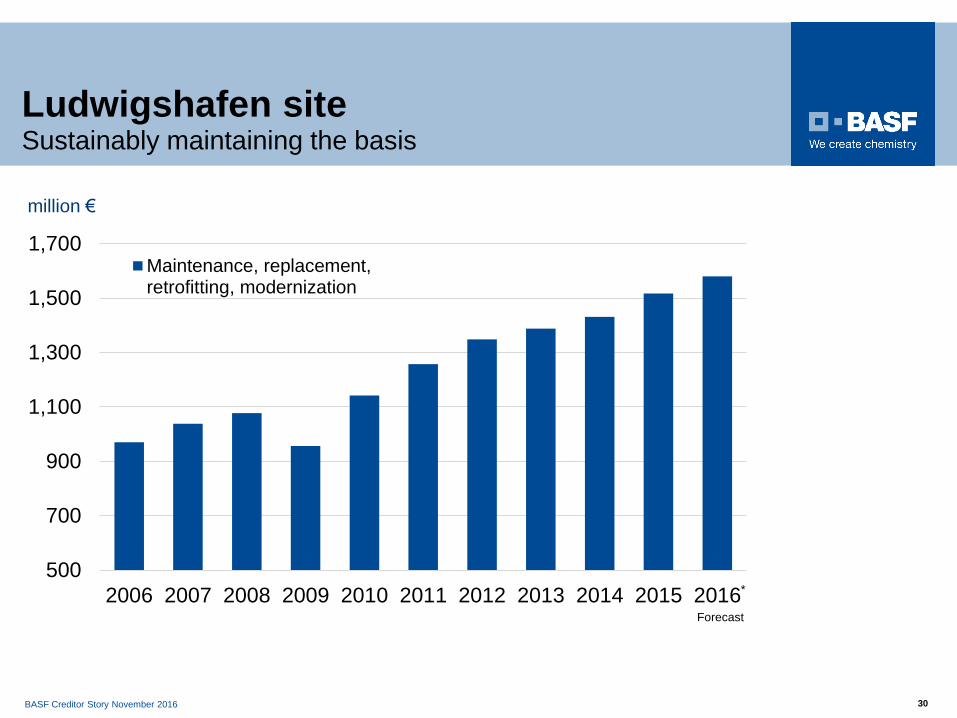
Ludwigshafen siteSustainably maintaining the basis
500
700
900
1,100
1,300
1,500
1,700
2006 2007 2008 2009 2010 2011 2012 2013 2014 2015 2016
Maintenance, replacement,retrofitting, modernization
Forecast
*
million €
BASF Creditor Story November 2016 31
150 years
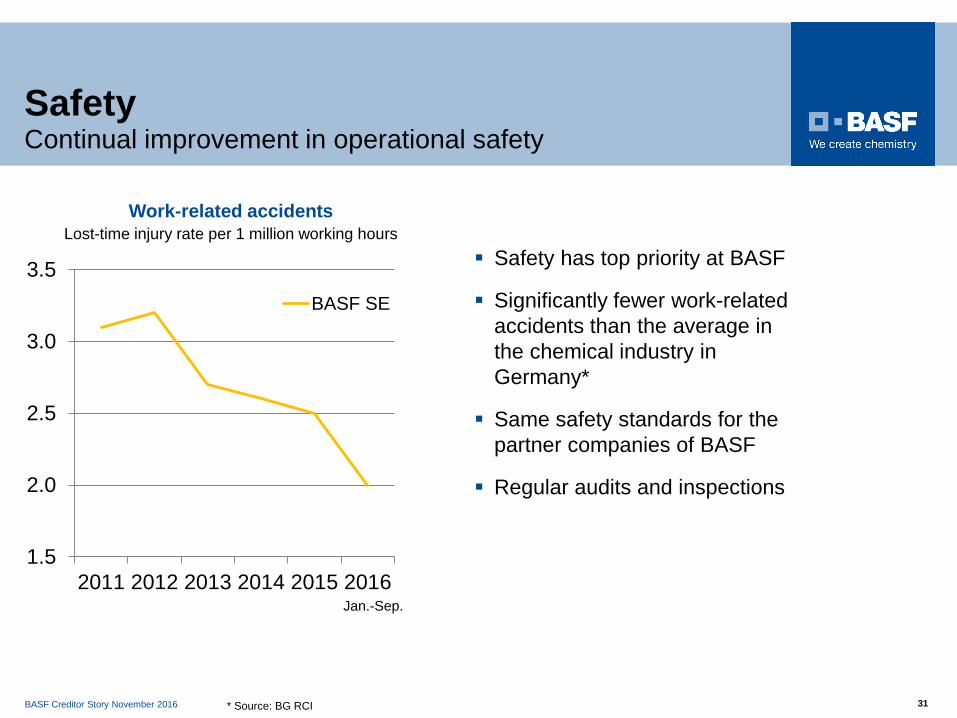
SafetyContinual improvement in operational safety
1.5
2.0
2.5
3.0
3.5
2011 2012 2013 2014 2015 2016
BASF SE
Jan.-Sep.
Work-related accidentsLost-time injury rate per 1 million working hours
* Source: BG RCI
Safety has top priority at BASF
Significantly fewer work-related
accidents than the average in
the chemical industry in
Germany*
Same safety standards for the
partner companies of BASF
Regular audits and inspections
BASF Creditor Story November 2016 32
150 years
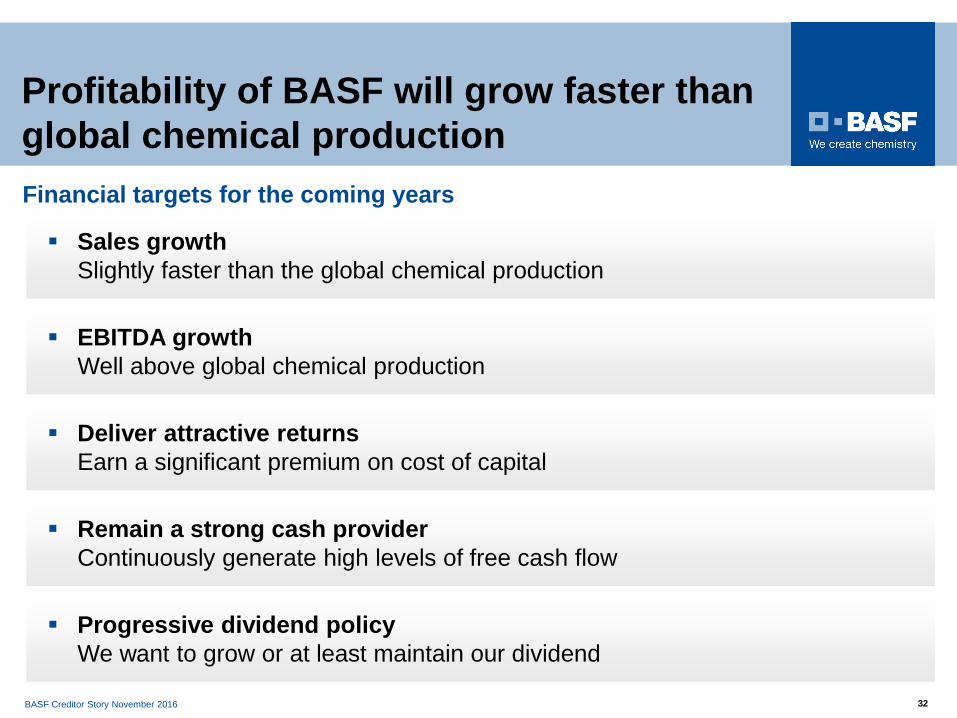
Profitability of BASF will grow faster than
global chemical production
Sales growth
Slightly faster than the global chemical production
EBITDA growth
Well above global chemical production
Remain a strong cash provider
Continuously generate high levels of free cash flow
Financial targets for the coming years
Deliver attractive returns
Earn a significant premium on cost of capital
Progressive dividend policy
We want to grow or at least maintain our dividend
BASF Creditor Story November 2016 33
BASF at a glance
Business review & outlook
Path forward
Financing highlights
BASF Creditor Story November 2016 34
150 years
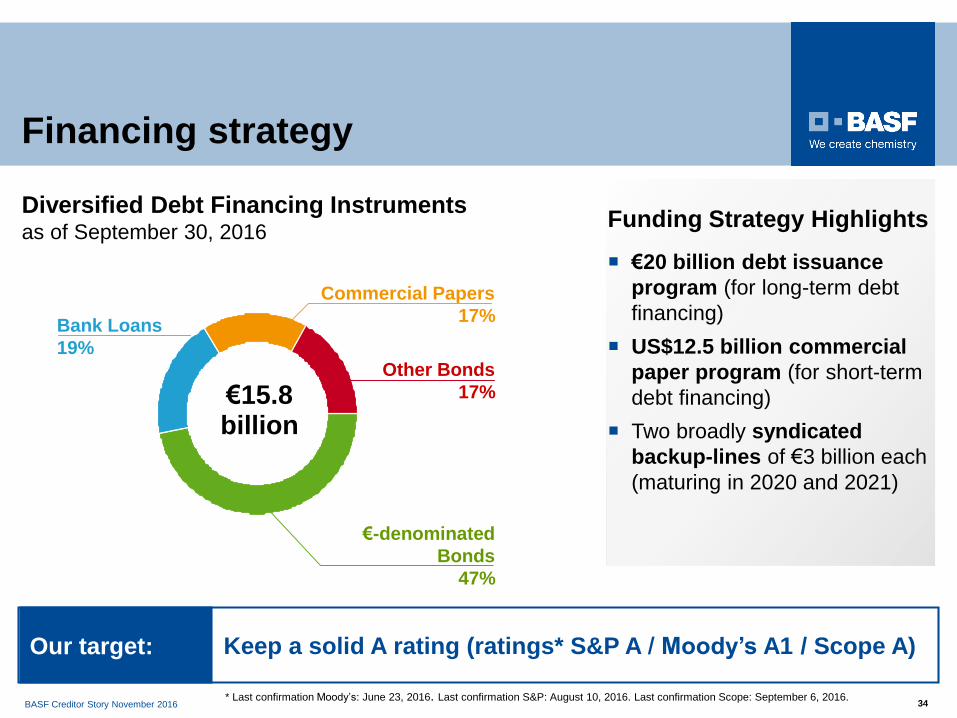
Financing strategy
Diversified Debt Financing Instrumentsas of September 30, 2016
€20 billion debt issuance
program (for long-term debt
financing)
US$12.5 billion commercial
paper program (for short-term
debt financing)
Two broadly syndicated
backup-lines of €3 billion each
(maturing in 2020 and 2021)
Funding Strategy Highlights
Commercial Papers
17%Bank Loans
19%
€-denominated
Bonds
47%
€15.8billion
Keep a solid A rating (ratings* S&P A / Moody’s A1 / Scope A)Our target:
* Last confirmation Moody’s: June 23, 2016. Last confirmation S&P: August 10, 2016. Last confirmation Scope: September 6, 2016.
Other Bonds
17%
BASF Creditor Story November 2016 35
150 years
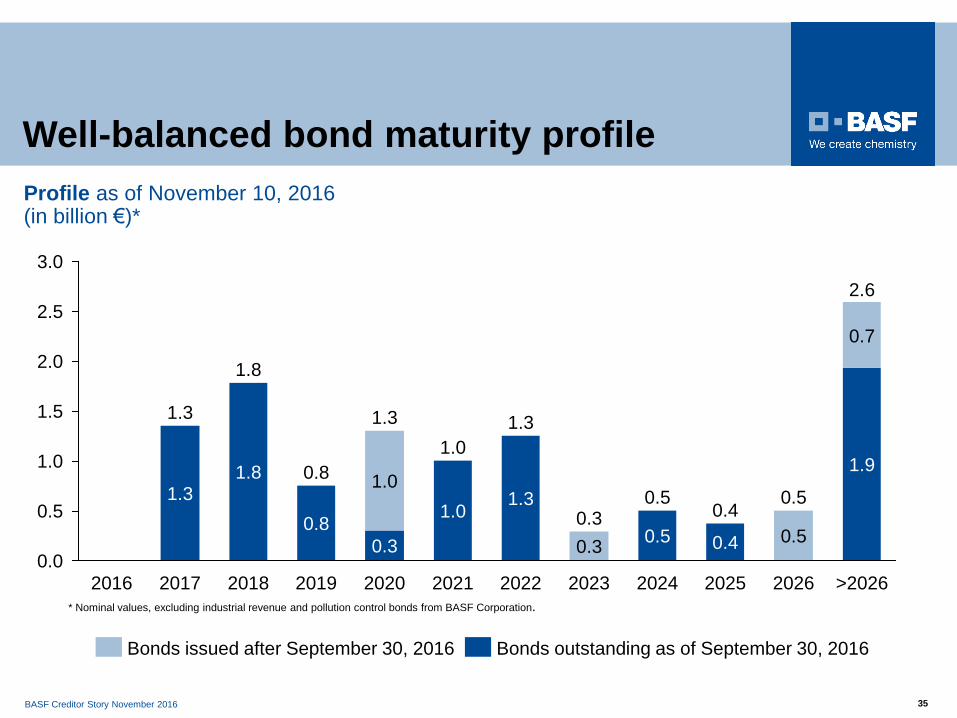
* Nominal values, excluding industrial revenue and pollution control bonds from BASF Corporation.
Profile as of November 10, 2016 (in billion €)*
Well-balanced bond maturity profile
1.0
2.0
2.5
0.5
0.0
1.5
3.0
2.6
0.50.4
0.5
0.8
1.31.3
0.3
1.3
0.7
1.0
0.3 0.3 0.40.5 0.5
1.8
1.0
2019
1.01.3
20222018
1.8
2021
0.8
1.9
2016 2020
1.3
2024 >20262025 20262017 2023
Bonds issued after September 30, 2016 Bonds outstanding as of September 30, 2016
BASF Creditor Story November 2016 36
150 years
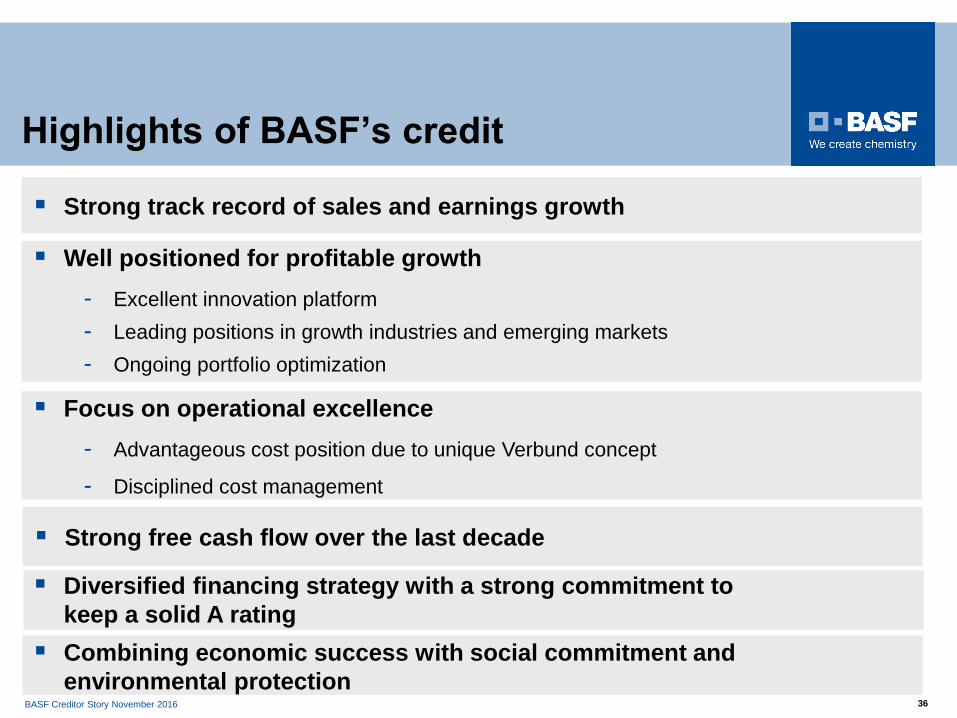
Highlights of BASF’s credit
Strong track record of sales and earnings growth
Combining economic success with social commitment and
environmental protection
Diversified financing strategy with a strong commitment to
keep a solid A rating
Focus on operational excellence
- Advantageous cost position due to unique Verbund concept
- Disciplined cost management
Well positioned for profitable growth
- Excellent innovation platform
- Leading positions in growth industries and emerging markets
- Ongoing portfolio optimization
Strong free cash flow over the last decade
BASF Creditor Story November 2016 37
150 years
BASF Creditor Relations Team
Frank Wilhelmi
Head of Capital Market Financing
Dr. Lars Budde
Senior IR Manager
Creditor Relations
Contact Details:
Email: [email protected]
Phone: +49 621 60 91386
Websites: www.basf.com/bonds
www.basf.com/anleihen
Thomas Langguth
Capital Market Financing
Niklas Friese
Capital Market Financing
BASF Creditor Story November 2016 38
150 years
BASF Creditor Story November 2016 39
150 years
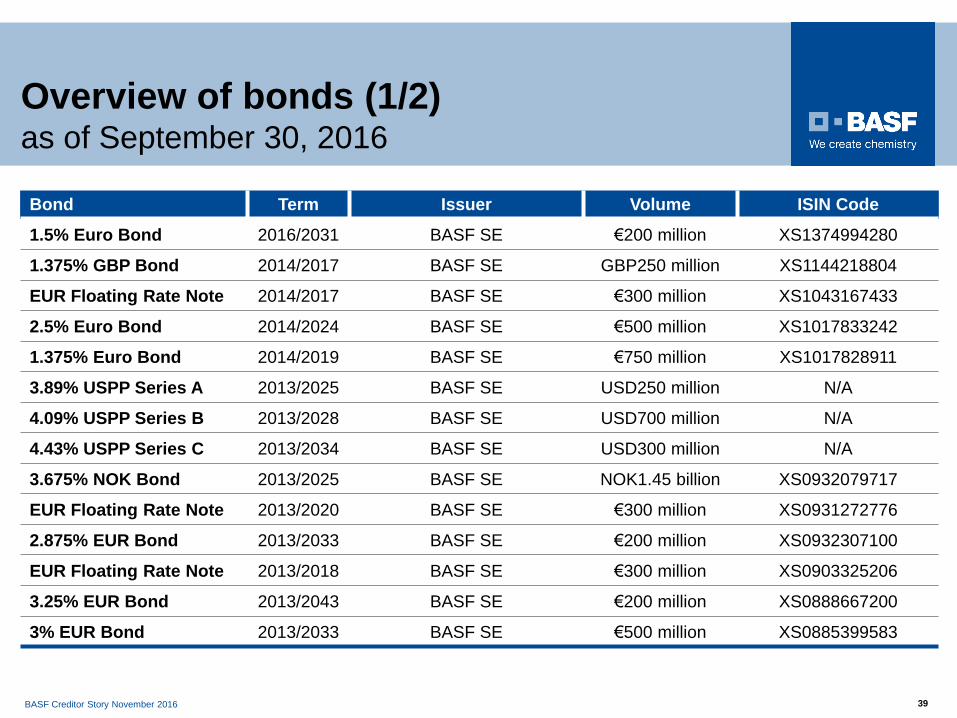
Overview of bonds (1/2) as of September 30, 2016
Bond Term Issuer Volume ISIN Code
1.5% Euro Bond 2016/2031 BASF SE €200 million XS1374994280
1.375% GBP Bond 2014/2017 BASF SE GBP250 million XS1144218804
EUR Floating Rate Note 2014/2017 BASF SE €300 million XS1043167433
2.5% Euro Bond 2014/2024 BASF SE €500 million XS1017833242
1.375% Euro Bond 2014/2019 BASF SE €750 million XS1017828911
3.89% USPP Series A 2013/2025 BASF SE USD250 million N/A
4.09% USPP Series B 2013/2028 BASF SE USD700 million N/A
4.43% USPP Series C 2013/2034 BASF SE USD300 million N/A
3.675% NOK Bond 2013/2025 BASF SE NOK1.45 billion XS0932079717
EUR Floating Rate Note 2013/2020 BASF SE €300 million XS0931272776
2.875% EUR Bond 2013/2033 BASF SE €200 million XS0932307100
EUR Floating Rate Note 2013/2018 BASF SE €300 million XS0903325206
3.25% EUR Bond 2013/2043 BASF SE €200 million XS0888667200
3% EUR Bond 2013/2033 BASF SE €500 million XS0885399583
BASF Creditor Story November 2016 40
150 years
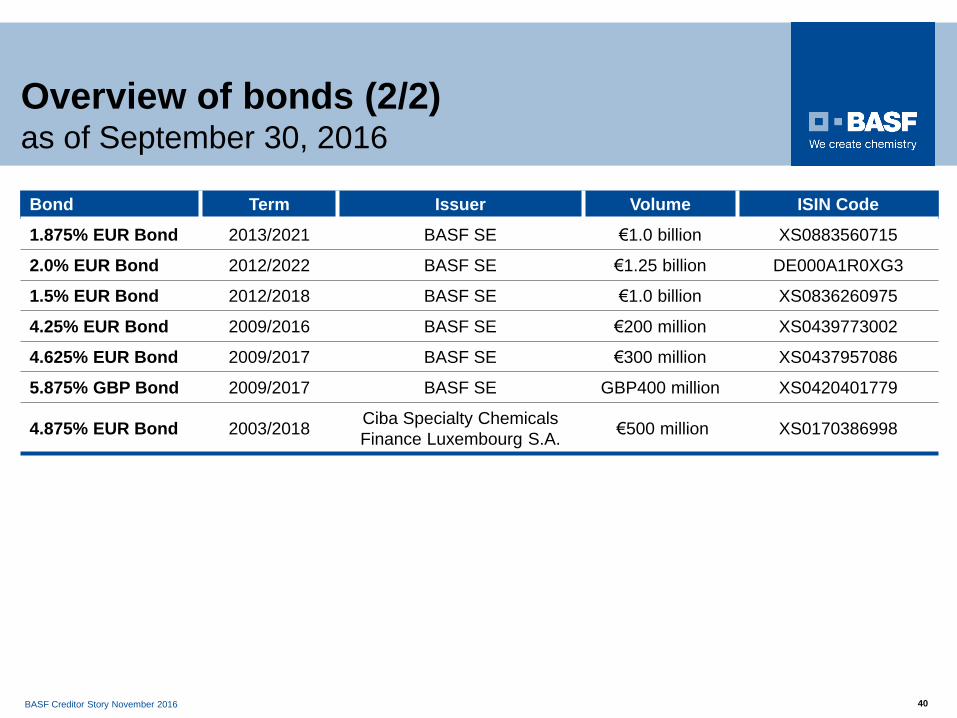
Overview of bonds (2/2) as of September 30, 2016
Bond Term Issuer Volume ISIN Code
1.875% EUR Bond 2013/2021 BASF SE €1.0 billion XS0883560715
2.0% EUR Bond 2012/2022 BASF SE €1.25 billion DE000A1R0XG3
1.5% EUR Bond 2012/2018 BASF SE €1.0 billion XS0836260975
4.25% EUR Bond 2009/2016 BASF SE €200 million XS0439773002
4.625% EUR Bond 2009/2017 BASF SE €300 million XS0437957086
5.875% GBP Bond 2009/2017 BASF SE GBP400 million XS0420401779
4.875% EUR Bond 2003/2018 Ciba Specialty Chemicals
Finance Luxembourg S.A.€500 million XS0170386998
BASF Creditor Story November 2016 41
Appendix I – Q3 2016 reporting
150 years
BASF Creditor Story November 2016 42
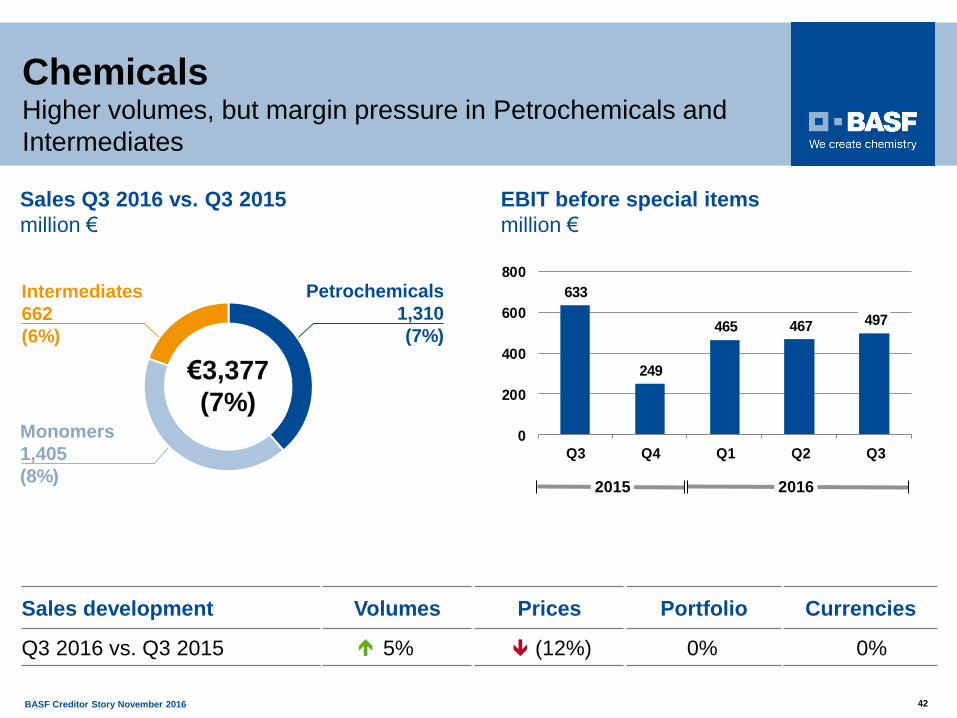
ChemicalsHigher volumes, but margin pressure in Petrochemicals and
Intermediates
Intermediates
662
(6%)
Monomers
1,405
(8%)
Petrochemicals
1,310
(7%)
€3,377
(7%)
EBIT before special items
million €
633
249
465 467 497
0
200
400
600
800
Q3 Q4 Q1 Q2 Q3
Sales development Volumes Prices Portfolio Currencies
Q3 2016 vs. Q3 2015 5% (12%) 0% 0%
20162015
Sales Q3 2016 vs. Q3 2015
million €
150 years
BASF Creditor Story November 2016 43
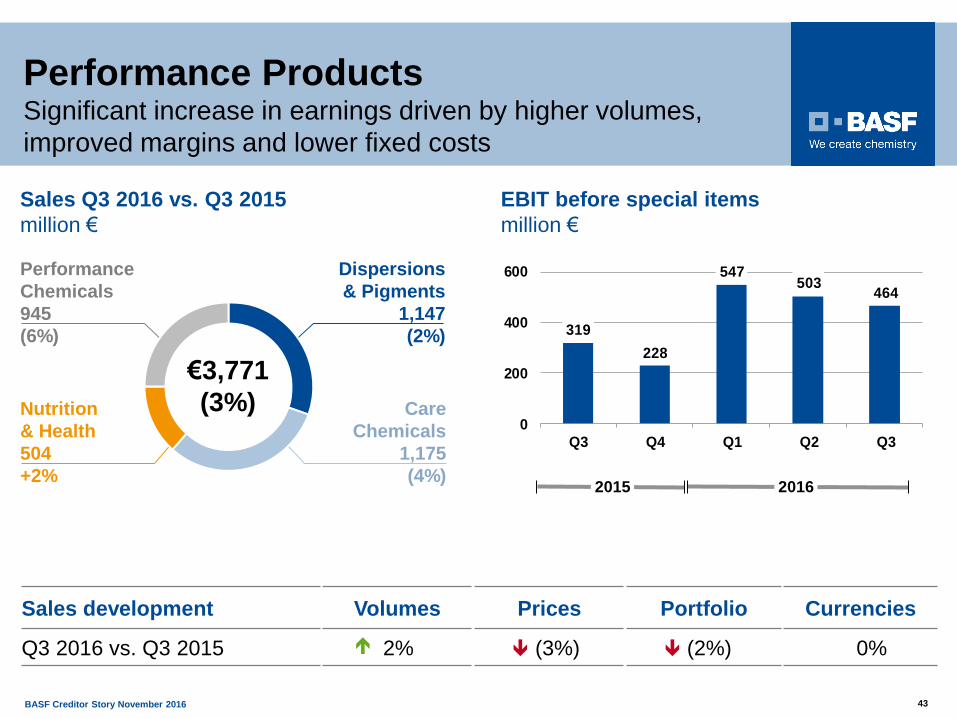
Performance
Chemicals
945
(6%)
Performance ProductsSignificant increase in earnings driven by higher volumes,
improved margins and lower fixed costs
Care
Chemicals
1,175
(4%)
€3,771
(3%)Nutrition
& Health
504
+2%
Dispersions
& Pigments
1,147
(2%)
Sales development Volumes Prices Portfolio Currencies
Q3 2016 vs. Q3 2015 2% (3%) (2%) 0%
EBIT before special items
million €
Sales Q3 2016 vs. Q3 2015
million €
20162015
319
228
547503
464
0
200
400
600
Q3 Q4 Q1 Q2 Q3
150 years
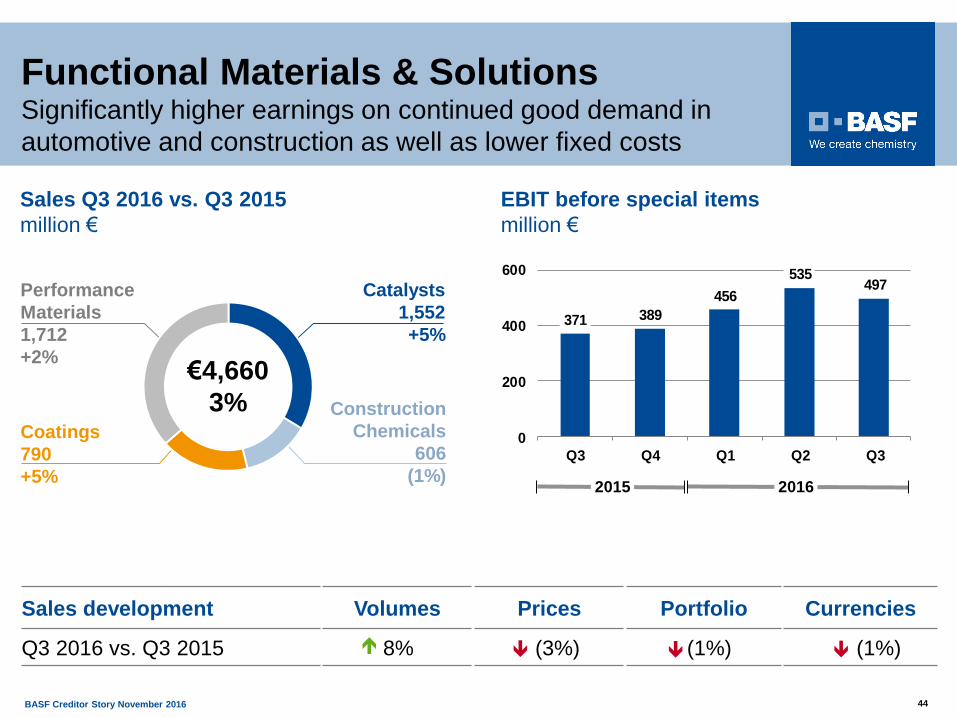
BASF Creditor Story November 2016 44
Functional Materials & SolutionsSignificantly higher earnings on continued good demand in
automotive and construction as well as lower fixed costs
Catalysts
1,552
+5%
Coatings
790
+5%
€4,660
3%
Performance
Materials
1,712
+2%
Construction
Chemicals
606
(1%)
EBIT before special items
million €
Sales development Volumes Prices Portfolio Currencies
Q3 2016 vs. Q3 2015 8% (3%) (1%) (1%)
Sales Q3 2016 vs. Q3 2015
million €
20162015
371 389
456
535497
0
200
400
600
Q3 Q4 Q1 Q2 Q3
150 years
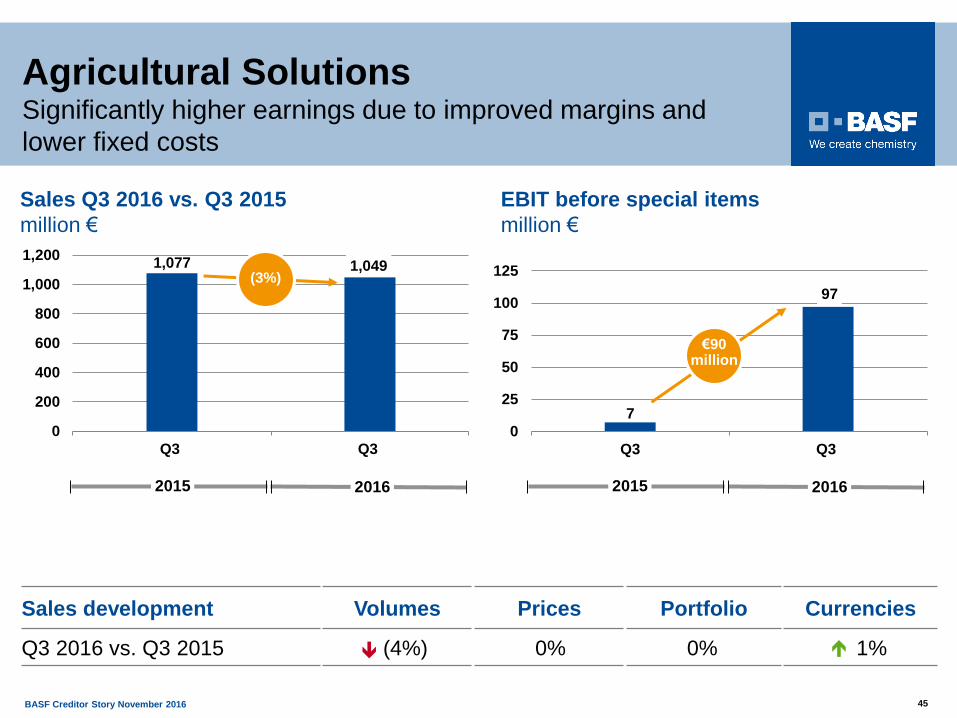
BASF Creditor Story November 2016 45
Agricultural SolutionsSignificantly higher earnings due to improved margins and
lower fixed costs
Sales development Volumes Prices Portfolio Currencies
Q3 2016 vs. Q3 2015 (4%) 0% 0% 1%
Sales Q3 2016 vs. Q3 2015
million €
2016201520162015
1,077 1,049
0
200
400
600
800
1,000
1,200
Q3 Q3
(3%)
7
97
0
25
50
75
100
125
Q3 Q3
€90million
EBIT before special items
million €
150 years
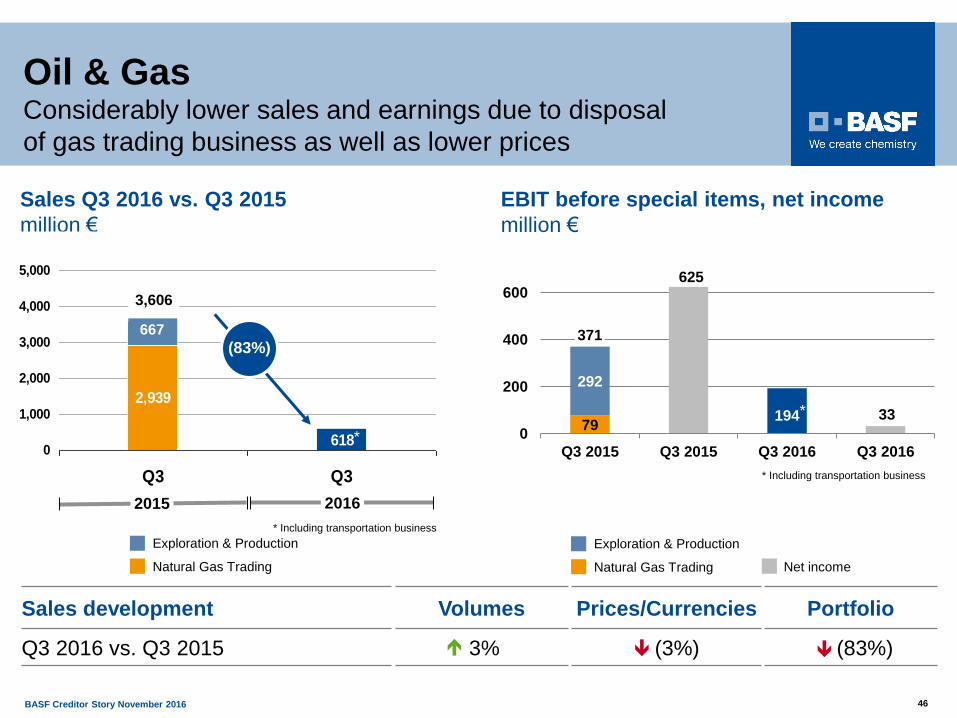
BASF Creditor Story November 2016 46
Oil & GasConsiderably lower sales and earnings due to disposal
of gas trading business as well as lower prices
Sales development Volumes Prices/Currencies Portfolio
Q3 2016 vs. Q3 2015 3% (3%) (83%)
Natural Gas Trading
Exploration & Production
Net income
79
292
194
625
33
0
200
400
600
Q3 2015 Q3 2015 Q3 2016 Q3 2016
EBIT before special items, net income
million €
Sales Q3 2016 vs. Q3 2015
million €
371
2,939
618
667
0
1,000
2,000
3,000
4,000
5,000
Q3 Q3
20162015
(83%)
3,606
667
Natural Gas Trading
Exploration & Production
* Including transportation business
* Including transportation business
*
*
150 years
BASF Creditor Story November 2016 47
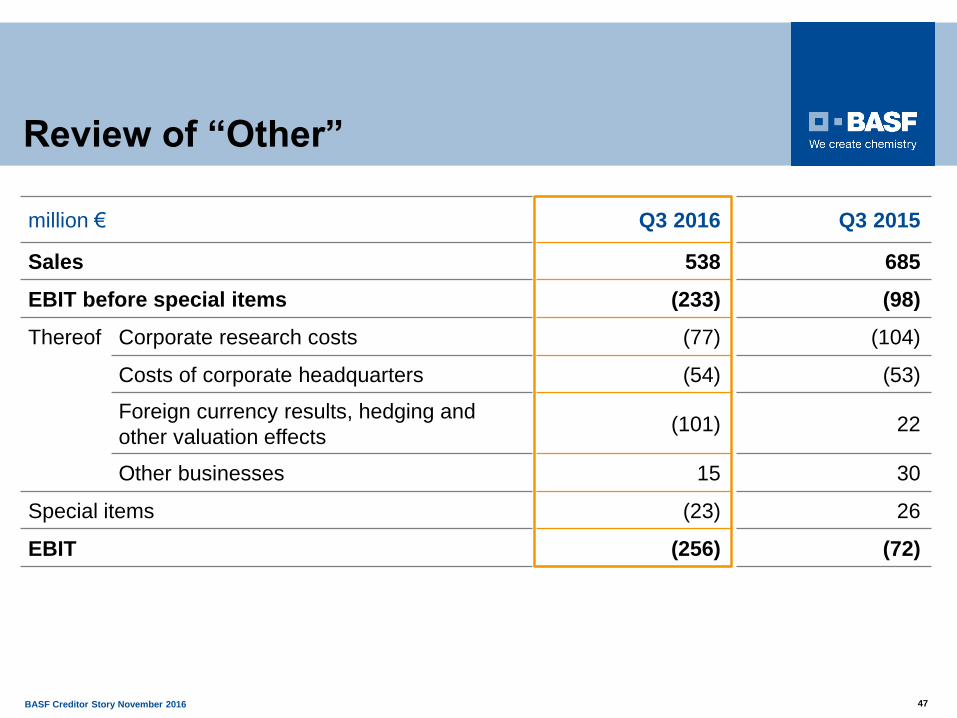
Review of “Other”
million € Q3 2016 Q3 2015
Sales 538 685
EBIT before special items (233) (98)
Thereof Corporate research costs (77) (104)
Costs of corporate headquarters (54) (53)
Foreign currency results, hedging and
other valuation effects(101) 22
Other businesses 15 30
Special items (23) 26
EBIT (256) (72)
150 years
BASF Creditor Story November 2016 48
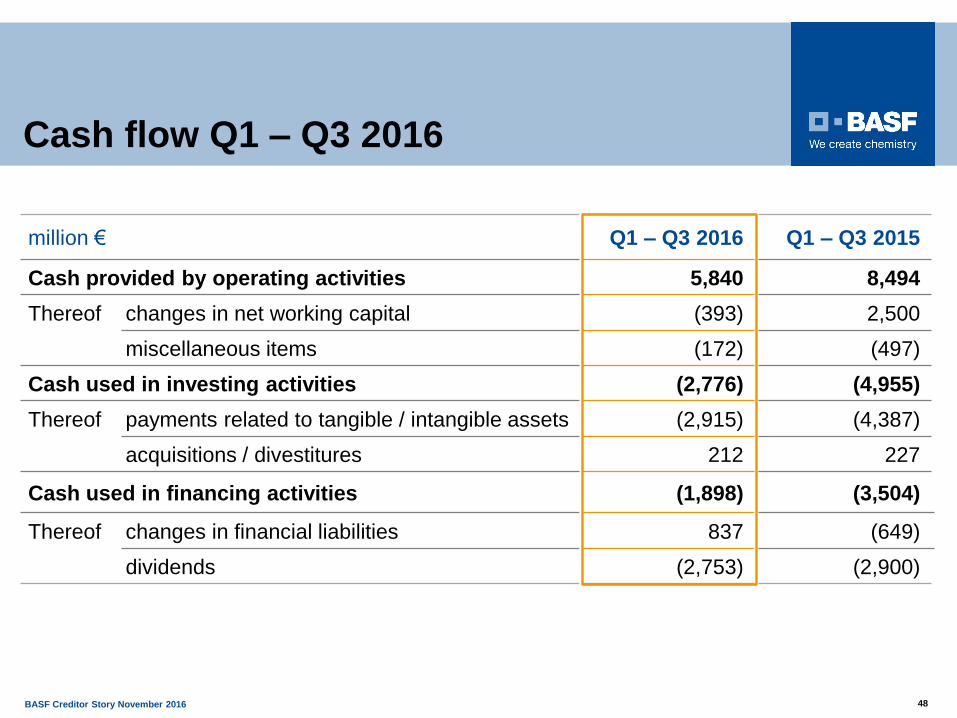
Cash flow Q1 – Q3 2016
million € Q1 – Q3 2016 Q1 – Q3 2015
Cash provided by operating activities 5,840 8,494
Thereof changes in net working capital (393) 2,500
miscellaneous items (172) (497)
Cash used in investing activities (2,776) (4,955)
Thereof payments related to tangible / intangible assets (2,915) (4,387)
acquisitions / divestitures 212 227
Cash used in financing activities (1,898) (3,504)
Thereof changes in financial liabilities 837 (649)
dividends (2,753) (2,900)
150 years
BASF Creditor Story November 2016 49
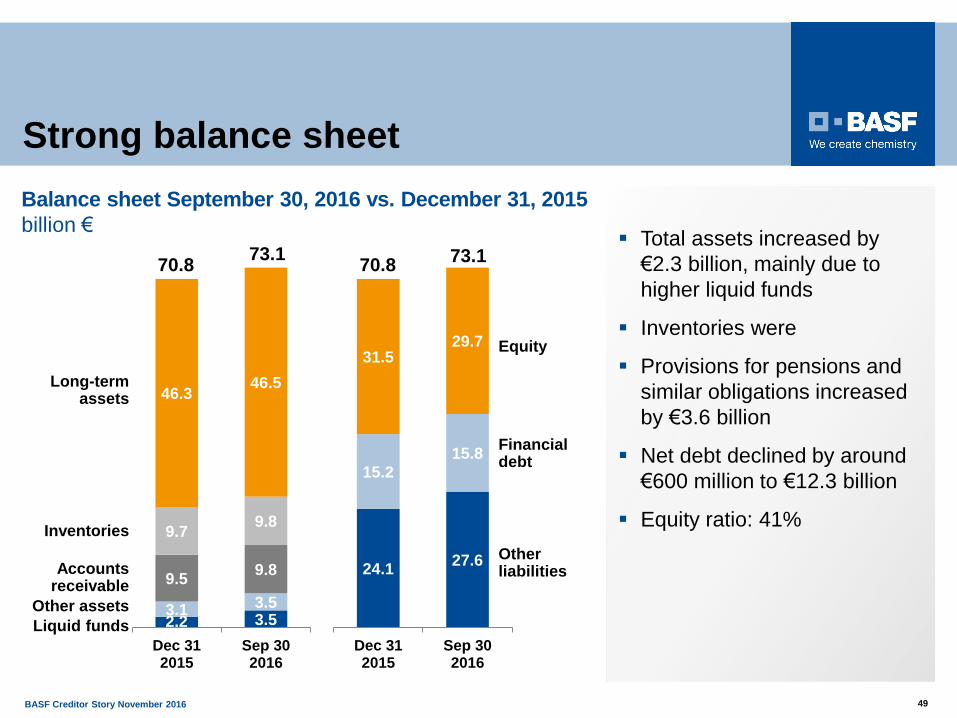
Strong balance sheet
24.127.6
15.2
15.8
31.529.7
Dec 312015
Sep 302016
2.2 3.53.1 3.5
9.59.8
9.79.8
46.346.5
Dec 312015
Sep 302016
Liquid funds
Accountsreceivable
Long-termassets
Inventories
Other assets
70.873.1
70.873.1
Otherliabilities
Financialdebt
Equity
Balance sheet September 30, 2016 vs. December 31, 2015
billion € Total assets increased by
€2.3 billion, mainly due to
higher liquid funds
Inventories were
Provisions for pensions and
similar obligations increased
by €3.6 billion
Net debt declined by around
€600 million to €12.3 billion
Equity ratio: 41%

BASF Creditor Story November 2016 50
150 years