Embed Size (px)
Citation preview
Please cite this paper as:
Hulten, C. (2013), “Stimulating Economic Growth throughKnowledge-Based Investment”, OECD Science, Technologyand Industry Working Papers, 2013/02, OECD Publishing.http://dx.doi.org/10.1787/5k46dbzqhj9v-en
OECD Science, Technology and IndustryWorking Papers 2013/02
Stimulating EconomicGrowth through Knowledge-Based Investment
Charles Hulten
Unclassified DSTI/DOC(2013)2 Organisation de Coopération et de Développement Économiques Organisation for Economic Co-operation and Development 22-May-2013 ___________________________________________________________________________________________
English - Or. English DIRECTORATE FOR SCIENCE, TECHNOLOGY AND INDUSTRY
STIMULATING ECONOMIC GROWTH THROUGH KNOWLEDGE-BASED INVESTMENT STI WORKING PAPER 2013/2 By Charles Hulten (University of Maryland and NBER, and Senior Fellow to The Conference Board)
JT03339974
Complete document available on OLIS in its original format This document and any map included herein are without prejudice to the status of or sovereignty over any territory, to the delimitation of international frontiers and boundaries and to the name of any territory, city or area.
DSTI/D
OC
(2013)2 U
nclassified
English - O
r. English

DSTI/DOC(2013)2
2
WORKING PAPER SERIES
The Working Paper series of the OECD Directorate for Science, Technology and Industry is designed
to make available to a wider readership selected studies prepared by staff in the Directorate or by outside consultants working on OECD projects. The papers included in the series cover a broad range of issues, of both a technical and policy-analytical nature, in the areas of work of the DSTI. The Working Papers are generally available only in their original language – English or French – with a summary in the other.
Comments on the papers are invited, and should be sent to the Directorate for Science, Technology and Industry, OECD, 2 rue André-Pascal, 75775 Paris Cedex 16, France.
The opinions expressed in these papers are the sole responsibility of the author(s) and do not necessarily reflect those of the OECD or of the governments of its member countries.
www.oecd.org/sti
OECD/OCDE, 2013 Applications for permission to reproduce or translate all or part of this material should be made to: OECD Publications, 2 rue André-Pascal, 75775 Paris, Cedex 16, France; e-mail: [email protected]
DSTI/DOC(2013)2
3
STIMULATING ECONOMIC GROWTH THROUGH
KNOWLEDGE-BASED INVESTMENT
Charles R. Hulten1
ABSTRACT
The protracted recovery from the great recession and financial crisis has led to a renewed emphasis on policies designed to encourage economic growth. The range of possible pro-growth measures has increased in recent years with the emergence of the literature on “knowledge-based capital (KBC),” a metric that expands the concept of innovation beyond R&D to include the full range of activities needed to implement or commercialise new ideas. Recent studies have shown that KBC is an important source of economic growth in many of the world’s advanced economies (much more so than R&D alone) and is positively correlated with real GDP per capita in a cross-section of these economies. This literature is still in its infancy and there is, as yet, no systematic discussion of KBC policy. This paper makes an attempt to fill this gap.
The KBC approach to growth policy involves a sharper focus on the constraints on growth as perceived by private business. It also involves the recognition that business innovation is more than just good ideas; it is also about good organisations that are able to execute and translate these ideas into new products, processes, and markets. A range of KBC policy options is discussed in this regard, including marketing and product design, worker training and human capital development, and investment in management systems. They offer new dimensions for promoting the growth of the firm. Other policies include the loosening of regulatory constraints on the firm’s business model and providing a more supportive tax and macroeconomic environment.
The effects of KBC policy are not unambiguously positive. A successful pro-growth KBC policy may have a negative effect on domestic employment even if it succeeds in raising the growth rate of real GDP. This possibility is examined and its implications for employment and the maintenance of living standards discussed.
1 This paper has been prepared for the Working Paper series of the Science, Technology and Industry
Directorate, OECD. I would like to thank Jonathan Haskel, Paul Schreyer, Bart van Art, Janet Hao, Nancy Humphrey, and Kathy Herald-Marlowe for their comments on earlier drafts. Opinions, interpretations, and recommendations are the sole responsibility of the author, and should not be attributed to any organisation with which he is associated.
DSTI/DOC(2013)2
4
STIMULER LA CROISSANCE ÉCONOMIQUE
PAR L’INVESTISSEMENT INTELLECTUEL
Charles R. Hulten2
RÉSUMÉ
La difficulté des économies à se relever de la Grande récession et de la crise financière a suscité un regain d’intérêt pour les politiques destinées à doper la croissance économique. Ces dernières années, les solutions envisagées se multiplient dans le sillage des travaux sur le « capital intellectuel » qui portent l’innovation au-delà de la R-D pour y englober l’ensemble des activités indispensables à l’exécution ou à la commercialisation des nouvelles idées. Des études récentes révèlent que le capital intellectuel constitue une source importante de croissance économique (bien plus que la R-D) dans de nombreuses économies avancées du monde et qu’en général il y affiche une corrélation positive avec le PIB réel par habitant. Les travaux dans ce domaine n’en étant qu’à leurs débuts, l’action à mener à l’égard du capital intellectuel ne fait pas encore l’objet d’une réflexion systématique. La présente étude tâche d’y remédier.
Mener une politique de croissance sous l’angle du capital intellectuel suppose de mettre davantage l’accent sur les obstacles à la croissance tels qu’ils sont perçus par les entreprises du secteur privé. Cela implique aussi de reconnaître que, pour les entreprises, innover ne se résume pas à avoir de bonnes idées, mais qu’il s’agit également d’adopter un mode d’organisation judicieux qui permette de concrétiser ces idées en nouveaux produits, procédés et marchés. Les solutions examinées ici concernent la conception et le marketing, la formation professionnelle et la mise en valeur du capital humain, ainsi que l’investissement dans les systèmes de gestion. Dans tous ces domaines, le capital intellectuel confère de nouvelles perspectives de croissance aux entreprises. D’autres mesures étudiées consistent à assouplir les contraintes réglementaires qui pèsent sur le modèle d’activité des entreprises et à instaurer des conditions fiscales et macroéconomiques qui leur soient plus favorables.
Une politique en faveur du capital intellectuel n’aura pas nécessairement des répercussions clairement positives. Même en faisant croître le PIB réel, elle pourrait nuire à l’emploi local. Cette éventualité est étudiée et ses conséquences pour l’emploi et le maintien des niveaux de vie analysées.
2 La présente étude est destinée à être publiée sous couvert d’un document de travail de la Direction de la
science, de la technologie et de l’industrie de l’OCDE. Je remercie Jonathan Haskel, Paul Schreyer, Bart van Art, Janet Hao, Nancy Humphrey et Kathy Herald-Marlowe des commentaires qu’ils ont formulés au sujet des versions préliminaires. Les opinions, interprétations et recommandations énoncées n’engagent que leur auteur et ne reflètent celles d’aucune organisation à laquelle il est associé.
DSTI/DOC(2013)2
5
1. Introduction
The economic downturn that started in 2007 is now in its sixth year. Unlike the cyclical slowdowns of the past 60 years, recovery remains elusive, with ongoing growth and fiscal problems in the euro zone, the United States, and emerging markets. Moreover, the slowdown seems increasingly resistant to traditional counter-cyclical fiscal and monetary stimulus. The protracted nature of the “great recession” and its aftermath has led to a renewed emphasis on measures designed to encourage long-run growth by addressing deeper structural issues.1
Growth policy has traditionally been formulated in terms of increased employment, investment in plant and equipment, and advances in technology. A range of policy instruments have been employed in the areas of taxation, infrastructure, regulatory policy, and targeted government expenditure. The range of possibilities has been expanded in recent years by the emerging literature on “knowledge-based capital” (KBC), alternatively called “intangible capital”.2 This literature expands the discourse from a narrow focus on capital and technology as separate and independent drivers of growth to a synthesis that combines the two. It also expands the concept of innovation based on technological change and invention alone to include the full range of activities needed to implement or commercialise new ideas. This broader KBC measure of innovation includes the conventional concept of R&D, traditionally seen as an important source of invention, but adds investments in product design and marketing, customer support, worker training, and organisational development, all of which play a role in the innovation process.
Recent studies have shown that KBC is an important source of economic growth in many of the world’s advanced economies, and is significantly more important than investment in R&D alone. KBC is also positively correlated with real GDP per capita in a cross-section of these advanced economies. Investment in this broad list of knowledge capital has grown to rival investment in tangible fixed capital in US nonfarm businesses and has exceeded it in recent years. The surge in KBC investment spending in recent decades reflects, in large part, the structural transformation of world markets brought about by the revolution in information and other technologies. This evidence suggests that policies designed to stimulate investment in this type of capital have the potential to increase the rate of economic growth. However, this literature is still in its infancy, and there is, as yet, no systematic discussion of KBC policy. This paper attempts to fill this gap.
One of the main conclusions is that many, if not most, of the traditional policy prescriptions designed to promote growth are also important in the KBC view of growth policy. However, the KBC approach involves a sharper focus on the constraints on growth as perceived by private business. It also involves the recognition that business innovation is more than just good ideas, it is also about good organisations that are able to execute and translate these ideas into new products, processes, and markets. KBC forms a platform that defines a company and its capabilities, and provides the infrastructure for launching its operational and strategic decisions about hiring, investment in plant and equipment, and product and process innovation. What this means for policy has been articulated by Richard Fisher (2012), President of the Federal Reserve Bank of Dallas, who observed that “you cannot create jobs unless those who have the capacity to hire people—private sector employers—go out and hire.” Fisher’s remark also applies to decisions about KBC investment, perhaps with even greater force, because of its existential importance to the firm.
One advantage of a KBC policy over a narrower focus on science and technology policy is that the non-R&D components of KBC provide additional opportunities for promoting innovation. These non-R&D components include marketing and product design, worker training and human capital development, and investment in management systems. They offer new dimensions for complementary policies aimed at promoting the growth of the firm.
DSTI/DOC(2013)2
6
The effects of KBC policy are not unambiguously positive, however. Loosening regulatory constraints on the firm’s business model and providing a more supportive tax environment may conflict with social policy objectives. Moreover, a successful pro-growth KBC policy may have a negative effect on domestic employment even if it succeeds in raising the growth rate of real GDP. This is the Brynjolfsson-McAfee “Race Against the Machine” problem. These possibilities should be recognised when evaluating or designing a pro-growth KBC policy, a theme developed more fully in what follows.
2. Knowledge-based capital and its impact on economic growth
Interest in the concept of KBC dates at least to the 1960s and 1970s, and microeconomic discussions of antitrust and tax policy and the associated problem of measuring firm-level rates of return accurately (Clarkson, 1977, 1996).3 The focus on R&D spending as the source of innovation was broadened, at this time, to include advertising. The main result was that profit rates were overstated when R&D and advertising capital were omitted from the calculation, as in conventional financial accounting practice, and therefore could not be used as a reliable guide to antitrust policy. However, this strand of analysis did not gain traction in the macroeconomic literature on economic growth.
The macroeconomic focus on KBC dates from the late 1990s and early 2000s, with the work of OECD (1998), Nakamura (2001), and Corrado, et al., (2005, 2009). The rapid growth in information and communication equipment in the mid-1990s focused attention on the complementary investments needed to exploit the possibilities of the new information technology. A key challenge was to develop an appropriate list of knowledge co-investments and find data on which estimates could be based. This was not an easy task given that KBC was not an established accounting concept at either the firm or national level, nor was it anchored in the traditional theory of the firm, where the organisational structure of the firm is largely a black box. The new KBC approach emerged as an attempt to open up this black box and unpack the processes through which the firm actually operates and which define the firm and determine its capabilities.
The classification of intangible capital proposed by Corrado et al. has emerged as the basis for the subsequent literature on KBC. The items in this classification are shown in Table 1, along with estimates for the US nonfarm business sector in 2006. This classification system divides KBC into three general categories: computerised information, innovative property, and economic competencies. These categories span the main functions performed by KBC: information management, product and process innovation, and the enhancement of a firm’s organisational capabilities. They support the main platforms from which operational “applications” are launched.
There is considerable diversity within the three categories. Innovative property includes far more than the conventional National Science Foundation (NSF) type of R&D, with its orientation to science and technology. This form of R&D is only a fraction of the innovative property subtotal, and an even smaller fraction of total intangible investment. Other important forms of R&D include investments in artistic originals (books, movies, and music), development of new financial products, and architectural and engineering designs. The economic competencies category is divided into brand equity (advertising, marketing, customer support), firm-specific human capital (worker training), and organisational structure, a rather amorphous grouping that includes investments in management and human resource systems, strategic planning, and management consulting.4
A key feature of these KBC categories is that they are largely produced within the firm itself (that is, produced on “own account”), and, as noted, do not yet appear in the conventional measure of GDP (software is an exception). Table 1 estimates suggest that the omission of most of the other types of KBC understates US GDP by more than 10%.
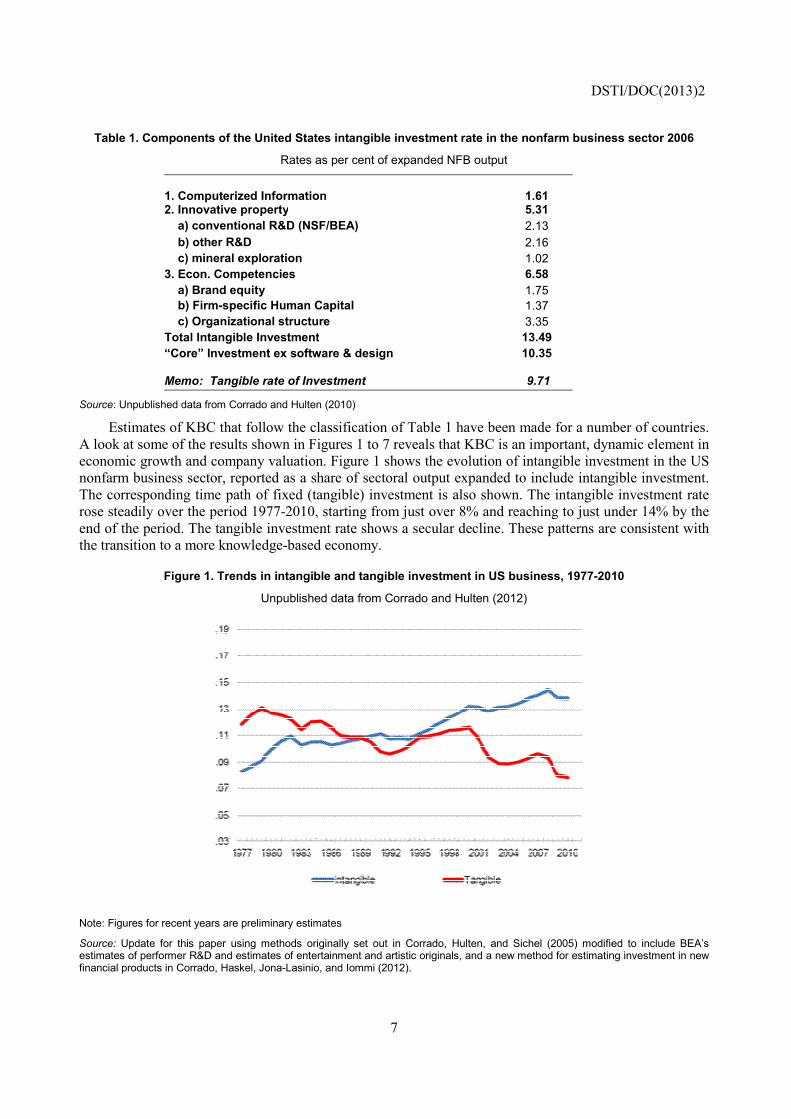
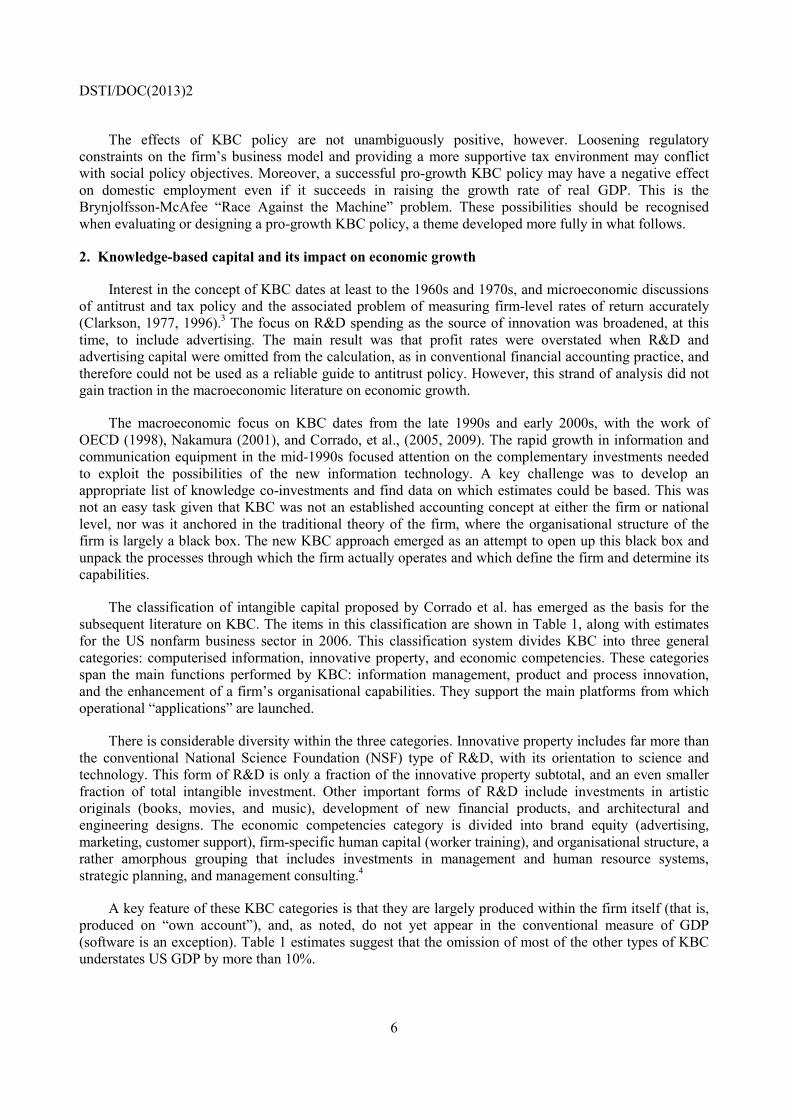
Table 1. Components of the United Stat
Rates a
1. Computerized Informatio2. Innovative property a) conventional R&D (NS b) other R&D c) mineral exploration 3. Econ. Competencies a) Brand equity b) Firm-specific Human C c) Organizational structuTotal Intangible Investment“Core” Investment ex softw
Memo: Tangible rate of Inv
Source: Unpublished data from Corrado and Hulte
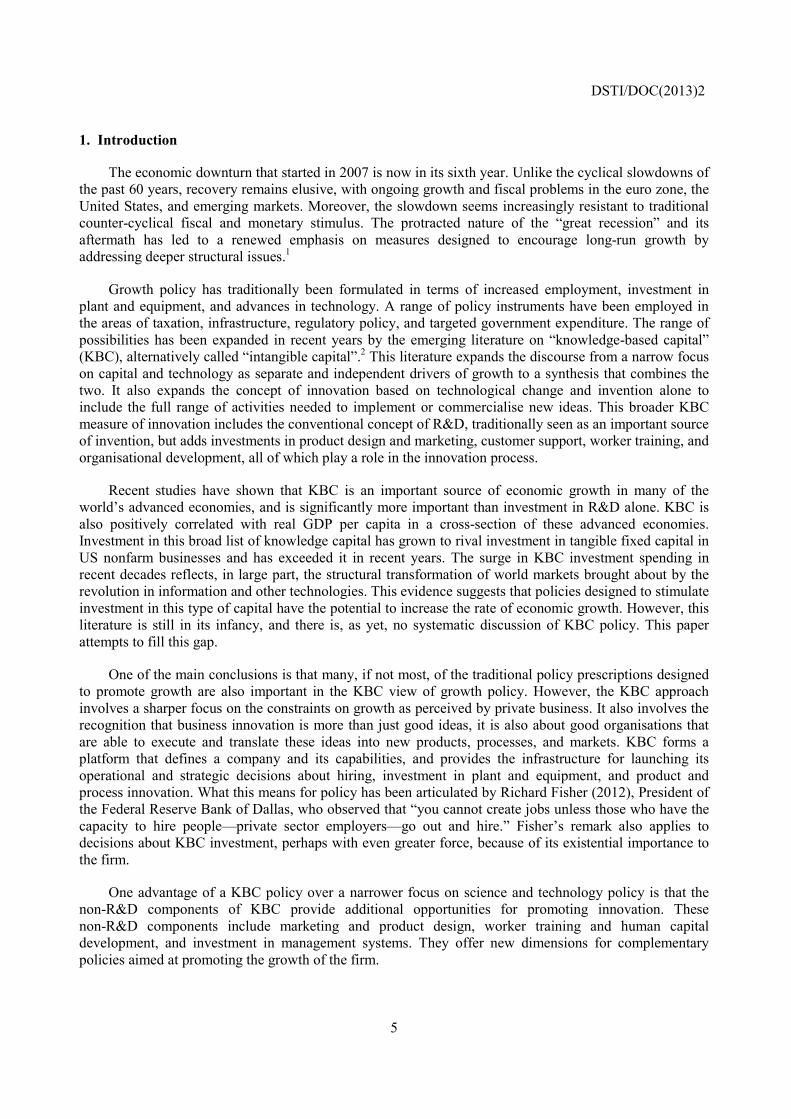
Estimates of KBC that follow the cA look at some of the results shown in Feconomic growth and company valuationnonfarm business sector, reported as a sThe corresponding time path of fixed (trose steadily over the period 1977-2010,end of the period. The tangible investmethe transition to a more knowledge-based
Figure 1. Trends in intangib
Unpublishe
Note: Figures for recent years are preliminary estim
Source: Update for this paper using methods orestimates of performer R&D and estimates of entefinancial products in Corrado, Haskel, Jona-Lasinio
DST
7
tes intangible investment rate in the nonfarm busines
as per cent of expanded NFB output
on 1.61 5.31
SF/BEA) 2.13 2.16 1.02 6.581.75
Capital 1.37 ure 3.35 t 13.49
ware & design 10.35
vestment 9.71
n (2010)
lassification of Table 1 have been made for a numbigures 1 to 7 reveals that KBC is an important, dynn. Figure 1 shows the evolution of intangible inveshare of sectoral output expanded to include intang
tangible) investment is also shown. The intangible, starting from just over 8% and reaching to just unent rate shows a secular decline. These patterns ared economy.
ble and tangible investment in US business, 1977-201
ed data from Corrado and Hulten (2012)
mates
riginally set out in Corrado, Hulten, and Sichel (2005) modifieertainment and artistic originals, and a new method for estimatino, and Iommi (2012).
TI/DOC(2013)2
ss sector 2006
mber of countries. namic element in stment in the US gible investment. e investment rate nder 14% by the e consistent with
10
ed to include BEA’s ng investment in new
DSTI/DOC(2013)2
8
Figure 2 presents a breakdown of the time profile of the KBC investment rate shown in the preceding figure. It is apparent that the share of conventional (NSF/Bureau of Economic Analysis [BEA]) R&D has been relatively constant since the mid-1980s at around 2% and has not, therefore, contributed to the significant increase in the overall KBC rate. An exclusive focus on conventional R&D when studying economic growth is therefore not warranted.
Figure 2. Trends in the composition of intangible capital, US business, 1977-2007
Source: Unpublished data from Corrado and Hulten (2010)
Whereas Figures 1 and 2 portray the growing scale of intangible investment, Figure 3 reveals the impact of the corresponding KBC stock on the growth of output per worker in the US business sector. This “sources of growth” analysis indicates that the increase in KBC, weighted by its share of total income, accounted for more than a quarter of the growth in output per worker over the period 1995-2007, and was by far the largest systematic source of growth.5 It was exceeded only by multifactor productivity, which is sometimes associated with technology change, but is in fact a black box because it is measured as a residual (though it almost certainly contains knowledge spillovers from the KBC stock).6
0%
2%
4%
6%
8%
10%
12%
14%
16%
Years 1975 to 2007
Rat
e of
Inve
stm
ent
ADD SOFTWARE ADD ORG. CAP.ADD BARAND EQUITY ADD OTHER R&DNSF/BEA R&D
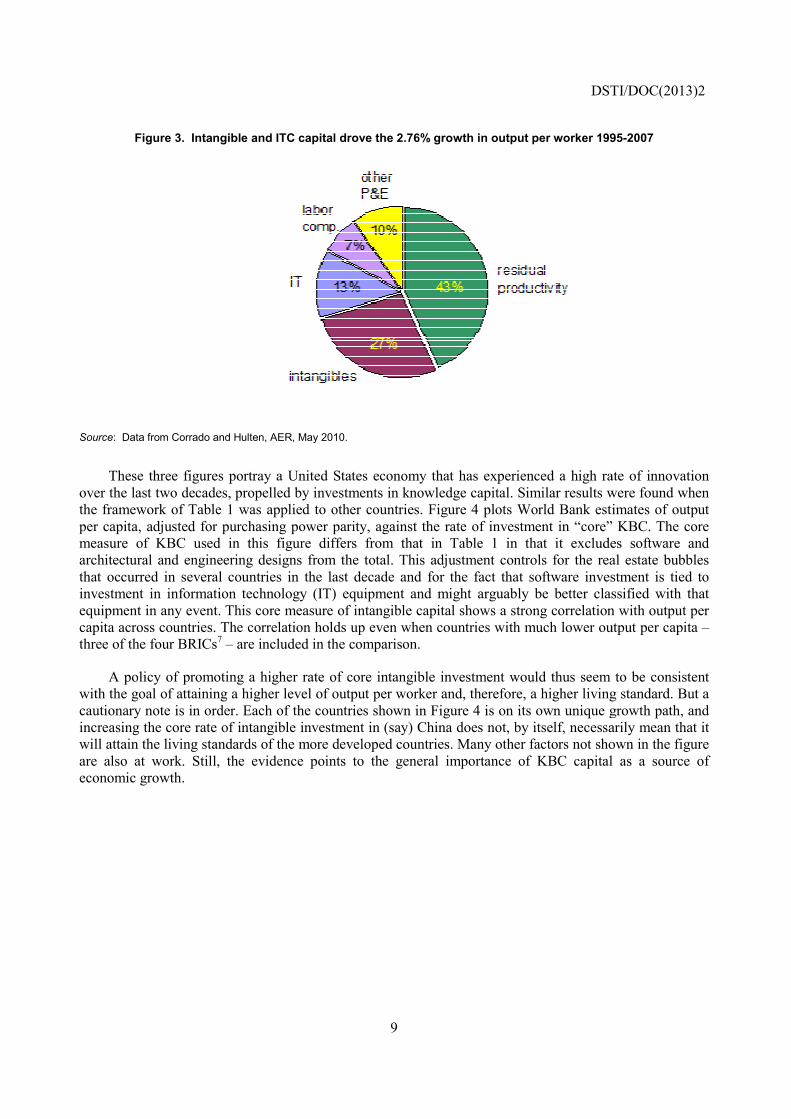
Figure 3. Intangible and ITC cap
Source: Data from Corrado and Hulten, AER, May
These three figures portray a Uniteover the last two decades, propelled by ithe framework of Table 1 was applied tper capita, adjusted for purchasing powmeasure of KBC used in this figure architectural and engineering designs frthat occurred in several countries in theinvestment in information technology (equipment in any event. This core measucapita across countries. The correlation hthree of the four BRICs7 – are included i
A policy of promoting a higher ratwith the goal of attaining a higher level ocautionary note is in order. Each of the cincreasing the core rate of intangible invwill attain the living standards of the moare also at work. Still, the evidence peconomic growth.
DST
9
pital drove the 2.76% growth in output per worker 199
y 2010.
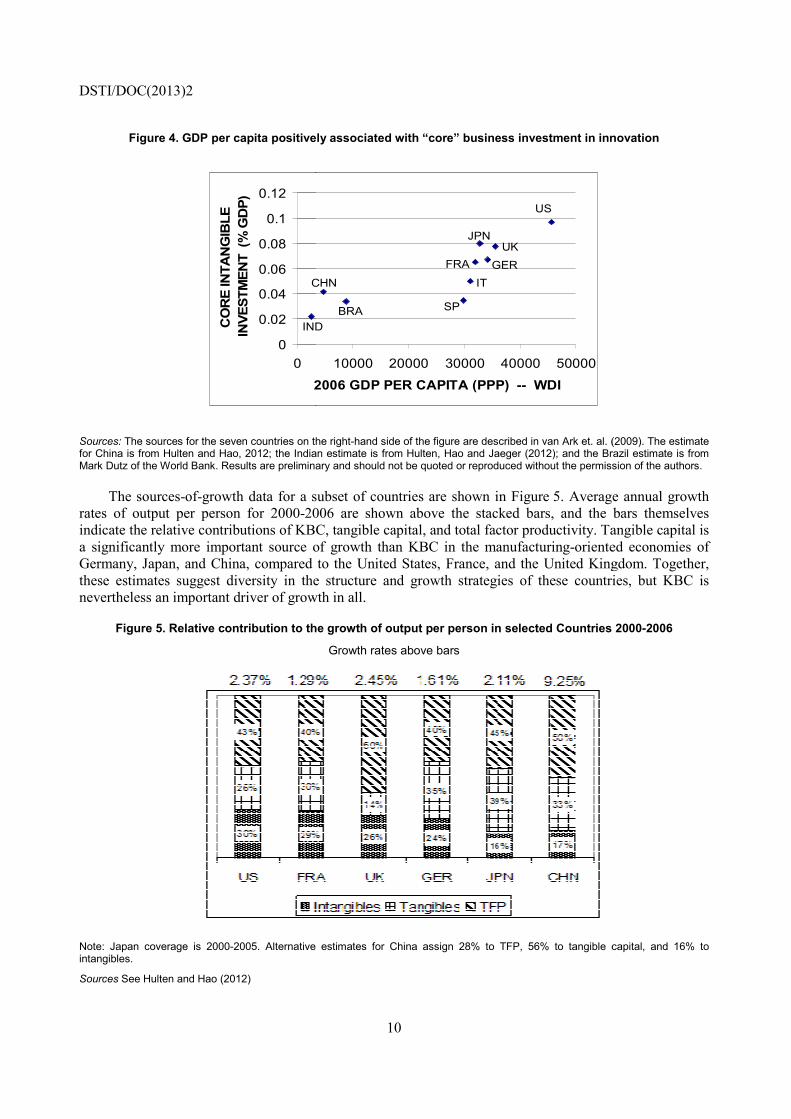
ed States economy that has experienced a high rainvestments in knowledge capital. Similar results wto other countries. Figure 4 plots World Bank estier parity, against the rate of investment in “core” differs from that in Table 1 in that it exclude
rom the total. This adjustment controls for the reae last decade and for the fact that software inves(IT) equipment and might arguably be better clasure of intangible capital shows a strong correlationholds up even when countries with much lower oun the comparison.
te of core intangible investment would thus seem of output per worker and, therefore, a higher livingcountries shown in Figure 4 is on its own unique gvestment in (say) China does not, by itself, necessaore developed countries. Many other factors not shopoints to the general importance of KBC capital
TI/DOC(2013)2
95-2007
ate of innovation were found when imates of output KBC. The core es software and al estate bubbles stment is tied to ssified with that n with output per utput per capita –
to be consistent g standard. But a growth path, and arily mean that it own in the figure as a source of
DSTI/DOC(2013)2
Figure 4. GDP per capita positive
Sources: The sources for the seven countries on thfor China is from Hulten and Hao, 2012; the IndiaMark Dutz of the World Bank. Results are prelimina
The sources-of-growth data for a srates of output per person for 2000-20indicate the relative contributions of KBCa significantly more important source oGermany, Japan, and China, compared these estimates suggest diversity in thenevertheless an important driver of grow
Figure 5. Relative contribution to th
Note: Japan coverage is 2000-2005. Alternative intangibles.
Sources See Hulten and Hao (2012)
0
0.02
0.04
0.06
0.08
0.1
0.12
0
2
CO
RE
INTA
NG
IBLE
INVE
STM
ENT
(% G
DP)
C
IND
10
ly associated with “core” business investment in inn
he right-hand side of the figure are described in van Ark et. al. (an estimate is from Hulten, Hao and Jaeger (2012); and the Brary and should not be quoted or reproduced without the permiss
subset of countries are shown in Figure 5. Average006 are shown above the stacked bars, and the C, tangible capital, and total factor productivity. Taof growth than KBC in the manufacturing-orienteto the United States, France, and the United King
e structure and growth strategies of these countriwth in all.
he growth of output per person in selected Countries
Growth rates above bars
estimates for China assign 28% to TFP, 56% to tangible c
10000 20000 30000 40000 50000
2006 GDP PER CAPITA (PPP) -- WDI
US
JPN
GERFRA
ITCHN
SPBRAD
UK
novation
(2009). The estimate razil estimate is from sion of the authors.
e annual growth bars themselves angible capital is ed economies of gdom. Together, ies, but KBC is
2000-2006
capital, and 16% to
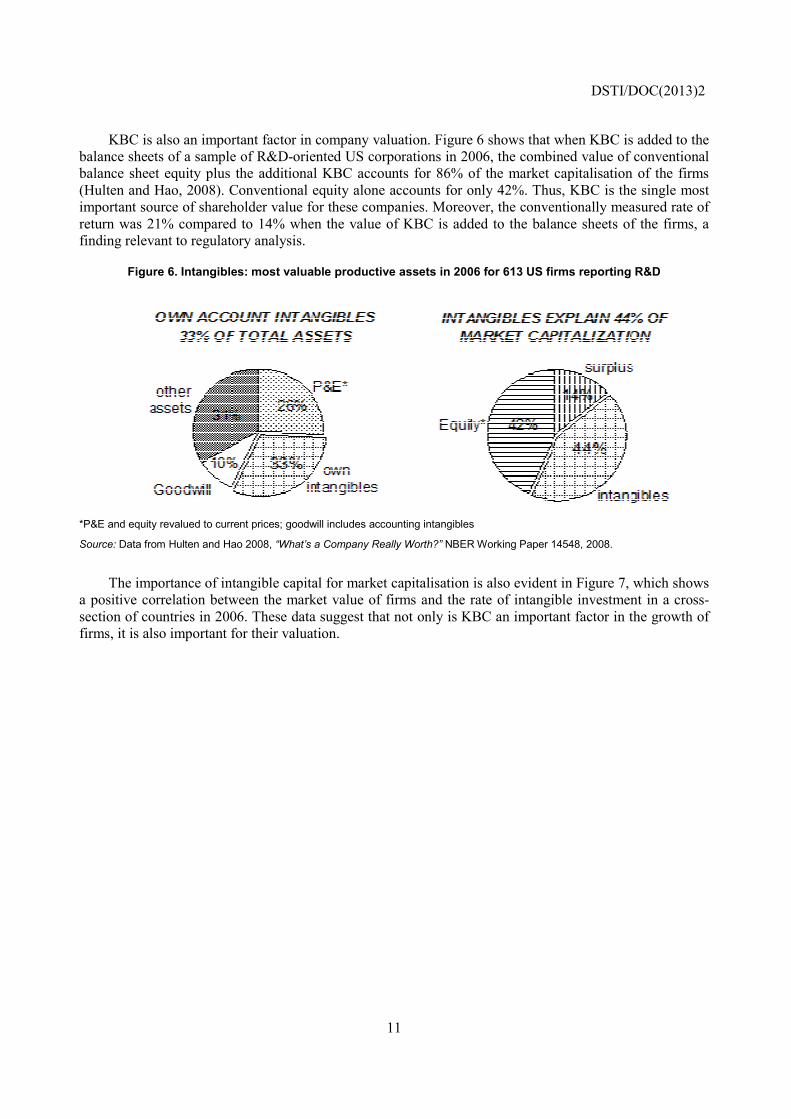
KBC is also an important factor in cbalance sheets of a sample of R&D-orienbalance sheet equity plus the additional(Hulten and Hao, 2008). Conventional eimportant source of shareholder value foreturn was 21% compared to 14% whenfinding relevant to regulatory analysis.
Figure 6. Intangibles: most valuab
*P&E and equity revalued to current prices; goodw
Source: Data from Hulten and Hao 2008, “What’s a
The importance of intangible capitaa positive correlation between the marksection of countries in 2006. These data firms, it is also important for their valuat
DST
11
company valuation. Figure 6 shows that when KBCnted US corporations in 2006, the combined valuel KBC accounts for 86% of the market capitalisatequity alone accounts for only 42%. Thus, KBC isor these companies. Moreover, the conventionally mn the value of KBC is added to the balance sheet
ble productive assets in 2006 for 613 US firms report
will includes accounting intangibles
a Company Really Worth?” NBER Working Paper 14548, 2008.
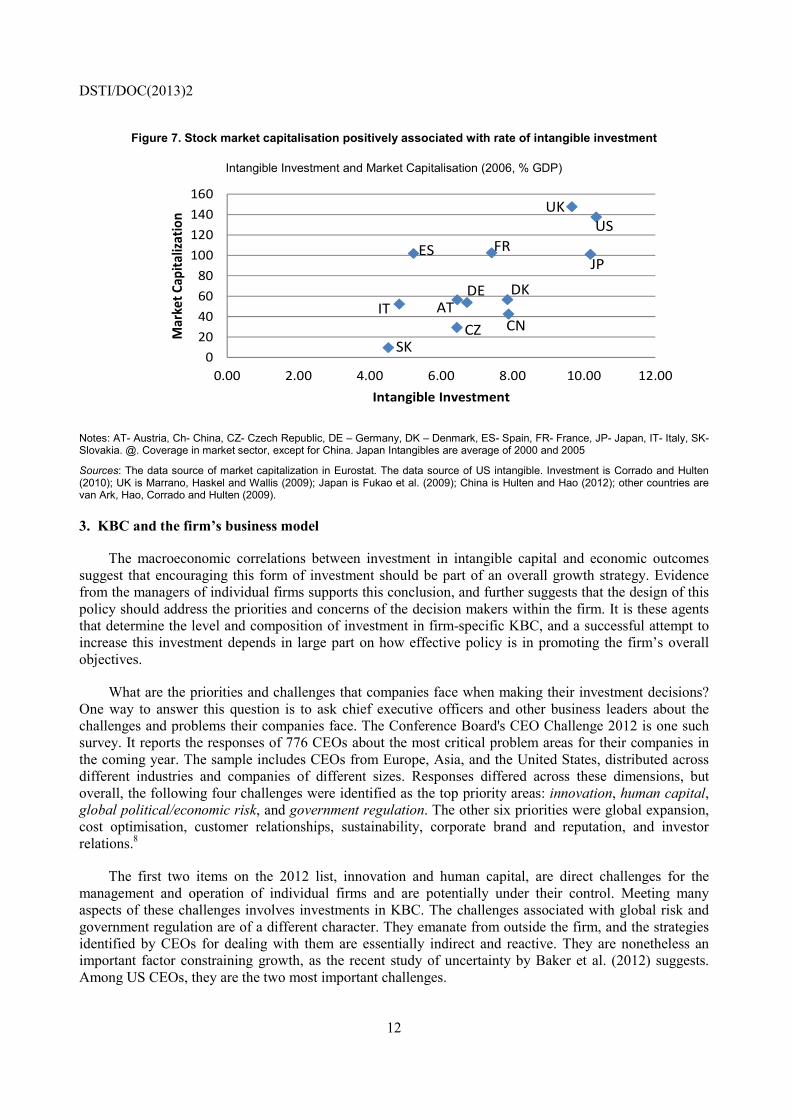
al for market capitalisation is also evident in Figureket value of firms and the rate of intangible investm
suggest that not only is KBC an important factor tion.
TI/DOC(2013)2
C is added to the e of conventional tion of the firms s the single most measured rate of s of the firms, a
ting R&D
e 7, which shows ment in a cross-in the growth of
DSTI/DOC(2013)2
12
Figure 7. Stock market capitalisation positively associated with rate of intangible investment
Intangible Investment and Market Capitalisation (2006, % GDP)
Notes: AT- Austria, Ch- China, CZ- Czech Republic, DE – Germany, DK – Denmark, ES- Spain, FR- France, JP- Japan, IT- Italy, SK- Slovakia. @. Coverage in market sector, except for China. Japan Intangibles are average of 2000 and 2005
Sources: The data source of market capitalization in Eurostat. The data source of US intangible. Investment is Corrado and Hulten (2010); UK is Marrano, Haskel and Wallis (2009); Japan is Fukao et al. (2009); China is Hulten and Hao (2012); other countries are van Ark, Hao, Corrado and Hulten (2009).
3. KBC and the firm’s business model
The macroeconomic correlations between investment in intangible capital and economic outcomes suggest that encouraging this form of investment should be part of an overall growth strategy. Evidence from the managers of individual firms supports this conclusion, and further suggests that the design of this policy should address the priorities and concerns of the decision makers within the firm. It is these agents that determine the level and composition of investment in firm-specific KBC, and a successful attempt to increase this investment depends in large part on how effective policy is in promoting the firm’s overall objectives.
What are the priorities and challenges that companies face when making their investment decisions? One way to answer this question is to ask chief executive officers and other business leaders about the challenges and problems their companies face. The Conference Board's CEO Challenge 2012 is one such survey. It reports the responses of 776 CEOs about the most critical problem areas for their companies in the coming year. The sample includes CEOs from Europe, Asia, and the United States, distributed across different industries and companies of different sizes. Responses differed across these dimensions, but overall, the following four challenges were identified as the top priority areas: innovation, human capital, global political/economic risk, and government regulation. The other six priorities were global expansion, cost optimisation, customer relationships, sustainability, corporate brand and reputation, and investor relations.8
The first two items on the 2012 list, innovation and human capital, are direct challenges for the management and operation of individual firms and are potentially under their control. Meeting many aspects of these challenges involves investments in KBC. The challenges associated with global risk and government regulation are of a different character. They emanate from outside the firm, and the strategies identified by CEOs for dealing with them are essentially indirect and reactive. They are nonetheless an important factor constraining growth, as the recent study of uncertainty by Baker et al. (2012) suggests. Among US CEOs, they are the two most important challenges.
0
20
40
60
80
100
120
140
160
0.00 2.00 4.00 6.00 8.00 10.00 12.00
Mar
ket C
apita
lizat
ion
Intangible Investment
USUK
JPFRES
DK
CN
DEAT
CZIT
SK
0
20
40
60
80
100
120
140
160
0.00 2.00 4.00 6.00 8.00 10.00 12.00
Mar
ket C
apita
lizat
ion
Intangible Investment
USUK
JPFRES
DK
CN
DEAT
CZIT
SK
DSTI/DOC(2013)2
13
The IBM 2010 Global CEO Study, a survey of more than 1 500 chief executive officers from 60 countries and 33 industries, also identifies innovation as a fundamental challenge for their companies. Corporate decision makers see themselves as operating in a world of rapidly changing political, economic, and technological dimensions. They perceive a need for their companies to react rapidly and effectively, and believe that this requires fostering organisational creativity aimed at finding better ways to execute the business model and encouraging creative innovation in business models. Technology-based solutions are part of the creative response, particularly the need to use technology to manage complexity and to get closer to customers. The rapid change and restructuring envisioned by the respondents to the IBM survey will almost certainly involve complementary KBC investments in innovative property and economic competency and a potential role for pro-growth policy.
The uncertainty of government policy and the need for flexibility voiced by the CEOs in these surveys is echoed in the previously noted remarks by Richard Fisher who, in his role as President of the Dallas Fed, also surveys the views of business leaders. He cites as corroboration two other surveys, one by the National Federation of Independent Business (NFIB) and the other by the Fuqua School of Business at Duke University in the September 2012 issue of the Global Business Outlook Survey of chief financial officers. Both surveys cite government policies and the economic environment as among their chief concerns. Fisher also notes that the CFOs in the Duke survey indicated that lowering interest rates would not have much influence on their investment decisions.
A deeper understanding of the priorities and constraints perceived by business leaders is helpful in identifying the micro channels through which successful growth policy can operate effectively. It is, after all, the decisions of these leaders that determine whether (and where) growth takes place. The surveys reveal that many of these challenges involve areas in which KBC is important, suggesting that this kind of investment is a channel for encouraging innovation and growth.
4. KBC as a pro-growth policy: The short run
The available evidence thus suggests that increased investment in KBC has been an important contributor to past economic growth, encouraging the idea that future investment will have a similar effect. However, past performance is not a guarantee of success, and the question of exactly what a KBC-based growth policy can achieve depends, in part, on the diagnosis of the current growth malaise. This diagnosis involves a complicated mixture of short- and long-term problems.
The short-run cause of the Great Recession is generally attributed to the bursting of the US housing bubble in 2006. The period that followed saw the collapse of the subprime mortgage market and growing trouble in the housing finance and investment banking industry, culminating in the collapse of Lehman Brothers in mid-September 2008. A financial panic ensued in which liquidity dried up and transmitted the housing market shock to the whole US economy and beyond. The US recession that started in late 2007 officially ended in June 2009, but the structural damage to the financial and housing sectors lingers in both the United States and in Europe.
The deeper causes of the financial crisis are complex and still under debate. However, a dramatic increase in the total debt-to-GDP ratio in the world’s advanced economies over the preceding two decades is surely one of the culprits. A study by the McKinsey Global Institute (Roxburgh et al., 2012) found that the total national debt (public and private) of many of the largest economies in Europe and Asia, plus the United States, rose from 125-225% of GDP in the early 1990s to 275-350% in 2008 (except Japan and the United Kingdom, whose debt-to-GDP ratio was greater than 450% in 2008). The period 2000-08 saw an average increase in the ratio of 81 percentage points. Housing was by no means the only area to become over-leveraged but became the epicenter of the bubble crisis. Over-leveraging in other sectors is a lingering problem that creates headwinds against the resumption of strong economic growth.
DSTI/DOC(2013)2
14
Over-leverage was not the only source of the financial crisis. Other important contributions were made by lax regulation, the development of complex and non-transparent financial instruments that encouraged risk taking, and use of short-term debt to finance the higher degree of leverage. The interaction of these sources led to an outcome that was more than the sum of its parts.
However, one culprit that should not be blamed is inadequate investment in KBC. A look again at Figure 1 indicates a rising trend in the US KBC investment rate since the early 1990s, with a slight dip in the early 2000s and a small decline following the post-2007 crisis period.9 If anything, the opposite is true: rapid innovation in financial instruments contributed to the crisis. The expectation was that these instruments would help diversify and hedge risk, and the problem resided not in the technology per se but in the ways in which it was used (though, in this regard, one could lay the blame on KBC). Indeed, innovation in financial products is an example of the interaction of financial engineering, marketing, and client customisation, all part of the broader concept of KBC.
If KBC was part of the problem, might it also be part of the solution? Because KBC is fundamentally about own-account investment in the long-run capabilities of the firm, it is not a natural candidate for a counter-cyclical policy. First of all, KBC is not a direct input into production, so changes in its level do not stimulate the growth of current output and the employment of production workers. Moreover, the fact that KBC is part of the firm’s organisational platform and is programmatic in nature limits the opportunity for stop-go investment, though less promising programmes may be easier to cut during recessions because of financing and personnel considerations, and new programs easier to start during recoveries. These factors help explain the pattern shown in Figure 1.
KBC may nevertheless have a short-run effect in the current macroeconomic environment, even if its main impact is on long-run growth. To the extent that the current stagnation reflects the mutually reinforcing pessimistic expectations of consumers and businesses, a credible start to a policy of stimulating long-run growth may have an igniting effect in advance of its expected long-run impact. While much more than KBC is involved in “unanchoring” expectations and reducing uncertainty, it is one possible point of departure because decisions about new hiring and fixed-capital investment may, in many cases, have to await strategic changes in the business model about the direction and extent of future expansion.
5. KBC and long-run growth
What can be expected of a KBC policy in the long run? Most theoretical and empirical studies of the sources of long-run economic growth accord a central place to technological change, and more recently, to investment in innovation. But, can these past returns be replicated in the years following a recovery from the current crisis? This question has been the subject of active debate, with technology optimists forecasting an even greater future role for the IT revolution, and technology pessimists doubting the ability of technology and innovation to deliver future results that parallel the past. An intermediate position holds that advances in technology are themselves part of the problem, because the Brynjolfsson and McAfee “race against the machine” does not end well for workers.10
The pessimistic case has three parts: the supply of technological opportunities is playing out, making future invention successively harder; the current information revolution has not had as large an impact as the first two industrial revolutions, so it is a mistake to extrapolate from them; and, though they are not directly related to the “supply” of technology, structural and political headwinds will hold the rate of future growth below its long-run potential (Gordon, 2012). The first element is particularly troubling because it undermines what has historically been the most important source of long-run growth, and, if taken to its logical extreme, would also require increasing investments in KBC to sustain a given rate of innovation.
DSTI/DOC(2013)2
15
Optimists counter that we have yet to realise the full effects of the IT revolution, and point to e-commerce and big data, the evolution of automated “workerless” factories and driverless cars, individual customisation of manufacturing products, and GPS-based transportation management, as signs that the current round of innovation is not yet over. Artificial intelligence (AI) does seem to offer a vast new frontier, and it is also important to recognise that not all technical change is about IT – the genomics revolution, for example, may offer an even vaster frontier for humanity.
Brian Arthur (2011) has put forward one vision of this technological future in what he calls The Second Economy. This is an emerging economy built on the application of intangible information technology, in which both inputs and outputs are increasingly (but not exclusively) intangible. This economy is both transformational and evolutionary, and not just about a profusion of new processes and products; it is also about the processes of innovation. The extent of the transformation to date is evident in the rapid growth of KBC investment shown in Figure 1, and future KBC investment can be expected to play an important role in the emergence of this Second Economy.
Even if the optimists are essentially correct about the future of technological invention, there is the race-against-the-machine problem, described by Brynjolfsson and McAfee (2011), in which middle-class workers in high-wage countries fail to realise the benefits of innovation.11 One feature of the new information-based technologies is that they are increasingly able to perform routine tasks previously performed by workers. When machines replace routine labour, the same amount of output can generally be obtained using fewer, but usually more skilled, workers. This substitution effect is the essence of skill-biased technical change. However, the existence of skill bias does not mean that total employment necessarily falls. Technical change can also lead to gains in productive (and cost) efficiency that result in an increase in output (which increases the demand for labour). This output-expansion effect on employment can more than offset the substitution effect that reduces the amount of labour needed to produce each unit of output. The race against the machine is a race between these two effects.
In the United States, the output effect on overall employment has dominated this calculation in the decades since Keynes voiced his warning about technological unemployment: constant price GDP increased 6.6-fold from 1950 to the start of the financial crisis, while the labour force participation rate climbed from its 1950 level of 58.9% to 66.4% at the beginning of 2007. However, this rate stagnated from 1990 to 2007 (during which real GDP increased by two-thirds), and has declined from its 2007 level to 63.5% in 2012. This pattern has been taken as evidence that the United States may be facing a fundamental change in the relation between technology and employment. The question is whether the worst of the recent impacts on employment and wages are mainly the result of the deep and prolonged recession, as some observers argue, or whether it is a harbinger of longer-run structural changes in the world economy. The alternatives may not be easy to sort out.12 Companies sometimes find it easier to lay off workers and restructure during times of recession to minimise opposition to their moves. What may now seem to be a short-term employment issue may turn out to be a longer-run “jobless recovery” problem.13
Other evidence besides labour-force participation rates supports the view that fundamental changes have indeed occurred in the labour market as a result of the information revolution. Autor et al. (2003) report a shift in demand toward non-routine conceptual skills consistent with the increasing ability of machines to accomplish routine tasks. Autor et al. (2012) examine what they term the “polarisation” of the labour market in the United States, and conclude that “occupational employment growth shifted from monotonically increasing wages (education) in the 1980s to a pattern of more rapid growth in jobs at the top and bottom relative to the middle of the wage (education) distribution in the 1990s,” and that this shift was associated with the hollowing out of the income distribution. Abel and Deitz (2012) echo this finding. They divide the workforce into four skill groups (high, medium-high, medium-low, and low) and show that the growth of employment and real median wages between 1980 and 2010 occurred in the highest and lowest groups.14
DSTI/DOC(2013)2
16
Skill-biased technical change is not the only source of labour-market polarisation. The information revolution has also contributed to the globalization of the world economy, and thus to the consequent competition from low-wage economies that has put pressure on the domestic labour markets of high-income countries.15 A study by Haskel et al. (2012) reviews the evidence regarding the link between globalisation and wages in the United States. While they note that more research is needed, they conclude that “the connections between globalisation, technology, and wages have become much more important during the last 10-15 years” (page 120). Moreover, the OECD’s 2011 study, Divided We Stand, makes the case that globalisation and skill-biased technical change are not the only factors at work, though they are important. Policies that increase competition in domestic markets and a relaxation of employment protection legislation have also played an important role.
This analysis paints a rather bleak picture of the future, at least for middle-class workers. There are, however, reasons to be hopeful. An emerging literature argues that the very skill-biased technological change that has been seen as a source of labour-market polarisation in high-wage countries is now beginning to reverse the effects of globalisation.16 In this “reshoring” scenario, the substitution effect that reduces the amount of labour needed to produce a unit of output also reduces unit labour costs. This, in turn, reduces the competitive advantage of low-wage countries and makes other factors more important, such as a larger pool of high-skill workers, the synergism of information networks, and lower energy costs. The hope is that reshoring will strengthen the output effect of innovation relative to the substitution effect and mitigate the adverse effects of skill bias on employment. Recent moves by the General Electric Company to reshore some of its manufacturing activity to the United States is a frequently mentioned example.
The case for optimism is also bolstered by the lessons of history. In the past, technology has proven adaptable to current possibilities and may evolve in ways that minimise or reverse any skill bias. Technology may adapt to lower levels of worker skills rather than the other way around. The potential for user-friendly adaptation is all the greater because of the inherent flexibility of information-based technology. Moreover, Greenwood (1997) argues that the skill premium tends to diminish over time because it is a temporary learning effect that favors more educated workers following the arrival of a new technology. This premium is subsequently reduced or erased as the technology matures and learning takes place and as younger workers have an incentive to acquire the necessary skills.
Sorting out the various technological futures is a daunting challenge, given the complexity of the problem and the opaqueness of the economist’s crystal ball.17 Both the optimistic and pessimistic scenarios may be highly case dependent, applying to some industries and technologies, and some times and places, but not to others. This ambiguity and heterogeneity suggests that growth policy needs to be similarly nuanced and to look for ways to get the most from innovation, both where opportunities seem to be slowing and where they are growing (though the appropriate policies may differ). Where technological unemployment is a problem, growth policy should look for ways to mitigate the adverse effects, and not lose sight of the fact that technological change has been the primary driver of rising living standards for more than two centuries (more on this later). One virtue of adopting the KBC perspective discussed below is that it is more flexible and operates in more policy dimensions than policies based on science and technology alone. It is thus better able to support or accommodate the economic transformations of an increasingly knowledge-driven technological world.
6. KBC policies: A general view
There is no shortage of pro-growth policies in the areas of science and technology and education. They include favorable tax treatment of R&D, increased funding for public research and science education, securing intellectual property rights, and information networks and exchanges. Improving the general level of education to prepare people for the requirements and opportunities of a knowledge-based economy is also a mainstay of the innovation policy debate. Many of the policy options discussed apply to KBC. What, then, does KBC bring to the table?
DSTI/DOC(2013)2
17
It brings a broader policy perspective to innovation policy. It refocuses the debate beyond science and technology as the basis for innovation and offers a broader range of policy options for stimulating growth. It also shifts the perspective from the “supply” of options as seen by policy makers to the “demand” for these options by the business managers responsible for implementation. Some general aspects of this shift in perspective are discussed in this section. Specific policies are considered in the section that follows.
6.1 KBC offers more policy options
The information revolution has laid the groundwork for the development of technologically superior products and processes. However, while technology has provided opportunities for innovation, a basic premise of the KBC approach is that a broader range of investments is needed to enable the development of commercially viable products and processes. Policies designed to encourage innovation should therefore go beyond R&D and other science and technology policies alone and target innovation per se and the full range of its determining factors.
This point is particularly important for the kind of economic growth that is needed for advanced economies to maintain their standards of living. Research has shown that product design and marketing are responsible for much of the value added of high technology over the product development cycle. Linden et al. (2009) report that only about a third of the jobs associated with the Apple iPod and its components were inside the United States, but they received 70% of the compensation. A similar situation prevails for the iPhone. Xing and Detert (2010) find that the wholesale cost of a phone shipped from China in 2009 was USD 179 (China’s value added is only 3.6%), while the retail price was some USD 321. And, as Mandel (2006) puts it: “Where the gizmo [iPod] is made is immaterial to its popularity. It is great design, technical innovation, and savvy marketing that have helped Apple Computer sell more than 40 million iPods.”
Encouraging innovation through intangible investment requires paying more attention to marketing and customer relations. Marketing and product design are often confused with advertising and seen as transient or as a zero-sum game against competitors. This is not the view of Nerlove and Arrow (1962) in their analysis of optimal advertising, nor that of Steve Jobs whose insights about technology, product design, and marketing propelled Apple Computer to the top rank of technology companies.
IBM’s Emerging Business Opportunity (EBO) management system is of particular interest from a KBC policy standpoint. As described by Garvin and Levesque (2006), the EBO system was designed to exploit the company’s technological possibilities by targeting new market opportunities and encouraging interaction with potential customers. The problem was that innovation does not necessarily occur automatically when a technological opportunity arises. Indeed, a firm’s culture and organisation may slow, or even work against, emerging opportunities.18 Moreover, innovation involves feedback loops with product design and marketing. Garvin and Levesque also report that the EBO programme at IBM encouraged interaction between potential customers and analysts in the product development and design process (“design-in”). One implication of this feedback loop is that marketing and customer relations are important aspects of the innovation process and that any investment involved should be counted as part of KBC.
IBM’s EBO management system is also an example of the need to treat innovation as a complex organisational process with multiple dimensions. Lev (2001) points to the link between organisational capital, technology, and the development of a firm’s business model. An appreciation of the quantitative importance of non-technological dimensions can be gained from the work of Brynjolfsson et al. (2002), who cite an example in which hardware and software costs were less than 20% of the total cost of an IT project, with much of the rest going toward the design of organisational processes and staff training.
DSTI/DOC(2013)2
18
A successful growth policy aimed at promoting innovation at the firm level thus needs to recognise the constraints and opportunities of non-technological dimensions and look for ways to weaken these constraints, while encouraging wider application of organisational programmes like the EBO system. Another implication is that if metrics and targets are to be used (e.g. the Lisbon Agenda’s 3% of GDP guideline for R&D spending), they should be based on the broader indicator of innovation provided by KBC.
6.2 Innovation versus “new” knowledge
A narrow focus on formal R&D programmes implicitly identifies innovation with the development of new knowledge. However, the generation of new ideas through formal R&D programmes actually occurs on a rather narrow base. According to NSF data, the performance of business R&D is concentrated in a rather small number of sectors in the United States: in 2008, more than 80% of R&D paid for by firms originated in just five industries. These industries are important contributors to economic growth, but they are by no means the only innovators. Many firms may not engage in what they regard as formal research programmes, but are nonetheless interested in developing new products and processes. These efforts may not be counted by the NSF, but they count when it comes to growth, and, according to the estimates of Table 1, they may count a lot. In any event, a KBC-based policy should move beyond high-technology industries when looking for the sources of new ideas and associated policy opportunities.
An even more important point is that an idea may be new to the firm, even though it is not new to the industry or to the world. While the latter are the underlying source of innovation, it is the rate at which ideas are adopted (regardless of the provenance or vintage of the knowledge) that drives the growth of the firm. When thinking about ways to stimulate this growth, it is important to recognise that the adoption or uptake of new ideas is not necessarily an immediate or costless process (as witnessed by the EBO programme at IBM). This is the central point of the classic study by Griliches (1957) of the invention of hybrid corn.19 The diffusion of this invention to farmers within and across different regions took years because varieties had to be adapted to local conditions and because potential users had to be persuaded that adoption made economic sense. It is also worth noting from a policy standpoint that the diffusion of this technology was greatly aided by public sector involvement in agricultural experiment stations (which might, with some imagination, be seen as a kind of EBO programme).20
The opportunity to improve the rate of uptake of new ideas is not limited to technology. The findings of Bloom and Van Reneen (2007) suggest that the effectiveness of a company’s management also plays a role and that there is substantial variance in managerial effectiveness. Moreover, managerial effectiveness scores were found to be positively correlated with market capitalisation and productivity. The study by Bloom et al. (2012) is particularly noteworthy for its policy implications. Efficiency scores were estimated for a collection of Indian textile establishments, and a randomly chosen subsample received free management consulting advice. The management performance of this subset improved by 17% in the first year compared to the set of control plants through improvements in productive efficiency, product quality, and inventory management. While other evidence suggests that management efficiency is higher in advanced countries, and the opportunity for large short-term gains thus more limited, the dispersion within advanced countries suggests that the potential for policy-induced gains is present.21
6.3 Firms are heterogeneous
Industries are typically composed of similar, but not identical companies, and contain both large and small firms, as well as older and newer ones. This heterogeneity is important because a one-size-fits-all KBC policy does not fit all sizes. The problems faced by small firms are particularly important from a policy standpoint. Research has shown that these firms, particularly those that are relatively young and rapidly growing, are responsible for a disproportionate amount of net job creation (Haltiwanger et al.,
DSTI/DOC(2013)2
19
2010; Strangler, 2010; and Sadeghi et al., 2012). Strangler reports that, in any year, firms classified as “fast-growing young firms” (which he calls “gazelles”) made up less than 1% of all companies but generated around 10% of all new jobs. Similarly, Sadeghi et al. find that the 0.5% of all companies classified as “high-growth firms” over 2008-11 were responsible for 33.7% of all gross job creation among firms that increased their employment over that period. These findings reprise work done at the OECD more than a decade earlier, summarised in Schreyer (2000).
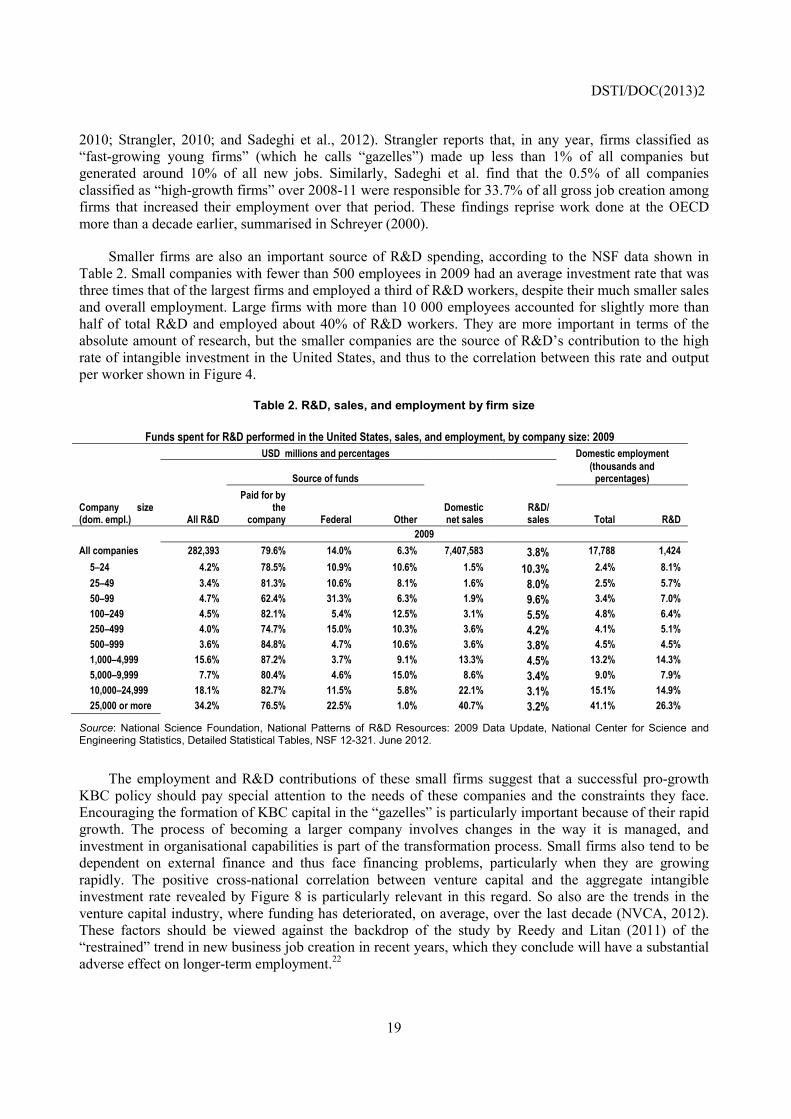
Smaller firms are also an important source of R&D spending, according to the NSF data shown in Table 2. Small companies with fewer than 500 employees in 2009 had an average investment rate that was three times that of the largest firms and employed a third of R&D workers, despite their much smaller sales and overall employment. Large firms with more than 10 000 employees accounted for slightly more than half of total R&D and employed about 40% of R&D workers. They are more important in terms of the absolute amount of research, but the smaller companies are the source of R&D’s contribution to the high rate of intangible investment in the United States, and thus to the correlation between this rate and output per worker shown in Figure 4.
Table 2. R&D, sales, and employment by firm size
Funds spent for R&D performed in the United States, sales, and employment, by company size: 2009 USD millions and percentages Domestic employment
All R&D
Source of funds
Domesticnet sales
R&D/ sales
(thousands and percentages)
Paid for by the
company Federal Other Total R&D Company size (dom. empl.) 2009 All companies 282,393 79.6% 14.0% 6.3% 7,407,583 3.8% 17,788 1,424
5–24 4.2% 78.5% 10.9% 10.6% 1.5% 10.3% 2.4% 8.1% 25–49 3.4% 81.3% 10.6% 8.1% 1.6% 8.0% 2.5% 5.7% 50–99 4.7% 62.4% 31.3% 6.3% 1.9% 9.6% 3.4% 7.0% 100–249 4.5% 82.1% 5.4% 12.5% 3.1% 5.5% 4.8% 6.4% 250–499 4.0% 74.7% 15.0% 10.3% 3.6% 4.2% 4.1% 5.1% 500–999 3.6% 84.8% 4.7% 10.6% 3.6% 3.8% 4.5% 4.5% 1,000–4,999 15.6% 87.2% 3.7% 9.1% 13.3% 4.5% 13.2% 14.3% 5,000–9,999 7.7% 80.4% 4.6% 15.0% 8.6% 3.4% 9.0% 7.9% 10,000–24,999 18.1% 82.7% 11.5% 5.8% 22.1% 3.1% 15.1% 14.9% 25,000 or more 34.2% 76.5% 22.5% 1.0% 40.7% 3.2% 41.1% 26.3%
Source: National Science Foundation, National Patterns of R&D Resources: 2009 Data Update, National Center for Science and Engineering Statistics, Detailed Statistical Tables, NSF 12-321. June 2012.
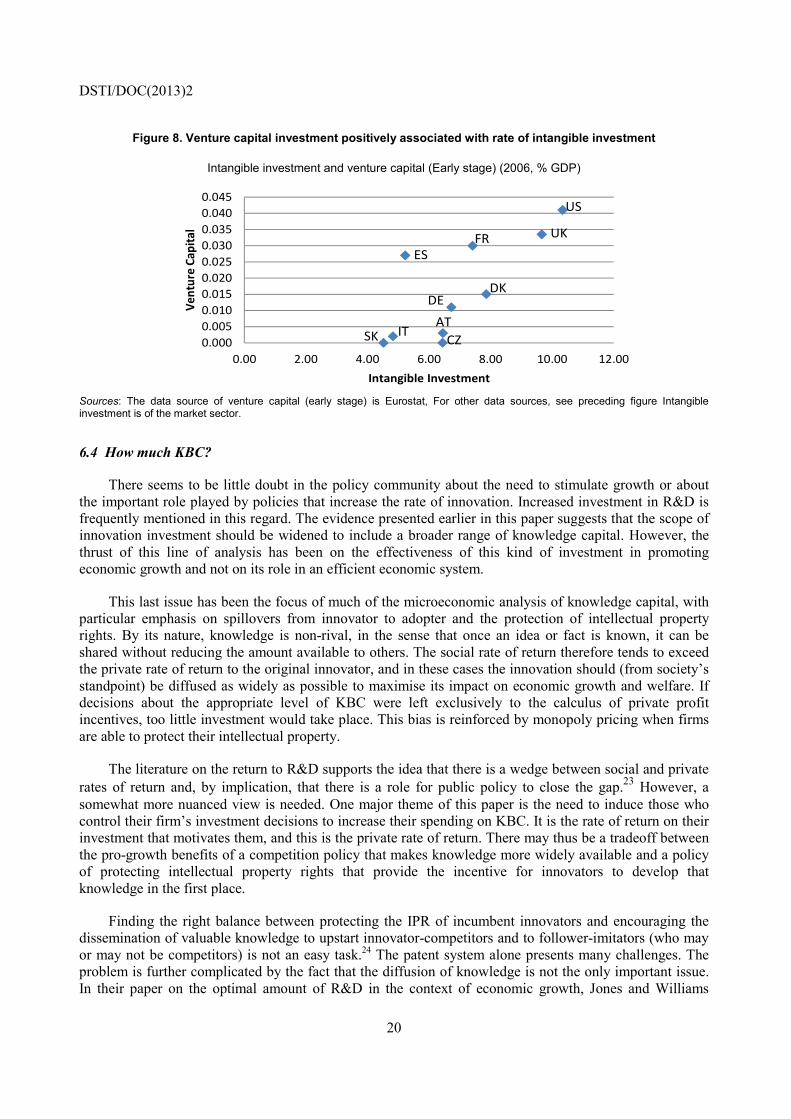
The employment and R&D contributions of these small firms suggest that a successful pro-growth KBC policy should pay special attention to the needs of these companies and the constraints they face. Encouraging the formation of KBC capital in the “gazelles” is particularly important because of their rapid growth. The process of becoming a larger company involves changes in the way it is managed, and investment in organisational capabilities is part of the transformation process. Small firms also tend to be dependent on external finance and thus face financing problems, particularly when they are growing rapidly. The positive cross-national correlation between venture capital and the aggregate intangible investment rate revealed by Figure 8 is particularly relevant in this regard. So also are the trends in the venture capital industry, where funding has deteriorated, on average, over the last decade (NVCA, 2012). These factors should be viewed against the backdrop of the study by Reedy and Litan (2011) of the “restrained” trend in new business job creation in recent years, which they conclude will have a substantial adverse effect on longer-term employment.22
DSTI/DOC(2013)2
20
Figure 8. Venture capital investment positively associated with rate of intangible investment
Intangible investment and venture capital (Early stage) (2006, % GDP)
Sources: The data source of venture capital (early stage) is Eurostat, For other data sources, see preceding figure Intangible investment is of the market sector.
6.4 How much KBC?
There seems to be little doubt in the policy community about the need to stimulate growth or about the important role played by policies that increase the rate of innovation. Increased investment in R&D is frequently mentioned in this regard. The evidence presented earlier in this paper suggests that the scope of innovation investment should be widened to include a broader range of knowledge capital. However, the thrust of this line of analysis has been on the effectiveness of this kind of investment in promoting economic growth and not on its role in an efficient economic system.
This last issue has been the focus of much of the microeconomic analysis of knowledge capital, with particular emphasis on spillovers from innovator to adopter and the protection of intellectual property rights. By its nature, knowledge is non-rival, in the sense that once an idea or fact is known, it can be shared without reducing the amount available to others. The social rate of return therefore tends to exceed the private rate of return to the original innovator, and in these cases the innovation should (from society’s standpoint) be diffused as widely as possible to maximise its impact on economic growth and welfare. If decisions about the appropriate level of KBC were left exclusively to the calculus of private profit incentives, too little investment would take place. This bias is reinforced by monopoly pricing when firms are able to protect their intellectual property.
The literature on the return to R&D supports the idea that there is a wedge between social and private rates of return and, by implication, that there is a role for public policy to close the gap.23 However, a somewhat more nuanced view is needed. One major theme of this paper is the need to induce those who control their firm’s investment decisions to increase their spending on KBC. It is the rate of return on their investment that motivates them, and this is the private rate of return. There may thus be a tradeoff between the pro-growth benefits of a competition policy that makes knowledge more widely available and a policy of protecting intellectual property rights that provide the incentive for innovators to develop that knowledge in the first place.
Finding the right balance between protecting the IPR of incumbent innovators and encouraging the dissemination of valuable knowledge to upstart innovator-competitors and to follower-imitators (who may or may not be competitors) is not an easy task.24 The patent system alone presents many challenges. The problem is further complicated by the fact that the diffusion of knowledge is not the only important issue. In their paper on the optimal amount of R&D in the context of economic growth, Jones and Williams
0.0000.0050.0100.0150.0200.0250.0300.0350.0400.045
0.00 2.00 4.00 6.00 8.00 10.00 12.00
Vent
ure
Capi
tal
Intangible Investment
US
UKFRES
DKDE
ATCZ
ITSK
DSTI/DOC(2013)2
21
(2000) argue that while the non-rival nature of R&D knowledge is an important consideration, “there are equally compelling reasons, related to the distorted incentives from patent races and the transfer of rents through creative destruction, to think that there may be too much R&D” (page 65).
Getting IPR policy ‘right’ is critical for the long-run health of a knowledge-based economy, though getting the ‘right’ right is a problem given the complexity of the issues and the competing interests involved. One thing that can be said is that, whatever the flaws of existing IPR systems, the evidence of Figures 1 to 5 is a reminder that the last decades have been a period of significant innovation. The evidence also supports the view that further investments in R&D and other knowledge capital will stimulate economic growth (optimally or otherwise). A pragmatic approach to the financial crisis and its slow-growth aftermath suggests a strategy of encouraging private-sector investment in these kinds of knowledge capital and leaving the structural questions of optimal innovation policy for a separate discussion.
7. Specific KBC policies
The preceding section has offered some observations about the overall architecture of a growth policy that incorporates a KBC perspective. The main points that emerged can be summarised briefly. They include: the need for a broader perspective that looks beyond science and technology policy and recognises the importance of KBC as a whole; the need to look beyond the development of new ideas alone and focus as well on the diffusion of new technology and organisational practices; the recognition that a pro-growth policy may create winners and losers among firms and that a “one-size” policy will not fit all types of firm; finally, the importance of paying special attention to smaller, rapidly growing firms. To complement this discussion, several specific policy topics are examined next.
7.1 Economic regulation
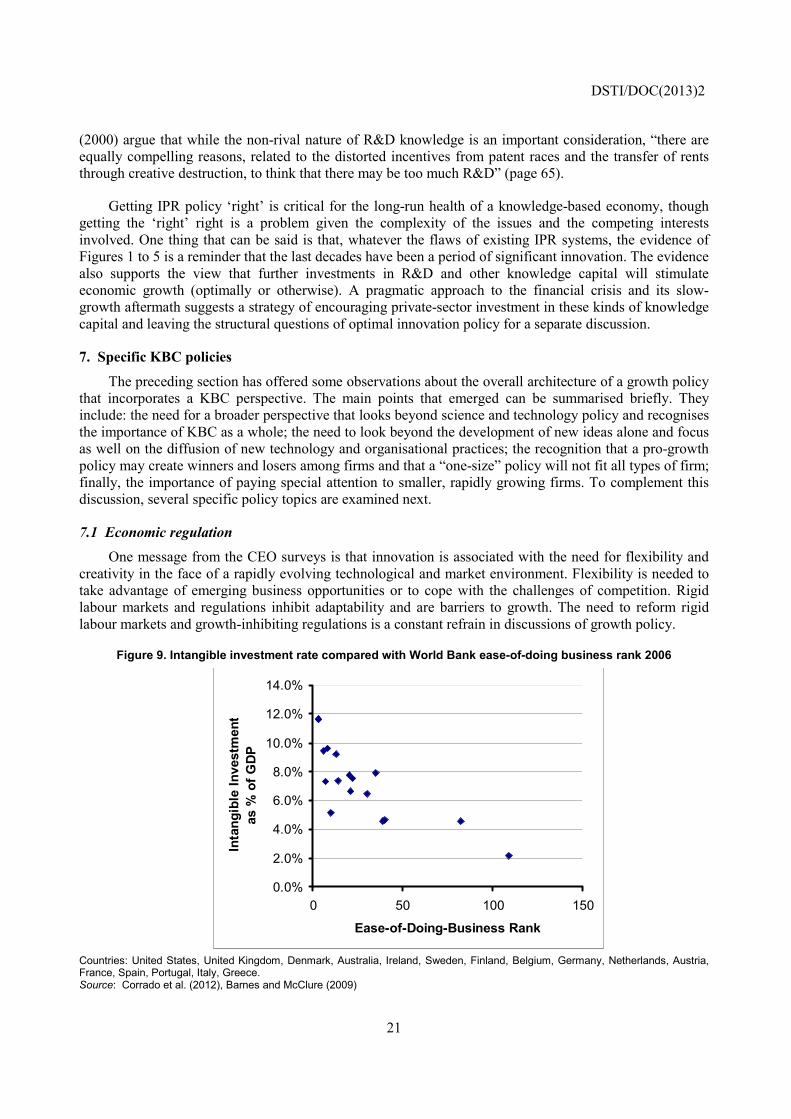
One message from the CEO surveys is that innovation is associated with the need for flexibility and creativity in the face of a rapidly evolving technological and market environment. Flexibility is needed to take advantage of emerging business opportunities or to cope with the challenges of competition. Rigid labour markets and regulations inhibit adaptability and are barriers to growth. The need to reform rigid labour markets and growth-inhibiting regulations is a constant refrain in discussions of growth policy.
Figure 9. Intangible investment rate compared with World Bank ease-of-doing business rank 2006
Countries: United States, United Kingdom, Denmark, Australia, Ireland, Sweden, Finland, Belgium, Germany, Netherlands, Austria, France, Spain, Portugal, Italy, Greece. Source: Corrado et al. (2012), Barnes and McClure (2009)
0.0%
2.0%
4.0%
6.0%
8.0%
10.0%
12.0%
14.0%
0 50 100 150
Ease-of-Doing-Business Rank
Inta
ngib
le In
vest
men
tas
% o
f GD
P
DSTI/DOC(2013)2
22
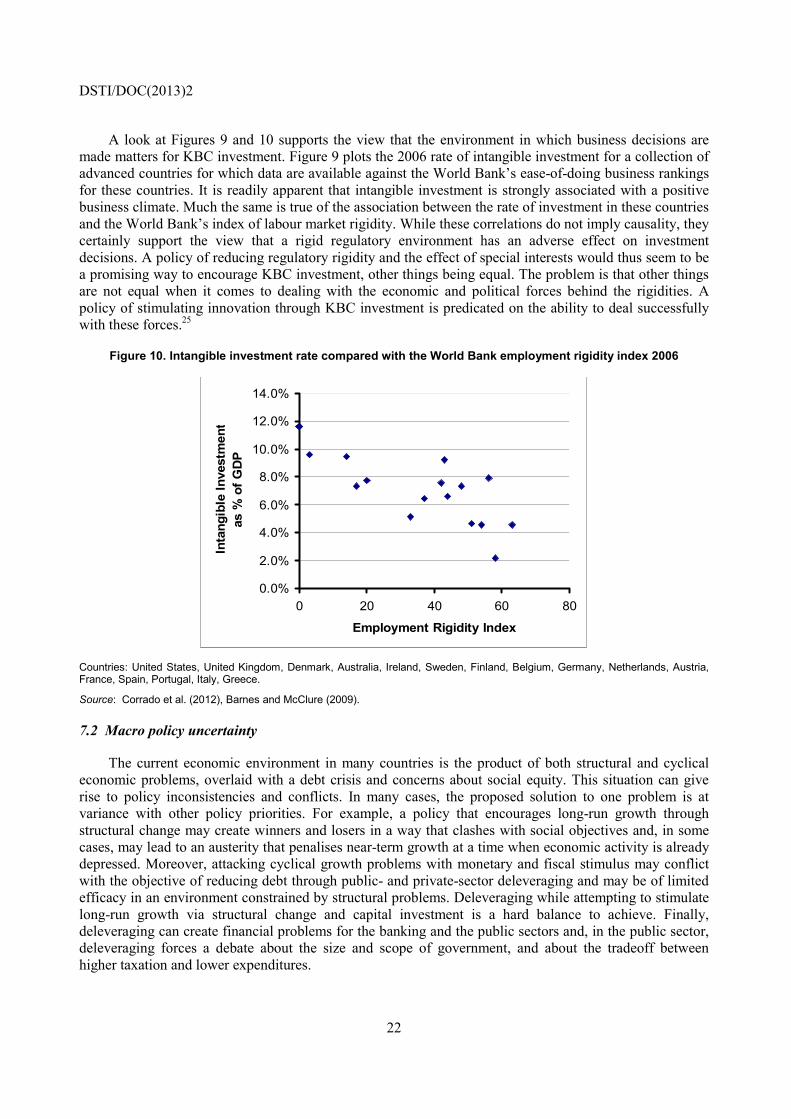
A look at Figures 9 and 10 supports the view that the environment in which business decisions are made matters for KBC investment. Figure 9 plots the 2006 rate of intangible investment for a collection of advanced countries for which data are available against the World Bank’s ease-of-doing business rankings for these countries. It is readily apparent that intangible investment is strongly associated with a positive business climate. Much the same is true of the association between the rate of investment in these countries and the World Bank’s index of labour market rigidity. While these correlations do not imply causality, they certainly support the view that a rigid regulatory environment has an adverse effect on investment decisions. A policy of reducing regulatory rigidity and the effect of special interests would thus seem to be a promising way to encourage KBC investment, other things being equal. The problem is that other things are not equal when it comes to dealing with the economic and political forces behind the rigidities. A policy of stimulating innovation through KBC investment is predicated on the ability to deal successfully with these forces.25
Figure 10. Intangible investment rate compared with the World Bank employment rigidity index 2006
Countries: United States, United Kingdom, Denmark, Australia, Ireland, Sweden, Finland, Belgium, Germany, Netherlands, Austria, France, Spain, Portugal, Italy, Greece.
Source: Corrado et al. (2012), Barnes and McClure (2009).
7.2 Macro policy uncertainty
The current economic environment in many countries is the product of both structural and cyclical economic problems, overlaid with a debt crisis and concerns about social equity. This situation can give rise to policy inconsistencies and conflicts. In many cases, the proposed solution to one problem is at variance with other policy priorities. For example, a policy that encourages long-run growth through structural change may create winners and losers in a way that clashes with social objectives and, in some cases, may lead to an austerity that penalises near-term growth at a time when economic activity is already depressed. Moreover, attacking cyclical growth problems with monetary and fiscal stimulus may conflict with the objective of reducing debt through public- and private-sector deleveraging and may be of limited efficacy in an environment constrained by structural problems. Deleveraging while attempting to stimulate long-run growth via structural change and capital investment is a hard balance to achieve. Finally, deleveraging can create financial problems for the banking and the public sectors and, in the public sector, deleveraging forces a debate about the size and scope of government, and about the tradeoff between higher taxation and lower expenditures.
0.0%
2.0%
4.0%
6.0%
8.0%
10.0%
12.0%
14.0%
0 20 40 60 80
Employment Rigidity Index
Inta
ngib
le In
vest
men
tas
% o
f GD
P
DSTI/DOC(2013)2
23
Finding a policy consensus in this tangled web is difficult, with many of the hardest decisions continually pushed into the future. This political dimension of growth policy is a major contributor to the macroeconomic and political uncertainty noted in the CEO surveys. Baker et al. (2012) attempt to quantify the degree of economic and policy uncertainty in the United States in the years from 1985 to 2012. They calculate an index of economic uncertainty for the entire period and find that it reached an all-time high of 574 in the last two years of the period, against a period average of 182. The authors do not claim that policy uncertainty necessarily causes slower economic growth, but do conclude that a strong association exists.
These findings are consistent with the concerns voiced by CEOs about the uncertain macroeconomic and regulatory environment. The fact that US companies are sitting on USD 1.7 trillion in “spare” cash can be interpreted as further evidence that these constraints are important (Samuelson, 2012). It seems reasonable to conclude that uncertainty is another obstacle that must be overcome if individual KBC policies are to be effective.
7.3. Tax policy
Like deregulation and deleveraging, tax policy has both an economic and a political component. From an economic standpoint, tax policy is a traditional tool for stimulating growth by subsidising capital formation. This approach has been extended to intellectual property and could, in principle, be further extended to include a broad range of KBC investments. From a political standpoint, tax incentives for capital tend to benefit the owners of capital and technology and clash with distributional and deleveraging objectives. As a result, income originating in businesses where investment decisions are made, may end up facing higher rather than lower taxes on average.
These considerations affect any discussion of how tax policy might encourage investment in KBC. From a purely economic standpoint, several points should be made about the taxation of income from KBC. First, KBC enjoys a tax advantage that is available to some but not all tangible capital: it is treated as an expense for tax purposes and written off immediately. This means that there is no expected ex ante tax on income from the marginal investment. What gets taxed are the ex post rents accruing to successful innovation. By implication, a system with a low average tax rate on income accruing to capital is one way to encourage risk-taking innovation by increasing the size of the after-tax prize. A system of high marginal tax rates on rents that raises the same amount of revenue has the opposite effect.
A system of targeted tax incentives is an alternative to a broad-based low-rate system. In this regard, some thought might be given to extending R&D tax credits to non-conventional R&D and other innovation co-investments. Some policy creativity might be required to do this, but since the aggregate value of all KBC greatly exceeds the conventional R&D component, the effort may be worthwhile.
Another issue arises because small firms have the highest rates of R&D investment (Table 2), but they may have little or no taxable income and therefore cannot benefit from income tax incentives unless they are refundable. For such firms, relief from payroll taxes and other social security levies that affect cash flow is often a bigger issue.
A final point is applicable to both tangible and intangible capital, as well as to high-income human capital (entrepreneurs and creative “stars”). A basic principle of tax incidence (the inverse elasticity rule) holds that, under certain conditions, an efficient tax system should tax things for which supply or demand are relatively fixed (inelastic). The more elastic the supply of an item is in any one place, the more easily a tax is avoided. Since capital and technology are highly mobile in today’s globalised open economies, taxing them often results in low revenues and high tax distortions. The problem is exacerbated by tax competition among countries and regions. Tax competition has been used (often effectively) by individual
DSTI/DOC(2013)2
24
governments to promote growth within their jurisdictions, despite its unappealing distributional and tax revenue aspects. One implication is that, absent major changes in global tax relations, a regime of high marginal tax rates on income from highly mobile factors is a risky strategy if the objective is to encourage KBC investment.
7.4. Education policy
Improving the quality of public education and increasing its quantity are widely seen as ways to address the shifting demand for worker skills in an increasingly knowledge-based economy. One goal is to raise worker productivity in a way that leads to higher wages and perhaps reverses the hollowing-out problem. This goal is consistent with the human capital priority identified by business surveys. One popular solution is to spend more on primary and secondary education, another is to make college education more affordable. Yet another is to train more scientists and engineers.
There is nothing inherently wrong with these educational strategies. Historically, they have been a key means of providing the kind of labour force needed to sustain high rates of economic growth. However, the problem with a “more education” strategy is that levels of educational attainment are already very high in most advanced economies, prompting such questions as: How much education is enough for the economic needs of a country? Is more always better?
The answer in some countries is, sadly, no. The possession of a college degree is, by itself, no assurance of higher cognitive skills, and many college graduates are disappointed by their labour market outcomes.26 The gap between skills and years of education is the central focus of the 2010 report by the OECD on its Programme for International Student Assessment (PISA). This study found that:
“PISA surveys reveal wide differences in the performance of education systems in terms of the learning outcomes achieved by students. For some countries, the results from PISA are disappointing, showing that their 15-year-olds’ performance lags considerably behind that of other countries, sometimes by the equivalent of several years of schooling and sometimes despite high investments in education.”
In other words, spending is not enough and should not be mistaken for the quality of education, just as education should not be mistaken for skills in analyses of labour markets and economic growth. In this vein, the OECD study goes on to argue that raising cognitive skills, as measured by PISA scores, has an important payoff for economic growth:
“A modest goal of having all OECD countries boost their average PISA scores by 25 points over the next 20 years – which is less than the most rapidly improving education system in the OECD, Poland, achieved between 2000 and 2006 alone – implies an aggregate gain of OECD GDP of USD 115 trillion over the lifetime of the generation born in 2010.”
This argument suggests that raising the quality of education should be a fundamental aspect of growth policy, particularly one that involves KBC investment.
Linking education and worker training is another area that offers an important policy opportunity. An appropriately designed educational system provides a supply of skilled workers, but a supply of skills alone is not sufficient and must be matched by a corresponding demand on the part of firms. One way to accomplish this involves a curriculum that produces workers that businesses want to hire. This is a natural area for public-private partnership programmes, perhaps involving continuing education, apprenticeships, and curriculum design that includes vocational education with the skills needed to function in a more complex technological environment.27
DSTI/DOC(2013)2
25
Developing and sustaining the skills and characteristics needed for employment in a knowledge-based economy may have a large payoff in terms of middle-class employment and living standards. Failure in this area may exact a large penalty on growth.
7.5 Innovation accounting
A fundamental premise of this study is that if KBC is as important as the empirical evidence suggests, then it deserves to be taken into account when formulating economic policy. By extension, it deserves to be accounted for in official macro statistics. This is beginning to happen, with the move to capitalise R&D in the UN System of National Accounts (software has been treated as capital for a number of years). However, these steps, welcome as they are, fall well short of a full description of KBC (recall Table 1). As a result, even R&D-augmented conventional accounts will misstate the level and growth rates of aggregate investment, GDP, and wealth, as well as labour’s true share of national income, the rate of saving, and the rate of return to capital.
Corrado and Hulten (2012) set out the steps involved in creating a national innovation account as a supplement to the standard national income and product accounts. This satellite account would include the items of intangible capital listed in Table 1, both as inputs to innovation and as outputs of an investment sector, all harmonised with the existing accounts to ensure internal consistency. A great deal more work needs to be done to make this a reality, judging by the amount of work undertaken by the United States Bureau of Economic Analysis in developing their path-breaking national R&D satellite account. However, as daunting the development of a full set of non-market KBC accounts may seem, it is much less daunting than the original task of building the national accounts from scratch.
Development of the KBC part of the innovation account is only half of the problem. KBC is an input to the innovation process, but what about the corresponding output? One “output” of KBC is the increase in the productive efficiency of the processes through which output is produced. However, NSF data show that process-oriented R&D only accounts for a small share of the total, with the rest going to the development of superior products.28 The output growth associated with innovation investment is in fact a combination of the quality and quantity of products – of better medicines and more medicines, better computers and more computers – and to get a full account of the benefits of KBC-driven innovation, both “more” and “better” need to be measured.
Unfortunately, the former is more easily accomplished than the latter, since the quantity of units involved in a market transaction can generally be observed (though some services present problems). When it comes to quality, there is little data available for a direct comparison. However, it is sometimes possible to compare the relative prices of new varieties of a good and infer “quality” indirectly from the price differentials, but this is generally not possible when innovation takes the form of new goods rather than superior new varieties. Methods that measure the benefits of new goods are controversial (National Research Council, 2002), but their omission can result in an understatement of the true extent of innovation. Speaking to this point, William Nordhaus (1997) argued in his paper on the history of lighting that official price and output data “may miss the most important revolutions in history,” because they miss the really large (“tectonic”) advances in technology.
This large “miss” may well include the revolution in information technology. Many sectors of the economy have generated new “tectonic” products: statins, cellular telephones, magnetic resonance imaging, automated teller machines, the global positioning system, credit default swaps, e-commerce, search engines, social media, robotic or computer-controlled machines in manufacturing. Such products are inherently hard to value because of their qualitative and transformational nature. The exact size of the “miss” for this type of product is not known, but intuition suggests that it may be quite large and that accurate measurement should be a priority for income and growth accounting. Otherwise, conventional measures of output may understate the true magnitude of the information revolution.29
DSTI/DOC(2013)2
26
The case for a national innovation account finds a parallel at the level of individual companies. Financial accounting practice does not treat the intangibles developed within a company as capital and thus excludes them from the balance sheet (externally acquired intangibles are treated differently), and the value of own-account intangible investment produced in each year is not counted as part of the company’s total product. As previously noted, Hulten and Hao (2008) find that the value of the omitted own-account intangibles exceeds the reported net worth in 2006 in a sample of R&D-intensive companies. A large literature has developed on the problems arising from these omissions (e.g. Lev, 2001). It can be summarised loosely by the well-known saying, “if you can’t measure it, you can’t manage it,” often attributed to Peter Drucker. From the standpoint of innovation policy, a case can be made for accounting rules that highlight the role of KBC within a firm, both as a management aid and as tool for policy makers to monitor the extent of innovation activity at the firm level.
8. Summing up: Opportunity but no easy answers
Angus Maddison’s study(2007) of the historical evolution of world GDP per capita provides a useful frame of reference for sorting out the complex currents and cross-currents of the recent growth and debt crisis. His estimates reveal the crucial importance of the industrial revolution as the source of the prosperity of the world’s advanced economies. He finds that the world’s real income per capita increased from USD 615 in 1700 to USD 667 in 1820, followed by a large jump to USD 5 709 by 1998. Almost all of the nine-fold increase over the 1700-1998 period came during the later stages of the first industrial revolution and the two technological revolutions that followed. Moreover, the increase between 1700 and 1998 was by far the largest in the countries in which the technological revolutions occurred. The increase in the countries of Western Europe was nearly 18-fold, and that in the United States over the shorter 1820-1998 period was estimated to be 22-fold.
This long-run perspective puts advances in technology and changes in the organisation of production at the center of this phenomenal growth record. However, the path to prosperity was by no means smooth or tranquil. The economic transformations wrought by technology were highly disruptive and produced periods of immiseration and cyclical swings in economic activity. Social legislation and, later, counter-cyclical policy, helped moderate these problems (indeed, were necessary factors), but, in the end, it was innovation that fueled the remarkable growth in living standards. The current policy debates over appropriate remedies for the economic crisis would do well to remember this historical lesson.
Unfortunately, it is one thing to recognise what should be done and quite another to make it happen politically. The tendency has been to pursue policies that avoid the pain of adjustment costs and “kick the can down the road,” by maintaining current living standards through unsustainable transfers of public and private consumption from future years to the present (recall the massive increase in public and private debt documented in the 2012 McKinsey Global Institute study), or by divisive debates over who should bear the costs of adjustment. However, a no-pain growth policy is not a feasible long-run option, no matter how congenial some politicians may find it. This point was driven home by German Chancellor Angela Merkel in an interview with the Financial Times in which she observed that Europe accounts for only some 7% of the world’s population and about a quarter of its GDP, but also for half the world’s social spending.30 She went on to note that this is not sustainable without a lot of hard work and frugality.
A failure to face the sometimes painful logic of innovation and growth risks perpetuating the cost of structural rigidities. In this regard, it is fitting to end by quoting from the 2000 OECD study by Paul Schreyer, written before the current growth crisis and before the term KBC was even coined and its benefits documented:
DSTI/DOC(2013)2
27
“Structural unemployment and weak employment growth have been salient characteristics of labour market developments in many OECD countries. There are a number of explanations for this problem, including macro-economic conditions, the functioning of labour and product markets and the effects of technological change and globalisation. All of these aspects have been investigated in recent years, including by in-depth work carried out by the OECD. One general conclusion from the different studies is that unemployment often reflects a lack of economies’ capacity to adapt to change. The degree at which economies are adaptable depends on the nature of institutions, structural policies, regulations and legal settings as well as social and cultural values.”
The capacity to adapt to change has both public- and private-sector components. Government policies on education, infrastructure (particularly technology infrastructure), structural reform, and macroeconomic stability, are key aspects of a successful growth strategy. However, one of the central points of this paper is that private-sector involvement through KBC investment is also a critically important and, in many cases, a essential, part of the growth process. As Schreyer puts it:
“Governments can influence incentives and framework conditions that bear on an economy’s capacity to adapt but the actual implementation of change rests with private agents. Some of the most important agents of change are entrepreneurs – individuals with the capacity and willingness to take risks, to be innovative and to exploit business opportunities in a market environment.”
One might also add that this applies to companies as well. Innovation is more than just good ideas, it is also about good organisations, large and small, that are able to execute and translate these ideas into new products, processes, and markets.
Where does this leave KBC policy? It remains one of the most promising ways to encourage economic growth despite all the complexities and policy conflicts touched on in this paper. It does not avoid the painful adjustment costs of technological unemployment and structural reform, but in the long run, it provides the foundation on which future prosperity can be built.
DSTI/DOC(2013)2
28
NOTES
1 In summarising the current situation in the United States, Samuelson (2012) has observed that the economy
has grown at an annual rate of approximately 2% a year since the recession officially ended in mid-2009, compared to a post-World-War II average of 4.5% at this stage of the recovery. This “feeble” performance has unfolded despite the Keynsian stimulus of USD 5 trillion in federal government budget deficits since late 2008, and a Federal Reserve that has pumped more than USD 2 trillion into the economy through bond purchases. Some prominent observers see monetary policy as moving into uncharted territory, with the risk of unintended consequences and potentially adverse outcomes (e.g. El-Erian, 2012; Fisher, 2012; and Lacker in Appelbaum, 2013).
Forecasts by Van Ark (2012) suggest that there is potentially room for both Keynsian demand-side and supply-side structural reform policies. His estimates put the current gap between current and potential output at about 6% of potential US GDP, and 2.8% of the EU27. At the same time, his forecasts suggest that the trend in potential real GDP growth over the next 12 years will decline relative to historical norms.
2 Neither term is entirely suitable. Intangible capital is the name used in most of the literature on the subject, but in common usage, the term “intangibles” is evocative of a vague list of positive attributes. It is also easily confused with the accounting concept, which is essentially intangible capital acquired externally though mergers and acquisitions. The term “knowledge-based capital” captures more of the role played by this type of capital, but would also reasonably seem to include high-technology tangible capital such as computers, telecommunication equipment, and robotic manufacturing machines. Despite these issues, the two terms will be used interchangeably in this paper.
3 Hulten (2012) provides a brief history of the theoretical origins of the KBC concept and its role within a firm. The questions raised by Coase (1937), Hayek (1945), Penrose (1959), Machlup (1962), and Prescott and Visscher (1980) about the nature of the firm and the role of information are the conceptual starting points for the current empirical literature on KBC.
4 Brand equity is perhaps the most controversial item on this list. However a closer look at the pharmaceutical and software sectors shows that it is an important part of the innovation process. A company must be able to sell a new product if it undertakes the expense of developing it, and the selling costs are part of the overall benefit-cost calculation. Research by Hall (1993) suggests that advertising, which is only a fraction of total marketing expenses, may be a stronger determinant of company value than expenditures on R&D. Marketing and customer relations are likely to play an even more important role in the future as the information technology (IT) revolution leads to a rise in product and process customisation, as well as customer interaction.
5 When the contributions of IT capital and the labour composition effect (largely an education effect) are added to the KBC effect to obtain a broader measure of how the transition to a knowledge-based economy affects growth, the three sources explain nearly half the growth rate of output per worker in the US business sector. The sources-of-growth framework and its interpretation are summarised in Hulten (2010b).
6 The estimates of Figure 3 refer to the average experience of firms in the United States business sector as a whole. A recent study of the sources of growth of the Microsoft Corporation, one of the key contributors to the IT revolution, found that KBC was an even more important driver of real value added per worker (Hulten, 2010a). Over the period 1995 to 2003, the growth in Microsoft’s intangible capital accounted for more than 60% of its output growth.
DSTI/DOC(2013)2
29
7 Brazil, the Russian Federation, India and the People’s Republic of China.
8 Previous CEO Challenge surveys listed similar, but not identical concerns, reflecting the changing economic environment over the last three years. The top challenges for US CEOs in the previous year were: business growth, government regulation, innovation, talent, and cost optimisation. The challenges from the year before were: excellence in execution, sustained and steady top line growth, consistent execution of strategy by top management, customer loyalty/retention, profit growth, and government regulation.
9 In fact, the average rates of growth of KBC for the periods 1990-2000, 2000-07, and 2007-11 hardly changed at all. Recent NSF BRDIS data for 2009 suggest business spending for R&D declined only marginally compared to previous years and R&D workers hardly at all (for reference to NSF data, see Wolfe, 2012).
10 In their discussion of this debate, Brynjolfsson and McAfee (2011) cite Cowen (2011) and Rifkin (1994) as among the leading pessimists. This list can be expanded to include the recent work of Robert Gordon (2012).
11 See Greenwood (1997) for an earlier articulation of the problem. Arthur cites Keynes’ 1930 warning about technological unemployment as a possible consequence of a high rate of economic growth.
12 The difficulty of sorting out the cyclical and structural contributions to unemployment is a long- standing problem, as Abraham and Katz (1986) indicate. In the current economic context Lazear and Spletzer (2012) revisit the problem and come down on the side of the cyclical explanation.
13 For examples of the recent literature on this topic, see Brynjolfsson and McAfee (2011) and Jaimovich and Siu (2012).
14 One implication of this analysis, and supporting data on the relative stagnation of US median household income, is that the hollowing-out problem reflects a structural trend that predates the current crisis. This trend is one of the likely factors behind the large increase in overall leverage documented in the 2012 McKinsey Global Institute study, since one way to compensate for lagging growth in living standards is to borrow against future consumption
15 Globalisation is a complex phenomenon with strong historical and political roots. However, the technological revolutions in communication, transportation, and information management were important enabling factors in the growth of multinational corporations and the development of global supply chains.
16 The literature envisions a renaissance in the manufacturing sectors of high-wage countries based on the adoption of advanced technologies. For citations to this literature, see Hemphill (2012), Fallows (2012), Fishman (2012), Kaushal et al. (2011), Marsh (2012a, 2012b), PwC (2012), and the references contained therein.
17 Demographic trends are a further source of ambiguity when thinking about the problem of technological unemployment. Technology may reduce the demand for labour in future years, but population replacement rates in many countries are such that there will also be a decline in the supply. The latter may mitigate to some extent the effects of the former, but, and the same time, dependency ratios will rise, making the overall picture even more ambiguous.
18 Tushman and O’Reilly (1996) examine this problem and pose the following questions: “Why is anything but incremental change often so difficult for the most successful organisations?’, and “Why is this problem such an enduring one?”. Tett’s 2013 article about the Sony Corporation in the Financial Times offers a recent example of how internal organisational rigidity, in the form of operational “silos,” can inhibit innovation (www.ft.com/intl/cms/s/2/ ca14070a-603a-11e2-b657-00144feab49a.html#axzz2IR9qnJH2).
DSTI/DOC(2013)2
30
19 In The Third Industrial Revolution, Greenwood (1997) observes that the “adoption of new technologies is
notoriously slow” (page 16). He cites a number of studies with evidence supporting the slow-diffusion hypothesis.
20 The penetration of new products into the market place may also occur with lags. In their study of the diffusion of new pharmaceutical drugs to consumers, Trusheim et al. (2010) found that uptake reached a peak about six years from date of introduction
21 The evidence of significant differences in organisational efficiency is by no means limited to the Bloom and Van Reenen studies. A large literature exists on the dispersion of productivity among the establishments of given industries. This research is summarised by Syverson (2011), who reports that in a 2004 study of four-digit SIC industries in US manufacturing, “the plant at the 90th percentile of the productivity distribution makes almost twice as much output with the same measured inputs as the 10th percentile plant ” (page 326). Such a wide dispersion suggests, again, the opportunity for policy to achieve significant gains in output growth from a given resource base, either through intra-firm improvement or through the reallocation of resources to more efficient firms.
22 Start-up firms have been an important source of innovation in the IT economy, but are particularly prone to failure. It is part of the risk associated with entrepreneurship and innovation. Penalising failure through overly restrictive bankruptcy laws or stigmatising failed entrepreneurship creates negative ex ante incentives for risk taking.
23 Hall et al. (2010) review the huge literature on the private and social returns to R&D investment. While there is a large variance in the individual estimates, the authors conclude that the rate of return is generally positive and generally larger than the return to “ordinary” capital, and the corresponding social rate of return is “almost always estimated to be substantially greater than the private returns (page 1073).” The study did not focus on KBC spillovers, but the diffusion of best-practice organisational and marketing methods previously noted suggests that significant opportunities exist.
24 There is also an international aspect to the problem. While a policy that encourages the diffusion of technology within a country may have a beneficial effect on domestic output growth and employment, it may have a rather different effect when the benefits accrue to foreign competitors.
25 One aspect of the ease of doing business deserves special mention. Rent seeking through litigation and the legal struggle to protect property rights add uncertainty and expense to many business decisions. Several high-profile cases in the technology area bear witness to the importance of this issue. Tort reform is frequently brought up as a way of improving the business climate.
26 This point is made forcefully in the 2013 McKinsey-Chegg survey of recent college graduates in the US. The report points to a paradox in which many of the graduates surveyed felt that they were underprepared by their college education for the “world of work” (30% of the graduates from four-year institutions), while, at the same time, more than 40% of the graduates from these institutions felt that they were overqualified, in the sense that their jobs did not require a four-year degree.
27 See, for examples, Cook (2012) and Lambert (2012), for recent reference to these issues, and Hempill (2012) and the 2011 report “Manufacturing’s Wakeup Call” by Booz and Company and the University of Michigan’s Tauber Institute.
28 Recent estimates from the National Science Foundation’s Business R&D and Innovation Survey (BRDIS) suggest that pure process-oriented R&D is a small share of the total, accounting for only 15% of the USD 224 billion in domestic R&D paid for by companies. The balance is for product development, though some of the new products were inputs to the product process (capital-embodied technical change, improved materials, etc.). The fraction of R&D devoted primarily to new consumer goods, such as the iPhone and iPod, is not reported in the NSF surveys.

DSTI/DOC(2013)2
31
29 The intangible nature of much knowledge-based output – the “better” versus “more” problem – makes it
more likely that the mismeasurement of product quality change has increased during the IT era. Moreover, much of the benefit to consumers of the information made available through the internet, as well as the value of social networks, may not be captured by conventionally measured GDP. Robert Gordon’s pessimistic view that the IT revolution has had a smaller measured impact on productivity growth than the preceding technology revolutions may therefore be due, in part, to a greater degree of output mismeasurement in recent years.
30 Details of this interview can be found in a 16 December 2012, Financial Times article by Quentin Peel, “Merkel warns on cost of welfare,” at www.ft.com/intl/cms/s/0/8cc0f584-45fa-11e2-b7ba-00144feabdc0.html#axzz2Hcr9ndTa.
DSTI/DOC(2013)2
32
REFERENCES
Abel, J. R. and R. Deitz (2012), “Job Polarization and Rising Inequality in the Nation and the New York–Northern New Jersey Region,” Current Issues in Economics and Finance, Federal Reserve Bank of New York, Vol. 18, No. 7.
Abraham, K. and L. Katz (1986), “Cyclical Unemployment: Sectoral Shifts or Aggregate Disturbances?” ,Journal of Political Economy, Vol. 94, pp. 407-422.
Appelbaum, B. (2013), “A Bold Dissenter at the Fed, Hoping His Doubts Are Wrong,” New York Times, January 8, www.nytimes.com/2013/01/09/business/ a-bold-dissenter-at-the-fed-hoping-his-doubts-are-wrong.html?_r=1&.
Arthur, W. B. (2011), “The Second Economy,” McKinsey Quarterly, October, www.mckinseyquarterly.com/The_second_economy_2853.
Autor, D. H., F. Levy and R. J. Murnane (2003), “The Skill Content of Recent Technological Change: An Empirical Investigation,” Quarterly Journal of Economics, November, Vol. 118(4), pp. 1279-1333.
Autor, D. H., L. F. Katz and M. S. Kearney (2012), “The Polarization of the U.S. Labor Market,” NBER Working Paper 11986, August.
Baker, S. R., N. Bloom and S. J. Davis (2012), “Uncertainty and the Economy,” Policy Review, No. 175, 2 October.
Barnes, P. and A McClure (2009), Investments in Intangible Assets and Australia’s Productivity Growth, Productivity Commission Staff Working Paper, Commonwealth of Australia, March.
Bloom, N. and J. Van Reenen (2007), “Measuring and Explaining Management Practices Across Firms and Nations,” Quarterly Journal of Economics, Vol. 122 (4), pp. 1351-1408.
Bloom, N., B. Eifert, A. Mahajan, D. McKenzie and J. Roberts (2012), “Does Management Matter? Evidence From India,” 25 August (forthcoming, Quarterly Journal of Economics).
Brynjolfsson, E., L.M. Hitt and S. Yang (2002), "Intangible Assets: Computers and Organizational Capital," Brookings Papers on Economic Activity: Macroeconomics (1), pp. 137-199.
Brynjolfsson, E. and A. McAfee (2011), Race Against The Machine: How the Digital Revolution is Accelerating Innovation, Driving Productivity, and Irreversibly Transforming Employment and the Economy, Digital Frontier Press.
Clarkson, K. W. (1996), “The Effects of Research and Promotion on Rates of Return,” in Competitive Strategies in the Pharmaceutical Industry, Robert B. Helms, ed., American Enterprise Institute for Public Policy Research, Washington, DC, pp. 238-268.
DSTI/DOC(2013)2
33
Clarkson, K. W. (1997), Intangible Capital and Rates of Return, Effects of Research and Promotion on Profitability, American Enterprise Institute Studies in Economic Policy, 138, American Enterprise Institute for Public Policy Research, Washington, DC.
Coase, R. (1937), "The Nature of the Firm," Economica, 4, 16, November, pp.386-405.
Conference Board (2010), CEO Challenge 2010: Top 10 Challenges, Research Report R-1461-10-RR, The Conference Board, New York.
Conference Board (2012), CEO Challenge 2012: Risky Business: Focusing on Innovation and Talent in this a Volatile World, Research Report, The Conference Board, New York.
Cook, C. (2012), “The complex route to learning a trade,” Financial Times, October 2, www.ft.com/intl/cms/s/0/4757109a-0c8f-11e2-a73c-00144feabdc0.html#axzz2Hcr9ndTa.
Corrado, C. and C. Hulten (2010), “How Do You Measure a Technological Revolution?”, American Economic Review, May, pp. 99-104.
Corrado, C. A. and C. R. Hulten (2012), “Innovation Accounting,” Paper prepared for the NBER-CRIW conference, “Measuring Economic Progress and Economic Sustainability,” Cambridge, Massachusetts, 6-8 August 2012.
Corrado, C., C. Hulten and D. Sichel (2005), “Measuring Capital and Technology: An Expanded Framework.” In Measuring Capital in the New Economy, C. Corrado, J. Haltiwanger, and D. Sichel, (eds.), Studies in Income and Wealth, Vol. 65. Chicago: The University of Chicago Press, pp. 11-41.
Corrado, C., C. Hulten and D. Sichel (2009), “Intangible Capital and Economic Growth,” The Review of Income and Wealth, Vol. 55 (3), pp. 661-685.
Corrado, C. A., J. Haskel, M. Iommi, C. Jona-Lasinio (2012), “Intangible Capital and Growth in Advanced Economies: Measurement and Comparative Results,” CEPR Discussion Paper No. DP9061, July.
Cowen, T. (2011), The Great Stagnation: How America Ate All the Low-Hanging Fruit of Modern History, Got Sick, and Will (Eventually) Feel Better, Penguin Group, New York .
Duke University/CFO Magazine (2010), Global Business Outlook Survey, Duke University’s Fuqua School of Business, September, www.cfosurvey.org.
Dutz, M. A., S. Kannebley Jr., M. Scarpelli and S. Sharma (2012), “Measuring Intangible Assets in an Emerging Market Economy, An Application to Brazil,” Poverty Reduction and Economic Management Network, Economic Policy and Debt Department, Policy Research Working Paper 6142, The World Bank, Washington, DC.
El-Erian, M. (2012), “QE3 is a sign of the Fed’s policy purgatory,” Financial Times, 13 September. http://blogs.ft.com/the-a-list/2012/09/13/qe3-is-a-sign-of-the-feds-policy-purgatory/#axzz2HcsWsYO9.
Fallows, J. (2012), “Mr. China Comes to America,” The Atlantic Monthly, December, pp. 55-66, www.theatlantic.com/magazine/archive/2012/12/mr-china-comes-to-america/309160/.
Fisher, R. (2012), “We Are Sailing Deeper Into Uncharted Waters”, Remarks Before the Harvard Club of New York City, 19 September,
DSTI/DOC(2013)2
34
www.realclearpolitics.com/articles/2012/09/22/we_are_sailing_deeper_into_uncharted_waters_115536.html (also www.dallasfed.org/news /speeches/fisher/2012/fs120919.cfm.
Fishman, C. (2012), “The Insourcing Boom,” The Atlantic Monthly, December, pp. 45-52, www.theatlantic.com/magazine/archive/2012/12/the-insourcing-boom/309166/.
Fukao, K., T. Miyagawa, K. Mukai, Y. Shinoda and K. Tonogi (2009), “Intangible Investment in Japan: Measurement and Contribution to Economic Growth,” The Review of Income and Wealth, Vol. 55(3), September.
Garvin, D. A. and L. C. Levesque (2006), “Meeting the Challenge of Corporate Entrepreneurship,” Harvard Business Review, October, http://hbr.org/2006/10/meeting-the-challenge-of-corporate-entrepreneurship/ar/1.
Gordon, R. J. (2012), “Is U.S. Economic Growth Over? Faltering Innovation Confronts the Six Headwinds,” NBER Working Paper 18315, August.
Greenwood, J. (1997), The Third Industrial Revolution, AEI Press.
Griliches, Z. (1957), “Hybrid Corn: An Exploration in The Economics of Technological Change.” Econometrica, Vol. 25, 4, October.
Hall, B. (1993), “The Stock Market’s Valuation of R&D Investment During the 1980’s,” American Economic Review, Vol. 82, 2, May, pp. 259-264.
Hall, B., J. Mairesse and P. Mohnen (2010), “Measuring the Return to R&D,” Handbook of the Economics of Innovation, Chapter 24, B. H. Hall and N. Rosenberg (eds.), Elsevier-North Holland, pp. 1033-1082.
Haltiwanger, J. C., R. S. Jarmin and J. Miranda (2010), “Who Creates Jobs? Small vs. Large vs. Young,” NBER Working Paper 16300, August.
Haskel, J., R. Z. Lawrence, E. E. Leamer and M. J. Slaughter (2012), “Globalization and U.S. Wages: Modifying Classic Theory to Explain Recent Facts,” Journal of Economic Perspectives, Vol. 26, 2, Spring, pp. 119-140.
Hayek, F.A. (1945), “The Use of Knowledge in Society,” The American Economic Review, Vol. 35, 4 September, pp. 519-530.
Hemphill, T. A. (2012), “U.S. Manufacturing’s Brave New World,” The American Magazine, Friday, September 14, http://american.com/archive/2012/september/u-s-manufacturings-brave-new-world.
Hulten, C. R. (2010a), “Decoding Microsoft: Intangible Capital as a Source of Company Growth,” NBER Working Paper 15799, March.
Hulten, C. R. (2010b), “Growth Accounting,” Handbook of the Economics of Innovation, Chapter 23, B. H. Hall and N. Rosenberg (eds.), Elsevier-North Holland, pp. 987-1031.
Hulten, C. R. (2012), Intangible Capital, Product Innovation, and the Theory of the Firm Growth, University of Maryland.
DSTI/DOC(2013)2
35
Hulten, C. R. and J. X. Hao (2008), “What is a Company Really Worth? Intangible Capital and the ‘Market to Book Value’ Puzzle”, NBER Working Paper 14548, December.
Hulten, C. R. and J. X. Hao (2012), “The Role Of Intangible Capital in the Transformation and Growth of the Chinese Economy”, NBER Working Paper 18405, September.
Hulten, C.R., J. X. Hao, and K. Jaeger (2012), “The Measurement of India's Intangible Capital,” paper prepared for the World Input-Output Data project, The Conference Board, 2012.
IBM (2010), IBM 2010 Global CEO Study: Creativity Selected as Most Crucial Factor for Future Success. www.ibm.com/news/ca/en/2010/05/20/v384864m81427w34.html; www-03.ibm.com/press/us/en/pressrelease/31670.wss.
Jaimovich, N. and H. E. Siu (2012), “The Trend is the Cycle: Job Polarization and Jobless Recoveries,” NBER Working Paper No. 18334, August.
Jones, C. I. and J. C. Williams (2000), “Too Much of a Good Thing? The Economics of Investment in R&D,” Journal of Economic Growth, 5, March, pp. 65–85.
Kaushal, A., T. Mayor and P. Riedl (2011), “Manufacturing’s Wake-Up Call,” strategy+business, Issue 64, August 23/Autumn/Issue 6 (a survey of 200 manufacturing executives and experts, conducted by Booz & Company and the University of Michigan’s Tauber Institute for Global Operations), www.strategy-business.com/article/11306?gko=c3e5f.
Lambert, R. (2012), “Business can give school leavers real skills,” Financial Times, 2 October, www.ft.com/intl/cms/s/0/0905e16c-0ca9-11e2-b175-00144feabdc0.html#axzz2Hcr9ndTa.
Lazear, E. P. and J. R. Spletzer (2012), “The United States Labor Market: Status Quo or a New Normal?” NBER Working Paper 18386, September.
Lev, B. (2001), Intangibles: Management, Measurement, and Reporting, Brookings Institution Press, Washington, DC.
Linden, G., J. Dedrick and K L. Kraemer (2009), “Innovation and Job Creation in a Global Economy: The Case of Apple’s iPod,” Working Paper, Personal Computing Industry Center, UC Irvine, January.
Machlup, F. (1962), The Production and Distribution of Knowledge in the United States, Princeton University Press, Princeton, NJ.
Maddison, A. (2007), Contours of the World Economy, 1–2030 AD. Essays in Macro-Economic History, Oxford University Press, Oxford.
Mandel, M. (2006), “Why the Economy is a Lot Stronger Than You Think,” BusinessWeek, 13 February, pp. 62-70. www.businessweek.com/stories/2006-02-12/why-the-economy-is-a-lot-stronger-than-you-think.
Marrano, M. G, J. Haskel and G.Wallis (2009), “What happened to the knowledge economy? ICT, intangible investment and Britain’s productivity record revisited.” The Review of Income and Wealth, vol. 55 (3), pp. 686-716.
Marsh, P. (2012a), “Industry: Future factories,” and “Manufacturing set for decade high,” Financial Times, June 10, www.ft.com/intl/cms/s/0/dd9634d0-affd-11e1-ad0b-00144feabdc0.html#axzz2Hcr9ndTa.
DSTI/DOC(2013)2
36
Marsh, P. (2012b), “Levelling out: emerging markets and the New Industrial Revolution,” Financial Times blog, 27 August, http://blogs.ft.com/beyond-brics/2012/08/27/levelling-out-emerging-markets-and-the-new-industrial-revolution/#axzz2HcsWsYO9.
McKinsey & Company (In collaboration with Chegg, Inc.) (2013), Voice of the graduate, McKinsey & Company, May (at http://mckinseyonsociety.com/voice-of-the-graduate/).
Nakamura, L. (2001), “What is the US Gross Investment in Intangibles? (At Least) One Trillion Dollars a Year!” Federal Reserve Bank of Philadelphia Working Paper No. 01-15.
National Federation of Independent Business (2012), Small Business Economic Trends survey, September, www.nfib.com/research-foundation/surveys/small-business-economic-trends.
National Research Council (2002), At What Price?: Conceptualizing and Measuring Cost-of-Living and Prices Indexes, Panel on Conceptual, Measurement, and Other Statistical Issues in Developing Cost-of-Living Indexes, C. Schultze and C. Mackie (eds.), Committee on National Statistics, National Academy Press, Washington, DC.
National Science Foundation (2012), National Patterns of R&D Resources: 2009 Data Update, National Center for Science and Engineering Statistics, Detailed Statistical Tables, NSF 12-321. June.
National Venture Capital Association (2012), 2012 Yearbook, prepared by Thomson Reuters for the National Venture Capital Association, April, www.nvca.org/2012Yearbook.
Nerlove, M. and K. J. Arrow (1962), "Optimal Advertising Policy Under Dynamic Conditions,” Economica, New Series, Vol. 29, 114, May, pp. 129-142.
Nordhaus, W. D. (1997), "Do Real Output and Real Wage Measures Capture Reality? The History of Lighting Suggests Not," T. Bresnahan and R. J. Gordon (eds.), The Economics of New Goods, Studies in Income and Wealth, Vol. 58, University of Chicago Press for the National Bureau of Economic Research, Chicago, pp. 29-66.
OECD (1998), Measuring Intangible Investment: National Efforts to Measure Intangible Investment, OECD, Paris.doi: 10.1787/9789264163416-en
OECD (2010), The High Cost of Low Educational Performance: The Long-run Economic Impact of Improving PISA Outcomes, PISA, OECD Publishing. doi: 10.1787/9789264077485-en
OECD (2011), Divided We Stand: Why Inequality Keeps Rising, OECD Publishing. doi: 10.1787/9789264119536-en
Peel, Q. (2012), “Merkel warns on cost of welfare,” Financial Times, 16 December, www.ft.com/intl/cms/s/0/8cc0f584-45fa-11e2-b7ba-00144feabdc0.html#axzz2Hcr9ndTa.
Penrose, E. T. (1959), The Theory of the Growth of the Firm, Basil Blackwell Mott.
Prescott, E. C. and M. Visscher (1980), “Organizational Capital,” Journal of Political Economy, Vol. 88, 3, pp. 446-461.
PwC (2012), A homecoming for US manufacturing? PricewaterhouseCoopers LLP, September, www.pwc.com/us/en/industrial-products/publications/us-manufacturing-resurgence.jhtml.
DSTI/DOC(2013)2
37
Reedy, E. J, and R. E. Litan (2011), “Starting Smaller; Staying Smaller: America’s Slow Leak in Job Creation,” Ewing Marion Kauffman Foundation, July, www.kauffman.org/uploadedfiles/ job_leaks_starting_smaller_study.pdf.
Rifkin, J. (1994), The End of Work, Tarcher.
Roxburgh, C., S. Lund, T. Daruvala, J. Manyika, R. Dobbs, R. Forn and K. Croxson (2012), Debt and deleveraging: Uneven progress on the path to growth, Report, McKinsey Global Institute, January 2012. www.mckinsey.com/insights/mgi/research/financial_markets/uneven_progress_on_the_path_to_growth.
Sadeghi, A., J. R. Spletzer and D. M. Talan (2012), High Growth Firms, US Bureau of Labor Statistics, unpublished, 30 March.
Samuelson, R. (2012), “Why the Recovery Is Feeble,” Washington Post, 25 November. www.washingtonpost.com/opinions/robert-samuelson-why-the-recovery-is-feeble/2012/11/25/3c511afa-3585-11e2-9cfa-e41bac906cc9_story.html.
Schreyer, P. (2000), "High-Growth Firms and Employment", OECD Science, Technology and Industry Working Papers, No. 2000/03, OECD Publishing. doi: 10.1787/861275538813
Solow, R. M. (1957), "Technical Change and the Aggregate Production Function," Review of Economics and Statistics, Vol. 39, pp. 312 320.
Strangler, D. (2010), “High-Growth Firms and the Future of the American Economy, “Ewing Marion Kauffman Foundation, March, www.kauffman.org/newsroom/high-growth-firms-account-for-disproportionate-share-of-job-creation-according-to-kauffman-foundation-study.aspx.
Syverson, C. (2011), “What Determines Productivity,” Journal of Economic Literature, XLIX, 2, pp. 326-365.
Tett, G. (2013), “Why no one’s listening to a Walkman,” Financial Times, 18 January, www.ft.com/intl/cms/s/2/ca14070a-603a-11e2-b657-00144feab49a.html#axzz2IR9qnJH2.
Trusheim, M., M. L. Aitken and E. R. Berndt (2010), “Characterizing Markets For Biopharmaceutical Innovations: Do Biologics Differ From Small Molecules?,” Working Paper 16014, May 2010.
Tushman, M. L., and C. A. O’Reilly III (1996), “Ambidextrous: Managing Evolutionary and Revolutionary Change,” California Management Review, Vol. 38, No. 4, Summer, pp. 8-30.
US Department of Labor, Bureau of Labor Statistics (1983), Trends in Multifactor Productivity, 1948-81, Bulletin 2178, USGPO, Washington, DC, and various updates and releases.
van Art, B. (2012), “Global Economic Outlook 2013: Is the Global Economic Speed Limit Slowing Down?,” Straight Talk, The Conference Board, November.
van Ark, B., J. Hao, C. Corrado and C. Hulten (2009), “Measuring Intangible Capital and its Contribution to Economic Growth in Europe,” EIB Papers, European Investment Bank, Vol. 14 (1), pp. 62-93.

DSTI/DOC(2013)2
38
Wolfe, R. M. (2012), “Business R&D Performed in the United States Cost USD 291 Billion in 2008 and USD 282 Billion in 2009,” InfoBrief, National Science Foundation, Social, Behavioral and Economic Sciences, NSF 12-309, March.
World Bank (2006), Doing Business 2007: How to Reform, The World Bank, Washington, D.C.
Xing, Y. and N. Detert (2010), “How the iPhone Widens the United States Trade Deficit with the People’s Republic of China,” ADBI Working Paper Series No. 257, Asian Development Bank Institute, December.


