Embed Size (px)
Citation preview

BARCLAYS CAPITAL
CEO ENERGY/POWER CONFERENCE JOSÉ FORMIGLI,
PRE SALT EXECUTIVE MANAGER
September 2009

The presentation may contain forecasts about future events. Such forecasts merely reflect the expectations of the Company's management. Such terms as "anticipate", "believe", "expect", "forecast", "intend", "plan", "project", "seek", "should", along with similar or analogous expressions, are used to identify such forecasts. These predictions evidently involve risks and uncertainties, whether foreseen or not by the Company. Therefore, the future results of operations may differ from current expectations, and readers must not base their expectations exclusively on the information presented herein. The Company is not obliged to update the presentation/such forecasts in light of new information or future developments.
The United States Securities and Exchange
Commission permits oil and gas companies,
in their filings with the SEC, to disclose only
proved reserves that a company has
demonstrated by actual production or
conclusive formation tests to be
economically and legally producible under
existing economic and operating conditions.
We use certain terms in this
presentation, such as oil and gas
resources, that the SEC’s guidelines
strictly prohibit us from including in
filings with the SEC.
CAUTIONARY STATEMENT
FOR US INVESTORS
DISCLAIMER

20,000
25,000
30,000
Santos Pre-SaltAnnouncedDiscoveries
(Tupi and Iara)
mi boe ~22 - 26 bn boe
Proven Reserves + Santos Pre-Salt
AnnouncedDiscoveries(Tupi and Iara)
5,000
10,000
15,000
2008 ProvenReserves
14,093
0
ANNOUNCED RECOVERABLE VOLUMES IN SANTOS PRE-SALT
Lower estimates8,000
Higher estimates+4,000
*SPE Criteria
Santos Pre-Salt announced recoverable volumes, can almost double Brazilian reserves.

Petrobras Total Production (x 1000 boe/d)
1.335
232
4424
1.500
252
3522
1.540
25116185
1.493
26516894
1.684
27416396
1.778
277142101
1.792
273126110
1.855
321124100
2.050*
463142103
2.680
634
210
131
3.920
1.177
409
223
2001 2002 2003 2004 2005 2006 2007 2008 2009 ..... 2013 2020.....
* Consider +- 2,5%
8.8% p.y.
2,4002,3012,2972,2172,0202,0371,810
1,635
5.6% p.y.
7.5% p.y.
2,758
3,655
5,729
Oil production - Brazil Gas production - Brazil Oil production - International Gas production - International
PURSUING NEW PROJECTS WHILE MAXIMIZING PRODUCTION FROM EXISTING ASSETS

Petrobras Pre-salt Oil Production (x 1000 b/d)
2013 2015 2017 2020
62 152
160
422
463
873
632
1.183
Pre-Salt Petrobras Pre-Salt Partners
219
1,3361,815
582
Pre-salt Capex Through 2020
Petrobras Total Pre-salt Capex (Production Development)
Santos Basin Pre-salt
Espírito Santo Pre-salt (includes post-salt fields)
2009-2013 2009-202028.9
18.4
10.3
111.4
98.8
12.6
PRE-SALT OIL PRODUCTION

Yea
r 0
Yea
r 2
Yea
r 4
Yea
r 6
Yea
r 8
Yea
r 10
Yea
r 12
Yea
r 14
Yea
r 16
Yea
r 18
Yea
r 20
Yea
r 22
Yea
r 24
Yea
r 26
Yea
r 28
Yea
r 30
Yea
r 32
Yea
r 34
Anticipation of revenues
Possible optimizedrecovery
Santos Pre-Salt Cluster Vs. Campos BasinACCELERATED PROJECT DEVELOPMENT
Fast Track Project Vs. Standard Project
• Uncertainties
• Capex Optimization
• Time to First Oil
Yea
r 1
0
Yea
r 1
2
Yea
r 1
4
Yea
r 1
6
Yea
r 1
8
Yea
r 2
0
Yea
r 2
2
Yea
r 2
4
Yea
r 2
6
Yea
r 2
8
Yea
r 3
0
Yea
r 3
2
Fast Track Project Standard Project

8
PN – 2009-2013BRAZILIAN SE BASINS IN COMPARISON WITH GULF OF MEXI COBRAZILIAN SE BASINS IN COMPARISON WITH GULF OF MEXICO

Santos Pre-Salt Cluster Vs. Campos BasinSANTOS PRE-SALT CLUSTER VS. CAMPOS BASIN
Blocks ConsortiumBMS-8
BMS-9BMS-10
BMS-11
BMS-21
BMS-22BMS-24
BR (66%), SH (20%) e PTG (14%)
BR (45%), BG (30%) e RPS (25%)BR (65%), BG (25%) e PAX (10%)
BR (65%), BG (25%) e PTG (10%)
BR (80%), PTG (20%)
EXX (40%), HES (40%) e BR (20%)BR (80%), PTG (20%)
Shore Distance = 400 km
Total Area = 15.000 km2

PRE-SALT ACCOMPLISHMENTS TIMELINE
2000 2001 2002 2003 2004 2005 2006 2007 2008 2009
2000-2001: BIDs 2 and 3: Acquisition of Santos Basin Pre-Salt blocks
2001-2004: Largest seismic acquisition and interpretation in the world

PRE-SALT ACCOMPLISHMENTS TIMELINE
2000 2001 2002 2003 2004 2005 2006 2007 2008 2009
2005-2006: 1st wildcat well: Parati
11 exploratory wells drilled to date by Petrobras as operator: 100% success rate in Santos Basin Pre-Salt Cluster
2009: Santos Basin Pre-Salt First Oil: Tupi EWT (May 1st)
2000-2001: BIDs 2 and 3: Acquisition of Santos Basin Pre-Salt blocks
2001-2004: Largest seismic acquisition and interpretation in the world

PRE-SALT ACCOMPLISHMENTS TIMELINE
2008 2009 2010 2011 2012 2013 2014 2015
Phase 0:Information gathering, Appraisal wells, Small scale production (EWTs)
Last Updates 2009:
• 5 Rigs currently working in the cluster: • 3 are drilling new wells –TUPI NORDESTE + TUPI SUL P1 wells for EWT/Pilot in BMS-11 + ABARÉ OESTE in BMS-9;• 2 are doing Formation Tests – IARA and GUARÁ;• 2 new rigs will be allocated to the pre salt cluster shortly.
2016

20102010 2011 2012 2013
Bem-Te-Vi(09/08/2010) firm
activities(31/12/2012) contingent activities
TupiTupi(31/12/2010)
Iara(31/12/2013)
Parati(31/05/2011)
Guará(11/11/2012)
Caramba(31/12/2012)
DEADLINE FOR DECLARING COMMERCIALITY
Carioca(11/11/2011)
…

30 LONG TERM CONTRACTED RIGS PLUS 28 TO BE LEASED UP TO 2017, MAKING A TOTAL OF 60 NEW DRILLING RIGS
* SLOT
USING CONTRACTS AND LEASES TO SECURE NEEDED DRILLING ASSETS
Water Depth 2008
.: Petrobras XVI
.: Petrobras XVII
.: Alaskan Star
.: Atlantic Star
.: Ocean Wittington
.: P. South Atlantic
.: Ocean Yorktown
.: Pride Mexico
.: Borgny Dolphin
.: Ocean Concord
.: Falcon-100
2009 2010
.: Petrobras XIV
2011
0-999m
2012 2013 - 2017
.: Petrobras X
.: Petrobras XXIII
.: P. South America
.: P. Portland
.: P. Rio de Janeiro
.: P. Brazil
.: P. Carlos Walter
.: Ocean Yatzi
.: Ocean Alliance
.: Petrobras X
.: Petrobras XXIII
.: P. South America
.: P. Portland
.: P. Rio de Janeiro
.: P. Brazil
.: P. Carlos Walter
.: Ocean Yatzi
.: Ocean Alliance
.: Olinda Star
.: Ocean Worker
1000-1999m
≥ 2000m
.: Sedco 707
.: Dw . Navigator
.: N. Roger Eason
.: O. Clipper
.: N. Paul Wolf
.: West Taurus
.: West Eminence
.: SS Victoria
.: Stena*
.: West Polaris*
.: Gold Star
.: Pantanal
.: Norbe VI
.: West Orion
.: Lone Start
.: Amazonia
.: Noble Dave Beard
.: Sevan Driller
.: Cajun Express
.: Delba III
.: Schain TBN1
.: Sevan Brasil
.: DS Carolina
.: Norbe IX
.: Schain TBN2
.: Delba IV
.: Delba V
.: Delba VI
.: Delba VII
.: Delba VIII
.: Scorpion
.: Sevan Brasil
.: Norbe VIII
.: Etesco 8
.: + 28 new units to be leased
Total per year 34 7 9 7 9 28
7 14 21 30 57Cumulative

WELLS DRILLED AND TESTED IN SANTOS BASIN PRE SALT CLUSTER BLOCKS
TESTED/TESTING
WELLBLOCK PROSPECTS
ABARÉ OESTE
IGUAÇU
GUARÁ
CARIOCA
BEM-TE-VI
PARATI
IARA
IRACEMA
TUPI
TUPI
CARAMBA
ESSO-3
ESSO-2
JUPITER
BMS-24
BMS-22
BMS21
BMS11
BMS-10
BMS-9
BMS-8
RJS-652
SPS-51
RJS-656
RJS-647
RJS-646
RJS-628
RJS-617
SPS-66 *
SPS-60
SPS-55
SPS-50
SPS-52
X
X
X
X
X
X
X
RJS-660 *RJS-662 *
TUPI P1TUPI NE
* on drilling
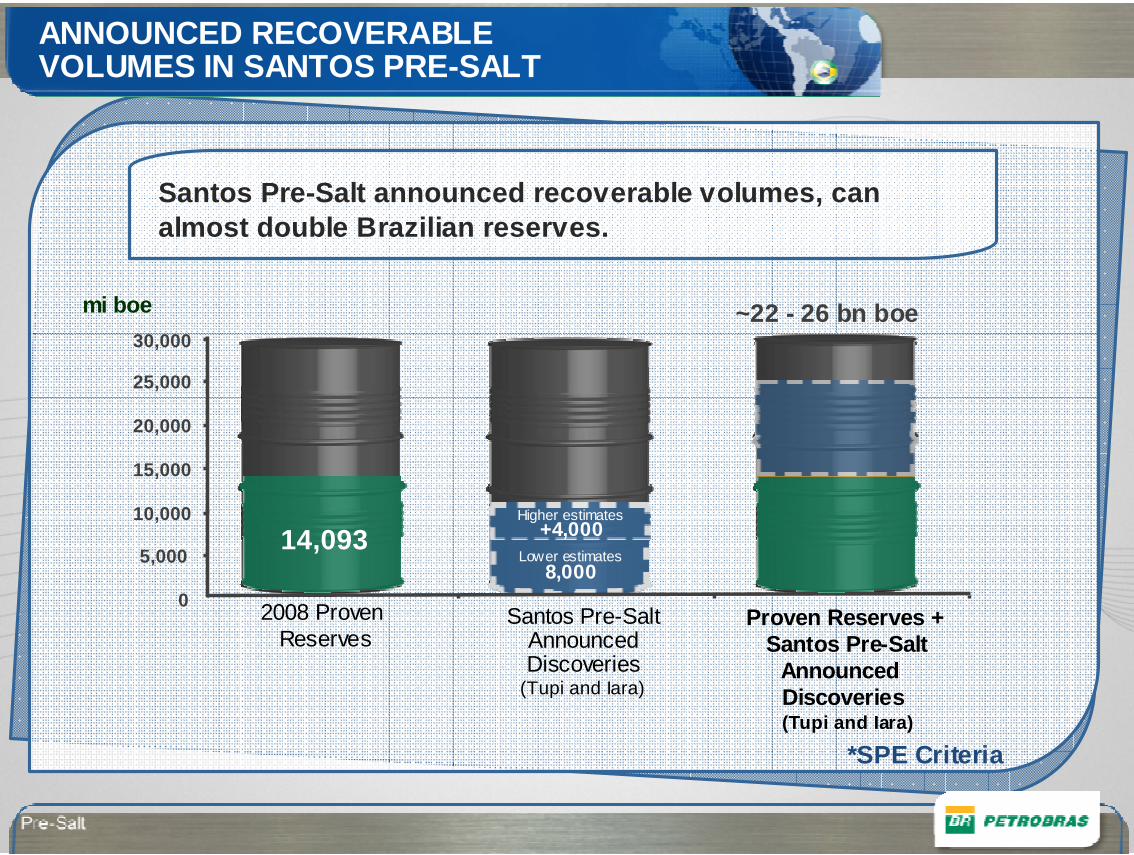
ACID RATE E OTHER CONTENTS PRESENT IN SANTOS BASIN PRE SALT HYDROCARBONS
Acids(mgKOH/g)
CO2 (%)
H2S (ppmv)
Sulfur(% m/m)
0,23 - 0,27
1 - 35
0,2 - 6,0
0,37 - 0,39
First oil from Tupi presented low sulfur content and a high yield of middle distillates (28ºAPI)
Tupi
20
0,75
Marlim(Campos)
0,42
1,5

10 NEW FPSOS
Phase 1A - Projects
Phase 1a: 1st phase of definitive development,
• Use of consolidated or rapidly-consolidating technologies to achieve production targets
• Generate cash-flow to support Phase 1b
First 2 FPSOs to be chartered (2013-2014)
• Oil Production: 120,000 bpd
• Gas Compression: 5 M m³/d
Additional 8 FPSOs (2015-2016)
• Construction of the hulls at the Rio Grande Shipyard
• All identical units, manufactured in series• Process plant under study:
− Oil Production: 150,000 bpd− Gas Compression: 5.5 M m³/d− Water-Alternating-Gas injection
capability
Phase 1B - Projects• 2nd phase of definitive development
• Significant production increase
• Innovation acceleration
• Massive use of new technologies specially tailored for Pre-Salt conditions
2012 2017 2020Phase 1A
Phase 1B…
2013

PRE-SALT – Managing Reservoir Uncertainties
Reservoir Quality Predictability - best EOR method
Flexible FPSOs’ Topsides
Subsea Layout
CO2 Processing & Handling
Production System Integrity
Flow Assurance

PHASE 1a – COMMERCIAL CHALLENGES
• Take advantage of possible synergies and scale to pursue cost reduction
• Local content – current successfullexamples:
• Supply boat construction
• Subsea equipment
• Tubulars
• Motors, Valves etc
• Repeatability and scale
• Hull “Factory”
• Batch contracts for process modules
• Standardization program for well and subsea hardware (trees, lines, …)
• FPSO “Flex”

DEVELOPMENT STRATEGY
Scenario for the Pre-SaltSeveral blocks acquired at the
same period
Operational Partnerships
Similar geological characteristics
Challenging Water depth, shore
distance, salt layer,
Operational Partnerships…
Major Technological
Challenges
After massive exploratory efforts led to huge discoveries …
High Investment Need
Impact on several areas of Petrobras
PLANSALSantos Basin Pre-Salt Development Master Plan

DISTINCTIVE DISCIPLINESPLANSAL
Exploration
Oil Transfer
TechnologyDevelopment
FPUs
Unitization
Critical Resources E&P
Critical ResourcesEngineering
OilTransportation
HSSE
TechnologyDevelopment
Gas
ProductionDevelopment Infrastructure
Gas Transfer
JV Management
TechnologyDevelopment
CO2Gas
Transportation
HumanCompetences
TechnologyDevelopment
Wells
ExplorationProduction
DevelopmentInfrastructure Oil Transfer and
TransportationGas Transfer and
Transportation
Unitization
HSSE
JV Management
Critical Resources (E&P , Engineering)
Technology Development (FPUs, CO2, Wells and Gas)
Competences
Planning, Monitoring and Management
Long term optimum development = CAPEX and OPEX optimization

CO2 separation / capture technology
Offshore logistical hub
Pre-Salt Definitive
Development
Floating LNGOffshore gas
storage in salt caves
Offshore produced fluid handling hubs
Water-alternating-gas (HC or CO 2)
injectionExtended-reach
and deviated wells (salt)
Dry completion systems (SPAR, TLP, FPDSO, …)
Reservoir Characterization
CO2 storage in saline aquifers,
depleted fields, salt caves
Deepwater CALM buoy
Flow Assurance and formation
damage control
MAJOR TECHNOLOGICAL DEVELOPMENTS UNDER EVALUATION
PLANSAL - Pre-Salt Development Master Plan

PROGRAM INVESTMENT FORECAST
ProductionDevelopment
87.7%
Investment Program (%)
ProductionInfrastructure
0.5%
Gas Transfer5.2%
Oil Transfer4.7%
Exploratory Appraisal1.9%
ProductionDevelopment
87.7%
32%Units
49%Wells
19% Subsea

CONTINUOUS OPTIMIZATION PROCESS
February 2008 December 2008
Planned CAPEX
100%
84%
February 2008 December 2008
Planned Recovered Volume
100%
127%
Improving hydrocarbon recovery... Reducing CAPEX...

PETROBRAS EXPERTISE RECOGNITION
Petroleum Economist Award: For the 4º year, Petrobras was the winner in some of the awarded categories. In 2009 the company won as the Most Enterprising Exploration
Company and also in Project Innovation (Siri extra-h eavy oil offshore project).
DJSI: Petrobras for the 4º year in a row it has earned the right to be listed on the Dow Jones Sustainability World Index (DJSI), the world’s most important sustainability index.
IR Magazine (2009), Platts Award as Hydrocarbon Producer of the Year (2008), Latin American Deal of the Year (2007), OTC Awards (Company and Individual) an d many others…

Pro
duct
ion
(bpd
)
1 3 5 7 9 11 13 15 17 19 21 23 25 27 29 31 33 35 37 39 41 43 45 47 49 51 53 55
1.800.00
1.600.00
1.200.00
1.000.00
800.00
400.00
0
Numbers of Years
Production since foundingof Petrobras (1954)
Discovery of Garoupa in the Campos basin (1954)
Discovery of giant fields in Campos basin including Albacora/Marlim
Discovery of the Pre-Salt, since Parati (2006)
2.000.000
IMPRESSIVE RECORD OF ACCELERATING DEVELOPMENT
• Pre–Salt Complete Potential View vs. Campos Basin Incremental View• Petrobras and Oil Industry expertise in deep water exploitation• Petrobras and Brazilian macroeconomics• Price Scenario vs. Estimated costs

For more information:Investor Relationswww.petrobras.com.br/ri+55 21 [email protected]