Embed Size (px)
Citation preview
© SBM Offshore 2015. All rights reserved. www.sbmoffshore.com
Barclays Energy-PowerConferenceSeptember 9, 2015
2
Disclaimer
Some of the statements contained in this presentation that are not historical facts arestatements of future expectations and other forward-looking statements based onmanagement’s current views and assumptions and involve known and unknown risksand uncertainties that could cause actual results, performance, or events to differmaterially from those in such statements. Such forward-looking statements are subjectto various risks and uncertainties, which may cause actual results and performance ofthe Company’s business to differ materially and adversely from the forward-lookingstatements.
Should one or more of these risks or uncertainties materialize, or should underlyingassumptions prove incorrect, actual results may vary materially from those described inthis presentation as anticipated, believed, or expected. SBM Offshore NV does notintend, and does not assume any obligation, to update any industry information orforward-looking statements set forth in this presentation to reflect subsequent events orcircumstances. Nothing in this presentation shall be deemed an offer to sell, or asolicitation of an offer to buy, any securities.
© SBM Offshore 2015. All rights reserved. www.sbmoffshore.com
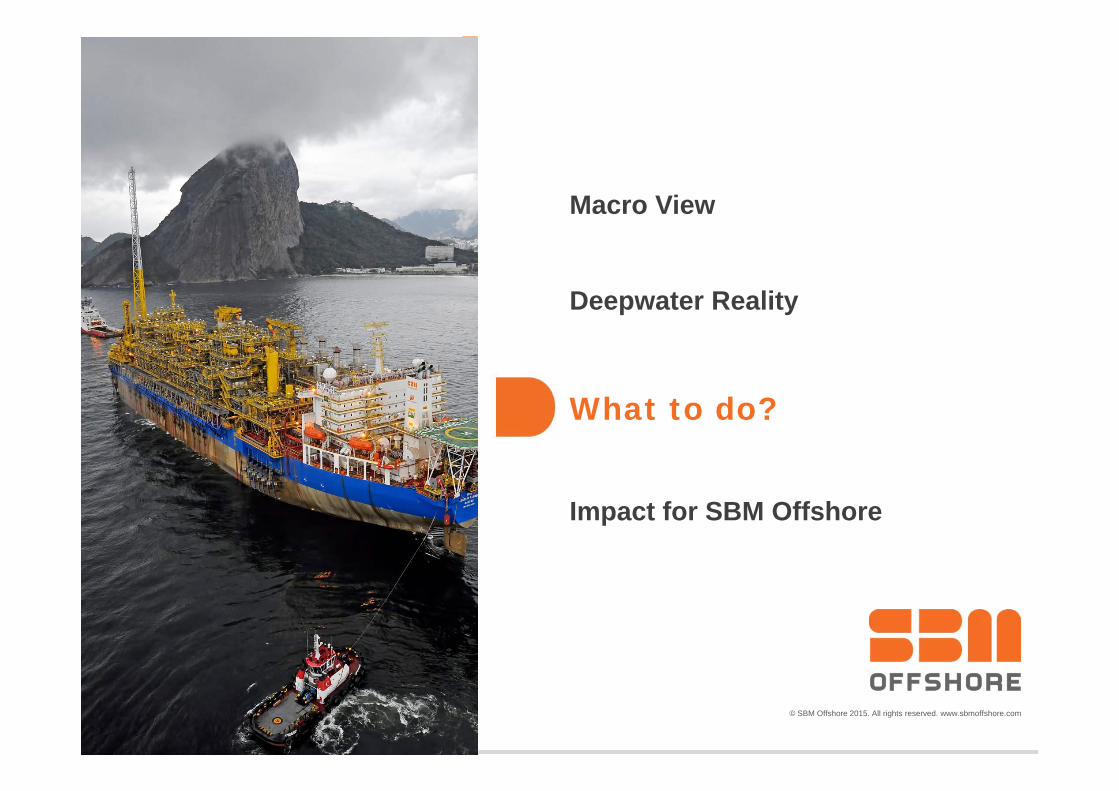
Macro View
Deepwater Reality
What to do?
Impact for SBM Offshore
4
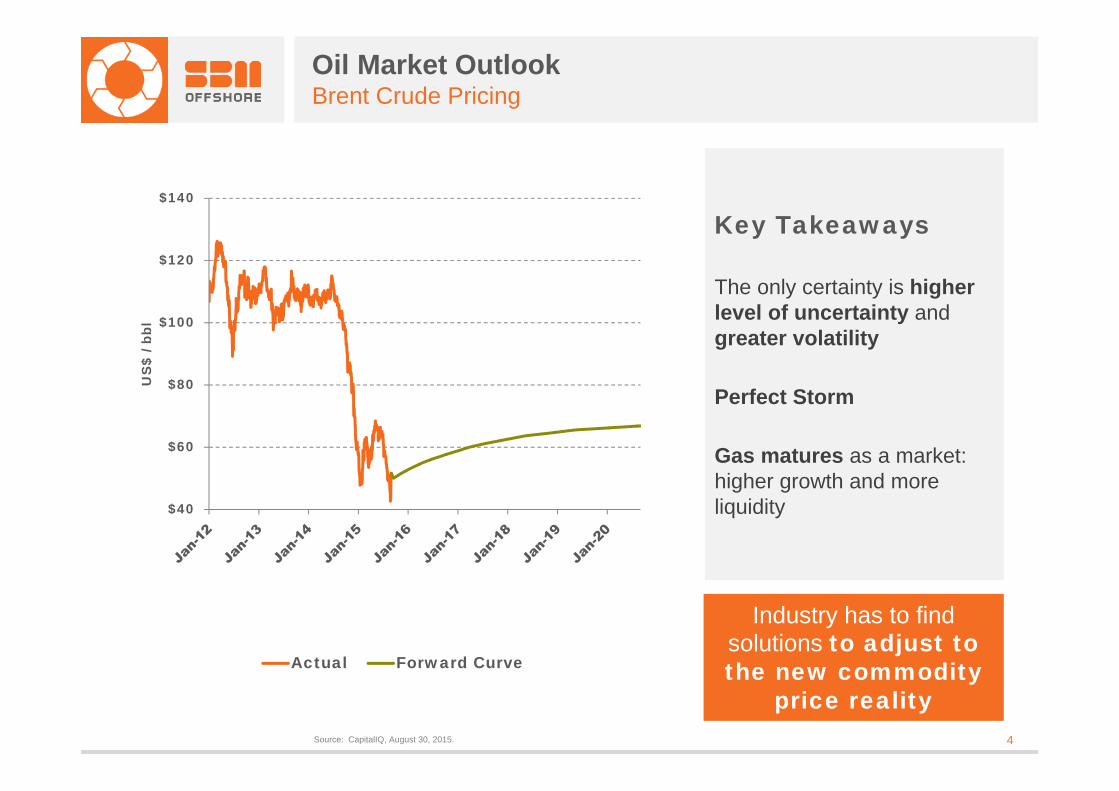
Oil Market OutlookBrent Crude Pricing
$40
$60
$80
$100
$120
$140
US
$ / b
bl
Actual Forward Curve
Source: CapitalIQ, August 30, 2015.
Key Takeaways
The only certainty is higher level of uncertainty and greater volatility
Perfect Storm
Gas matures as a market: higher growth and more liquidity
Industry has to find solutions to adjust to the new commodity
price reality
5
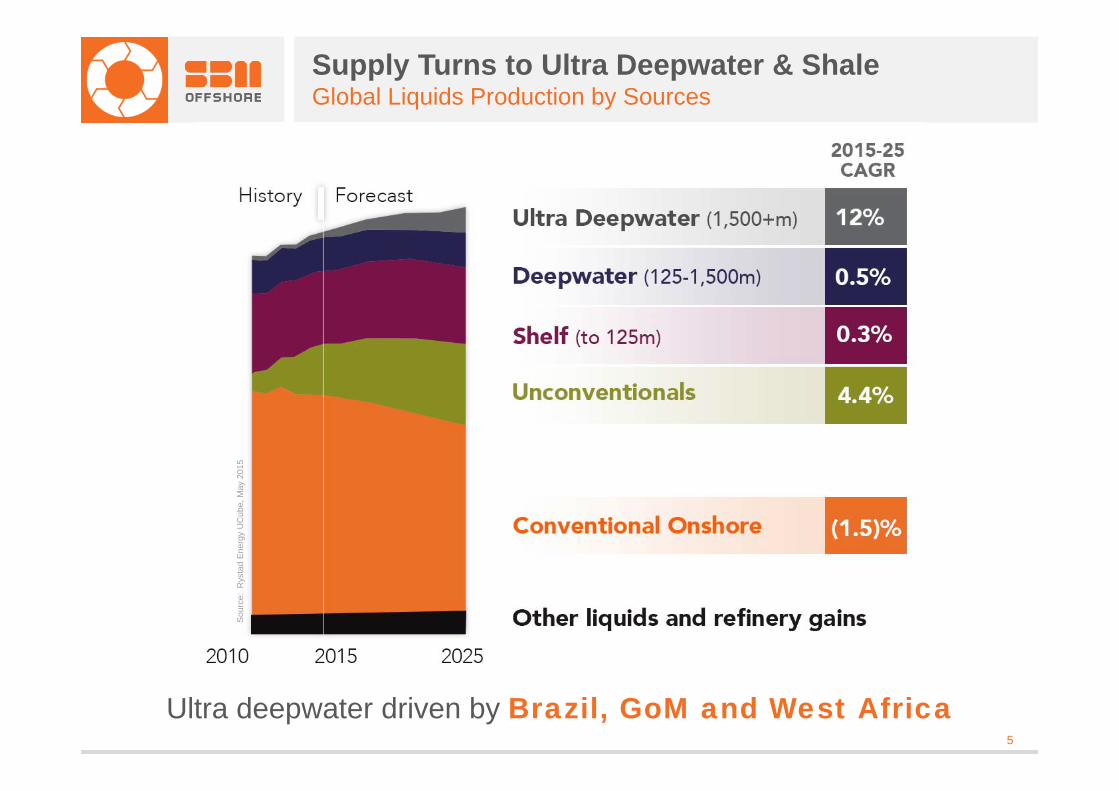
Supply Turns to Ultra Deepwater & ShaleGlobal Liquids Production by Sources
Ultra deepwater driven by Brazil, GoM and West Africa
Sou
rce:
Rys
tad
Ene
rgy
UC
ube,
May
201
5
6
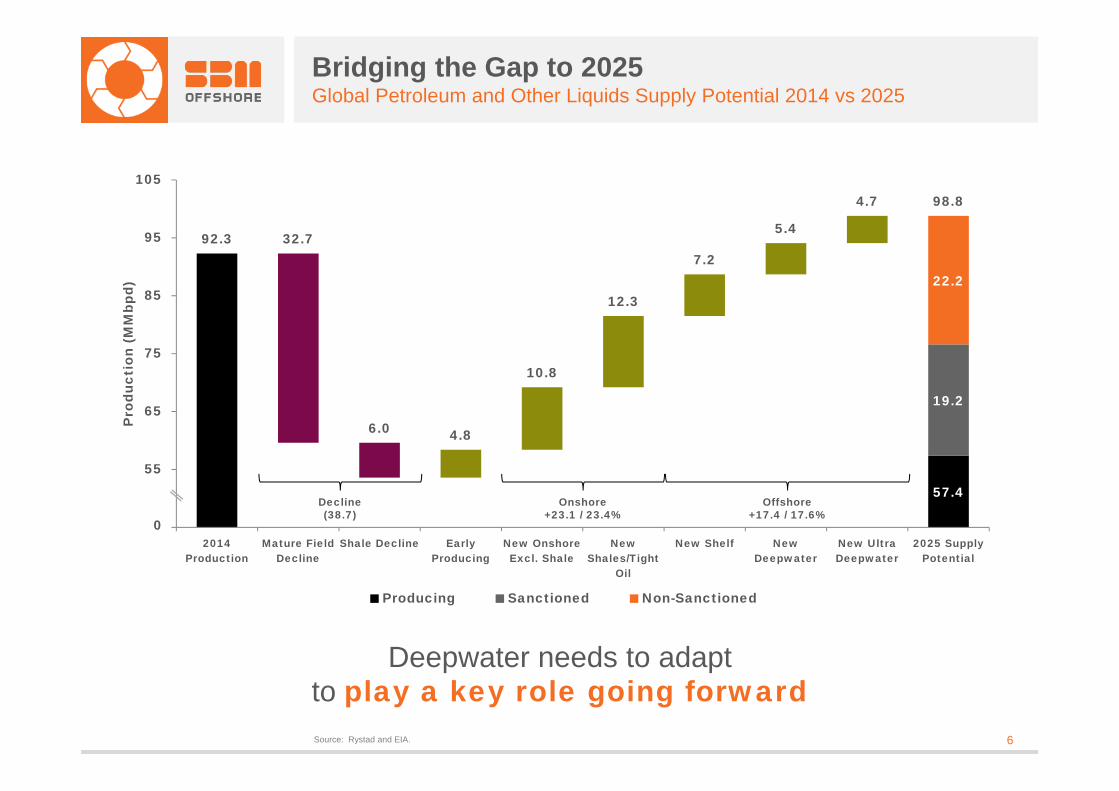
Bridging the Gap to 2025Global Petroleum and Other Liquids Supply Potential 2014 vs 2025
Source: Rystad and EIA.
57.4
19.2
22.2
92.3 32.7
6.0 4.8
10.8
12.3
7.2
5.4
4.7 98.8
45
55
65
75
85
95
105
2014Production
Mature FieldDecline
Shale Decline EarlyProducing
New OnshoreExcl. Shale
NewShales/Tight
Oil
New Shelf NewDeepwater
New UltraDeepwater
2025 SupplyPotential
Pro
duct
ion
(MM
bpd)
Producing Sanctioned Non-Sanctioned
0
Decline (38.7)
Onshore+23.1 / 23.4%
Offshore+17.4 / 17.6%
Deepwater needs to adapt to play a key role going forward
© SBM Offshore 2015. All rights reserved. www.sbmoffshore.com
Macro View
Deepwater Reality
What to do?
Impact for SBM Offshore
8
0
25
50
75
100
125
150
1 2 3 4 5 6 7 8 9 10 11 12 13
Bre
nt R
eal O
il P
rice
($/b
bl)
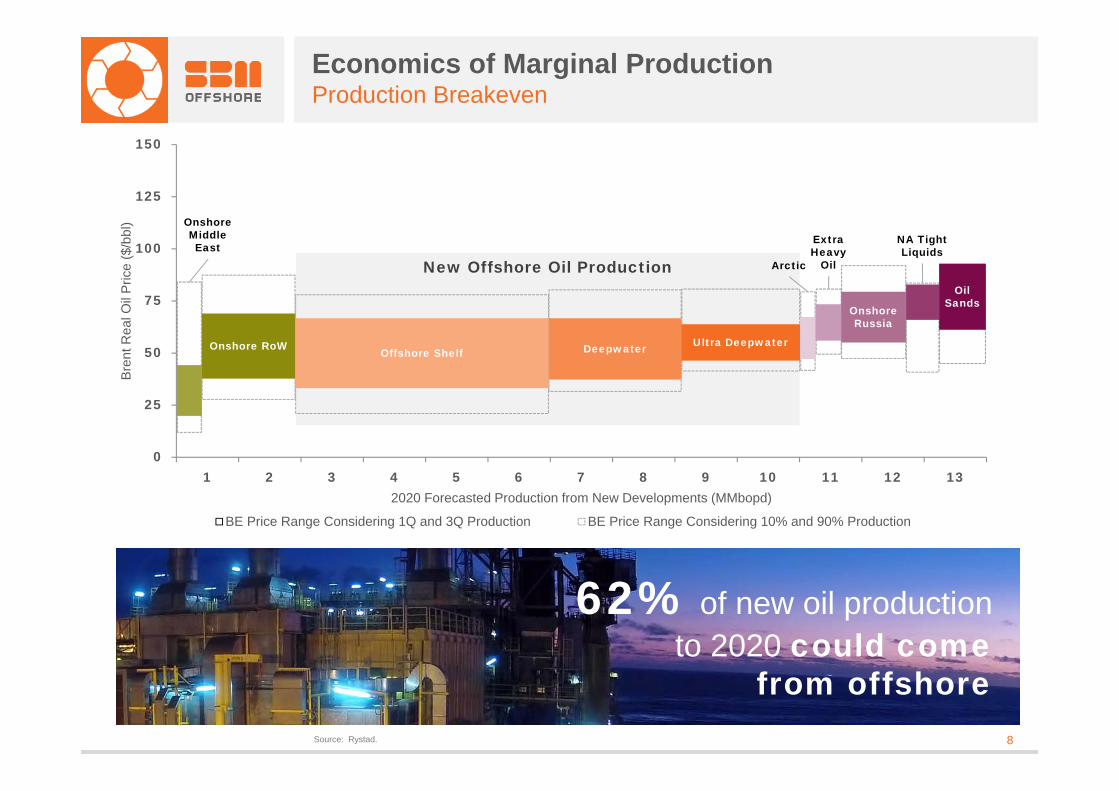
2020 Forecasted Production from New Developments (MMbopd)
BE Price Range Considering 1Q and 3Q Production BE Price Range Considering 10% and 90% Production
New Offshore Oil Production
Economics of Marginal ProductionProduction Breakeven
Source: Rystad.
Onshore RoW Offshore Shelf Deepwater Ultra Deepwater
Onshore Russia
Oil Sands
Onshore Middle East
Arctic
Extra Heavy
Oil
NA Tight Liquids
62% of new oil production to 2020 could come
from offshore
9
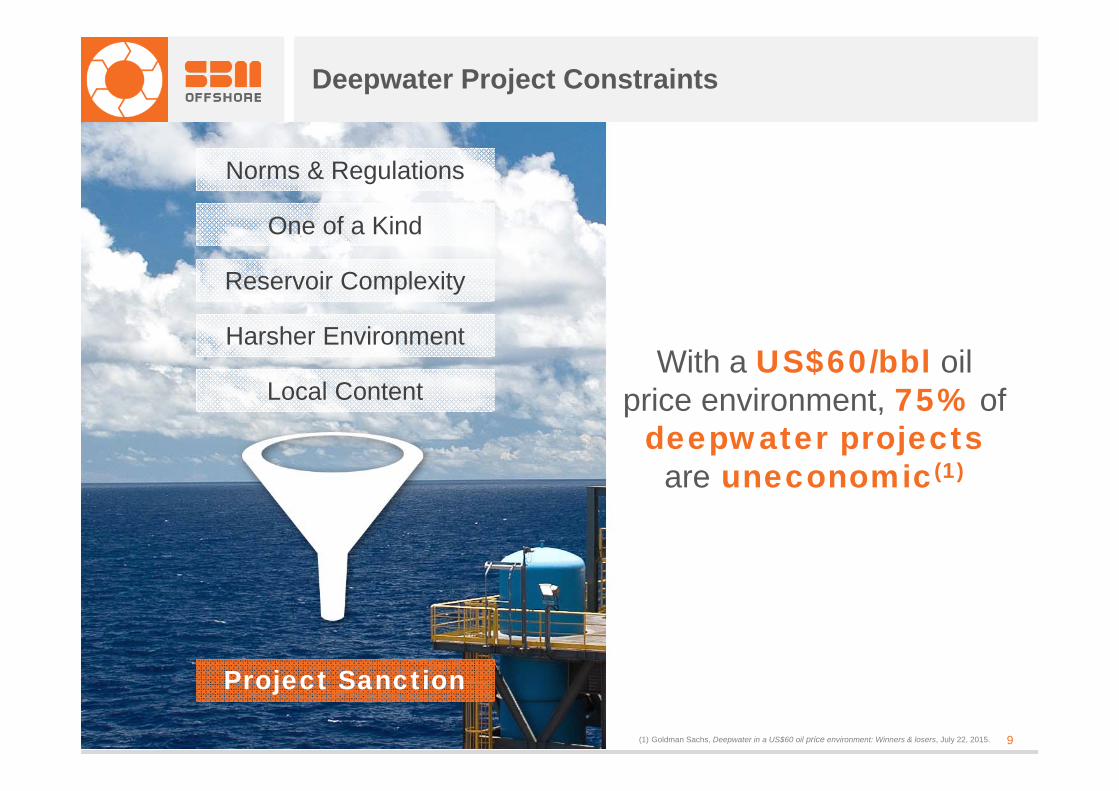
With a US$60/bbl oil price environment, 75% of
deepwater projects are uneconomic(1)
Deepwater Project Constraints
(1) Goldman Sachs, Deepwater in a US$60 oil price environment: Winners & losers, July 22, 2015.
Norms & Regulations
One of a Kind
Reservoir Complexity
Harsher Environment
Local Content
Project Sanction
9
10
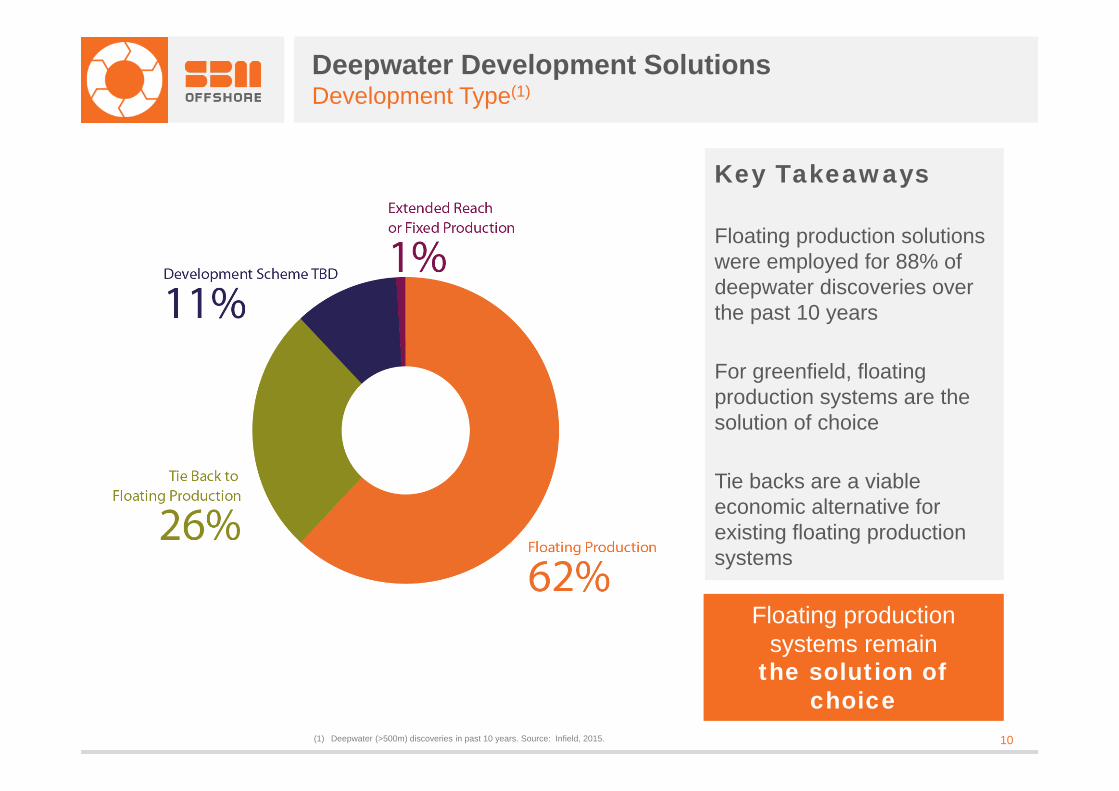
Deepwater Development SolutionsDevelopment Type(1)
Key Takeaways
Floating production solutions were employed for 88% of deepwater discoveries over the past 10 years
For greenfield, floating production systems are the solution of choice
Tie backs are a viable economic alternative for existing floating production systems
(1) Deepwater (>500m) discoveries in past 10 years. Source: Infield, 2015.
Floating production systems remain
the solution of choice
© SBM Offshore 2015. All rights reserved. www.sbmoffshore.com
Macro View
Deepwater Reality
What to do?
Impact for SBM Offshore
12
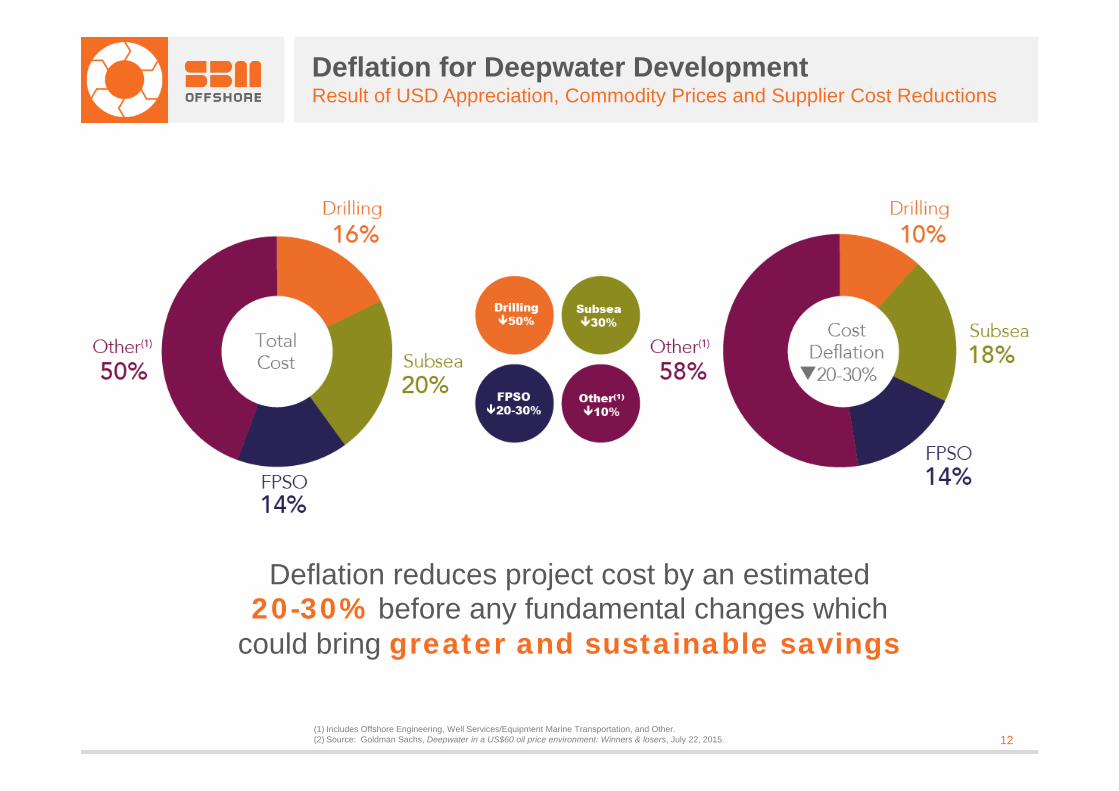
Deflation for Deepwater DevelopmentResult of USD Appreciation, Commodity Prices and Supplier Cost Reductions
Deflation reduces project cost by an estimated 20-30% before any fundamental changes which
could bring greater and sustainable savings
(1) Includes Offshore Engineering, Well Services/Equipment Marine Transportation, and Other.(2) Source: Goldman Sachs, Deepwater in a US$60 oil price environment: Winners & losers, July 22, 2015.
13
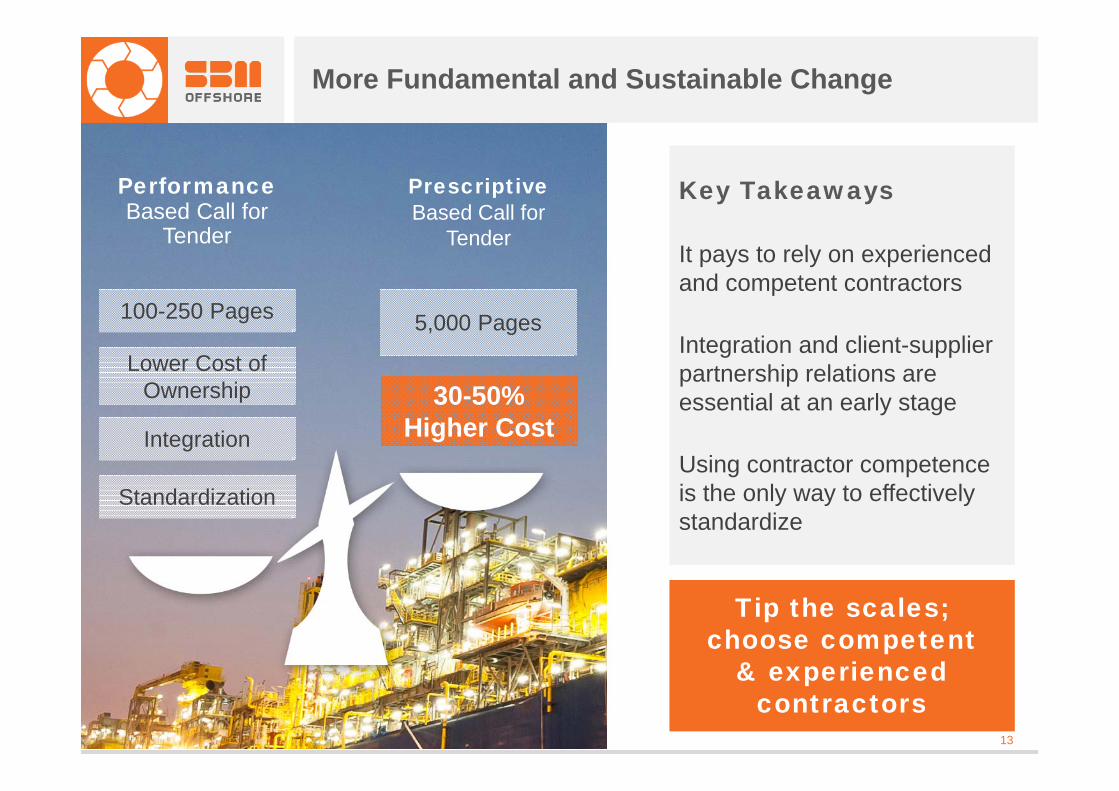
More Fundamental and Sustainable Change
Standardization
Tip the scales; choose competent
& experienced contractors
Integration
Lower Cost of Ownership
100-250 Pages
Performance Based Call for
Tender
Prescriptive Based Call for
Tender
30-50% Higher Cost
Key Takeaways
It pays to rely on experienced and competent contractors
Integration and client-supplier partnership relations are essential at an early stage
Using contractor competence is the only way to effectively standardize
5,000 Pages
© SBM Offshore 2015. All rights reserved. www.sbmoffshore.com
Macro View
Deepwater Reality
What to do?
Impact for SBM Offshore
15
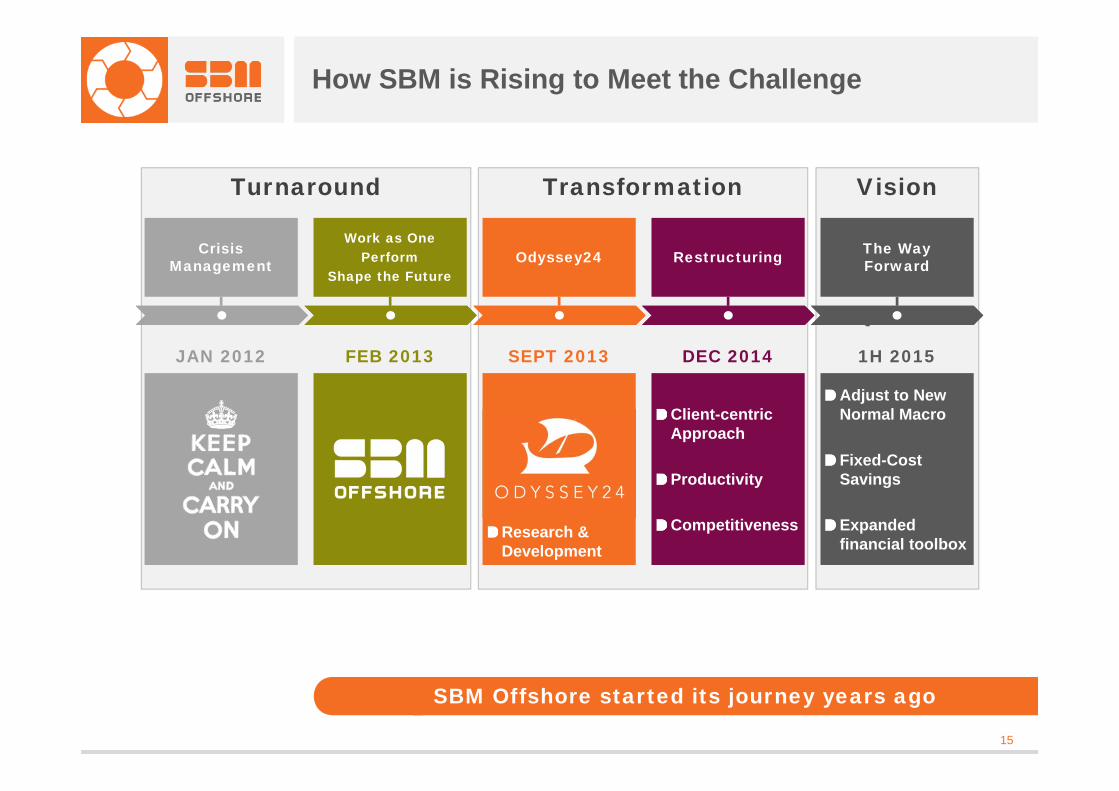
How SBM is Rising to Meet the Challenge
VisionTransformationTurnaround
Client-centricApproach
Productivity
Competitiveness
Q1 2016
Restructuring
DEC 2014JAN 2012
Work as OnePerform
Shape the Future
FEB 2013
Crisis Management
The Way ForwardOdyssey24
SEPT 2013
SBM Offshore started its journey years ago
1H 2015DEC 2014JAN 2012 FEB 2013 SEPT 2013
Adjust to New Normal Macro
Fixed-CostSavings
Expandedfinancial toolbox
Research & Development
16
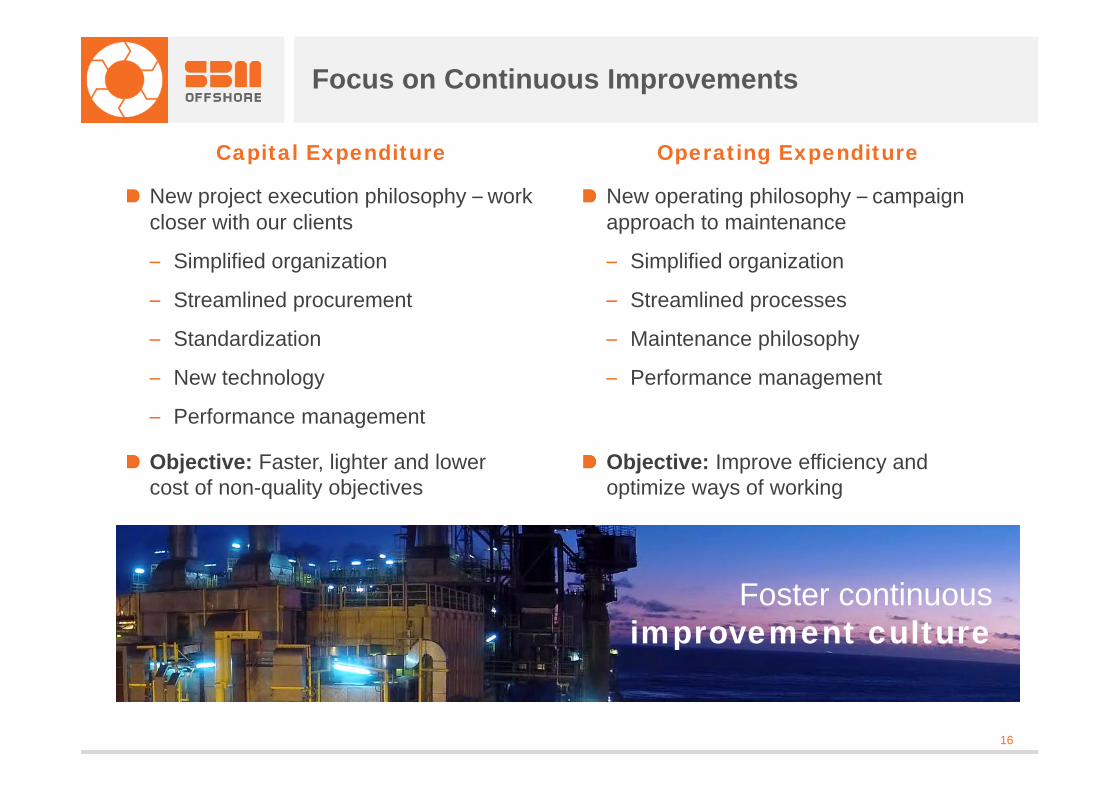
New project execution philosophy – work closer with our clients
– Simplified organization
– Streamlined procurement
– Standardization
– New technology
– Performance management
Objective: Faster, lighter and lower cost of non-quality objectives
Focus on Continuous Improvements
Operating ExpenditureCapital Expenditure
New operating philosophy – campaign approach to maintenance
– Simplified organization
– Streamlined processes
– Maintenance philosophy
– Performance management
Objective: Improve efficiency and optimize ways of working
Foster continuousimprovement culture
17
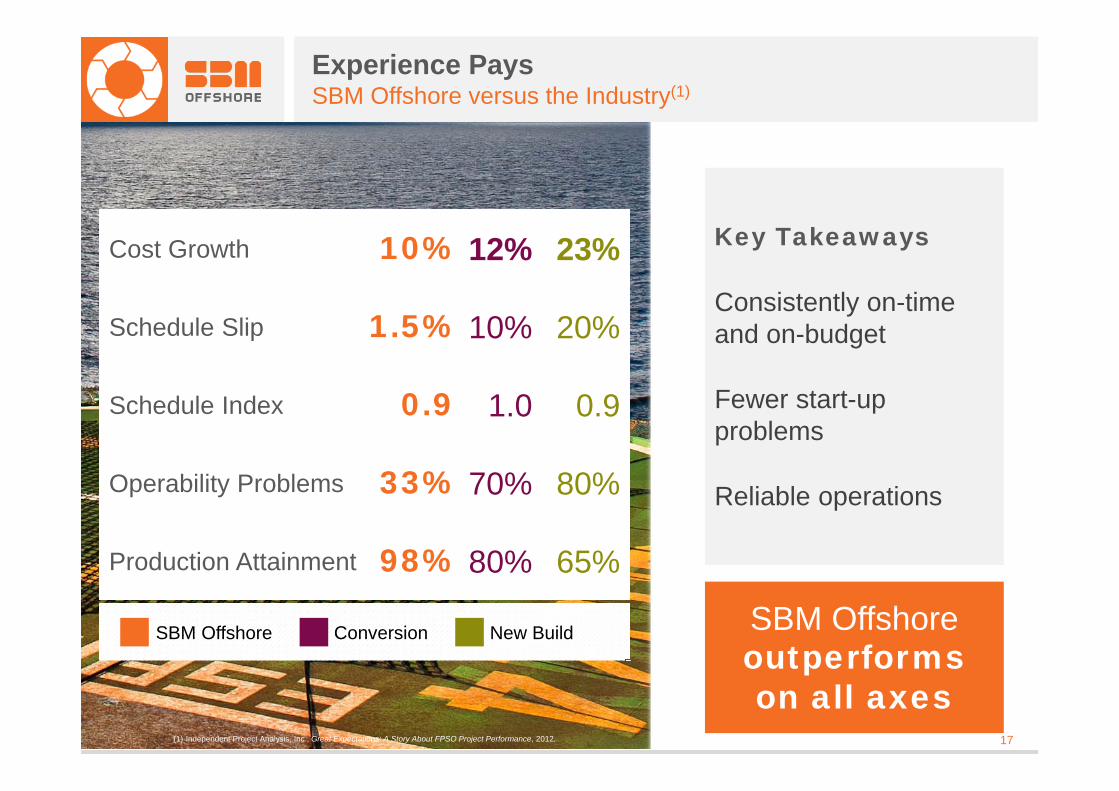
Experience PaysSBM Offshore versus the Industry(1)
Key Takeaways
Consistently on-time and on-budget
Fewer start-up problems
Reliable operations
SBM Offshore outperforms on all axes
17
SBM Offshore Conversion New BuildSBM Offshore Conversion New Build
(1) Independent Project Analysis, Inc., Great Expectations: A Story About FPSO Project Performance, 2012.
Cost Growth 10% 12% 23%
Schedule Slip 1.5% 10% 20%
Schedule Index 0.9 1.0 0.9
Operability Problems 33% 70% 80%
Production Attainment 98% 80% 65%
18
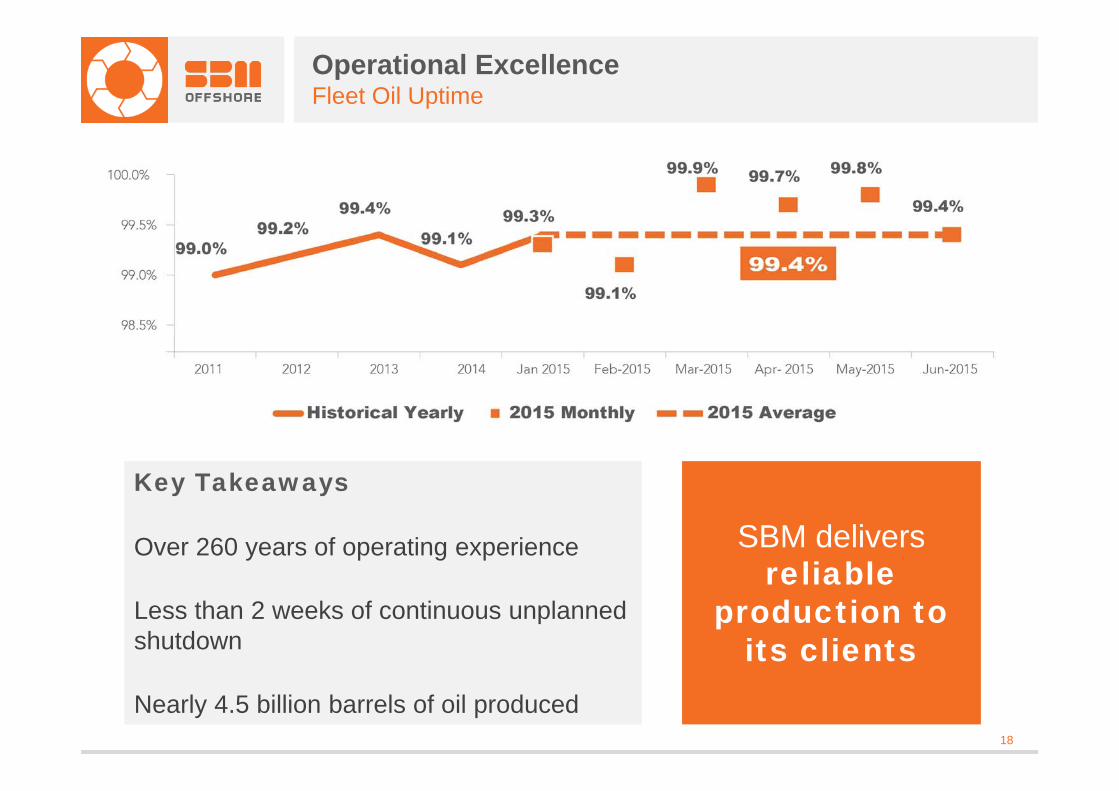
Operational ExcellenceFleet Oil Uptime
Key Takeaways
Over 260 years of operating experience
Less than 2 weeks of continuous unplanned shutdown
Nearly 4.5 billion barrels of oil produced
SBM delivers reliable
production to its clients
19
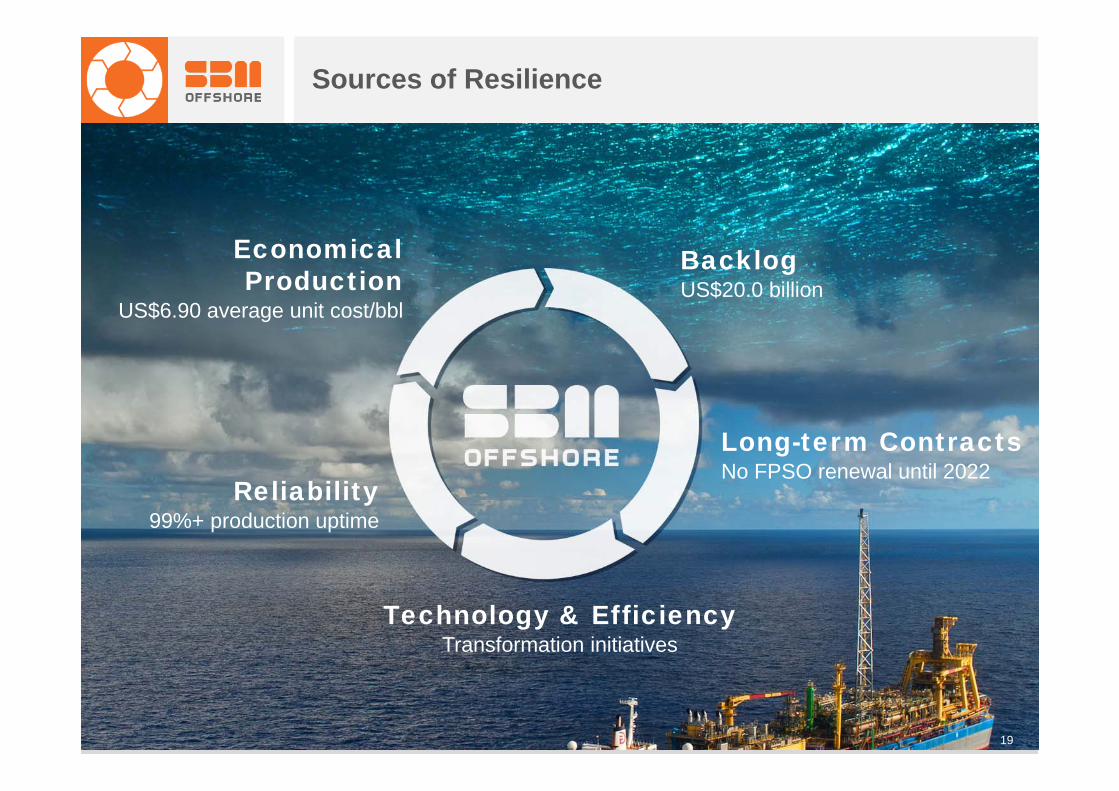
Sources of Resilience
Long-term ContractsNo FPSO renewal until 2022
Technology & EfficiencyTransformation initiatives
BacklogUS$20.0 billion
Reliability99%+ production uptime
Economical Production
US$6.90 average unit cost/bbl
19
© SBM Offshore 2015. All rights reserved. www.sbmoffshore.com
Q&A