Embed Size (px)
Citation preview
2015-16 School Accountability Report Card for Barbara Benson Elementary School Page 1 of 13
Barbara Benson Elementary School
School Accountability Report Card
Reported Using Data from the 2015-16 School Year
Published During 2016-17
By February 1 of each year, every school in California is required by state law to publish a School Accountability Report Card (SARC). The SARC contains information about the condition and performance of each California public school. Under the Local Control Funding Formula (LCFF) all local educational agencies (LEAs) are required to prepare a Local Control and Accountability Plan (LCAP), which describes how they intend to meet annual school-specific goals for all pupils, with specific activities to address state and local priorities. Additionally, data reported in an LCAP is to be consistent with data reported in the SARC. • For more information about SARC requirements, see the California Department of Education (CDE) SARC Web page at
http://www.cde.ca.gov/ta/ac/sa/. • For more information about the LCFF or LCAP, see the CDE LCFF Web page at http://www.cde.ca.gov/fg/aa/lc/. • For additional information about the school, parents/guardians and community members should contact the school principal or
the district office. DataQuest DataQuest is an online data tool located on the CDE DataQuest Web page at http://dq.cde.ca.gov/dataquest/ that contains additional information about this school and comparisons of the school to the district and the county. Specifically, DataQuest is a dynamic system that provides reports for accountability (e.g., test data, enrollment, high school graduates, dropouts, course enrollments, staffing, and data regarding English learners). Internet Access Internet access is available at public libraries and other locations that are publicly accessible (e.g., the California State Library). Access to the Internet at libraries and public locations is generally provided on a first-come, first-served basis. Other use restrictions may include the hours of operation, the length of time that a workstation may be used (depending on availability), the types of software programs available on a workstation, and the ability to print documents.
About This School Contact Information (School Year 2016-17)
School Contact Information
School Name------- Barbara Benson Elementary School
Street------- 12712 Elizabeth Way
City, State, Zip------- Tustin, CA 92780
Phone Number------- (714) 730-7531
Principal------- Jackie Christy
E-mail Address------- [email protected]
Web Site------- http://www.tustin.k12.ca.us/benson
CDS Code 30-73643-6030688
2015-16 School Accountability Report Card for Barbara Benson Elementary School Page 2 of 13
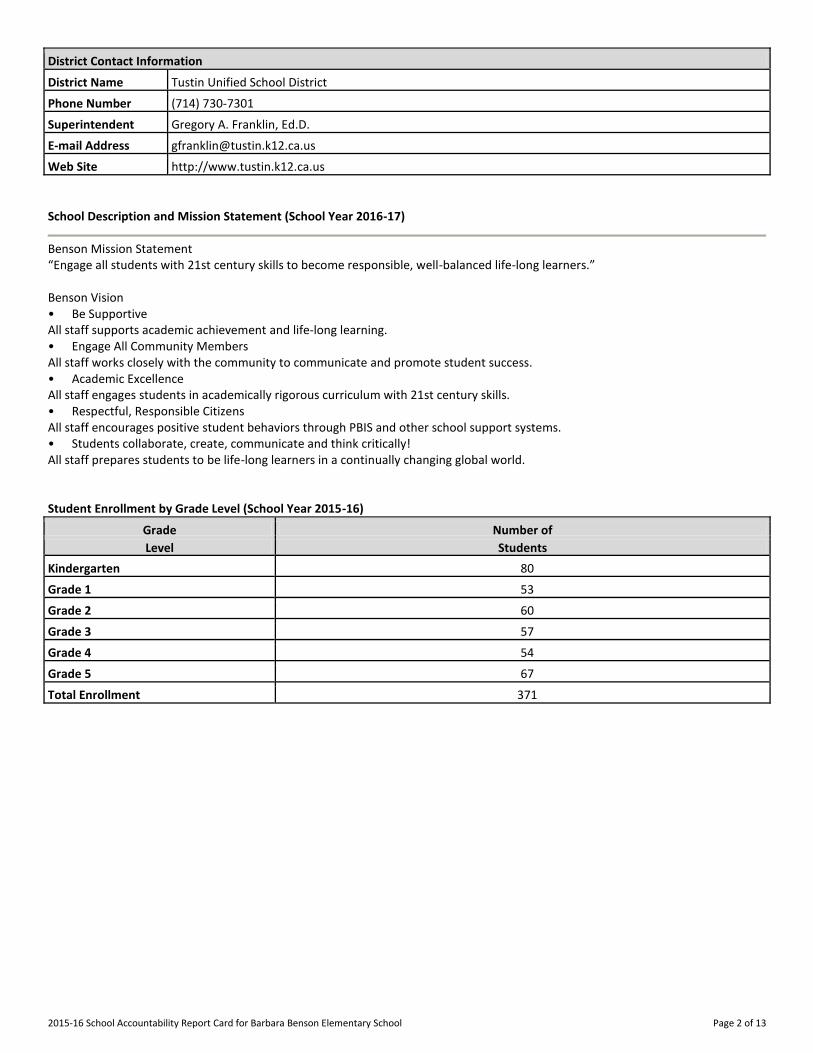
District Contact Information
District Name------- Tustin Unified School District
Phone Number------- (714) 730-7301
Superintendent------- Gregory A. Franklin, Ed.D.
E-mail Address------- [email protected]
Web Site------- http://www.tustin.k12.ca.us
School Description and Mission Statement (School Year 2016-17)
Benson Mission Statement “Engage all students with 21st century skills to become responsible, well-balanced life-long learners.” Benson Vision • Be Supportive All staff supports academic achievement and life-long learning. • Engage All Community Members All staff works closely with the community to communicate and promote student success. • Academic Excellence All staff engages students in academically rigorous curriculum with 21st century skills. • Respectful, Responsible Citizens All staff encourages positive student behaviors through PBIS and other school support systems. • Students collaborate, create, communicate and think critically! All staff prepares students to be life-long learners in a continually changing global world. Student Enrollment by Grade Level (School Year 2015-16)
Grade Number of
Level Students
Kindergarten 80
Grade 1 53
Grade 2 60
Grade 3 57
Grade 4 54
Grade 5 67
Total Enrollment 371
2015-16 School Accountability Report Card for Barbara Benson Elementary School Page 3 of 13
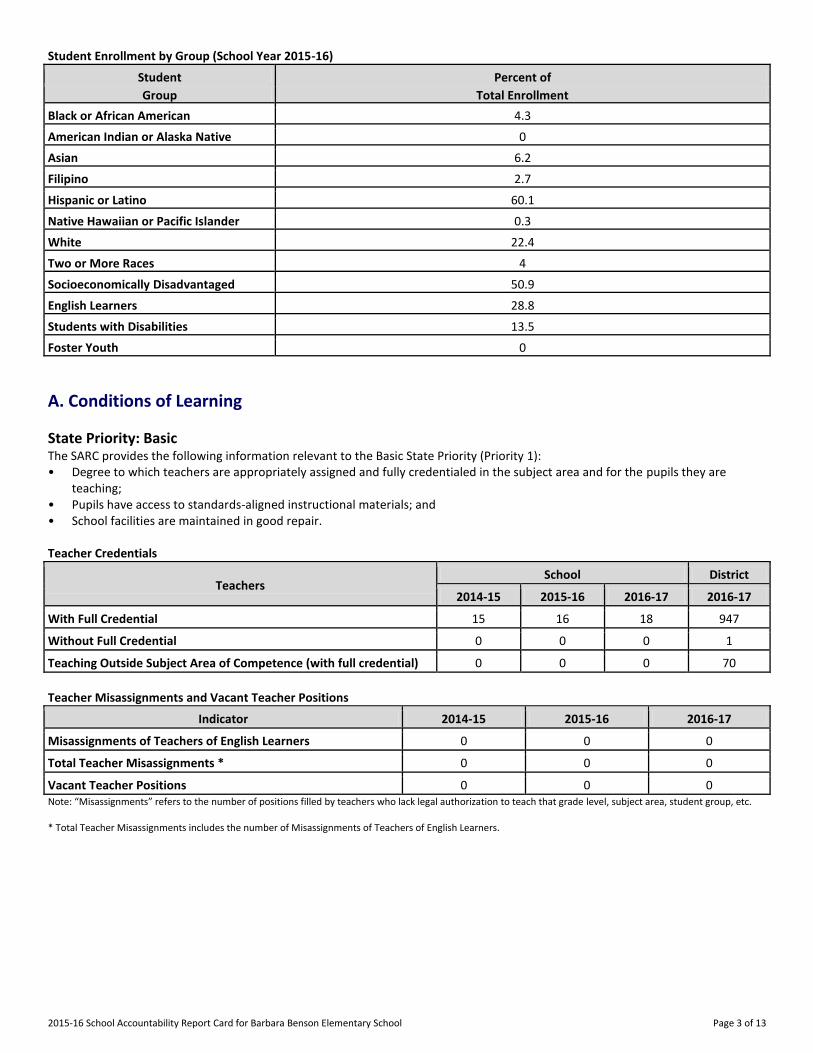
Student Enrollment by Group (School Year 2015-16)
Student Percent of
Group Total Enrollment
Black or African American 4.3
American Indian or Alaska Native 0
Asian 6.2
Filipino 2.7
Hispanic or Latino 60.1
Native Hawaiian or Pacific Islander 0.3
White 22.4
Two or More Races 4
Socioeconomically Disadvantaged 50.9
English Learners 28.8
Students with Disabilities 13.5
Foster Youth 0
A. Conditions of Learning
State Priority: Basic The SARC provides the following information relevant to the Basic State Priority (Priority 1): • Degree to which teachers are appropriately assigned and fully credentialed in the subject area and for the pupils they are
teaching; • Pupils have access to standards-aligned instructional materials; and • School facilities are maintained in good repair. Teacher Credentials
Teachers School District
2014-15 2015-16 2016-17 2016-17
With Full Credential 15 16 18 947
Without Full Credential 0 0 0 1
Teaching Outside Subject Area of Competence (with full credential) 0 0 0 70
Teacher Misassignments and Vacant Teacher Positions
Indicator 2014-15 2015-16 2016-17
Misassignments of Teachers of English Learners 0 0 0
Total Teacher Misassignments * 0 0 0
Vacant Teacher Positions 0 0 0 Note: “Misassignments” refers to the number of positions filled by teachers who lack legal authorization to teach that grade level, subject area, student group, etc. * Total Teacher Misassignments includes the number of Misassignments of Teachers of English Learners.
2015-16 School Accountability Report Card for Barbara Benson Elementary School Page 4 of 13
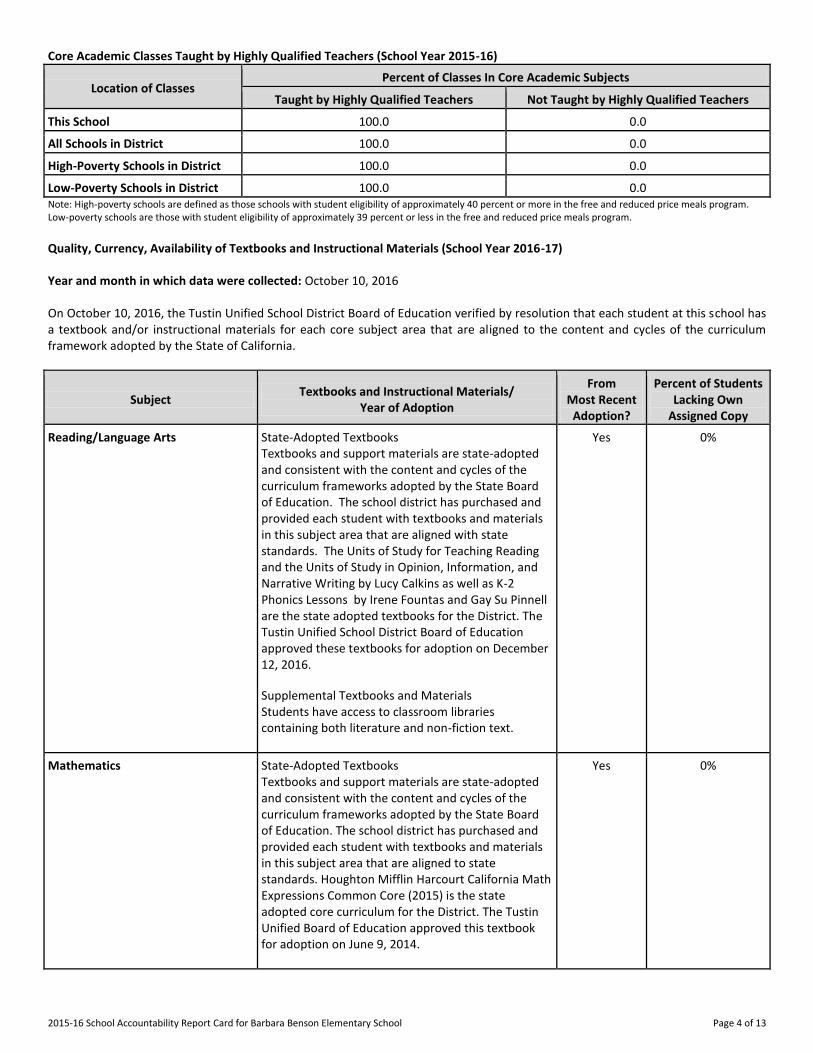
Core Academic Classes Taught by Highly Qualified Teachers (School Year 2015-16)
Location of Classes Percent of Classes In Core Academic Subjects
Taught by Highly Qualified Teachers Not Taught by Highly Qualified Teachers
This School 100.0 0.0
All Schools in District 100.0 0.0
High-Poverty Schools in District 100.0 0.0
Low-Poverty Schools in District 100.0 0.0 Note: High-poverty schools are defined as those schools with student eligibility of approximately 40 percent or more in the free and reduced price meals program. Low-poverty schools are those with student eligibility of approximately 39 percent or less in the free and reduced price meals program. Quality, Currency, Availability of Textbooks and Instructional Materials (School Year 2016-17) Year and month in which data were collected: October 10, 2016 On October 10, 2016, the Tustin Unified School District Board of Education verified by resolution that each student at this school has a textbook and/or instructional materials for each core subject area that are aligned to the content and cycles of the curriculum framework adopted by the State of California.
Subject Textbooks and Instructional Materials/
Year of Adoption
From Most Recent
Adoption?
Percent of Students Lacking Own
Assigned Copy
Reading/Language Arts State-Adopted Textbooks
Textbooks and support materials are state-adopted and consistent with the content and cycles of the curriculum frameworks adopted by the State Board of Education. The school district has purchased and provided each student with textbooks and materials in this subject area that are aligned with state standards. The Units of Study for Teaching Reading and the Units of Study in Opinion, Information, and Narrative Writing by Lucy Calkins as well as K-2 Phonics Lessons by Irene Fountas and Gay Su Pinnell are the state adopted textbooks for the District. The Tustin Unified School District Board of Education approved these textbooks for adoption on December 12, 2016.
Supplemental Textbooks and Materials
Students have access to classroom libraries containing both literature and non-fiction text.
Yes 0%
Mathematics State-Adopted Textbooks
Textbooks and support materials are state-adopted and consistent with the content and cycles of the curriculum frameworks adopted by the State Board of Education. The school district has purchased and provided each student with textbooks and materials in this subject area that are aligned to state standards. Houghton Mifflin Harcourt California Math Expressions Common Core (2015) is the state adopted core curriculum for the District. The Tustin Unified Board of Education approved this textbook for adoption on June 9, 2014.
Yes 0%
2015-16 School Accountability Report Card for Barbara Benson Elementary School Page 5 of 13
Subject Textbooks and Instructional Materials/
Year of Adoption
From Most Recent
Adoption?
Percent of Students Lacking Own
Assigned Copy
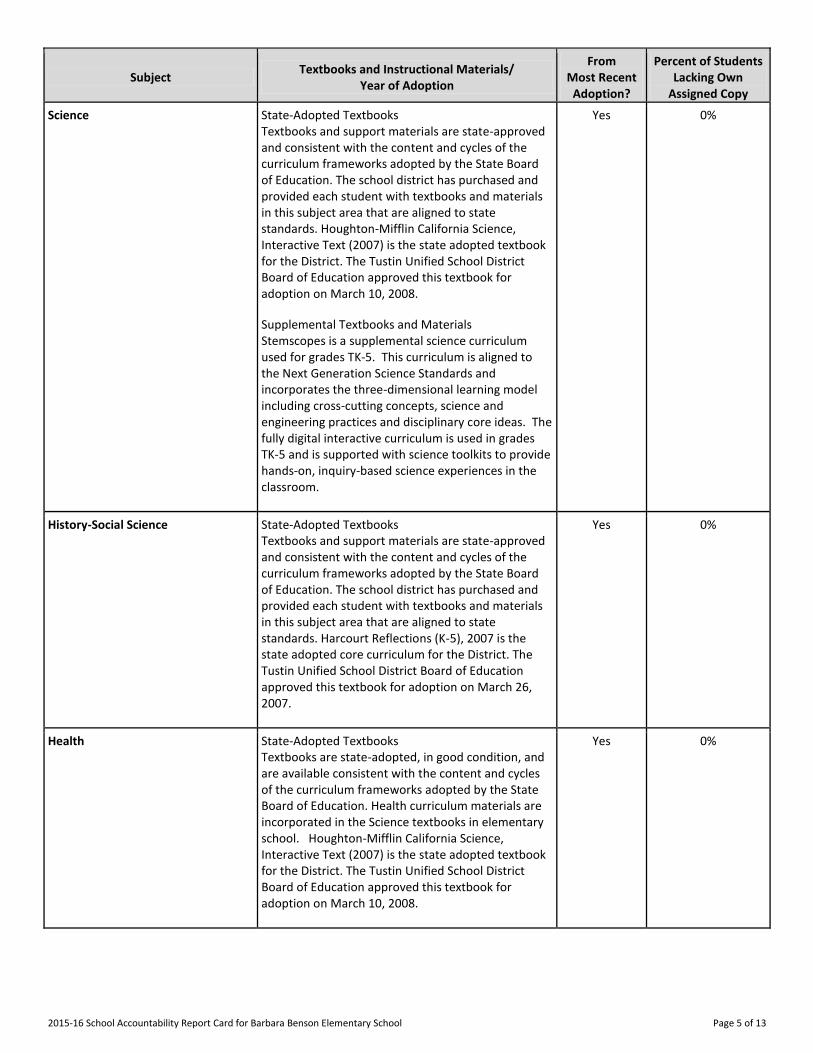
Science State-Adopted Textbooks
Textbooks and support materials are state-approved and consistent with the content and cycles of the curriculum frameworks adopted by the State Board of Education. The school district has purchased and provided each student with textbooks and materials in this subject area that are aligned to state standards. Houghton-Mifflin California Science, Interactive Text (2007) is the state adopted textbook for the District. The Tustin Unified School District Board of Education approved this textbook for adoption on March 10, 2008.
Supplemental Textbooks and Materials
Stemscopes is a supplemental science curriculum used for grades TK-5. This curriculum is aligned to the Next Generation Science Standards and incorporates the three-dimensional learning model including cross-cutting concepts, science and engineering practices and disciplinary core ideas. The fully digital interactive curriculum is used in grades TK-5 and is supported with science toolkits to provide hands-on, inquiry-based science experiences in the classroom.
Yes 0%
History-Social Science State-Adopted Textbooks
Textbooks and support materials are state-approved and consistent with the content and cycles of the curriculum frameworks adopted by the State Board of Education. The school district has purchased and provided each student with textbooks and materials in this subject area that are aligned to state standards. Harcourt Reflections (K-5), 2007 is the state adopted core curriculum for the District. The Tustin Unified School District Board of Education approved this textbook for adoption on March 26, 2007.
Yes 0%
Health State-Adopted Textbooks
Textbooks are state-adopted, in good condition, and are available consistent with the content and cycles of the curriculum frameworks adopted by the State Board of Education. Health curriculum materials are incorporated in the Science textbooks in elementary school. Houghton-Mifflin California Science, Interactive Text (2007) is the state adopted textbook for the District. The Tustin Unified School District Board of Education approved this textbook for adoption on March 10, 2008.
Yes 0%
2015-16 School Accountability Report Card for Barbara Benson Elementary School Page 6 of 13
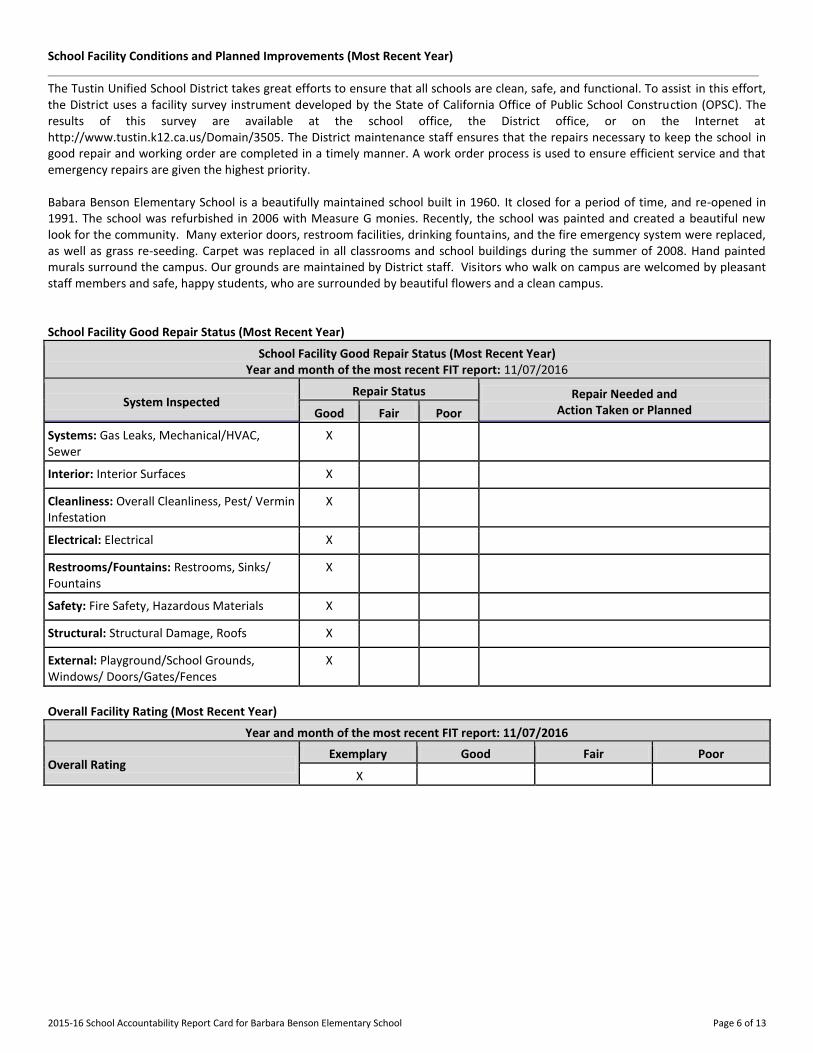
School Facility Conditions and Planned Improvements (Most Recent Year)
The Tustin Unified School District takes great efforts to ensure that all schools are clean, safe, and functional. To assist in this effort, the District uses a facility survey instrument developed by the State of California Office of Public School Construction (OPSC). The results of this survey are available at the school office, the District office, or on the Internet at http://www.tustin.k12.ca.us/Domain/3505. The District maintenance staff ensures that the repairs necessary to keep the school in good repair and working order are completed in a timely manner. A work order process is used to ensure efficient service and that emergency repairs are given the highest priority. Babara Benson Elementary School is a beautifully maintained school built in 1960. It closed for a period of time, and re-opened in 1991. The school was refurbished in 2006 with Measure G monies. Recently, the school was painted and created a beautiful new look for the community. Many exterior doors, restroom facilities, drinking fountains, and the fire emergency system were replaced, as well as grass re-seeding. Carpet was replaced in all classrooms and school buildings during the summer of 2008. Hand painted murals surround the campus. Our grounds are maintained by District staff. Visitors who walk on campus are welcomed by pleasant staff members and safe, happy students, who are surrounded by beautiful flowers and a clean campus. School Facility Good Repair Status (Most Recent Year)
School Facility Good Repair Status (Most Recent Year) Year and month of the most recent FIT report: 11/07/2016
System Inspected Repair Status Repair Needed and
Action Taken or Planned Good Fair Poor
Systems: Gas Leaks, Mechanical/HVAC, Sewer
X
Interior: Interior Surfaces X
Cleanliness: Overall Cleanliness, Pest/ Vermin Infestation
X
Electrical: Electrical X
Restrooms/Fountains: Restrooms, Sinks/ Fountains
X
Safety: Fire Safety, Hazardous Materials X
Structural: Structural Damage, Roofs X
External: Playground/School Grounds, Windows/ Doors/Gates/Fences
X
Overall Facility Rating (Most Recent Year)
Year and month of the most recent FIT report: 11/07/2016
Overall Rating Exemplary Good Fair Poor
X
2015-16 School Accountability Report Card for Barbara Benson Elementary School Page 7 of 13
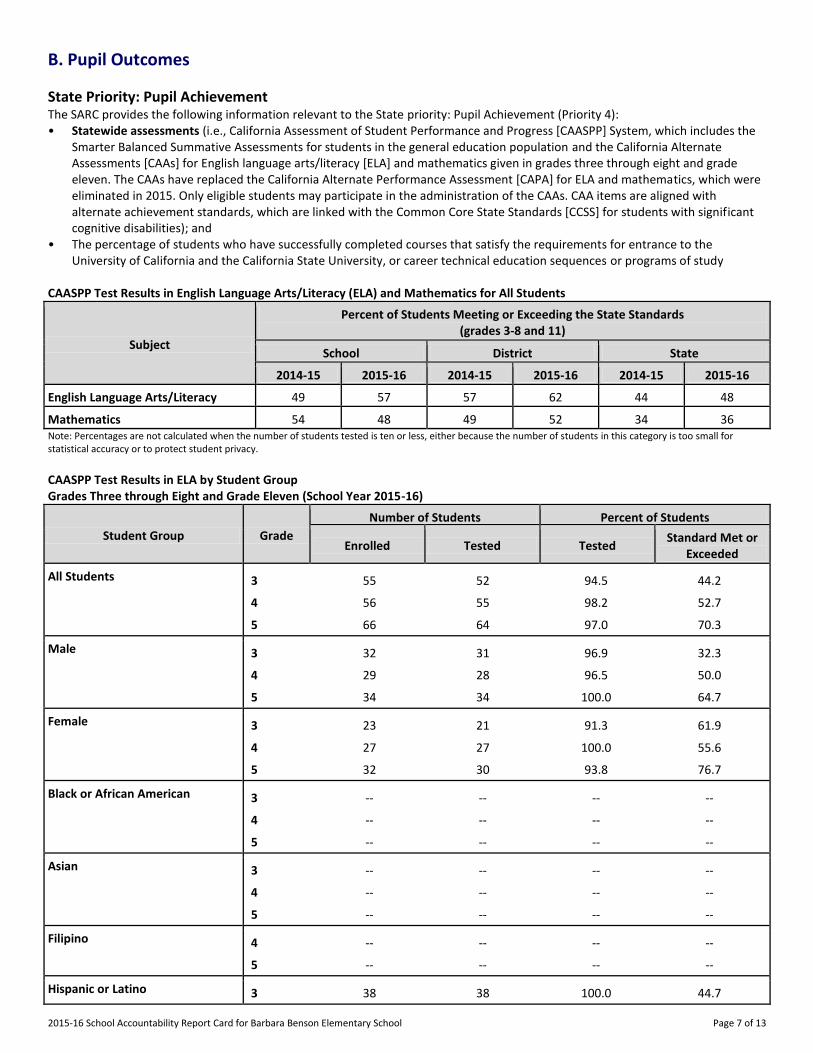
B. Pupil Outcomes
State Priority: Pupil Achievement The SARC provides the following information relevant to the State priority: Pupil Achievement (Priority 4): • Statewide assessments (i.e., California Assessment of Student Performance and Progress [CAASPP] System, which includes the
Smarter Balanced Summative Assessments for students in the general education population and the California Alternate Assessments [CAAs] for English language arts/literacy [ELA] and mathematics given in grades three through eight and grade eleven. The CAAs have replaced the California Alternate Performance Assessment [CAPA] for ELA and mathematics, which were eliminated in 2015. Only eligible students may participate in the administration of the CAAs. CAA items are aligned with alternate achievement standards, which are linked with the Common Core State Standards [CCSS] for students with significant cognitive disabilities); and
• The percentage of students who have successfully completed courses that satisfy the requirements for entrance to the University of California and the California State University, or career technical education sequences or programs of study
CAASPP Test Results in English Language Arts/Literacy (ELA) and Mathematics for All Students
Subject
Percent of Students Meeting or Exceeding the State Standards (grades 3-8 and 11)
School District State
2014-15 2015-16 2014-15 2015-16 2014-15 2015-16
English Language Arts/Literacy 49 57 57 62 44 48
Mathematics 54 48 49 52 34 36 Note: Percentages are not calculated when the number of students tested is ten or less, either because the number of students in this category is too small for statistical accuracy or to protect student privacy.
CAASPP Test Results in ELA by Student Group Grades Three through Eight and Grade Eleven (School Year 2015-16)
Student Group Grade
Number of Students Percent of Students
Enrolled Tested Tested Standard Met or
Exceeded
All Students 3 55 52 94.5 44.2
4 56 55 98.2 52.7
5 66 64 97.0 70.3
Male 3 32 31 96.9 32.3
4 29 28 96.5 50.0
5 34 34 100.0 64.7
Female 3 23 21 91.3 61.9
4 27 27 100.0 55.6
5 32 30 93.8 76.7
Black or African American 3 -- -- -- --
4 -- -- -- --
5 -- -- -- --
Asian 3 -- -- -- --
4 -- -- -- --
5 -- -- -- --
Filipino 4 -- -- -- --
5 -- -- -- --
Hispanic or Latino 3 38 38 100.0 44.7
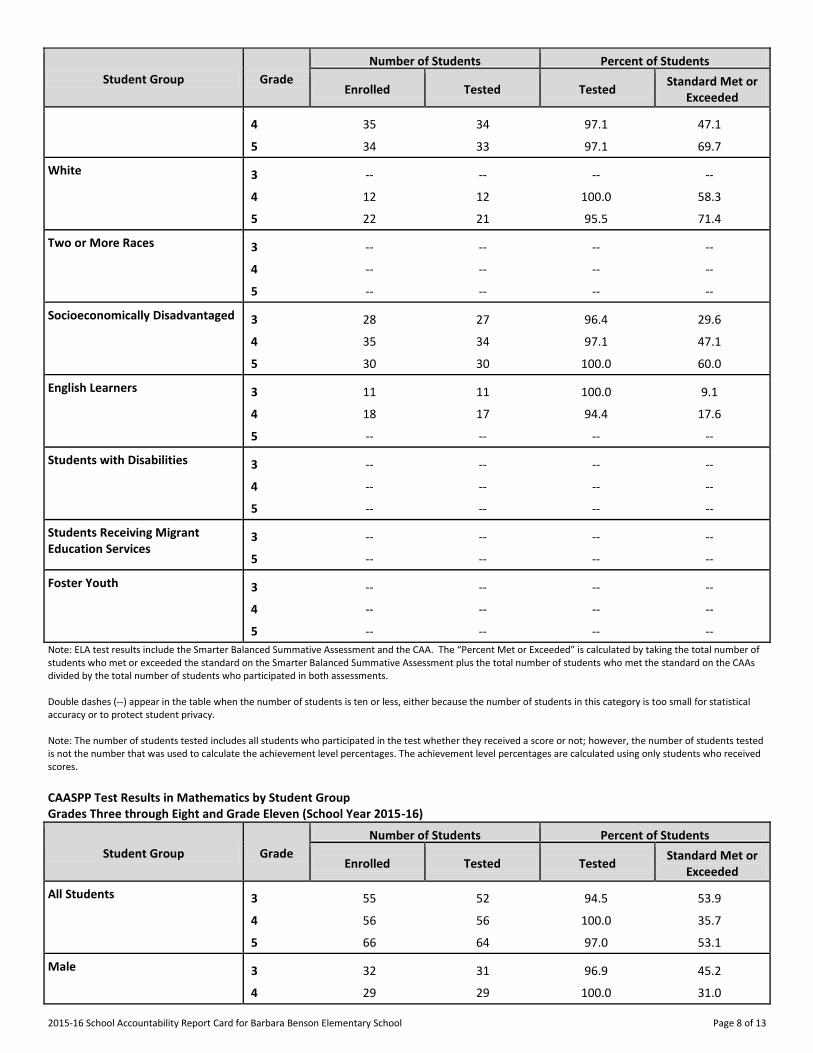
2015-16 School Accountability Report Card for Barbara Benson Elementary School Page 8 of 13
Student Group Grade
Number of Students Percent of Students
Enrolled Tested Tested Standard Met or
Exceeded
4 35 34 97.1 47.1
5 34 33 97.1 69.7
White 3 -- -- -- --
4 12 12 100.0 58.3
5 22 21 95.5 71.4
Two or More Races 3 -- -- -- --
4 -- -- -- --
5 -- -- -- --
Socioeconomically Disadvantaged 3 28 27 96.4 29.6
4 35 34 97.1 47.1
5 30 30 100.0 60.0
English Learners 3 11 11 100.0 9.1
4 18 17 94.4 17.6
5 -- -- -- --
Students with Disabilities 3 -- -- -- --
4 -- -- -- --
5 -- -- -- --
Students Receiving Migrant Education Services
3 -- -- -- --
5 -- -- -- --
Foster Youth 3 -- -- -- --
4 -- -- -- --
5 -- -- -- --
Note: ELA test results include the Smarter Balanced Summative Assessment and the CAA. The “Percent Met or Exceeded” is calculated by taking the total number of students who met or exceeded the standard on the Smarter Balanced Summative Assessment plus the total number of students who met the standard on the CAAs divided by the total number of students who participated in both assessments. Double dashes (--) appear in the table when the number of students is ten or less, either because the number of students in this category is too small for statistical accuracy or to protect student privacy. Note: The number of students tested includes all students who participated in the test whether they received a score or not; however, the number of students tested is not the number that was used to calculate the achievement level percentages. The achievement level percentages are calculated using only students who received scores.
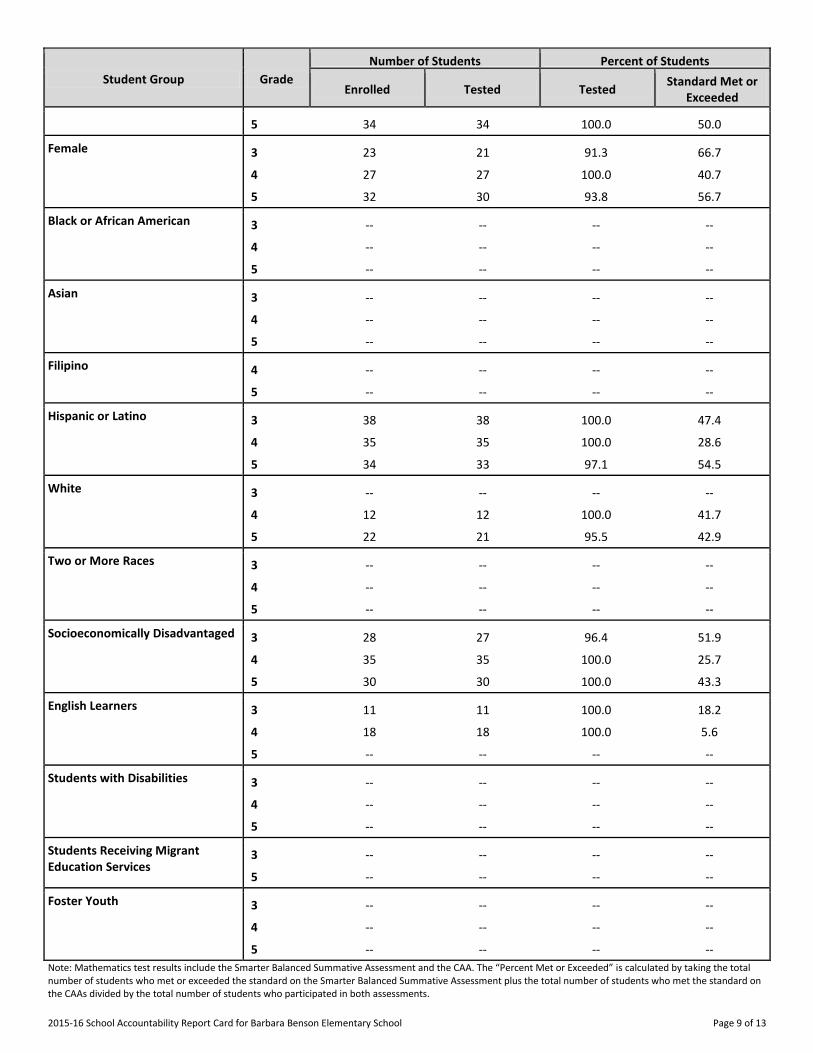
CAASPP Test Results in Mathematics by Student Group Grades Three through Eight and Grade Eleven (School Year 2015-16)
Student Group Grade
Number of Students Percent of Students
Enrolled Tested Tested Standard Met or
Exceeded
All Students 3 55 52 94.5 53.9
4 56 56 100.0 35.7
5 66 64 97.0 53.1
Male 3 32 31 96.9 45.2
4 29 29 100.0 31.0
2015-16 School Accountability Report Card for Barbara Benson Elementary School Page 9 of 13
Student Group Grade
Number of Students Percent of Students
Enrolled Tested Tested Standard Met or
Exceeded
5 34 34 100.0 50.0
Female 3 23 21 91.3 66.7
4 27 27 100.0 40.7
5 32 30 93.8 56.7
Black or African American 3 -- -- -- --
4 -- -- -- --
5 -- -- -- --
Asian 3 -- -- -- --
4 -- -- -- --
5 -- -- -- --
Filipino 4 -- -- -- --
5 -- -- -- --
Hispanic or Latino 3 38 38 100.0 47.4
4 35 35 100.0 28.6
5 34 33 97.1 54.5
White 3 -- -- -- --
4 12 12 100.0 41.7
5 22 21 95.5 42.9
Two or More Races 3 -- -- -- --
4 -- -- -- --
5 -- -- -- --
Socioeconomically Disadvantaged 3 28 27 96.4 51.9
4 35 35 100.0 25.7
5 30 30 100.0 43.3
English Learners 3 11 11 100.0 18.2
4 18 18 100.0 5.6
5 -- -- -- --
Students with Disabilities 3 -- -- -- --
4 -- -- -- --
5 -- -- -- --
Students Receiving Migrant Education Services
3 -- -- -- --
5 -- -- -- --
Foster Youth 3 -- -- -- --
4 -- -- -- --
5 -- -- -- --
Note: Mathematics test results include the Smarter Balanced Summative Assessment and the CAA. The “Percent Met or Exceeded” is calculated by taking the total number of students who met or exceeded the standard on the Smarter Balanced Summative Assessment plus the total number of students who met the standard on the CAAs divided by the total number of students who participated in both assessments.
2015-16 School Accountability Report Card for Barbara Benson Elementary School Page 10 of 13
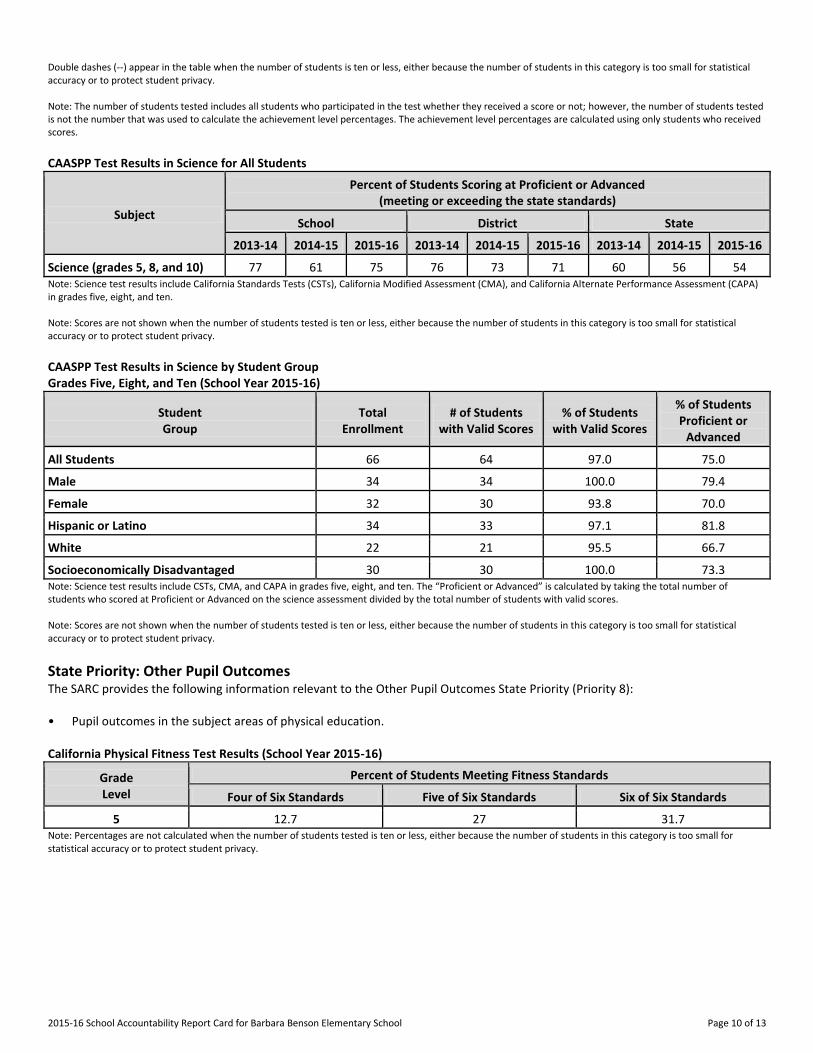
Double dashes (--) appear in the table when the number of students is ten or less, either because the number of students in this category is too small for statistical accuracy or to protect student privacy. Note: The number of students tested includes all students who participated in the test whether they received a score or not; however, the number of students tested is not the number that was used to calculate the achievement level percentages. The achievement level percentages are calculated using only students who received scores.
CAASPP Test Results in Science for All Students
Subject
Percent of Students Scoring at Proficient or Advanced (meeting or exceeding the state standards)
School District State
2013-14 2014-15 2015-16 2013-14 2014-15 2015-16 2013-14 2014-15 2015-16
Science (grades 5, 8, and 10) 77 61 75 76 73 71 60 56 54 Note: Science test results include California Standards Tests (CSTs), California Modified Assessment (CMA), and California Alternate Performance Assessment (CAPA) in grades five, eight, and ten. Note: Scores are not shown when the number of students tested is ten or less, either because the number of students in this category is too small for statistical accuracy or to protect student privacy.
CAASPP Test Results in Science by Student Group Grades Five, Eight, and Ten (School Year 2015-16)
Student Group
Total Enrollment
# of Students with Valid Scores
% of Students with Valid Scores
% of Students Proficient or
Advanced
All Students 66 64 97.0 75.0
Male 34 34 100.0 79.4
Female 32 30 93.8 70.0
Hispanic or Latino 34 33 97.1 81.8
White 22 21 95.5 66.7
Socioeconomically Disadvantaged 30 30 100.0 73.3 Note: Science test results include CSTs, CMA, and CAPA in grades five, eight, and ten. The “Proficient or Advanced” is calculated by taking the total number of students who scored at Proficient or Advanced on the science assessment divided by the total number of students with valid scores. Note: Scores are not shown when the number of students tested is ten or less, either because the number of students in this category is too small for statistical accuracy or to protect student privacy.
State Priority: Other Pupil Outcomes The SARC provides the following information relevant to the Other Pupil Outcomes State Priority (Priority 8): • Pupil outcomes in the subject areas of physical education. California Physical Fitness Test Results (School Year 2015-16)
Grade Level
Percent of Students Meeting Fitness Standards
Four of Six Standards Five of Six Standards Six of Six Standards
---5--- 12.7 27 31.7 Note: Percentages are not calculated when the number of students tested is ten or less, either because the number of students in this category is too small for statistical accuracy or to protect student privacy.
2015-16 School Accountability Report Card for Barbara Benson Elementary School Page 11 of 13
C. Engagement
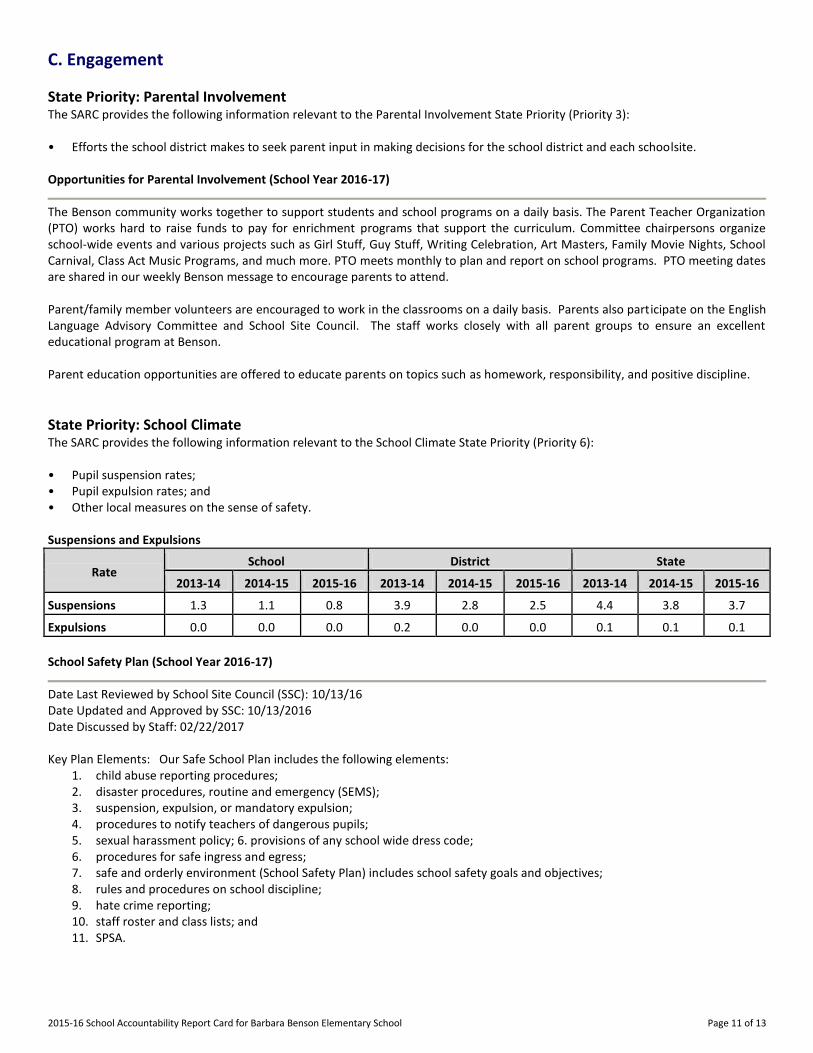
State Priority: Parental Involvement The SARC provides the following information relevant to the Parental Involvement State Priority (Priority 3): • Efforts the school district makes to seek parent input in making decisions for the school district and each schoolsite. Opportunities for Parental Involvement (School Year 2016-17)
The Benson community works together to support students and school programs on a daily basis. The Parent Teacher Organization (PTO) works hard to raise funds to pay for enrichment programs that support the curriculum. Committee chairpersons organize school-wide events and various projects such as Girl Stuff, Guy Stuff, Writing Celebration, Art Masters, Family Movie Nights, School Carnival, Class Act Music Programs, and much more. PTO meets monthly to plan and report on school programs. PTO meeting dates are shared in our weekly Benson message to encourage parents to attend. Parent/family member volunteers are encouraged to work in the classrooms on a daily basis. Parents also participate on the English Language Advisory Committee and School Site Council. The staff works closely with all parent groups to ensure an excellent educational program at Benson. Parent education opportunities are offered to educate parents on topics such as homework, responsibility, and positive discipline.
State Priority: School Climate The SARC provides the following information relevant to the School Climate State Priority (Priority 6): • Pupil suspension rates; • Pupil expulsion rates; and • Other local measures on the sense of safety. Suspensions and Expulsions
Rate School District State
2013-14 2014-15 2015-16 2013-14 2014-15 2015-16 2013-14 2014-15 2015-16
Suspensions------- 1.3 1.1 0.8 3.9 2.8 2.5 4.4 3.8 3.7
Expulsions------- 0.0 0.0 0.0 0.2 0.0 0.0 0.1 0.1 0.1
School Safety Plan (School Year 2016-17)
Date Last Reviewed by School Site Council (SSC): 10/13/16 Date Updated and Approved by SSC: 10/13/2016 Date Discussed by Staff: 02/22/2017 Key Plan Elements: Our Safe School Plan includes the following elements:
1. child abuse reporting procedures; 2. disaster procedures, routine and emergency (SEMS); 3. suspension, expulsion, or mandatory expulsion; 4. procedures to notify teachers of dangerous pupils; 5. sexual harassment policy; 6. provisions of any school wide dress code; 6. procedures for safe ingress and egress; 7. safe and orderly environment (School Safety Plan) includes school safety goals and objectives; 8. rules and procedures on school discipline; 9. hate crime reporting; 10. staff roster and class lists; and 11. SPSA.
2015-16 School Accountability Report Card for Barbara Benson Elementary School Page 12 of 13
D. Other SARC Information
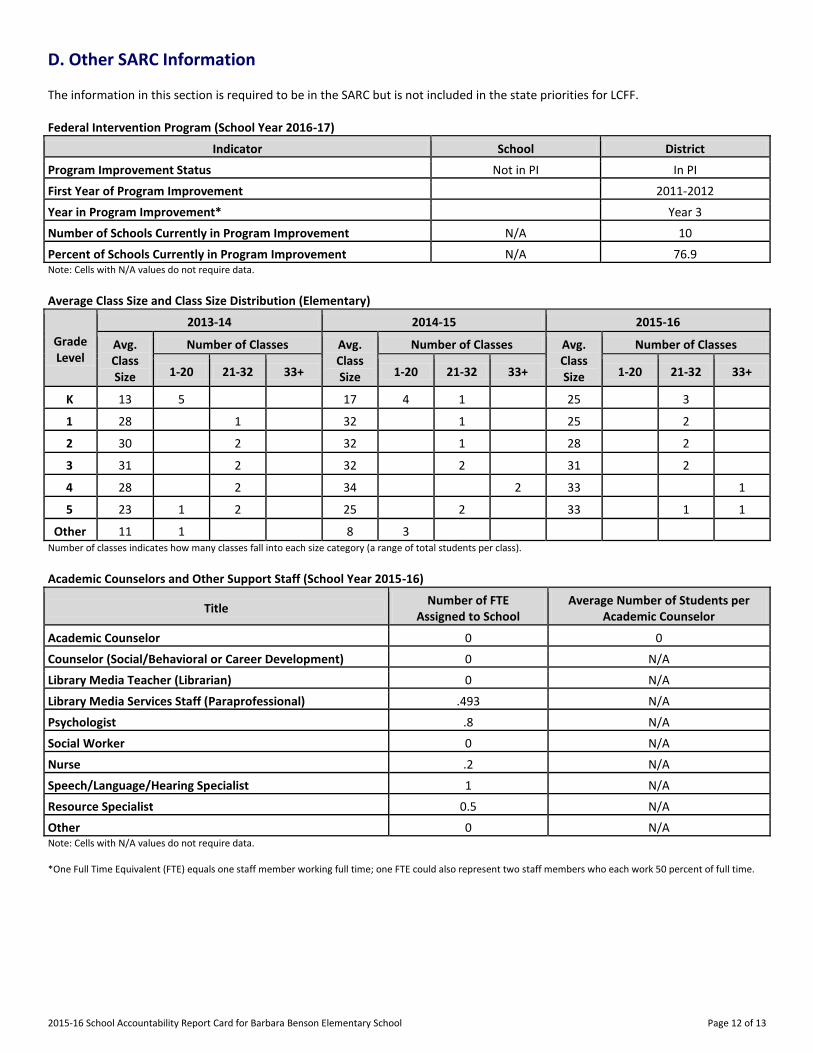
The information in this section is required to be in the SARC but is not included in the state priorities for LCFF. Federal Intervention Program (School Year 2016-17)
Indicator School District
Program Improvement Status Not in PI In PI
First Year of Program Improvement 2011-2012
Year in Program Improvement* Year 3
Number of Schools Currently in Program Improvement N/A 10
Percent of Schools Currently in Program Improvement N/A 76.9 Note: Cells with N/A values do not require data.
Average Class Size and Class Size Distribution (Elementary)
Grade Level
2013-14 2014-15 2015-16
Avg. Class Size
Number of Classes Avg. Class Size
Number of Classes Avg. Class Size
Number of Classes
1-20 21-32 33+ 1-20 21-32 33+ 1-20 21-32 33+
K
13 5 17 4 1 25 3
1
28 1 32 1 25 2
2
30 2 32 1 28 2
3
31 2 32 2 31 2
4
28 2 34 2 33 1
5
23 1 2 25 2 33 1 1
Other
11 1 8 3 Number of classes indicates how many classes fall into each size category (a range of total students per class).
Academic Counselors and Other Support Staff (School Year 2015-16)
Title Number of FTE
Assigned to School Average Number of Students per
Academic Counselor
Academic Counselor------- 0 0
Counselor (Social/Behavioral or Career Development) 0 N/A
Library Media Teacher (Librarian) 0 N/A
Library Media Services Staff (Paraprofessional) .493 N/A
Psychologist------- .8 N/A
Social Worker------- 0 N/A
Nurse------- .2 N/A
Speech/Language/Hearing Specialist 1 N/A
Resource Specialist------- 0.5 N/A
Other------- 0 N/A Note: Cells with N/A values do not require data. *One Full Time Equivalent (FTE) equals one staff member working full time; one FTE could also represent two staff members who each work 50 percent of full time.
2015-16 School Accountability Report Card for Barbara Benson Elementary School Page 13 of 13
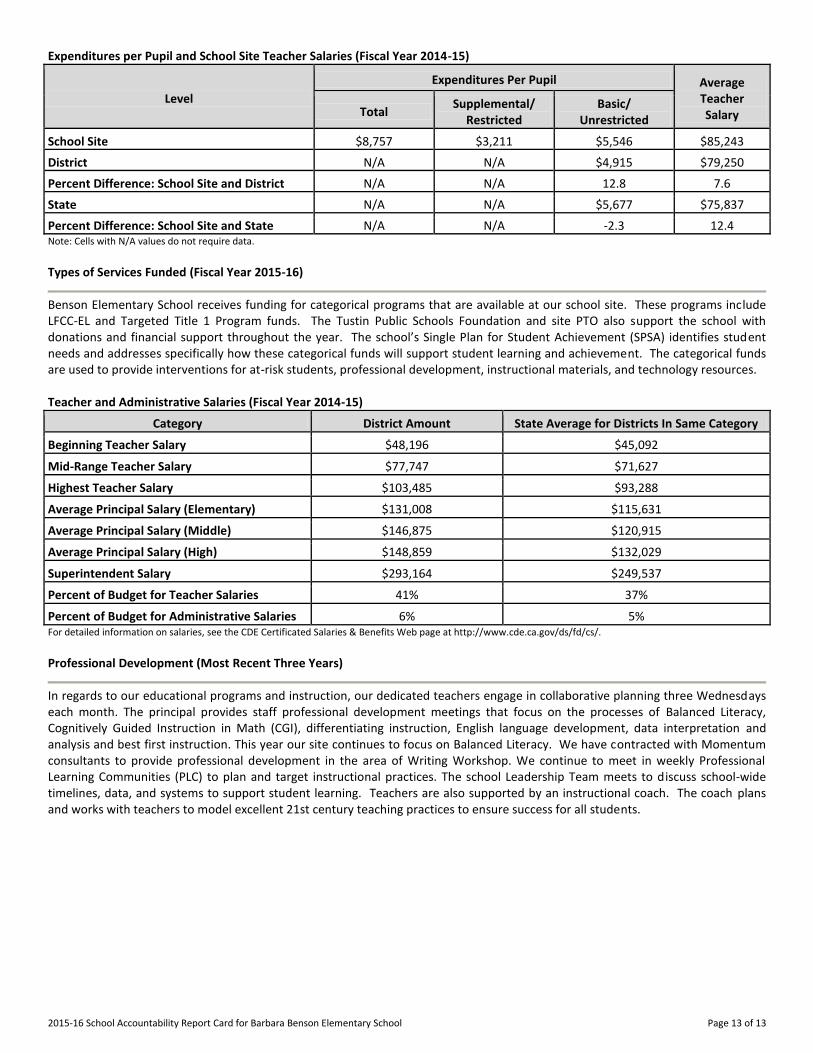
Expenditures per Pupil and School Site Teacher Salaries (Fiscal Year 2014-15)
Level
Expenditures Per Pupil Average Teacher Salary Total
Supplemental/ Restricted
Basic/ Unrestricted
School Site------- $8,757 $3,211 $5,546 $85,243
District------- N/A N/A $4,915 $79,250
Percent Difference: School Site and District N/A N/A 12.8 7.6
State------- N/A N/A $5,677 $75,837
Percent Difference: School Site and State N/A N/A -2.3 12.4 Note: Cells with N/A values do not require data.
Types of Services Funded (Fiscal Year 2015-16)
Benson Elementary School receives funding for categorical programs that are available at our school site. These programs include LFCC-EL and Targeted Title 1 Program funds. The Tustin Public Schools Foundation and site PTO also support the school with donations and financial support throughout the year. The school’s Single Plan for Student Achievement (SPSA) identifies student needs and addresses specifically how these categorical funds will support student learning and achievement. The categorical funds are used to provide interventions for at-risk students, professional development, instructional materials, and technology resources. Teacher and Administrative Salaries (Fiscal Year 2014-15)
Category District Amount State Average for Districts In Same Category
Beginning Teacher Salary $48,196 $45,092
Mid-Range Teacher Salary $77,747 $71,627
Highest Teacher Salary $103,485 $93,288
Average Principal Salary (Elementary) $131,008 $115,631
Average Principal Salary (Middle) $146,875 $120,915
Average Principal Salary (High) $148,859 $132,029
Superintendent Salary $293,164 $249,537
Percent of Budget for Teacher Salaries 41% 37%
Percent of Budget for Administrative Salaries 6% 5% For detailed information on salaries, see the CDE Certificated Salaries & Benefits Web page at http://www.cde.ca.gov/ds/fd/cs/. Professional Development (Most Recent Three Years)
In regards to our educational programs and instruction, our dedicated teachers engage in collaborative planning three Wednesdays each month. The principal provides staff professional development meetings that focus on the processes of Balanced Literacy, Cognitively Guided Instruction in Math (CGI), differentiating instruction, English language development, data interpretation and analysis and best first instruction. This year our site continues to focus on Balanced Literacy. We have contracted with Momentum consultants to provide professional development in the area of Writing Workshop. We continue to meet in weekly Professional Learning Communities (PLC) to plan and target instructional practices. The school Leadership Team meets to discuss school-wide timelines, data, and systems to support student learning. Teachers are also supported by an instructional coach. The coach plans and works with teachers to model excellent 21st century teaching practices to ensure success for all students.