Embed Size (px)
Citation preview
Bank Safety and Soundness and the Structure of Bank Supervision:
A Cross-Country Analysis
James R. Barth Auburn University
and The Milken Institute
[email protected] or [email protected]
Luis G. Dopico Auburn University
Daniel E. Nolle Office of the Comptroller of the Currency
James A. Wilcox University of California, Berkeley
V1.5 October 10, 2001
2001 FMA Annual Meeting Toronto, Canada October 18, 2001
The opinions expressed in this paper are those of the authors alone and do not necessarily represent those of the Office of the Comptroller of the Currency or the United States Department of the Treasury.
2
Bank Safety and Soundness and the Structure of Bank Supervision:
A Cross-Country Analysis
James R. Barth Auburn University
and The Milken Institute
Luis G. Dopico
Auburn University
Daniel E. Nolle Office of the Comptroller of the Currency
James A. Wilcox
University of California, Berkeley
Abstract
Over the past twenty years, the world’s banking systems have been subjected to upheavals in banking market structure, in ownership, and in regulation. Over the same period, banking crises large enough to envelop national banking systems have been widespread. In the aftermath of these consequential events, policymakers, analysts, and bankers have considered the optimal structure for bank supervision. Two of the central issues are whether multiple bank supervisory authorities are preferable and whether central banks should be bank supervisors.
Recently, several countries, ranging from countries in transition from centrally-planned regimes to the United Kingdom and Japan, significantly changed the structures of their bank supervision. The debates continue elsewhere.
Nevertheless, empirical research on these issues remains rare. Here we lay out some of the systematic relations between the structure of banking supervision and the resulting safety and soundness of a country’s banks. We used data for over 50 countries to assess the correlations between banking industry performance, economic and market conditions, banking regulations, and bank supervision.
We present estimates of the impacts of various measures of market structure, macroeconomic conditions, and permissible activities on banking safety and soundness. We found that countries whose central banks supervise banks tended to have more nonperforming loans but less liquidity risk. We also found that countries that had multiple bank supervisory authorities had lower capital ratios and higher liquidity risk. These correlations are consistent with multiple supervisors engaging in “competition in laxity”. At the same time, the structure of bank supervision appeared to have little correlation with banking profitability.

3
I. Introduction Significant changes in banking structure and competitiveness within countries,
and recent widespread banking crises, have compelled policy makers and industry
participants across the world to raise questions about the appropriate role, structure, and
supervision of banking. Much of the discussion on these issues continues within the
context of a given country’s institutional framework. Increasingly, however, policy
makers and industry participants are becoming aware that countries’ banking and
financial systems are interdependent. As a consequence, there is a growing need for
understanding how different banking and financial systems function.
This demand has begun to be addressed by a growing body of analytic work. A
burgeoning literature describes the extent to which bank structure, powers, and deposit
insurance schemes vary across countries. These studies typically use cross-country data
to identify the fundamental factors that affect banking industry performance, financial
stability, and economic development. The results of these studies helped shape policy
prescriptions for dealing with and preventing banking and financial crises and for
restructuring banking and financial systems.
Nevertheless, work remains to be done. This study focuses on the effects of the
structure of supervision on the banking industry. We focused on two aspects in
particular: 1) whether there were multiple supervisory authorities and 2) whether the
central bank supervised banks. We used data for over 50 countries and for over a dozen
measures of banking market and supervisory structure, of macroeconomic conditions, and
regulations to estimate the impact of these two aspects of banking supervision on banking
system safety and soundness. We found that central bank supervision of banks was
associated with more nonperforming loans but less liquidity risk. Having multiple bank
4
supervisory authorities was consistent with “competition in laxity,” in that bank capital
ratios tended to be lower but liquidity risk tended to be higher in countries that used
multiple bank supervisory authorities. At the same time, supervisory structure appears to
have had little impact on profitability.
Section II reviews previous literature on the effects on banking of the structure of
supervision. Section III describes our database. Section IV describes the specifications
that we estimated. Section V presents our estimates of the effects of the structure of
banking supervision on banking safety and soundness. Section VI summarizes and
concludes.
II. Previous Research on the Structure of Banking Supervision
As an increasing amount of cross-country data on banking is gathered, researchers
have begun to focus on aspects of banking that had been taken as given in single-country
studies of banking industry structure and performance.1 In particular, recent cross-
country studies have empirically tested for causal connections between banking industry
performance and key aspects of banking regulation and supervision, including deposit
insurance and activities permitted to banks.2 To date, however, there has been relatively
little research on whether the structure of banking regulation and supervision, such as the
number of supervisory authorities or whether the central bank supervised banks, affected
1 For a detailed description of a wide-ranging database covering the banking industry in over 100 countries see Barth, Caprio, and Levine (2001b). 2 For information on large cross-country databases, see in particular Barth, Caprio, and Levine (2001b), and Beck, Demirgüç-Kunt, and Levine (2001). For cross-country studies focusing on deposit insurance see, e.g., Demirgüç-Kunt and Detragiache (2000), Demirgüç-Kunt and Sobaci (2000), Demirgüç-Kunt and Huizinga (2000), Lindgren, Garcia, and Saal (1996), and Kane (2000). For cross-country studies focusing on banking powers see, e.g., Barth, Nolle, and Rice (2000), and Barth, Caprio, and Levine (2001a, and c).
5
banking performance or stability. Thus, as Abrams and Taylor (2001) note, “the subject
of regulatory structure has ... been under-researched.”3
The topic has become more important and relevant, however, as transition
countries often had to construct supervisory structures de novo and established private-
sector banking systems ran afoul of crises.4 In addition, consolidation of banking in
many countries produced fewer, larger, more complex banks with increased shares of
national banking systems.5 Deregulation and advances in banking have blurred
traditional product line distinctions between banking and other financial service
providers. Furthermore, disintermediation placed increasing pressures on banks to find
new sources of revenue. These pressures grew in recent years as technological advances
in telecommunications allowed nonbank financial and nonfinancial firms to enter banks’
traditional product and geographic markets.6 Increasing globalization of banking and
financial markets also meant that foreign banks played increasingly important roles in
3 Abrams and Taylor (2001), p. 10. Taylor and Fleming (1999) point out that although the recent, significant changes in the structure of supervision that took place in northern Europe generated a great deal of discussion within governments and in the press, they did not “lead to a significant academic debate.” (p.2). “Regulation” refers to the set of laws and rules applicable to banking, and “supervision” is defined as the monitoring by authorities of banks’ activities and the enforcement of banking regulations. See, e.g., Spong (2001), and Jordan (2001). However, as Spong (2001) explains, there is a widely used practice of referring to the authorities responsible for bank supervision interchangeably as “supervisors” and “regulators,” a practice we follow here unless otherwise specifically noted. For an explanation of how supervision, regulation, market discipline, and corporate governance can be integrated into a “regulatory regime” see Llewellyn (2001) and related comments by Estrella (2001). 4 A point stressed by Abrams and Taylor (2000), who nevertheless provide perspective on this issue relative to other regulatory and supervisory issues. 5 See Group of Ten (2001) for timely and comprehensive research on the nature, causes, and consequences of consolidation in the eleven G-10 countries, Australia, and Spain. 6 For a recent discussion of the impact of technological changes on the structure and performance of the banking industry, see Furst, Lang, and Nolle (2001). For a recent theoretical discussion of how technology has profoundly altered the nature of the “production” of banking activities, see Williams and Gillespie (2001).

6
many countries, making the world’s financial markets more connected than ever before.7
Finally, recent financial crises profoundly affected the structure of banking systems in
many countries, both because of the failure of banks and because of the imposition of
resolution measures.
These changes increased the complexity of risk management for banks and
thereby increased the difficulty of monitoring banks’ risk management and of
maintaining banking safety and soundness.8 In turn, these changes raised questions about
the appropriateness of existing structures of bank regulation and supervision. Among the
questions being asked by policymakers, market participants, and analysts are two specific
questions about the structure of supervision: 1) Is a single bank supervisory authority
preferable to multiple authorities? and 2) Should the central bank supervise banks?
Some existing studies emphasize one or the other of these issues; a few deal with
both.9 Before considering the literature on each of these issues, it is useful to cite several
studies that provide basic facts about bank supervision in different countries. Two of
these studies review the supervisory structure of banks and nonbank financial services; a
third study describes the range of central bank supervisory functions; and a fourth study
focuses on the supervisory structure of just the banking industry. Goodhart and
Schoenmaker (1995) examine the role of the central bank in bank supervision in 24
7 For a recent analysis of the role and impact of foreign banks, see Barth, Dopico, Nolle, and Wilcox (2001b). 8 See, e.g., Basel Committee on Banking Supervision (2001), p. 1. 9 A small group of studies describe the recent trend toward unifying supervision of not only banking but also other financial services in a single supervisory authority. For example Briault (1999) describes the recent unification of not only banking supervision but also other financial services under the Financial Services Authority in the United Kingdom. In addition he mentions the 1991 unification of all financial sector supervision under the Finansinspektionen in Sweden, the unification in the mid-to-late-1980s in Denmark and Norway of the supervision of banking, securities, and insurance, as well as recent consolidation of supervisory authorities in Japan, Korea, and Iceland. Taylor and Fleming (1999) give detailed descriptions of the supervisory restructuring in Norway, Denmark, Sweden, and the United Kingdom.
7
countries. Llewellyn (1999) summarizes the range of financial services for which various
supervisory authorities in 123 countries are responsible. Sinclair (2000) provides a
comparative summary of the “financial stability functions” of central banks in 37
countries.
Barth, Dopico, Nolle, and Wilcox (2001a) compare key aspects of banking
systems in over 100 countries. They focus on the supervisory structure of banking
systems. Using difference of means tests, they compare the magnitudes of various
features of countries that had a single bank supervisory authority with those in countries
that had multiple bank supervisory authorities. They also compare countries that had
central bank supervision of banks with those that did not. Their results suggest that
magnitudes differed insignificantly as a function of whether there were multiple bank
supervisory authorities. They did find that banking in countries that had a single bank
supervisor had more concentrated markets and higher profits.
Barth, Dopico, Nolle, and Wilcox (2001a) found more differences were
associated with whether the central bank in a country was also a bank supervisor.
Banking systems that were relatively small and had smaller banks were more likely to
have the central bank as a supervisory authority. Second, banking systems with less
emphasis on nontraditional banking as measured by noninterest income were more likely
to have the central bank as a supervisory authority. Third, banking systems with lower
credit quality were more likely to have the central bank as a supervisory authority.
Fourth, banking systems with high government ownership were more likely to have the
central bank as a supervisory authority. Finally, banking systems with less foreign
ownership of its banks were more likely to have the central bank as a supervisory
authority.
8
II.A. The Structure of Banking Supervision: Single vs. Multiple Supervisors
Recently, studies have considered the issue of whether a single supervisory
authority is to be preferred to multiple supervisory authorities. There are two variants of
this literature, both of which rely primarily on theory or logical argument and provide
little empirical evidence. One variant focuses on just the banking industry; the other
focuses on the broader issue of the number of supervisory authorities for major financial
services, such as banking, securities, and insurance.
Kahn and Santos (2001) develop a theoretical model of the optimal allocation of
bank supervisory powers. These powers include the lender of last resort function, deposit
insurance, and banking supervision. They conclude that if a single supervisory authority
is responsible for all of these functions, it may not monitor banks’ activities sufficiently
closely and may be too lenient on troubled institutions. Wall and Eisenbeis (2000) argue
that a single bank supervisory authority may be preferable to a multiple authority system
because having a single authority reduces the chance that conflicting policies will be
pursued in the face of multiple supervisory goals.
The second branch of the optimal number of supervisory authorities research
includes several studies dealing with the issue of the whether there should be a single
supervisor for all financial services. Many points in the debate in this broader arena
nevertheless have direct relevance for the narrower issue of whether there should be a
single supervisor or multiple supervisors for the banking industry. The debate on the
issue can be summarized in terms of arguments for a single banking supervisory
authority, and arguments against.
9
II.A.1. Arguments for a Single Banking Supervisor
Key arguments for having a single bank supervisory authority address three
issues: safety and soundness, costs of supervision, and costs to market participants:
Safety and Soundness • Consolidated supervision: Under a multiple supervisor regime, as banking
organizations grow larger and more complex, they may include affiliated institutions that are supervised by different authorities, none of which has responsibility for consolidated supervision of the whole banking organization. A single agency could avoid gaps that can arise with a regime based upon several authorities. [Llewellyn (1999)].
• Supervisory arbitrage: In the case of multiple supervisory authorities, financial
institutions may engage in supervisory arbitrage, propelling multiple supervisory authorities into a “competition on laxity.” [Llewellyn (1999), Abrams and Taylor (2001)].
• Conflict resolution: A single supervisor may be better able to resolve conflicts that
emerge between different supervisory goals because of lower “frictions” in deciding upon and implementing resolutions. [Briault (1999), Llewellyn (1999), Wall and Eisenbeis (2000)].
• Accountability: A single supervisor could be more transparent and accountable than
multiple supervisors, and may find it more difficult to “pass the buck” if it makes a mistake. [Briault (1999), Llewellyn (1999), Abrams and Taylor (2001)]
• Supervisory flexibility: A single supervisor may have more flexibility to respond to
changes in the financial landscape than would be the case for separate authorities, each of which has its own bureaucratic, political, and legal hurdles to overcome. [Abrams and Taylor (2001)].
• Cross-border supervision: A single supervisory authority can aid in international
supervisory cooperation, because foreign supervisors will have a single contact point. [Abrams and Taylor (2001)].
Costs to Supervisory Authorities • Efficiencies and economies of scale: A single supervisory authority will be larger. Its
size permits finer specialization of labor and more intensive utilization of inputs than would separate, smaller supervisory authorities. Larger size may permit acquisition of information technologies that become cost-effective only beyond a certain scale of operations. In addition, there would be no duplication of support infrastructures. [Briault (1999), Llewellyn (1999), Abrams and Taylor (2001)].
10
• Abrams and Taylor (2001, p.17) argue, “The economies of scale argument is most applicable in countries where supervisory authorities tend to be small, notably in small countries or those with small financial systems.”
• Resource allocation: A single, larger supervisory authority will be better able to attract, develop, and maintain professional staff expertise, and employ a single, coherent human resources policy, including career planning, in-house training programs, and the provision of more opportunities and professional challenges. [Briault (1999), Llewellyn (1999), Abrams and Taylor (2001)].
• Abrams and Taylor (2001, p. 19) argue that “The shortage of supervisory
resources is a serious problem in a number of countries”, particularly emerging markets.
• Economies of scope: To the extent that financial institutions continue to diversify into
a greater range of activities, a single supervisor might be more efficient at monitoring those activities, in part because it will be able to use a single set of central support services, and operate a single database for licensing firms and approving individuals. [Briault (1999), Llewellyn (1999)].
Costs to Market Participants • Supervisory burden: A fragmented supervisory system may increase the supervisory
burden on complex organizations supervised by many supervisors. In addition, a single supervisor provides a single point of contact for supervised institutions. [Briault (1999), Llewellyn (1999), Abrams and Taylor (2001)].
• Transparency: A system with a single supervisor may be simpler for banks and
consumers to understand. [Llewellyn (1999)]. II.A.2. Arguments against a Single Banking Supervisor
Safety and Soundness
• “Lessons learned”: Multiple supervisory authorities may take somewhat different approaches to supervision, yielding valuable information that would not be generated by a single approach. [Llewellyn (1999)].
Costs to Supervisory Authorities • Diseconomies of scale: A single large supervisory authority could become
excessively bureaucratic and inefficient. [Llewellyn (1999), Abrams and Taylor (2001)].
11
Costs to Market Participants • Supervisory responsiveness and innovation in the banking industry: A multiple
supervisors regime may encourage competition among supervisors to be more responsive to innovations in the regulated industry. [See Kane (1984) and Romano (1997, 2001) for studies of how supervisory competition leads to innovations in products; Kupiec and White (1996), and Romano (2001) on how competition among supervisors leads to innovations in institutional practices; and Romano (1985, 2001) for how supervisory competition leads to innovations in legal rules.]10
• Excessive power: A single large supervisor would be extremely powerful and this
power might become excessive. [Taylor (1995), Kane (1996), Briault (1999), Llewellyn (1999)].
There are plausible conceptual arguments on both sides of the question of
multiple supervisors. Empirical analysis can inform the debates by estimating the effects
of supervisory structure on the primary goal of supervision, banking safety and
soundness. Sections IV and V present our estimates, but before turning to them, we
discuss the other main structure-of-supervision issue: the role of the central bank in
banking supervision.
II.B. The Structure of Banking Supervision: Central Bank as Bank Supervisor
Our second main structure-of-supervision concern is the effect of having the
central bank supervise banks. The literature on this issue has been stimulated by the
actual or contemplated changes in the responsibilities in a number of countries of their
central banks.11 As with the multiple supervisor issue, much of the literature on the
10 In a related vein, Romano (2001) and Choi and Guzman (1998) argue that if firms in given regulated industry have substantially different characteristics, such that they might benefit from different supervisory approaches, a system of multiple supervisory authorities might have an advantage over a single supervisor, applying a single supervisory approach. 11 See Taylor and Fleming (1999) for a detailed account of these changes. Taylor and Fleming also give detailed descriptions of the change to a unified supervisory authority in several other countries, including the Scandinavian countries. Abrams and Taylor (2000) provide a recent summary of financial services supervision for many countries, focusing on the issue of the unification of the supervision of all major
12
supervisory role of the central bank has been conceptual, although a few empirical studies
have been conducted.12 The issue has generally been cast as whether the central bank, in
addition to its responsibility for monetary policy, should also be responsible for bank
supervision.
II.B.1. Arguments for the Central Bank Supervising Banks Safety, Soundness, and Systemic Stability
• Access to information: Because banks are the conduits through which changes in short-term interest rates are transmitted, the central bank needs to have accurate and timely information about the condition and performance of banks as a precondition for effective conduct of monetary policy. In addition, without “hands on” bank supervision responsibility, the central bank may take too little account of conditions in the banking sector when setting monetary policy. Further, the central bank needs to have access to information on the solvency and liquidity of banks in order to exercise its function of lender of last resort. Having such information in a timely manner is especially crucial in times of financial crises, and the best way to ensure access is by assigning on-going banking supervision responsibility to the central bank. Having supervisory power may also aid the central bank in acting quickly and precisely via the banking system in time of crisis. [Goodhart and Schoenmaker (1993), Goodhart (1995), Haubrich (1996), Briault (1999), Peek, Rosengren, and Tootell (1999), Abrams and Taylor (2001)
Using data for 104 bank failures in 24 countries during the 1980s, Goodhart and Schoenmaker (1995) find that countries with banking supervision and monetary policy combined in the central bank had fewer bank failures.13
• Independence: Independence for bank supervisory authorities enhances their ability
to enforce actions. Central banks often have a strong guarantee of their independence, so assigning them with bank supervision promotes the kind of
financial services in a single authority. Their work draws on data on financial sector supervisory structures in 137 countries found in Courtis (1999). 12 See Di Noia and Di Giorgio (1999) on this point. 13 They note, however, “the regime with the smallest number of bank failures is not necessarily the most efficient one in welfare terms” [Goodhart and Schoenmaker (1995, p. 551)]. In this same study, Goodhart and Schoenmaker also find empirical evidence that can be interpreted to have relevance for moral hazard behavior. In particular, they conclude (p. 553) that “a system where the central bank remains in charge of supervision and regulation is somewhat more likely to involve the commercial banks financing rescues and less likely to make a call upon the public (tax-payers’) purse than when the regulatory function is hived off to a separate agency.”

13
independent action necessary for successful banking system supervision. [Giddy (1994), Abrams and Taylor (2001)]. Abrams and Taylor (2001, p. 28) also make the point that the strategy of entrusting bank supervision to the central bank may be particularly important in transitional and emerging market economies, in order to increase the chances of avoiding “politicization of bank regulation.”
Costs to Supervisory Authorities • Resource allocation: The central bank may have a comparative advantage in
recruiting and retaining the best staff, due to its ability to provide superior compensation and professional development to staff. [Abrams and Taylor (2001)]. Abrams and Taylor (2001, p. 27) further argue “[t]his argument is particularly strong in countries where the absolute level of human capital with this skill is very small.”
II.B.2. Arguments against the Central Bank Supervising Banks Safety, Soundness, and Systemic Stability • Conflict of interests: In the case where the central bank has dual responsibility for
banking supervision and monetary policy, it may pursue a too loose monetary policy in order to avoid adverse effects on bank earnings and credit quality. [Goodhart and Schoenmaker (1993, 1995), Haubrich (1996), Briault (1999), Abrams and Taylor (2001)].
• Reputation risk: If the central bank is responsible for bank supervision and bank
failures occur, public perception of its credibility in conducting monetary policy could be adversely affected. [Haubrich (1996), Briault (1999), Abrams and Taylor (2001)].
• Access to information: To the extent central banks need timely and accurate
information, this can be accomplished through information-sharing arrangements with bank supervisory authorities. [Haubrich (1996)]. Haubrich also notes that, with the responsibility for supervision removed from the central bank and placed in another agency, it is possible that a debate over the proper course of both supervision and macroeconomic policies may benefit from a “competition of ideas.” Abrams and Taylor (2001) suggest that recently actualized or probable changes in the payment system (e.g., changes to a real time gross settlement system) may reduce the amount of oversight the central bank needs to have over payment system participants, thus reducing information needs somewhat.
• Independence: Briault (1999) argues that the wider is the role of the central bank, the
more subject it could become to political pressures, thus threatening its independence. • Using cross-country data, Goodhart and Schoenmaker (1995), and Di Noia and Di
Giorgio (1999) find a positive correlation between the rate of inflation on the one

14
hand, and the central bank having responsibility for both monetary policy and supervision.14
To supplement the sizeable conceptual but relatively small empirical literature
that bears directly on this issue, we produce estimates of the effects of having the central
bank as a bank supervisor on banking system safety and soundness. The main goal of our
empirical analysis is to ascertain whether the structure of banking supervision affected
banking system safety and soundness. In particular, we focus on the effects on safety and
soundness of: 1) whether there were multiple bank supervisory authorities and 2) whether
the central bank supervised banks.
III. Data
The World Bank and the U. S. Office of the Comptroller of the Currency (OCC)
obtained data on bank supervision by directly surveying the national banking supervisors
in over 100 countries. The World Bank survey gathered information for 1999 from 107
countries, as described in Barth, Caprio, and Levine (2001b). The World Bank survey
concentrated on bank regulation and supervisory practices. It also included measures of
the market structure of banking. The OCC survey gathered annual information from 110
countries for the years 1996-1999.15 The OCC survey focused on data for banking
market structure and performance. By combining the results from both surveys, we
increased the number of countries in our final data set to 133. In addition, when the same
variable was collected by both surveys for overlapping but not identical groups of
14 Goodhart and Schoenmaker (1995) note the lack of theoretical underpinning for this result, and point out that independent central banks, which are much better at fighting inflation, are also more likely not to have responsibility for banking supervision. Briault (1999, p. 28) observes that “less independent central banks tend to combine monetary policy and regulatory functions.” 15 Unless otherwise noted, we used the data that pertained to 1999.
15
countries (such as the percentage of total bank assets held by foreign-owned banks), one
survey dataset could be used to validate and supplement the other dataset.
Table 1 presents the distribution across continents of the countries that we used in
our statistical analysis. Because data were missing for some of the observations for some
countries, the largest sample size that we used was 78 countries. Table 1 shows that of
those 78 countries, 12 countries were designated as being in transition toward more
market-based economies from their former status of being Soviet-bloc countries and 8
countries were deemed to be offshore financial centers.16 The transition countries and
offshore financial centers are listed in panels A and B. We refer to the remaining 58
countries, shown in panel A of Table 1, as our base group of countries.
Table 2 shows whether a country in our base group had multiple bank supervisory
authorities and whether its central bank supervised banks. For 36 of the 58 countries in
our base group—nearly two-thirds of the countries--the central bank was the sole bank
supervisor. For about half that many countries, the single supervisor was not the central
bank. That is the case in the United Kingdom, where the FSA was deemed the single
supervisor of banks. In 6 of the 58 base group countries, the central bank shared
supervisory duties with another agency. This is the case for the United States, where the
OCC and the FDIC are also bank supervisors.
In a broader sample of 125 countries for which we have these data, 105 out of 125
countries -- 84% -- relied on a single bank supervisory authority. Of those countries,
nearly three-fourths of the countries -- 74% -- assigned the central bank to be the single
bank supervisory authority. In 78 of these countries, it was the single bank supervisory
authority. Patterns differed across incomes. The countries with the highest incomes
tended less frequently, 18 out of 37 cases, to have the central bank supervise banks.

16
(Though in the United States much is often made of the distinction between supervising
banks and supervising bank holding companies, for most of the rest of the world this
distinction is not material. Here we talk interchangeably about banks and banking
companies and their supervision.)
So that we can estimate the effects of these aspects of the structure of bank
supervision, we constructed two variables. MULT takes a value of 1 if there was more
than one banking supervisory agency and a value of zero otherwise. CENBAN takes a
value of 1 if a country’s central bank supervised banks and zero otherwise. We used both
of these variables to help explain various components of a banking system’s safety and
soundness in 1999.
We also chose proxies for each of the components of the safety and soundness of
a country’s banking system. The U.S. supervisory authorities use an evaluation scheme
known as the “CAMELS” system to rate the safety and soundness of individual banks.
Each letter of CAMELS represents a different aspect of bank safety and soundness: C =
capital adequacy, A = asset quality, M = management, E = earnings, L = liquidity, and S
= sensitivity to market risk. Each bank supervisory agency in the United States assigns to
each bank a value from 1 (best) to 5 (worst) for each component of CAMELS, as well as
a composite rating that also ranges from 1 to 5.
Other countries do not explicitly use the CAMELS system. Nevertheless, we
regard the components of CAMELS as a good set of indicators of the safety and
soundness of both individual banks and of a country’s entire banking system. Therefore,
we selected variables from the survey data to approximate the components of CAMELS
16 Offshore financial centers were classified by reference to Errico and Musalem (1999).
17
and thereby to serve as indicators of a country’s banking system safety and soundness.17
Thus, our procedure was to identify and then use as dependent variables the variables in
our datasets that corresponded most closely with the components of the CAMELS
system.
Dependent Variables
• “C” (capital adequacy) is proxied by the variable EQUITY, the ratio of equity capital to assets for the banking industry of each country in 1999.
• “A” (asset quality) is proxied by the variable NPL, the ratio of nonperforming loans
to total loans for the banking industry of each country in 1999. • “M” (management quality) is proxied by two variables. OVERHEAD, the ratio of
overhead (noninterest) costs to assets for the banking industry of each country in 1999, gives a measure of cost control; and NONINTREV, the ratio of noninterest revenues to total revenues for the banking industry of each country in 1999, gives a indication of business strategy. In particular, we interpret higher noninterest revenue to total revenue as an indication that the bank is focused relatively more intensely on nontraditional activities, reflecting a more innovative management.
• “E” (earnings) is proxied by two variables. ROA is the ratio of net income to assets
for the banking industry of each country in 1999. ROE is the ratio of net income to equity for the banking industry of each country in 1999.
• “L” (liquidity) is proxied by LIQRISK, the ratio of loans to assets plus the ratio of
deposits to loans for the banking industry of each country in 1999. This measure serves as a proxy for liquidity risk, because loans are typically considered to be illiquid assets (compared to cash or securities) and since deposits are typically short-term liabilities with the ability to leave an institution on short notice (compared to debt or equity finance for a financial institution).
Independent Variables18
We then chose variables that the literature, introspection, and preliminary
statistical results pointed to as candidate variables that would explain those dependent
17 We do not have a proxy for the S in CAMELS. Nevertheless, until recently supervisors did not employ a separate component for sensitivity to market risk. Most of the literature on supervisory ratings continues to focus on CAMEL ratings (i.e., without the S component). 18 The data for the indices SECUR, INSUR, BANPOWER, COMMERCE, SUPPOWER, and PRIVMON are from the World Bank. See Barth, Caprio, and Levine (2001b) for detailed explanations of the calculations underlying these variables.
18
variables. In addition to MULT and CENBAN, we drew from this list of independent
variables:
• GOVT is the share of total bank assets held in government-owned banks in each country in 1999.
• FOREIGN is the share of total bank assets held in foreign-owned banks in each
country in 1999. • CONCENTRATION is a concentration measure, calculated as the share of total
bank assets held in the three largest banks in each country in 1999. • BANKSIZE is a measure of average bank size, computed by dividing total bank
assets by the number of banks for each country in 1999, expressed in billions of US dollars.
• GDPCAP is gross domestic product per capita in 1999, expressed in thousands of US
dollars. • DY9599 is the average rate of real GDP growth over the 1995-1999 period.
• SECUR is an index of how restricted banks were to engage in securities underwriting, brokering, and dealing in securities and in all aspects of the mutual fund industry. A value of 1 implies that the activity is unrestricted. A value of 2 implies that the activity is permitted (for instance through a separate subsidiary). A value of 3 implies that the activity is restricted (for instance up to a maximum percentage of assets or capital). A value of 4 implies that the activity is prohibited.
• INSUR is an index of how restricted banks were to engage in insurance underwriting
and selling. The index is constructed in a manner that parallels SECUR. • BANPOWER is an index of how restricted banks were to engage in securities,
insurance, and real estate activities. The index is constructed adding the values of SECUR, INSUR, and a similar real estate index.
• COMMERCE is an index of how restricted banks were to own nonfinancial
companies and how restricted nonfinancial companies were to own banks. The index is constructed by adding the values of two separate indices that measure restrictions in either direction, in a manner that parallels the construction of SECUR and INSUR. Greater values imply greater restrictions.
• SUPPOWER is an index of the powers of bank supervisors. Greater values imply
greater power. • PRIVMON is an index of private monitoring of banks by the private marketplace.
Greater values imply a greater ability to conduct such monitoring.
19
Table 3 provides descriptive statistics that summarize some of the features of the
dependent and then independent variables that we used, for the base group of countries.
In addition to plots of the data themselves, which are shown in Figures 1 through 7 for
the dependent variables, these statistics alerted us to data features that might have
inordinately influenced our regression results. As a consequence of checks like these, we
trimmed the range of the profitability variables to exclude extreme outliers, as noted
below. Not surprisingly, many of the variables were far from being normally distributed.
Being normal was rarely an important criterion, however. The nature of many of these
variables made normality and even symmetry of their distributions across countries very
unlikely.
Table 4 shows the simple correlations between each pair of the seven dependent
variables. Table 4 shows that many of the correlation coefficients hovered around 0.1
and a few bunched around 0.5.19 These low correlations suggest that the different
variables are indeed measuring quite different aspects of banking system safety and
soundness.
One avenue for future work in this area would be to calculate a proxy for the
composite CAMELS rating for each country. One possibility would be to regress the
composite CAMELS ratings for individual U.S. banks on the seven variables that we
used as dependent variables to proxy for the components of CAMELS. The resulting
coefficients could then be used to construct a composite CAMELS rating for each
country’s banking system safety and soundness. That measure could then be regressed
on our list of candidate independent variables to see whether the bank supervisory
19 Because data for some of these dependent variables were missing, the correlation coefficients reported in Table 4 were based on samples that ranged from 45 to 58 observations. For the same reason, the regressions reported in Tables 5 through 9 did not all include all of the countries for the groups shown in Table 1.

20
structure variables were significantly correlated across countries with the composite
CAMELS.
We provided the descriptive statistics in Table 3 as a way to summarize the
dependent variables. Figures 1 through 7 plot the data for the seven dependent variables
so that we can see whether extreme outliers—or even “inliers” that reflect too little
informative variation in the data—dominate our data. In fact, the ordered data for most
of these variables seem quite smooth and cover wide ranges.
Capital ratios vary from Indonesia’s negative four percent to several countries
with double-digit readings of EQUITY. Figure 2 shows that nonperforming loan ratios
typically were under 10 percent, but a few were above 20 percent. Overhead costs varied
less; with the exceptions of Kenya and Venezuela, almost all the other reported overhead
cost ratios were less than six percent. The data for NONINTREV in Figure 4 covered an
enormous range with large numbers of countries reporting about 15 percent and another
sizeable group of countries reporting data in the 30-40 percent range. A few reported
ratios above 50 percent.
Figures 5 and 6 plot the profitability measures, ROA and ROE, which differ by
their denominators. (Our regressions, and thus these figures, trimmed out the ROA or
ROE observations that exceeded, in absolute value, 5 or 50 percent, respectively. Thus,
Indonesia was not in these figures or in the profitability regressions.) Many of the ROA
data were centered around one percent return on assets. Not surprisingly in light of the
capital ratios shown in Figure 1, the ROE data were concentrated in the 10-25 percent
range.
Figure 7 plots a measure that captures both liquidity and interest-rate risk. The
ratios rise as banks hold more of their assets as loans, which are presumably longer-term
and less interest-responsive than other bank assets such as short-term bonds. LIQRISK

21
also rises as banks hold more of their liabilities as deposits, which are presumably
shorter-term and more interest-responsive than other bank liabilities such as long-term
bonds. Thus, larger values of LIQRISK correspond to banking systems that may be more
vulnerable to bank runs and to capital losses associated with increases in interest rates.
Although most countries have ratios within 30 percentage points of 100 percent, there are
also several that are considerably further from the sample mean.
IV. Empirical Models of Banking System Safety and Soundness
We used OLS regressions to estimate the effects of multiple bank supervisors and
central banks as bank supervisors on the safety and soundness of banking around the
world. To do so, each of our regressions included the two measures of banking
supervision structure, MULT and CENBAN. Each regression also includes four
additional control variables: FOREIGN, GOVT, GDPCAP, and DY9599. These
variables were included to control for the possible differences in banking safety and
soundness in our sample of countries that might have been unrelated in principle but
correlated in practice with MULT and CENBAN.
For instance, we intended for foreign-ownership of banks (FOREIGN) to control
for different degrees of openness to foreign competition in a banking market. Similarly,
we intended for government ownership of banks (GOVT) to control for the extensiveness
of government policies (such as preferential credit allocation to different sectors) through
which governments seek to affect economies and actually do affect our banking safety
and soundness measures. These variables could affect any of the components of safety
and soundness, but they seem especially likely to affect loan quality and profitability.
Gross domestic product per capita (GDPCAP) and the rate of economic growth
22
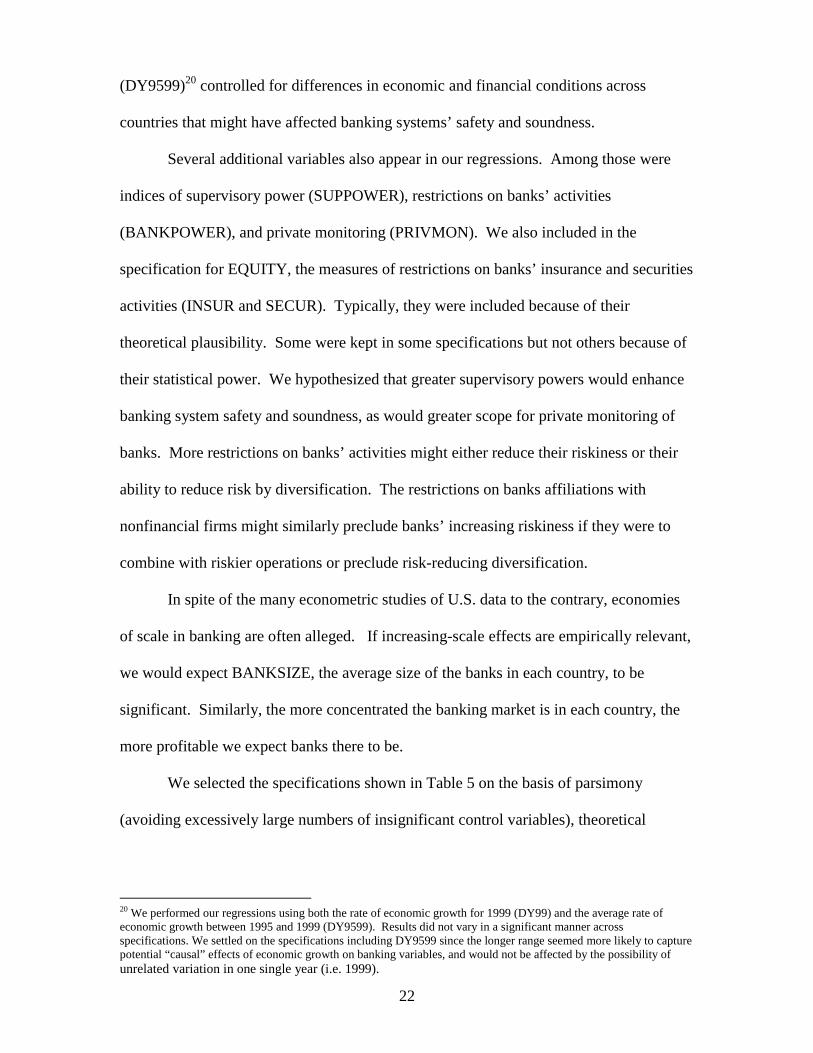
(DY9599)20 controlled for differences in economic and financial conditions across
countries that might have affected banking systems’ safety and soundness.
Several additional variables also appear in our regressions. Among those were
indices of supervisory power (SUPPOWER), restrictions on banks’ activities
(BANKPOWER), and private monitoring (PRIVMON). We also included in the
specification for EQUITY, the measures of restrictions on banks’ insurance and securities
activities (INSUR and SECUR). Typically, they were included because of their
theoretical plausibility. Some were kept in some specifications but not others because of
their statistical power. We hypothesized that greater supervisory powers would enhance
banking system safety and soundness, as would greater scope for private monitoring of
banks. More restrictions on banks’ activities might either reduce their riskiness or their
ability to reduce risk by diversification. The restrictions on banks affiliations with
nonfinancial firms might similarly preclude banks’ increasing riskiness if they were to
combine with riskier operations or preclude risk-reducing diversification.
In spite of the many econometric studies of U.S. data to the contrary, economies
of scale in banking are often alleged. If increasing-scale effects are empirically relevant,
we would expect BANKSIZE, the average size of the banks in each country, to be
significant. Similarly, the more concentrated the banking market is in each country, the
more profitable we expect banks there to be.
We selected the specifications shown in Table 5 on the basis of parsimony
(avoiding excessively large numbers of insignificant control variables), theoretical
20 We performed our regressions using both the rate of economic growth for 1999 (DY99) and the average rate of economic growth between 1995 and 1999 (DY9599). Results did not vary in a significant manner across specifications. We settled on the specifications including DY9599 since the longer range seemed more likely to capture potential “causal” effects of economic growth on banking variables, and would not be affected by the possibility of unrelated variation in one single year (i.e. 1999).
23
arguments, and completeness. Thus, we included independent variables that were found
to be either statistically significant or, even while insignificant, of particular interest.
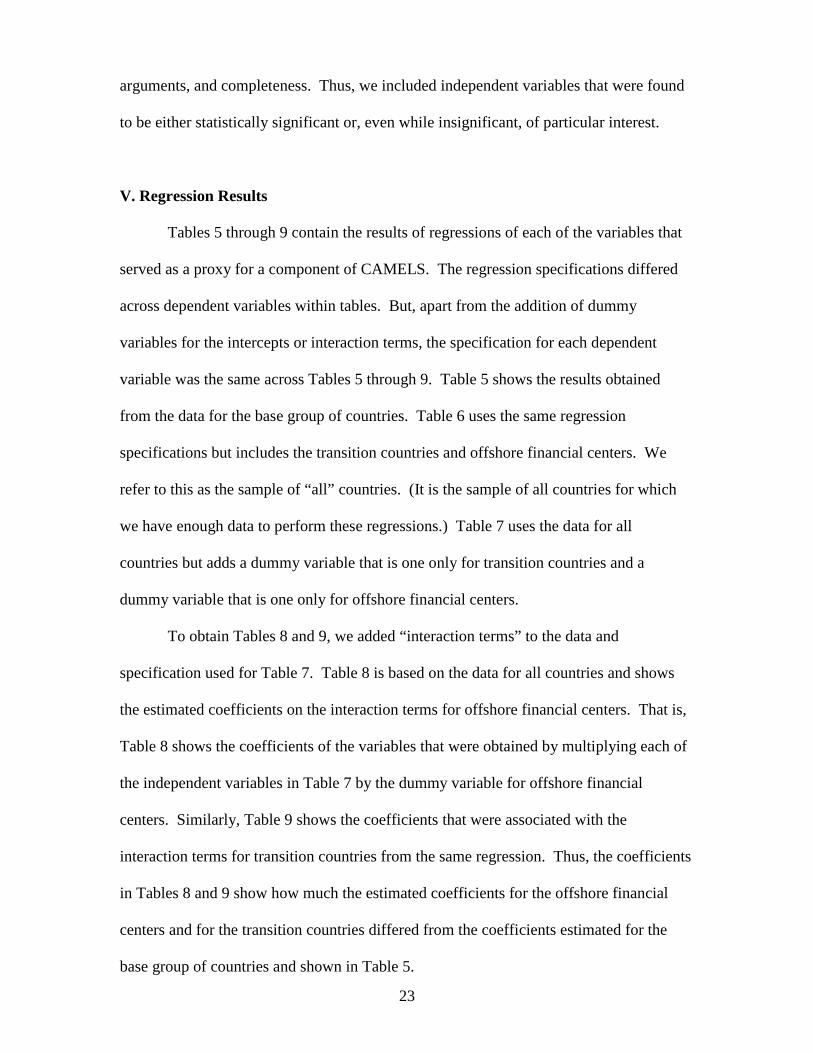
V. Regression Results
Tables 5 through 9 contain the results of regressions of each of the variables that
served as a proxy for a component of CAMELS. The regression specifications differed
across dependent variables within tables. But, apart from the addition of dummy
variables for the intercepts or interaction terms, the specification for each dependent
variable was the same across Tables 5 through 9. Table 5 shows the results obtained
from the data for the base group of countries. Table 6 uses the same regression
specifications but includes the transition countries and offshore financial centers. We
refer to this as the sample of “all” countries. (It is the sample of all countries for which
we have enough data to perform these regressions.) Table 7 uses the data for all
countries but adds a dummy variable that is one only for transition countries and a
dummy variable that is one only for offshore financial centers.
To obtain Tables 8 and 9, we added “interaction terms” to the data and
specification used for Table 7. Table 8 is based on the data for all countries and shows
the estimated coefficients on the interaction terms for offshore financial centers. That is,
Table 8 shows the coefficients of the variables that were obtained by multiplying each of
the independent variables in Table 7 by the dummy variable for offshore financial
centers. Similarly, Table 9 shows the coefficients that were associated with the
interaction terms for transition countries from the same regression. Thus, the coefficients
in Tables 8 and 9 show how much the estimated coefficients for the offshore financial
centers and for the transition countries differed from the coefficients estimated for the
base group of countries and shown in Table 5.
24
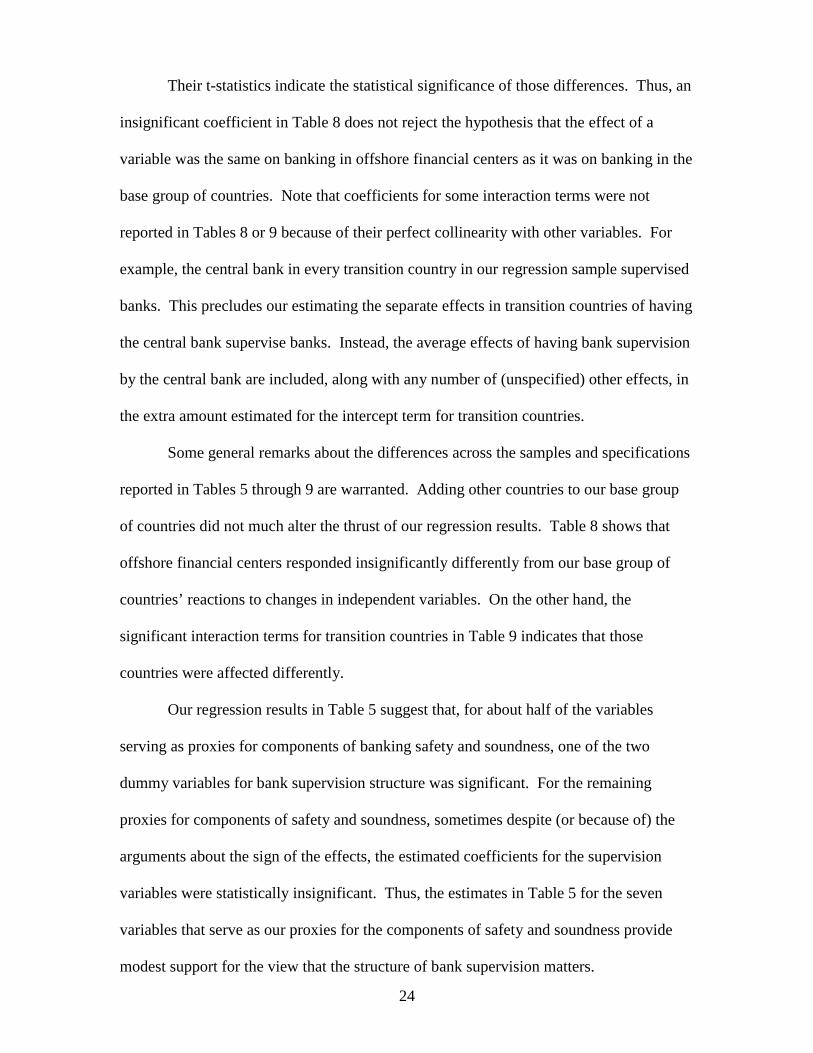
Their t-statistics indicate the statistical significance of those differences. Thus, an
insignificant coefficient in Table 8 does not reject the hypothesis that the effect of a
variable was the same on banking in offshore financial centers as it was on banking in the
base group of countries. Note that coefficients for some interaction terms were not
reported in Tables 8 or 9 because of their perfect collinearity with other variables. For
example, the central bank in every transition country in our regression sample supervised
banks. This precludes our estimating the separate effects in transition countries of having
the central bank supervise banks. Instead, the average effects of having bank supervision
by the central bank are included, along with any number of (unspecified) other effects, in
the extra amount estimated for the intercept term for transition countries.
Some general remarks about the differences across the samples and specifications
reported in Tables 5 through 9 are warranted. Adding other countries to our base group
of countries did not much alter the thrust of our regression results. Table 8 shows that
offshore financial centers responded insignificantly differently from our base group of
countries’ reactions to changes in independent variables. On the other hand, the
significant interaction terms for transition countries in Table 9 indicates that those
countries were affected differently.
Our regression results in Table 5 suggest that, for about half of the variables
serving as proxies for components of banking safety and soundness, one of the two
dummy variables for bank supervision structure was significant. For the remaining
proxies for components of safety and soundness, sometimes despite (or because of) the
arguments about the sign of the effects, the estimated coefficients for the supervision
variables were statistically insignificant. Thus, the estimates in Table 5 for the seven
variables that serve as our proxies for the components of safety and soundness provide
modest support for the view that the structure of bank supervision matters.
25
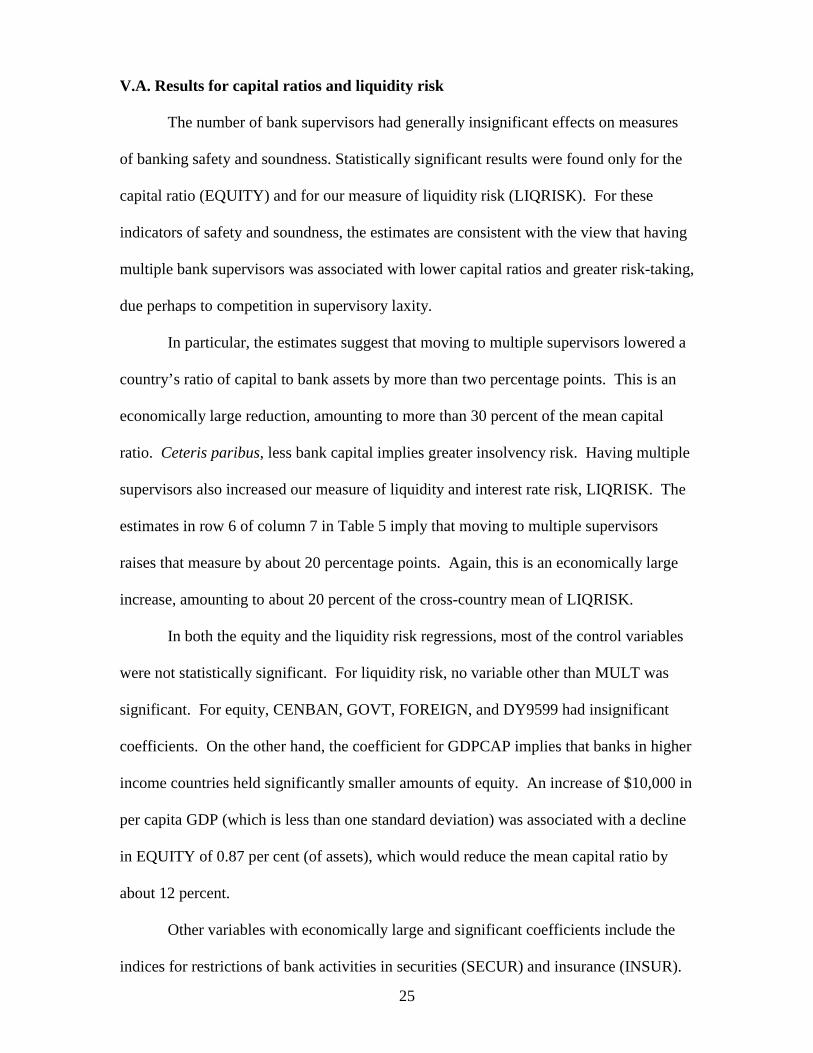
V.A. Results for capital ratios and liquidity risk
The number of bank supervisors had generally insignificant effects on measures
of banking safety and soundness. Statistically significant results were found only for the
capital ratio (EQUITY) and for our measure of liquidity risk (LIQRISK). For these
indicators of safety and soundness, the estimates are consistent with the view that having
multiple bank supervisors was associated with lower capital ratios and greater risk-taking,
due perhaps to competition in supervisory laxity.
In particular, the estimates suggest that moving to multiple supervisors lowered a
country’s ratio of capital to bank assets by more than two percentage points. This is an
economically large reduction, amounting to more than 30 percent of the mean capital
ratio. Ceteris paribus, less bank capital implies greater insolvency risk. Having multiple
supervisors also increased our measure of liquidity and interest rate risk, LIQRISK. The
estimates in row 6 of column 7 in Table 5 imply that moving to multiple supervisors
raises that measure by about 20 percentage points. Again, this is an economically large
increase, amounting to about 20 percent of the cross-country mean of LIQRISK.
In both the equity and the liquidity risk regressions, most of the control variables
were not statistically significant. For liquidity risk, no variable other than MULT was
significant. For equity, CENBAN, GOVT, FOREIGN, and DY9599 had insignificant
coefficients. On the other hand, the coefficient for GDPCAP implies that banks in higher
income countries held significantly smaller amounts of equity. An increase of $10,000 in
per capita GDP (which is less than one standard deviation) was associated with a decline
in EQUITY of 0.87 per cent (of assets), which would reduce the mean capital ratio by
about 12 percent.
Other variables with economically large and significant coefficients include the
indices for restrictions of bank activities in securities (SECUR) and insurance (INSUR).
26
A one-unit increase in SECUR (a little more than its standard deviation) was associated
with an equity ratio that was 1.66 percentage points higher. This may be a reflection of a
tendency for banks focusing on investment banking to maintain smaller capital ratios.
Thus, banks that were restrained from engaging in securities activities might have held
more capital. By comparison, a one-unit increase in INSUR (slightly more than one
standard deviation) was associated with about a one percentage point lower capital ratio.
V.B. Nonperforming Loans
In the case of NPL, countries where the central bank supervised banks had
significantly higher ratios of nonperforming loans to total loans, but the number of bank
supervisory authorities was not statistically significant. The estimate in row 7 of column
2 implies that, on average, NPL in banking systems supervised by central banks was
almost 600 basis points higher. This effect is economically rather large, since it accounts
for 62 percent of the mean and 62 percent of the standard deviation of nonperforming
loans across countries.
FOREIGN had a significant negative effect on NPL. A 28 percent increase in the
foreign banking share (one standard deviation) was associated with a level of
nonperforming loans that was more than two percentage points lower. This estimate
supports the hypothesis that foreign banking has a positive influence on the types and
quality of loans made in a country, and therefore on banking system stability. In
addition, more developed countries appeared to have had significantly fewer
nonperforming loans. An increase in GDP per capita of $10,000 (less than one standard
deviation) reduced nonperforming loans by nearly two percentage points. Its negative
coefficient suggests that increased private monitoring reduced nonperforming loans.
27
V.C. Overhead
The structure of bank supervision appeared to have some effect on banks’
overhead costs. Having multiple supervisors had a statistically weak tendency to raise
overhead costs, perhaps through the extra costs of duplication in bank oversight. By
contrast, having the central bank supervise banks was associated with a significant, 1.76
percent reduction in overhead costs, which would be a large effect, amounting to about
half the mean of overhead costs. Our results suggest that while being associated with
more nonperforming loans, central bank supervision of banks appears to be associated
with lower overhead costs.
Somewhat surprisingly, the coefficients for GOVT and FOREIGN were
insignificant and economically very small. Thus, this regression does not provide support
for the theories that government ownership makes banks either more or less cost-
efficient. Similarly, the estimates provide little support for the claims that foreign entry
drives banking costs lower, or that foreign banks seek high cost environments. Of
course, operation of both of those effects simultaneously could cancel each other out,
making the effects difficult to capture in our cross-section dataset.
Having larger banks, higher per capita income, or faster recent real economic
growth was associated with significantly lower overhead costs (relative to assets). Each
of these effects may largely reflect various economies of scale and the reduced costs that
banks incur during relatively prosperous periods.
We also included the index of private monitoring and the index of restrictions on
bank activities in the specification for overhead costs. More restrictions on bank
activities raised overhead costs, as shown in row 13 of column 3. Whether this suggests
that restrictions preclude banks from realizing economies of scope is one possible
28
interpretation of this effect. Finally, a greater scope for private monitoring of banks
seems to have led banks to reduce overhead costs.
V.D. Noninterest revenues
Our measure of noninterest revenues (as a share of total revenues) can be viewed
as a measure of how aggressive and empowered banks are. Higher levels of noninterest
revenues can come from fees that are linked to traditional activities (e.g., account
maintenance fees, ATM fees, etc.), or are linked to banking activities such as securities,
insurance, or real estate. We found no statistical evidence that the structure of banking
supervision on balance affected noninterest revenues.
The answers provided to our surveys by supervisory authorities from around the
world do not allow us to distinguish between the different sources of fee income
mentioned above. And our measures of restrictions on banks ability to engage in non-
interest activities (BANKPOWER) and of limits on the ability to mix banking and
commerce (COMMERCE) were also insignificant sources of information about
noninterest revenues. These data problems are compounded by differences in accounting
around the world. Where universal banking is common, nontraditional revenues are
likely to be included in bank revenue. Where financial companies engage both in
banking and non-banking activities, accounting rules may differ. Thus, banks in some
countries may have reported to us consolidated accounts that included noninterest income
activities, while other countries may have reported data only for banking subsidiaries that
excluded noninterest revenues.
Our results imply that banks in higher income countries earned more fees. This
effect might reflect that many financial services are likely to be normal goods and that at
higher levels of income, a greater variety of financial services is demanded (for instance
29
insurance, retirement planning, etc.). Also, increased private monitoring appears to be
significantly associated with smaller amounts of noninterest revenues. In environments
where private monitoring is poor (where transparency and enforceability of contracts are
poor), market transactions are fraught with additional risk and uncertainty. In such
situations where the cost of information is high, synergies are likely to arise in the
provision of many types of financial (and non-financial) services within a single
company. Thus, a plausible hypothesis might be that increased private monitoring tends
to be associated with specialist-type financial institutions that concentrate in one type of
financial service, and do not find substantial cross-sectoral synergies from providing a
range of services.
V. E. ROA and ROE
Neither measure of the structure of bank supervision was found to have any
significant effect on either measure of bank profitability. Over the long-enough run, that
may not be surprising--one would expect economic profits in this industry or any other to
be determined by the degree of market power present in the market. Thus, the primary
variable that was found to be significant was a standard measure of market power,
CONCENTRATION, which we measured by the share of total bank assets held by the
three largest banks in each country. Our estimates suggest that a one standard deviation
(24 percent) increase in concentration is associated with an increase in ROE of 2.9
percent (of equity). This effect is economically large, representing 19 percent of the
mean of ROE.
Other variables not found to be significant included GOVT, FOREIGN, and
GDPCAP. The foreign market share may be viewed as an alternative measure of entry.
Thus, its insignificance may be driven by the inclusion of the concentration measure
30
itself. Alternatively, it is unclear theoretically whether one should expect foreign banks
to seek markets where profits are high (to exploit them) or where profits are low (to do
better than current participants). Foreign-owned banks might also be associated with
increased profitability if they are more efficient, but foreign entry could dissipate profits.
Since all these factors could be operating simultaneously, it is difficult for a cross-section
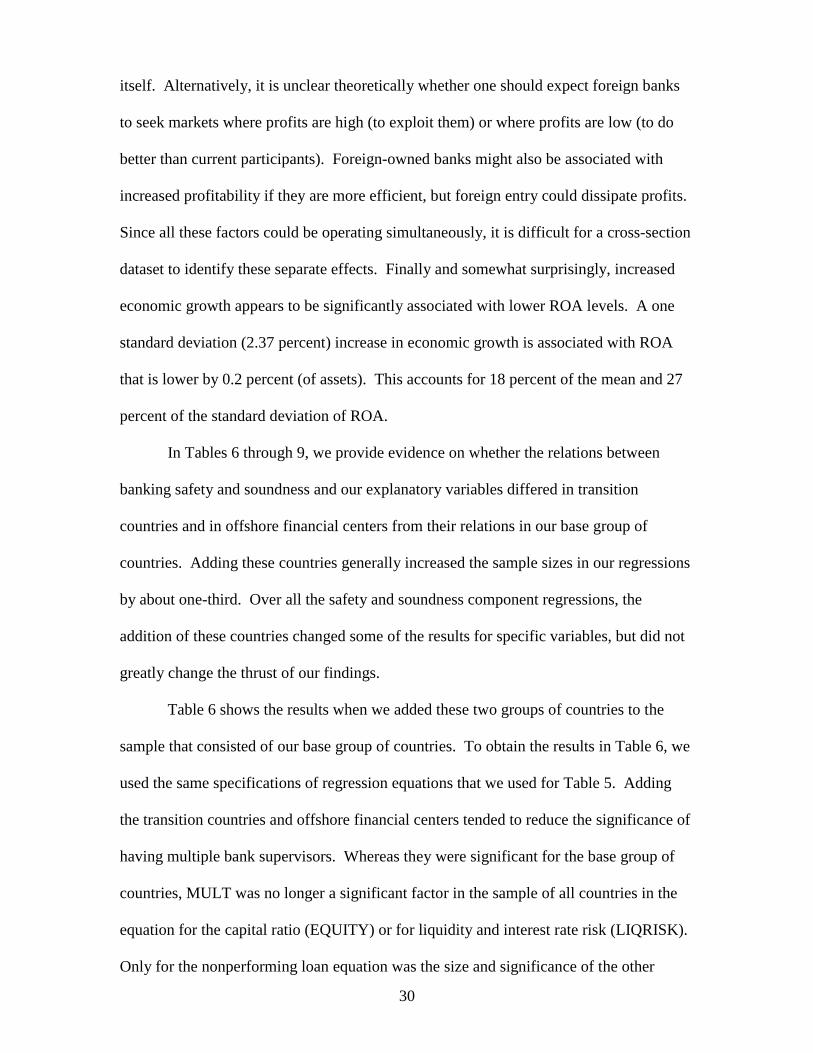
dataset to identify these separate effects. Finally and somewhat surprisingly, increased
economic growth appears to be significantly associated with lower ROA levels. A one
standard deviation (2.37 percent) increase in economic growth is associated with ROA
that is lower by 0.2 percent (of assets). This accounts for 18 percent of the mean and 27
percent of the standard deviation of ROA.
In Tables 6 through 9, we provide evidence on whether the relations between
banking safety and soundness and our explanatory variables differed in transition
countries and in offshore financial centers from their relations in our base group of
countries. Adding these countries generally increased the sample sizes in our regressions
by about one-third. Over all the safety and soundness component regressions, the
addition of these countries changed some of the results for specific variables, but did not
greatly change the thrust of our findings.
Table 6 shows the results when we added these two groups of countries to the
sample that consisted of our base group of countries. To obtain the results in Table 6, we
used the same specifications of regression equations that we used for Table 5. Adding
the transition countries and offshore financial centers tended to reduce the significance of
having multiple bank supervisors. Whereas they were significant for the base group of
countries, MULT was no longer a significant factor in the sample of all countries in the
equation for the capital ratio (EQUITY) or for liquidity and interest rate risk (LIQRISK).
Only for the nonperforming loan equation was the size and significance of the other
31
supervisory structure variable, CENBAN, appreciably affected by the addition of
transition countries and offshore financial centers—and even those declines were not
particularly large.
The size and significance of other variables was more affected. The significance
of both SECUR and INSUR in the equation for EQUITY dropped markedly when
transition countries and offshore financial centers were added to the sample. Transition
countries in particular tended to have larger government ownership of banks. When we
included all countries in the sample, the negative effects of government ownership on
overhead costs and on noninterest revenue became larger and much more significant, as
shown in column 4 of Table 6. The other change to note is that, though its size didn’t
change, the market concentration ratio in Table 6 became a very significant determinant
of ROA.
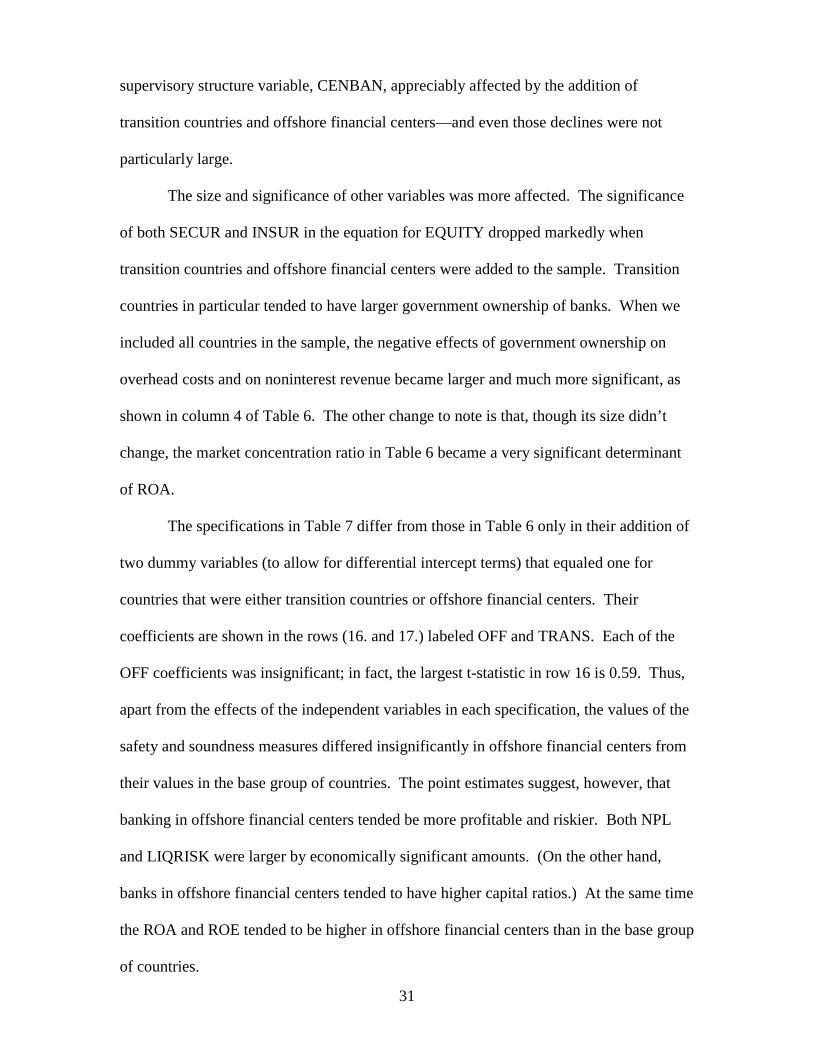
The specifications in Table 7 differ from those in Table 6 only in their addition of
two dummy variables (to allow for differential intercept terms) that equaled one for
countries that were either transition countries or offshore financial centers. Their
coefficients are shown in the rows (16. and 17.) labeled OFF and TRANS. Each of the
OFF coefficients was insignificant; in fact, the largest t-statistic in row 16 is 0.59. Thus,
apart from the effects of the independent variables in each specification, the values of the
safety and soundness measures differed insignificantly in offshore financial centers from
their values in the base group of countries. The point estimates suggest, however, that
banking in offshore financial centers tended be more profitable and riskier. Both NPL
and LIQRISK were larger by economically significant amounts. (On the other hand,
banks in offshore financial centers tended to have higher capital ratios.) At the same time
the ROA and ROE tended to be higher in offshore financial centers than in the base group
of countries.
32
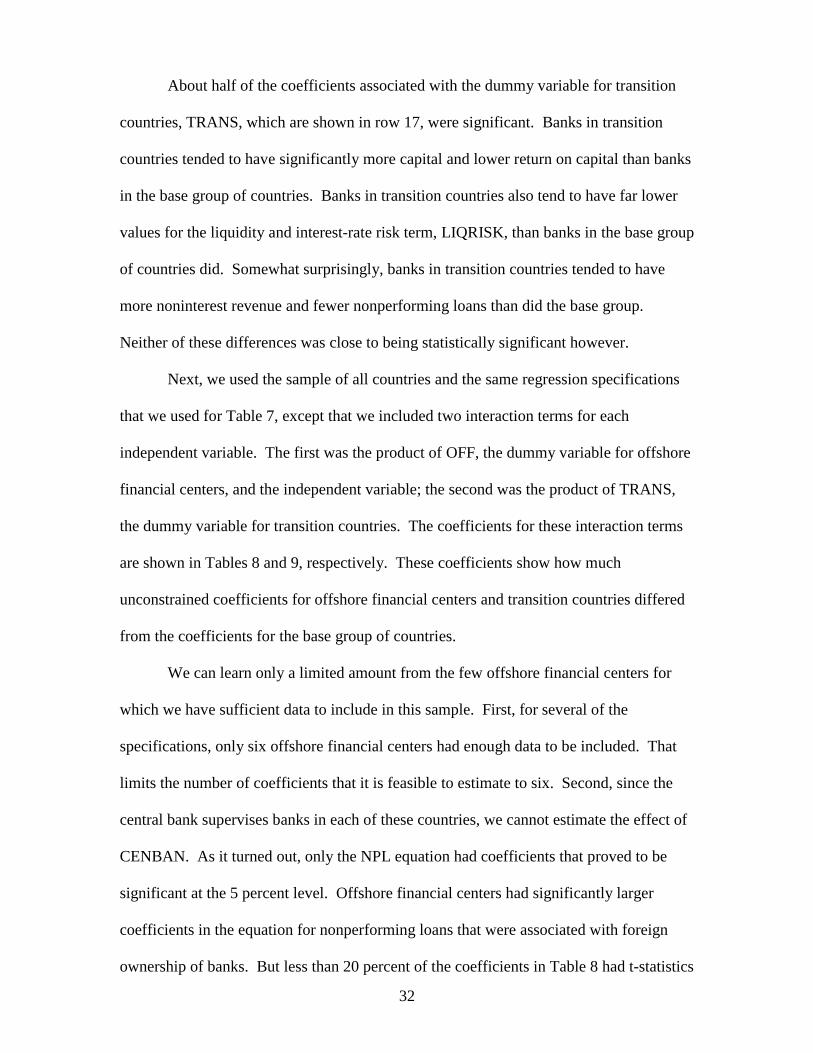
About half of the coefficients associated with the dummy variable for transition
countries, TRANS, which are shown in row 17, were significant. Banks in transition
countries tended to have significantly more capital and lower return on capital than banks
in the base group of countries. Banks in transition countries also tend to have far lower
values for the liquidity and interest-rate risk term, LIQRISK, than banks in the base group
of countries did. Somewhat surprisingly, banks in transition countries tended to have
more noninterest revenue and fewer nonperforming loans than did the base group.
Neither of these differences was close to being statistically significant however.
Next, we used the sample of all countries and the same regression specifications
that we used for Table 7, except that we included two interaction terms for each
independent variable. The first was the product of OFF, the dummy variable for offshore
financial centers, and the independent variable; the second was the product of TRANS,
the dummy variable for transition countries. The coefficients for these interaction terms
are shown in Tables 8 and 9, respectively. These coefficients show how much
unconstrained coefficients for offshore financial centers and transition countries differed
from the coefficients for the base group of countries.
We can learn only a limited amount from the few offshore financial centers for
which we have sufficient data to include in this sample. First, for several of the
specifications, only six offshore financial centers had enough data to be included. That
limits the number of coefficients that it is feasible to estimate to six. Second, since the
central bank supervises banks in each of these countries, we cannot estimate the effect of
CENBAN. As it turned out, only the NPL equation had coefficients that proved to be
significant at the 5 percent level. Offshore financial centers had significantly larger
coefficients in the equation for nonperforming loans that were associated with foreign
ownership of banks. But less than 20 percent of the coefficients in Table 8 had t-statistics
33
in absolute value as large as one. Thus, either offshore financial centers as a group had
banking safety and soundness relations that were indeed very similar to those in the base
group of countries or the data and our tests were not powerful enough to detect the
differences.
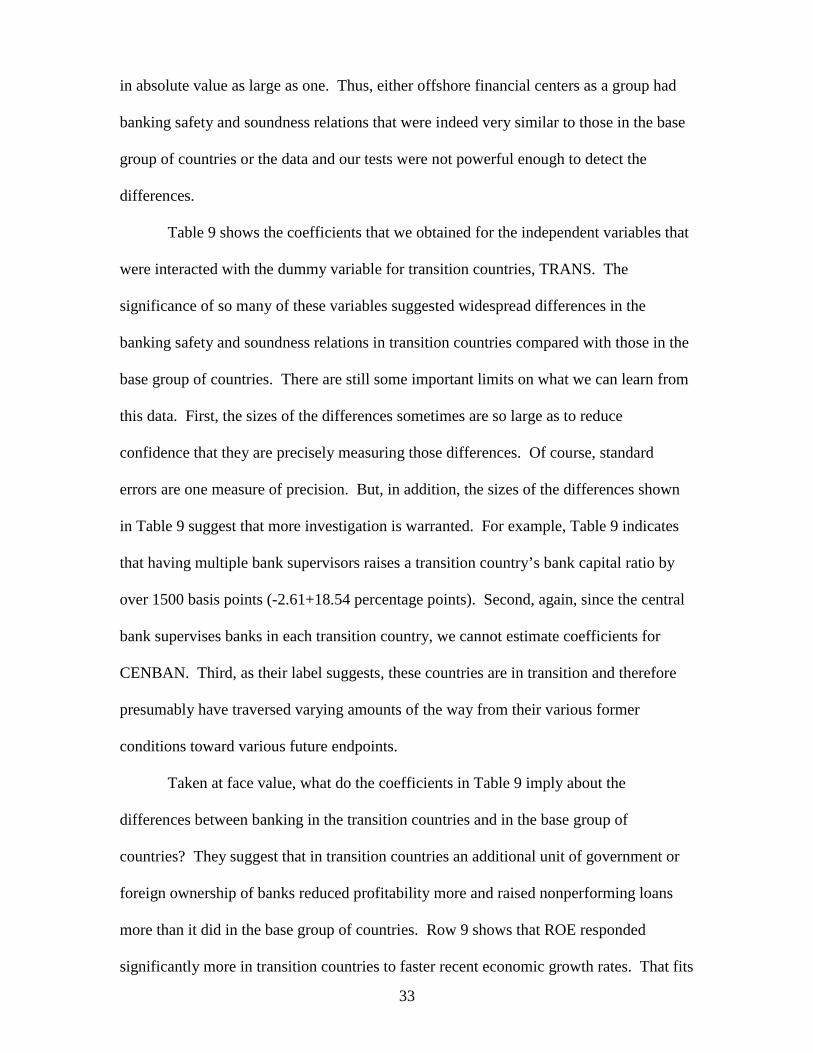
Table 9 shows the coefficients that we obtained for the independent variables that
were interacted with the dummy variable for transition countries, TRANS. The
significance of so many of these variables suggested widespread differences in the
banking safety and soundness relations in transition countries compared with those in the
base group of countries. There are still some important limits on what we can learn from
this data. First, the sizes of the differences sometimes are so large as to reduce
confidence that they are precisely measuring those differences. Of course, standard
errors are one measure of precision. But, in addition, the sizes of the differences shown
in Table 9 suggest that more investigation is warranted. For example, Table 9 indicates
that having multiple bank supervisors raises a transition country’s bank capital ratio by
over 1500 basis points (-2.61+18.54 percentage points). Second, again, since the central
bank supervises banks in each transition country, we cannot estimate coefficients for
CENBAN. Third, as their label suggests, these countries are in transition and therefore
presumably have traversed varying amounts of the way from their various former
conditions toward various future endpoints.
Taken at face value, what do the coefficients in Table 9 imply about the
differences between banking in the transition countries and in the base group of
countries? They suggest that in transition countries an additional unit of government or
foreign ownership of banks reduced profitability more and raised nonperforming loans
more than it did in the base group of countries. Row 9 shows that ROE responded
significantly more in transition countries to faster recent economic growth rates. That fits
34
with the larger declines in capital ratios and in nonperforming loans in transition
countries when growth accelerates.
Taken together, the bevy of significant coefficients in Table 9, supplemented by
some F-test results, suggest that the relations of safety and soundness to these
independent variables differed in transition countries from the relations in the base group
of countries. The relatively small number of offshore financial centers for which we have
sufficient data to perform regression analysis, the size and significance of the differences
for transition countries reported in Table 9, and the conceptual reasons for separating
these two groups from the base group of countries led us to rely most heavily on the
information implied by the base group of countries.
VI. Summary
This study focuses on the effects of the structure of supervision on the banking
industry. We estimated the effects on banking safety and soundness of two specific
aspects of the structure of supervision: 1) whether there were multiple supervisory
authorities and 2) whether the central bank supervises banks. We used data for over 50
countries and for over a dozen measures of banking market and supervisory structure, of
macroeconomic conditions, and regulations to estimate the impact of these two aspects of
banking supervision on banking system safety and soundness. We found that central
bank supervision of banks was associated with more nonperforming loans but less
liquidity risk. Having multiple bank supervisory authorities was consistent with
“competition in laxity,” in that bank capital ratios tended to be lower but liquidity risk
tended to be higher in countries that used multiple bank supervisory authorities. At the
same time, supervisory structure appears to have had little impact on profitability.

35
References
Abrams, R K. and M. W. Taylor (2001). “Assessing the Case for Unified Sector Supervision,” paper presented at the 2001 Risk Management and Insurance International Conference.
Abrams, R. K. and M. W. Taylor (2000). “Issues in the Unification of Financial Sector
Supervision,” IMF Working Paper, no.213. Barth, J. R., G. Caprio Jr., and R. Levine. (2001a). “Banking Systems Around the Globe:
Do Regulations and Ownership Affect Performance and Stability?” in Frederic S. Mishkin, Editor: Prudential Supervision: What Works and What Doesn’t, University of Chicago Press, 2001.
Barth, J. R., G. Caprio Jr., and R. Levine (2001b). “The Regulation and Supervision of
Bank Around the World: A New Database,” in Robert E. Litan and Richard Herring, Editors, Integrating Emerging Market Countries into the Global Financial System, Brookings-Wharton Papers on Financial Services, Brookings Institution Press.
Barth, J. R., G. Caprio Jr., and R. Levine (2001c). “Bank Regulation and Supervision:
What Matters Most,” World Bank Policy Research Working Paper, March. Barth, J. R., L. G. Dopico, D.E. Nolle, and J.W. Wilcox (2001a). “An International
Comparison of the Structure of Bank Supervision,” paper presented at The Future of Financial Regulation in Taiwan, Taipei (July 6).
Barth, J. R., L. G. Dopico, D.E. Nolle, and J.W. Wilcox (2001b). “Foreign Banking,
Market Liberalization, and Profit Opportunities,” draft paper, [email protected].
Barth, J. R., D. E. Nolle, and T. N. Rice (2000). “Commercial Banking Structure,
Regulation and Performance: An International Comparison,” Modernizing Financial Systems, edited by Dimitri B. Papadimitriou, Macmillian Press and St. Martin’s Press.
Basel Committee on Banking Supervision (2001). “The Relationship Between Banking
Supervisors and Banks’ External Auditors,” Consultative Paper issued by the Basel Committee on Banking Supervision and the International Federation of Accountants (February).
Beck, T., A. Demirgüç-Kunt, and R. Levine (2001). “A New DataBase on Financial
Development and Structure,” World Bank Economic Review, 14(3), 597-605. Briault, C. (1999). “The Rationale for a Single National Financial Services Regulator,”
Financial Services Authority Occasional Paper, series 2. Choi, S. J. and A. T. Guzman (1998). “Portable Reciprocity: Rethinking the International
Reach of Securities Regulation,” California Law Review, vol. 81.
36
Courtis, Neil (ed.) (1999). How Countries Supervise Their Banks, Insurers and
Securities Markets, London: Central Banking Publications. Demirgüç-Kunt, A. and E. Detragiache, 2000. “Does Deposit Insurance Increase Banking
System Stability? An Empirical Investigation,” The World Bank, draft paper, http://www.worldbank.org/research/interest/confs/upcoming/deposit_insurance/home.htm
Demirgüç-Kunt, A. and T. Sobaci, (2000). “Deposit Insurance Around the World: A
Data Base,” The World Bank, draft paper, http://www.worldbank.org/research/interest/confs/upcoming/deposit_insurance/data.htm.
Demirgüç-Kunt, A. and H. Huizinga (2000). “Market Discipline and Financial Safety Net
Design,” The World Bank, Policy Research Paper No. 2183, Revised. Di Noia, C. and G. Di Giorgio (1999). “Should Banking Supervision and Monetary
Policy Tasks be Given to Different Agencies?” International Finance 2:3, 361-378.
Erricco, L. and A. Musalem (1999). “Offshore Banking: An Analysis of Micro- and
Macro-Prudential Issues,” IMF Working Paper, Monetary and Exchange Affairs Department (January).
Estrella, A. (2001). “Comments on ‘A Regulatory Regime for Financial Stability,” David
T. Llewellyn, paper presented at the 29th Economics Conference, Oesterreichische Nationalbank., Vienna (May 31).
Furst, K., W.W. Lang, and D.E. Nolle (2001). “Internet Banking in the U.S.: Landscape,
Prospects, and Industry Implications,” Journal of Financial Transformation 2 (July): 45-52.
Giddy, I.H. (1994). “Who Should Be the Banking Supervisors,” Paper presented at the
Seminar on Current Legal Issues Affecting Central Banks, IMF (May 10). Goodhart, C. and D. Schoenmaker (1993). “Institutional Separation Between Supervisory
and Monetary Agencies,” Special Paper No. 52, London School of Economics Financial Markets Group (April).
Goodhart, C.A.E. (1995). "Some Regulatory concerns," London School of Economics
Financial Markets Group, Special Paper, no. 79 (December). Goodhart, C. and D. Schoenmaker (1995). “Should the Functions of Monetary Policy and
Banking Supervision Be Separated?” Oxford Economic Papers 47, 539-560. Group of Ten (2001). Report on Consolidation in the Financial Sector (January).
www.bis.org.
37
Haubrich (1996). “Combining Bank Supervision and Monetary Policy,” Economic Commentary, Federal Reserve Bank of Cleveland (November).
Jordan, J.L. (2001). “Effective Supervision and the Evolving Financial Services
Industry,” Economic Commentary, Federal Reserve Bank of Cleveland (June). Kahn, Charles M. and Joao A. C. Santos (2001). “Allocating Bank Regulatory Powers:
Lender of Last Resort, Deposit Insurance and Supervision,” draft paper (June). Kane, E. J. (1984). “Regulatory Structure in Futures Markets: Jurisdictional Competition
between the SEC, the CFTC, and Other Agencies, Journal of Futures Markets, vol. 4.
Kane, E.J. (1996). “De Jure Interstate Banking: Why Only Now?” Journal of Money,
Credit, and Banking, vol. 28. Kane, E.J. (2000). “Designing Financial Safety Nets to Fit Country Circumstances,” The
World Bank, draft paper. Kupiec, P. H. and A. P. White, (1996). “Regulatory Competition and the Efficiency of
Alternative Derivative Product Margining Systems,” Finance and Economics Discussion Series, Board of Governors of the Federal Reserve System, no. 96-11 (June).
Lindgren, C. J., G. Garcia, and M. Saal (1996). Bank Soundness and Macroeconomic Policy, Washington, DC: International Monetary Fund.
Llewellyn, D.T. (1999). “Introduction: the Institutional Structure of Regulatory
Agencies,” in N. Courtis (ed.), How Countries Supervise Their Banks, Insurers, and Securities Markets, London: Central Bank Publications, xi-xix.
Llewellyn, D. T. (2001). “A Regulatory Regime for Financial Stability,” paper presented
at the 29th Economics Conference, Oesterreichische Nationalbank., Vienna (May 31).
Peek, J., R.S. Rosengren and G.M.B. Tootell (1999). “Is Bank Supervision Central to
Central Banking,” Federal Reserve Bank of Boston, Working Paper no. 99-7. Romano, R (1985). “Law as a Product: Some Pieces of the Incorporation Puzzle, Journal
of Law, Economics and Organization, vol. 1. Romano, R. (1997). “The Political Dynamics of Derivative Securities Regulation, Yale
Journal of Regulation, vol. 14. Romano, R. (2001). “The Need for Competition in International Securities Regulation,
Yale International Center for Finance (June). Sinclair, P. J. N. (2000). “Central Banks and Financial Stability,” Bank of England, Bank
of England Quarterly Bulletin (November).
38
Spong, K. (2001). Banking Regulation: Its Purposes, Implementation, and Effects (5th
edition), Federal Reserve Bank of Kansas City. Taylor, M. (1995). “Twin Peaks: A Regulatory Structure for the New Century,” Centre
for the Study of Financial Innovation, London (December). Taylor, M. and A. Fleming (1999). “Integrated Financial Supervision: Lessons from
Northern European Experience,” World Bank, Policy Research Working Paper, no. 2223 (November).
Wall, L.D. and R.A. Eisenbeis (2000). “Financial Regulatory Structure and the
Resolution of Conflicting Goals,” Journal of Financial Services Research 17:1, 223-245.
Williams, J. L. and J. F. E. Gillespie (2001). “Technology and ‘Deconstruction’ of the
Banking Business,” Electronic Banking Law and Commerce Report, vol. 6, no. 3 (July/August).
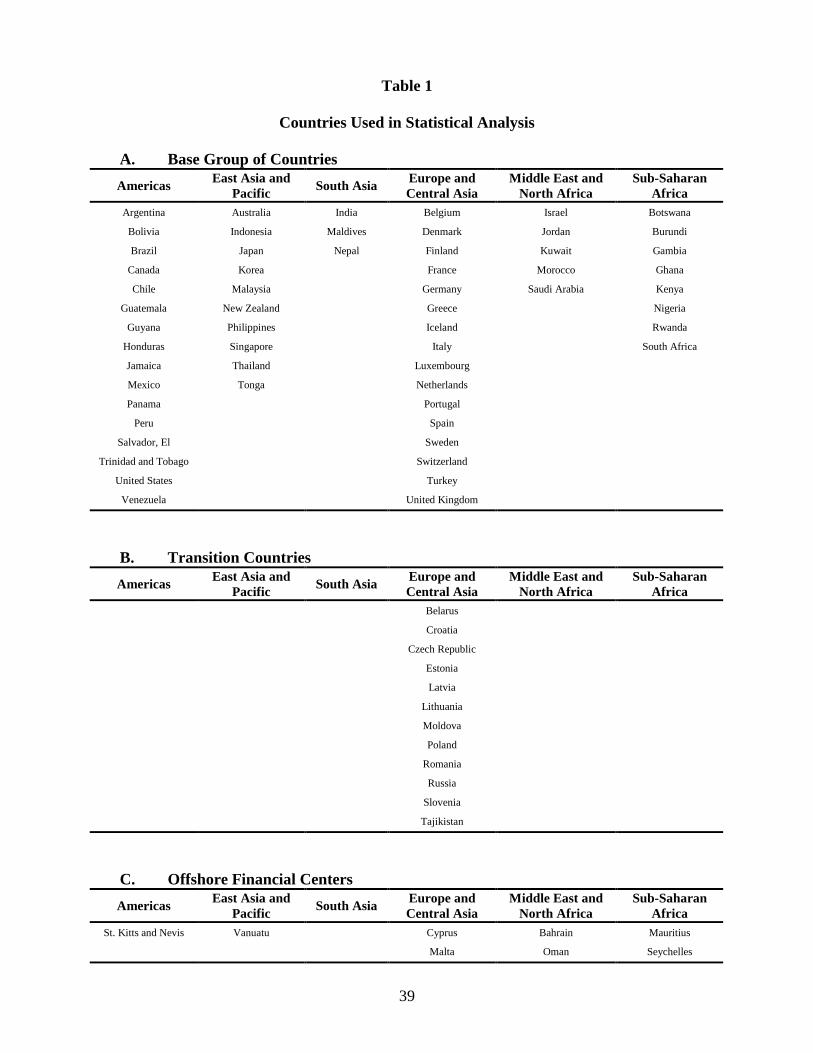
39
Table 1
Countries Used in Statistical Analysis
A. Base Group of Countries Americas East Asia and
Pacific South Asia Europe and Central Asia
Middle East and North Africa
Sub-Saharan Africa
Argentina Australia India Belgium Israel Botswana
Bolivia Indonesia Maldives Denmark Jordan Burundi
Brazil Japan Nepal Finland Kuwait Gambia
Canada Korea France Morocco Ghana
Chile Malaysia Germany Saudi Arabia Kenya
Guatemala New Zealand Greece Nigeria
Guyana Philippines Iceland Rwanda
Honduras Singapore Italy South Africa
Jamaica Thailand Luxembourg Mexico Tonga Netherlands Panama Portugal
Peru Spain Salvador, El Sweden
Trinidad and Tobago Switzerland United States Turkey
Venezuela United Kingdom
B. Transition Countries Americas East Asia and
Pacific South Asia Europe and Central Asia
Middle East and North Africa
Sub-Saharan Africa
Belarus
Croatia
Czech Republic
Estonia
Latvia
Lithuania
Moldova
Poland
Romania Russia Slovenia Tajikistan
C. Offshore Financial Centers Americas East Asia and
Pacific South Asia Europe and Central Asia
Middle East and North Africa
Sub-Saharan Africa
St. Kitts and Nevis Vanuatu Cyprus Bahrain Mauritius
Malta Oman Seychelles

40
Table 2 Bank Supervisory Authorities and Central Banks as Bank Supervisors
Bank Supervisory Authorities and Central Banks as Bank Supervisors
Yes No
Bahrain India Mauritius Seychelles Belgium Finland Luxembourg Sweden
Botswana Indonesia Moldova Portugal Bolivia France Mexico Switzerland
Brazil Israel Morocco Saudi Arabia Canada Honduras Panama United Kingdom
Burundi Italy Nepal Singapore Chile Iceland Peru Venezuela
Croatia Jamaica Netherlands Slovenia Denmark Japan Salvador, El
Cyprus Jordan New Zealand South Africa
Estonia Kenya Nigeria Spain
Gambia Kuwait Oman St. Kitts and Nevis
Ghana Lithuania Philippines Tajikistan
Greece Malaysia Romania Tonga
Guatemala Maldives Russia Trinidad and Tobago
Single
Guyana Malta
Argentina Germany Rwanda United States Australia Korea
Belarus Latvia Thailand Vanuatu
All Countries
(78)
Multiple Czech Republic Poland Turkey
Botswana India Malaysia Portugal Belgium Finland Luxembourg Sweden
Brazil Indonesia Maldives Saudi Arabia Bolivia France Mexico Switzerland
Burundi Israel Morocco Singapore Canada Honduras Panama United Kingdom
Gambia Italy Nepal South Africa Chile Iceland Peru Venezuela
Ghana Jamaica Netherlands Spain Denmark Japan Salvador, El
Greece Jordan New Zealand Tonga
Guatemala Kenya Nigeria Trinidad and Tobago
Single
Guyana Kuwait Philippines
Argentina Rwanda Turkey Australia Korea
Base Countries
(58)
Multiple Germany Thailand United States
Croatia Lithuania Romania Slovenia Single
Estonia Moldova Russia Tajikistan Transition Countries
(12) Multiple Belarus Czech
Republic Latvia Poland
Bahrain Malta Oman St. Kitts and Nevis Single
Cyprus Mauritius Seychelles Offshore Financial
Centers (8) Multiple Vanuatu
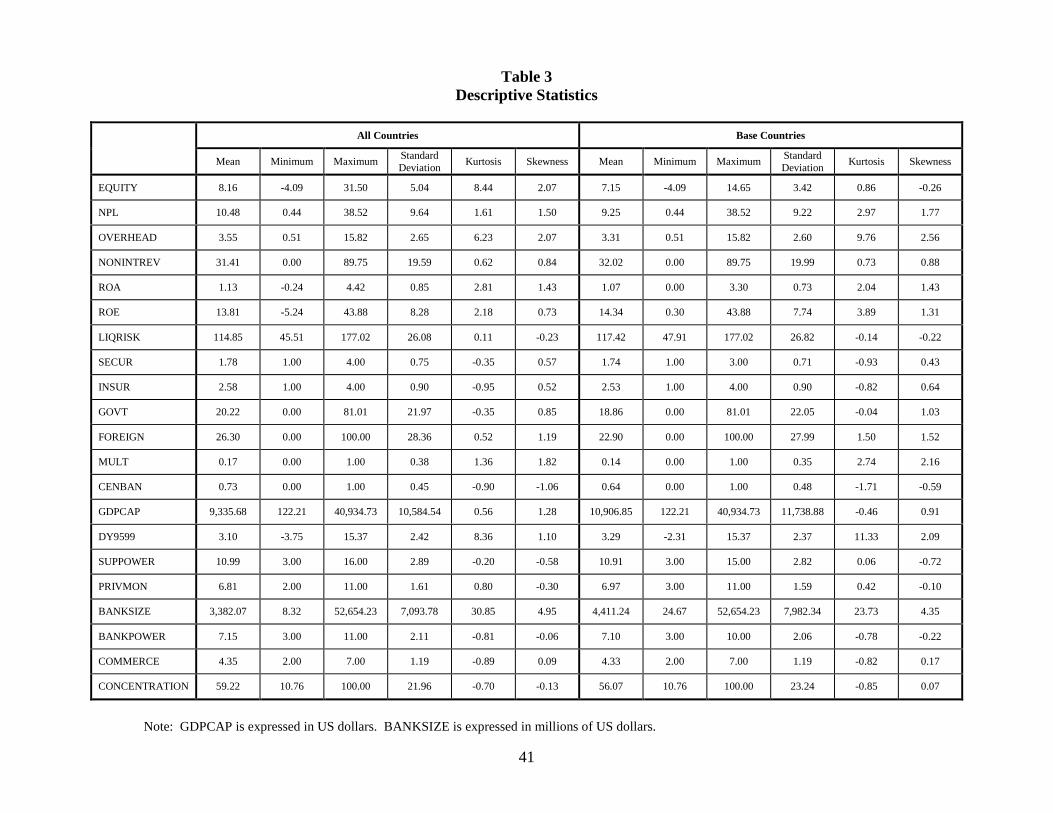
41
Table 3 Descriptive Statistics
Note: GDPCAP is expressed in US dollars. BANKSIZE is expressed in millions of US dollars.
All Countries Base Countries
Mean Minimum Maximum Standard Deviation Kurtosis Skewness Mean Minimum Maximum Standard
Deviation Kurtosis Skewness
EQUITY 8.16 -4.09 31.50 5.04 8.44 2.07 7.15 -4.09 14.65 3.42 0.86 -0.26
NPL 10.48 0.44 38.52 9.64 1.61 1.50 9.25 0.44 38.52 9.22 2.97 1.77
OVERHEAD 3.55 0.51 15.82 2.65 6.23 2.07 3.31 0.51 15.82 2.60 9.76 2.56
NONINTREV 31.41 0.00 89.75 19.59 0.62 0.84 32.02 0.00 89.75 19.99 0.73 0.88
ROA 1.13 -0.24 4.42 0.85 2.81 1.43 1.07 0.00 3.30 0.73 2.04 1.43
ROE 13.81 -5.24 43.88 8.28 2.18 0.73 14.34 0.30 43.88 7.74 3.89 1.31
LIQRISK 114.85 45.51 177.02 26.08 0.11 -0.23 117.42 47.91 177.02 26.82 -0.14 -0.22
SECUR 1.78 1.00 4.00 0.75 -0.35 0.57 1.74 1.00 3.00 0.71 -0.93 0.43
INSUR 2.58 1.00 4.00 0.90 -0.95 0.52 2.53 1.00 4.00 0.90 -0.82 0.64
GOVT 20.22 0.00 81.01 21.97 -0.35 0.85 18.86 0.00 81.01 22.05 -0.04 1.03
FOREIGN 26.30 0.00 100.00 28.36 0.52 1.19 22.90 0.00 100.00 27.99 1.50 1.52
MULT 0.17 0.00 1.00 0.38 1.36 1.82 0.14 0.00 1.00 0.35 2.74 2.16
CENBAN 0.73 0.00 1.00 0.45 -0.90 -1.06 0.64 0.00 1.00 0.48 -1.71 -0.59
GDPCAP 9,335.68 122.21 40,934.73 10,584.54 0.56 1.28 10,906.85 122.21 40,934.73 11,738.88 -0.46 0.91
DY9599 3.10 -3.75 15.37 2.42 8.36 1.10 3.29 -2.31 15.37 2.37 11.33 2.09
SUPPOWER 10.99 3.00 16.00 2.89 -0.20 -0.58 10.91 3.00 15.00 2.82 0.06 -0.72
PRIVMON 6.81 2.00 11.00 1.61 0.80 -0.30 6.97 3.00 11.00 1.59 0.42 -0.10
BANKSIZE 3,382.07 8.32 52,654.23 7,093.78 30.85 4.95 4,411.24 24.67 52,654.23 7,982.34 23.73 4.35
BANKPOWER 7.15 3.00 11.00 2.11 -0.81 -0.06 7.10 3.00 10.00 2.06 -0.78 -0.22
COMMERCE 4.35 2.00 7.00 1.19 -0.89 0.09 4.33 2.00 7.00 1.19 -0.82 0.17
CONCENTRATION 59.22 10.76 100.00 21.96 -0.70 -0.13 56.07 10.76 100.00 23.24 -0.85 0.07
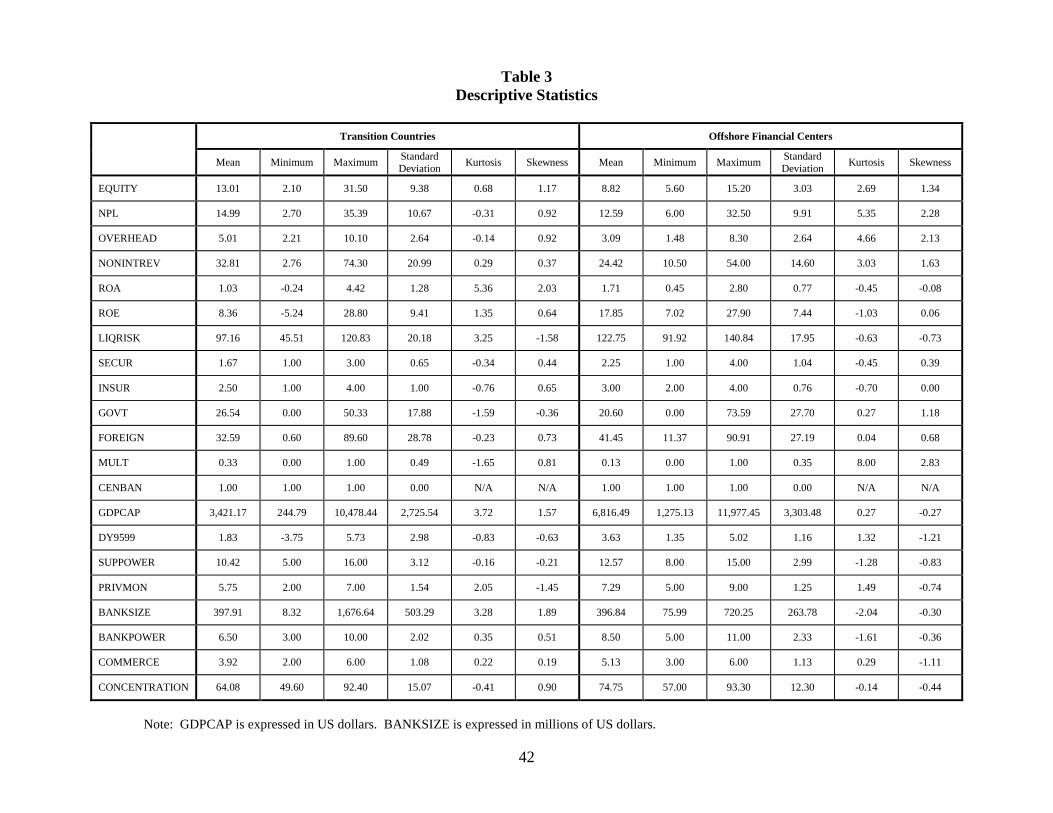
42
Table 3 Descriptive Statistics
Transition Countries Offshore Financial Centers
Mean Minimum Maximum Standard
Deviation Kurtosis Skewness Mean Minimum Maximum Standard Deviation Kurtosis Skewness
EQUITY 13.01 2.10 31.50 9.38 0.68 1.17 8.82 5.60 15.20 3.03 2.69 1.34
NPL 14.99 2.70 35.39 10.67 -0.31 0.92 12.59 6.00 32.50 9.91 5.35 2.28
OVERHEAD 5.01 2.21 10.10 2.64 -0.14 0.92 3.09 1.48 8.30 2.64 4.66 2.13
NONINTREV 32.81 2.76 74.30 20.99 0.29 0.37 24.42 10.50 54.00 14.60 3.03 1.63
ROA 1.03 -0.24 4.42 1.28 5.36 2.03 1.71 0.45 2.80 0.77 -0.45 -0.08
ROE 8.36 -5.24 28.80 9.41 1.35 0.64 17.85 7.02 27.90 7.44 -1.03 0.06
LIQRISK 97.16 45.51 120.83 20.18 3.25 -1.58 122.75 91.92 140.84 17.95 -0.63 -0.73
SECUR 1.67 1.00 3.00 0.65 -0.34 0.44 2.25 1.00 4.00 1.04 -0.45 0.39
INSUR 2.50 1.00 4.00 1.00 -0.76 0.65 3.00 2.00 4.00 0.76 -0.70 0.00
GOVT 26.54 0.00 50.33 17.88 -1.59 -0.36 20.60 0.00 73.59 27.70 0.27 1.18
FOREIGN 32.59 0.60 89.60 28.78 -0.23 0.73 41.45 11.37 90.91 27.19 0.04 0.68
MULT 0.33 0.00 1.00 0.49 -1.65 0.81 0.13 0.00 1.00 0.35 8.00 2.83
CENBAN 1.00 1.00 1.00 0.00 N/A N/A 1.00 1.00 1.00 0.00 N/A N/A
GDPCAP 3,421.17 244.79 10,478.44 2,725.54 3.72 1.57 6,816.49 1,275.13 11,977.45 3,303.48 0.27 -0.27
DY9599 1.83 -3.75 5.73 2.98 -0.83 -0.63 3.63 1.35 5.02 1.16 1.32 -1.21
SUPPOWER 10.42 5.00 16.00 3.12 -0.16 -0.21 12.57 8.00 15.00 2.99 -1.28 -0.83
PRIVMON 5.75 2.00 7.00 1.54 2.05 -1.45 7.29 5.00 9.00 1.25 1.49 -0.74
BANKSIZE 397.91 8.32 1,676.64 503.29 3.28 1.89 396.84 75.99 720.25 263.78 -2.04 -0.30
BANKPOWER 6.50 3.00 10.00 2.02 0.35 0.51 8.50 5.00 11.00 2.33 -1.61 -0.36
COMMERCE 3.92 2.00 6.00 1.08 0.22 0.19 5.13 3.00 6.00 1.13 0.29 -1.11
CONCENTRATION 64.08 49.60 92.40 15.07 -0.41 0.90 74.75 57.00 93.30 12.30 -0.14 -0.44
Note: GDPCAP is expressed in US dollars. BANKSIZE is expressed in millions of US dollars.

43
Table 4
Simple Correlations Between Measures of Components of Banking Safety and Soundness
EQUITY NPL OVERHEAD NONINTREV ROA ROE LIQRISK
All Countries (78)
EQUITY 1.00
NPL -0.05 1.00
OVERHEAD 0.57 0.25 1.00
NONINTREV -0.23 0.01 0.02 1.00
ROA 0.52 0.10 0.27 -0.24 1.00
ROE 0.14 -0.15 -0.05 -0.06 0.70 1.00
LIQRISK -0.20 -0.01 -0.10 -0.14 -0.03 0.10 1.00
Base Countries (58)
EQUITY 1.00
NPL -0.11 1.00
OVERHEAD 0.47 0.29 1.00
NONINTREV -0.32 0.00 -0.01 1.00
ROA 0.58 0.06 0.18 -0.32 1.00
ROE 0.10 -0.12 -0.10 -0.03 0.73 1.00
LIQRISK -0.07 0.07 0.02 -0.11 -0.11 0.10 1.00
Transition Countries (12)
EQUITY 1.00
NPL -0.21 1.00
OVERHEAD 0.86 0.07 1.00
NONINTREV -0.03 0.18 0.16 1.00
ROA 0.74 -0.06 0.80 0.01 1.00
ROE 0.73 -0.47 0.64 -0.18 0.62 1.00
LIQRISK -0.47 -0.20 -0.40 -0.19 -0.04 -0.44 1.00
Offshore Financial Centers (8)
EQUITY 1.00
NPL -0.26 1.00
OVERHEAD 0.89 -0.12 1.00
NONINTREV -0.42 -0.41 -0.23 1.00
ROA -0.22 0.80 -0.23 -0.31 1.00
ROE -0.49 0.81 -0.47 0.03 0.91 1.00
LIQRISK 0.63 0.36 0.48 -0.50 0.23 -0.02 1.00
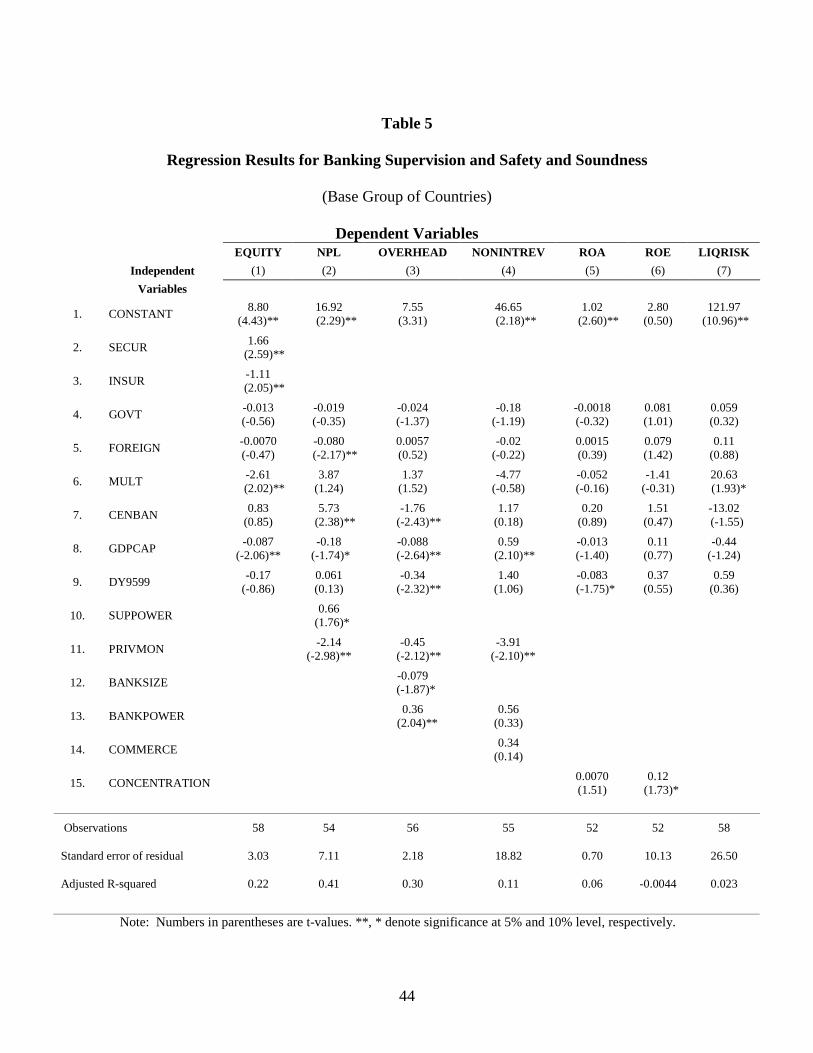
44
Table 5
Regression Results for Banking Supervision and Safety and Soundness
(Base Group of Countries)
Dependent Variables
EQUITY NPL OVERHEAD NONINTREV ROA ROE LIQRISK Independent (1) (2) (3) (4) (5) (6) (7) Variables
1. CONSTANT 8.80 (4.43)**
16.92 (2.29)**
7.55 (3.31)
46.65 (2.18)**
1.02 (2.60)**
2.80 (0.50)
121.97 (10.96)**
2. SECUR 1.66 (2.59)**
3. INSUR -1.11 (2.05)**
4. GOVT -0.013 (-0.56)
-0.019 (-0.35)
-0.024 (-1.37)
-0.18 (-1.19)
-0.0018 (-0.32)
0.081 (1.01)
0.059 (0.32)
5. FOREIGN -0.0070 (-0.47)
-0.080 (-2.17)**
0.0057 (0.52)
-0.02 (-0.22)
0.0015 (0.39)
0.079 (1.42)
0.11 (0.88)
6. MULT -2.61 (2.02)**
3.87 (1.24)
1.37 (1.52)
-4.77 (-0.58)
-0.052 (-0.16)
-1.41 (-0.31)
20.63 (1.93)*
7. CENBAN 0.83 (0.85)
5.73 (2.38)**
-1.76 (-2.43)**
1.17 (0.18)
0.20 (0.89)
1.51 (0.47)
-13.02 (-1.55)
8. GDPCAP -0.087 (-2.06)**
-0.18 (-1.74)*
-0.088 (-2.64)**
0.59 (2.10)**
-0.013 (-1.40)
0.11 (0.77)
-0.44 (-1.24)
9. DY9599 -0.17 (-0.86)
0.061 (0.13)
-0.34 (-2.32)**
1.40 (1.06)
-0.083 (-1.75)*
0.37 (0.55)
0.59 (0.36)
10. SUPPOWER 0.66 (1.76)*
11. PRIVMON -2.14 (-2.98)**
-0.45 (-2.12)**
-3.91 (-2.10)**
12. BANKSIZE -0.079 (-1.87)*
13. BANKPOWER 0.36 (2.04)**
0.56 (0.33)
14. COMMERCE 0.34 (0.14)
15. CONCENTRATION 0.0070 (1.51)
0.12 (1.73)*
Observations 58 54 56 55 52 52 58
Standard error of residual 3.03 7.11 2.18 18.82 0.70 10.13 26.50
Adjusted R-squared 0.22 0.41 0.30 0.11 0.06 -0.0044 0.023
Note: Numbers in parentheses are t-values. **, * denote significance at 5% and 10% level, respectively.
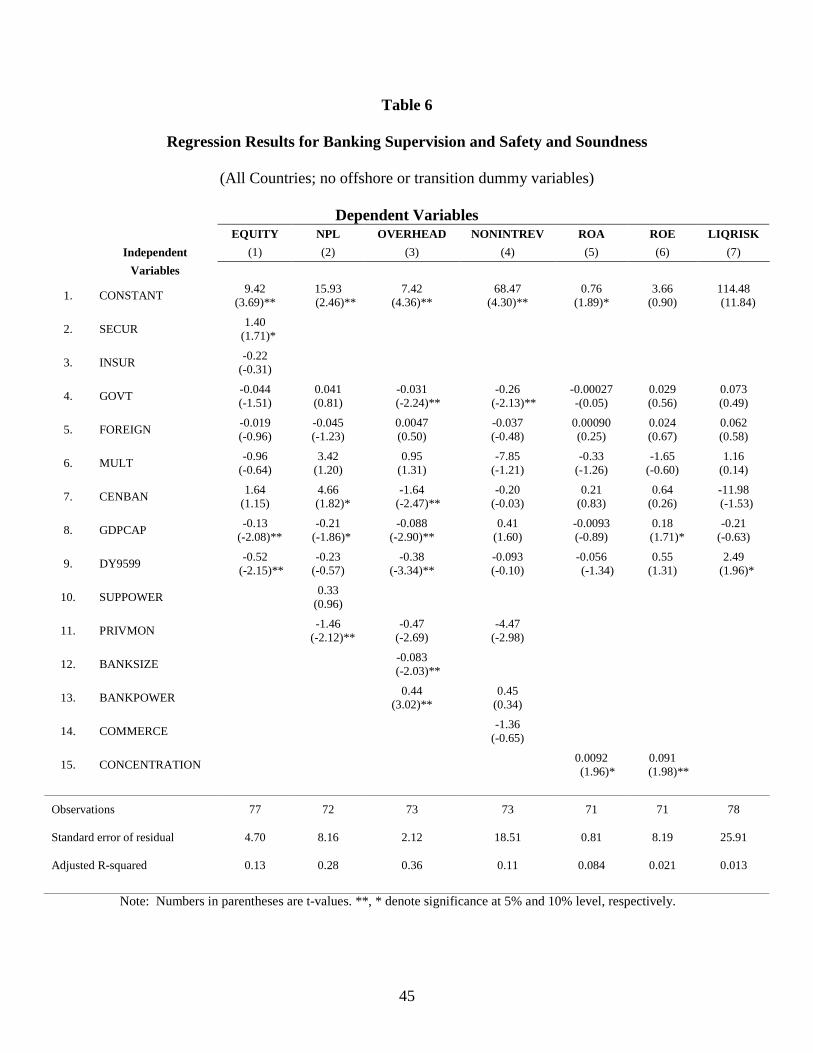
45
Table 6
Regression Results for Banking Supervision and Safety and Soundness
(All Countries; no offshore or transition dummy variables)
Dependent Variables EQUITY NPL OVERHEAD NONINTREV ROA ROE LIQRISK Independent (1) (2) (3) (4) (5) (6) (7) Variables
1. CONSTANT 9.42 (3.69)**
15.93 (2.46)**
7.42 (4.36)**
68.47 (4.30)**
0.76 (1.89)*
3.66 (0.90)
114.48 (11.84)
2. SECUR 1.40 (1.71)*
3. INSUR -0.22 (-0.31)
4. GOVT -0.044 (-1.51)
0.041 (0.81)
-0.031 (-2.24)**
-0.26 (-2.13)**
-0.00027 -(0.05)
0.029 (0.56)
0.073 (0.49)
5. FOREIGN -0.019 (-0.96)
-0.045 (-1.23)
0.0047 (0.50)
-0.037 (-0.48)
0.00090 (0.25)
0.024 (0.67)
0.062 (0.58)
6. MULT -0.96 (-0.64)
3.42 (1.20)
0.95 (1.31)
-7.85 (-1.21)
-0.33 (-1.26)
-1.65 (-0.60)
1.16 (0.14)
7. CENBAN 1.64 (1.15)
4.66 (1.82)*
-1.64 (-2.47)**
-0.20 (-0.03)
0.21 (0.83)
0.64 (0.26)
-11.98 (-1.53)
8. GDPCAP -0.13 (-2.08)**
-0.21 (-1.86)*
-0.088 (-2.90)**
0.41 (1.60)
-0.0093 (-0.89)
0.18 (1.71)*
-0.21 (-0.63)
9. DY9599 -0.52 (-2.15)**
-0.23 (-0.57)
-0.38 (-3.34)**
-0.093 (-0.10)
-0.056 (-1.34)
0.55 (1.31)
2.49 (1.96)*
10. SUPPOWER 0.33 (0.96)
11. PRIVMON -1.46 (-2.12)**
-0.47 (-2.69)
-4.47 (-2.98)
12. BANKSIZE -0.083 (-2.03)**
13. BANKPOWER 0.44 (3.02)**
0.45 (0.34)
14. COMMERCE -1.36 (-0.65)
15. CONCENTRATION 0.0092 (1.96)*
0.091 (1.98)**
Observations 77 72 73 73 71 71 78
Standard error of residual 4.70 8.16 2.12 18.51 0.81 8.19 25.91
Adjusted R-squared 0.13 0.28 0.36 0.11 0.084 0.021 0.013
Note: Numbers in parentheses are t-values. **, * denote significance at 5% and 10% level, respectively.
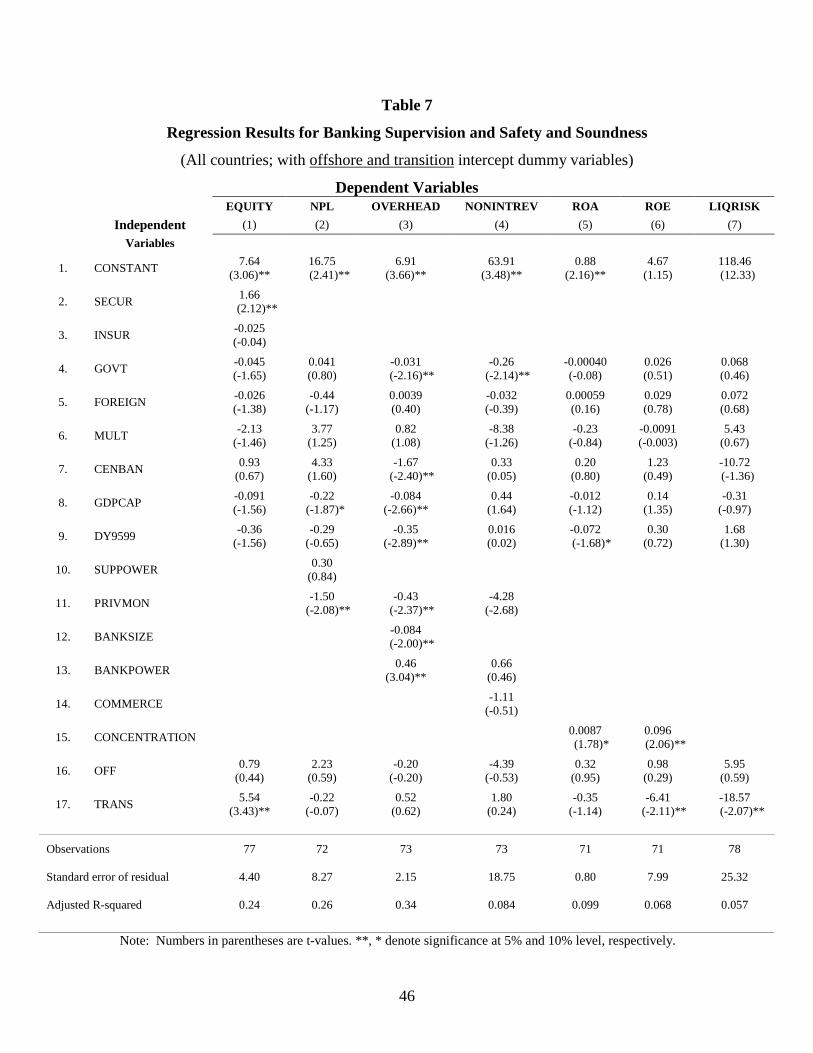
46
Table 7
Regression Results for Banking Supervision and Safety and Soundness
(All countries; with offshore and transition intercept dummy variables)
Dependent Variables EQUITY NPL OVERHEAD NONINTREV ROA ROE LIQRISK Independent (1) (2) (3) (4) (5) (6) (7) Variables
1. CONSTANT 7.64 (3.06)**
16.75 (2.41)**
6.91 (3.66)**
63.91 (3.48)**
0.88 (2.16)**
4.67 (1.15)
118.46 (12.33)
2. SECUR 1.66 (2.12)**
3. INSUR -0.025 (-0.04)
4. GOVT -0.045 (-1.65)
0.041 (0.80)
-0.031 (-2.16)**
-0.26 (-2.14)**
-0.00040 (-0.08)
0.026 (0.51)
0.068 (0.46)
5. FOREIGN -0.026 (-1.38)
-0.44 (-1.17)
0.0039 (0.40)
-0.032 (-0.39)
0.00059 (0.16)
0.029 (0.78)
0.072 (0.68)
6. MULT -2.13 (-1.46)
3.77 (1.25)
0.82 (1.08)
-8.38 (-1.26)
-0.23 (-0.84)
-0.0091 (-0.003)
5.43 (0.67)
7. CENBAN 0.93 (0.67)
4.33 (1.60)
-1.67 (-2.40)**
0.33 (0.05)
0.20 (0.80)
1.23 (0.49)
-10.72 (-1.36)
8. GDPCAP -0.091 (-1.56)
-0.22 (-1.87)*
-0.084 (-2.66)**
0.44 (1.64)
-0.012 (-1.12)
0.14 (1.35)
-0.31 (-0.97)
9. DY9599 -0.36 (-1.56)
-0.29 (-0.65)
-0.35 (-2.89)**
0.016 (0.02)
-0.072 (-1.68)*
0.30 (0.72)
1.68 (1.30)
10. SUPPOWER 0.30 (0.84)
11. PRIVMON -1.50 (-2.08)**
-0.43 (-2.37)**
-4.28 (-2.68)
12. BANKSIZE -0.084 (-2.00)**
13. BANKPOWER 0.46 (3.04)**
0.66 (0.46)
14. COMMERCE -1.11 (-0.51)
15. CONCENTRATION 0.0087 (1.78)*
0.096 (2.06)**
16. OFF 0.79 (0.44)
2.23 (0.59)
-0.20 (-0.20)
-4.39 (-0.53)
0.32 (0.95)
0.98 (0.29)
5.95 (0.59)
17. TRANS 5.54 (3.43)**
-0.22 (-0.07)
0.52 (0.62)
1.80 (0.24)
-0.35 (-1.14)
-6.41 (-2.11)**
-18.57 (-2.07)**
Observations 77 72 73 73 71 71 78
Standard error of residual 4.40 8.27 2.15 18.75 0.80 7.99 25.32
Adjusted R-squared 0.24 0.26 0.34 0.084 0.099 0.068 0.057
Note: Numbers in parentheses are t-values. **, * denote significance at 5% and 10% level, respectively.
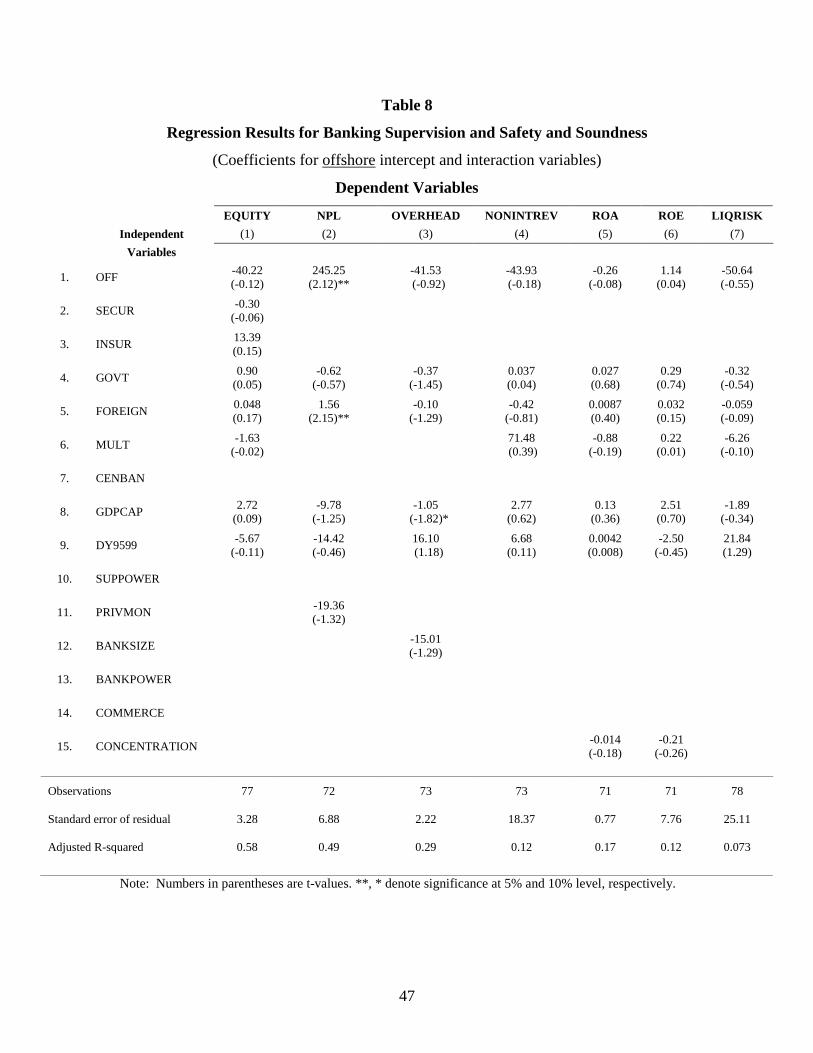
47
Table 8
Regression Results for Banking Supervision and Safety and Soundness
(Coefficients for offshore intercept and interaction variables)
Dependent Variables
EQUITY NPL OVERHEAD NONINTREV ROA ROE LIQRISK Independent (1) (2) (3) (4) (5) (6) (7) Variables
1. OFF -40.22 (-0.12)
245.25 (2.12)**
-41.53 (-0.92)
-43.93 (-0.18)
-0.26 (-0.08)
1.14 (0.04)
-50.64 (-0.55)
2. SECUR -0.30 (-0.06)
3. INSUR 13.39 (0.15)
4. GOVT 0.90 (0.05)
-0.62 (-0.57)
-0.37 (-1.45)
0.037 (0.04)
0.027 (0.68)
0.29 (0.74)
-0.32 (-0.54)
5. FOREIGN 0.048 (0.17)
1.56 (2.15)**
-0.10 (-1.29)
-0.42 (-0.81)
0.0087 (0.40)
0.032 (0.15)
-0.059 (-0.09)
6. MULT -1.63 (-0.02) 71.48
(0.39) -0.88
(-0.19) 0.22
(0.01) -6.26
(-0.10)
7. CENBAN
8. GDPCAP 2.72 (0.09)
-9.78 (-1.25)
-1.05 (-1.82)*
2.77 (0.62)
0.13 (0.36)
2.51 (0.70)
-1.89 (-0.34)
9. DY9599 -5.67 (-0.11)
-14.42 (-0.46)
16.10 (1.18)
6.68 (0.11)
0.0042 (0.008)
-2.50 (-0.45)
21.84 (1.29)
10. SUPPOWER
11. PRIVMON -19.36 (-1.32)
12. BANKSIZE -15.01 (-1.29)
13. BANKPOWER
14. COMMERCE
15. CONCENTRATION -0.014 (-0.18)
-0.21 (-0.26)
Observations 77 72 73 73 71 71 78
Standard error of residual 3.28 6.88 2.22 18.37 0.77 7.76 25.11
Adjusted R-squared 0.58 0.49 0.29 0.12 0.17 0.12 0.073
Note: Numbers in parentheses are t-values. **, * denote significance at 5% and 10% level, respectively.
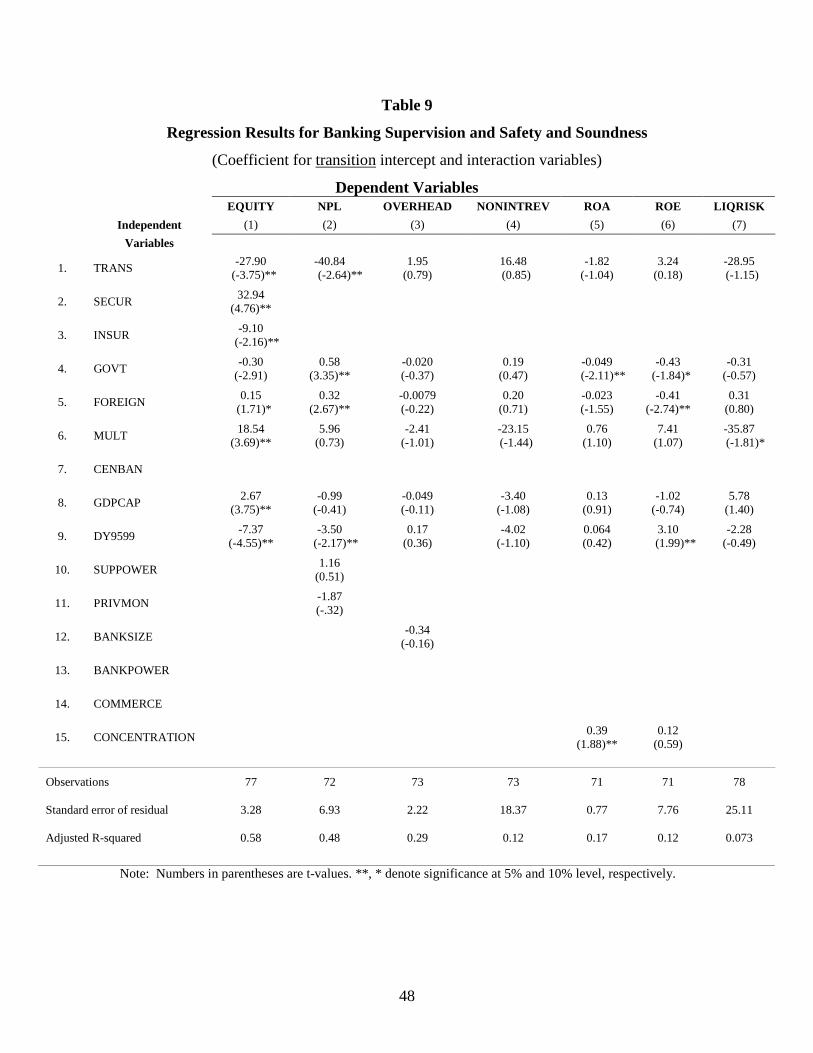
48
Table 9
Regression Results for Banking Supervision and Safety and Soundness
(Coefficient for transition intercept and interaction variables)
Dependent Variables EQUITY NPL OVERHEAD NONINTREV ROA ROE LIQRISK Independent (1) (2) (3) (4) (5) (6) (7) Variables
1. TRANS -27.90 (-3.75)**
-40.84 (-2.64)**
1.95 (0.79)
16.48 (0.85)
-1.82 (-1.04)
3.24 (0.18)
-28.95 (-1.15)
2. SECUR 32.94 (4.76)**
3. INSUR -9.10 (-2.16)**
4. GOVT -0.30 (-2.91)
0.58 (3.35)**
-0.020 (-0.37)
0.19 (0.47)
-0.049 (-2.11)**
-0.43 (-1.84)*
-0.31 (-0.57)
5. FOREIGN 0.15 (1.71)*
0.32 (2.67)**
-0.0079 (-0.22)
0.20 (0.71)
-0.023 (-1.55)
-0.41 (-2.74)**
0.31 (0.80)
6. MULT 18.54 (3.69)**
5.96 (0.73)
-2.41 (-1.01)
-23.15 (-1.44)
0.76 (1.10)
7.41 (1.07)
-35.87 (-1.81)*
7. CENBAN
8. GDPCAP 2.67 (3.75)**
-0.99 (-0.41)
-0.049 (-0.11)
-3.40 (-1.08)
0.13 (0.91)
-1.02 (-0.74)
5.78 (1.40)
9. DY9599 -7.37 (-4.55)**
-3.50 (-2.17)**
0.17 (0.36)
-4.02 (-1.10)
0.064 (0.42)
3.10 (1.99)**
-2.28 (-0.49)
10. SUPPOWER 1.16 (0.51)
11. PRIVMON -1.87 (-.32)
12. BANKSIZE -0.34 (-0.16)
13. BANKPOWER
14. COMMERCE
15. CONCENTRATION 0.39 (1.88)**
0.12 (0.59)
Observations 77 72 73 73 71 71 78
Standard error of residual 3.28 6.93 2.22 18.37 0.77 7.76 25.11
Adjusted R-squared 0.58 0.48 0.29 0.12 0.17 0.12 0.073
Note: Numbers in parentheses are t-values. **, * denote significance at 5% and 10% level, respectively.
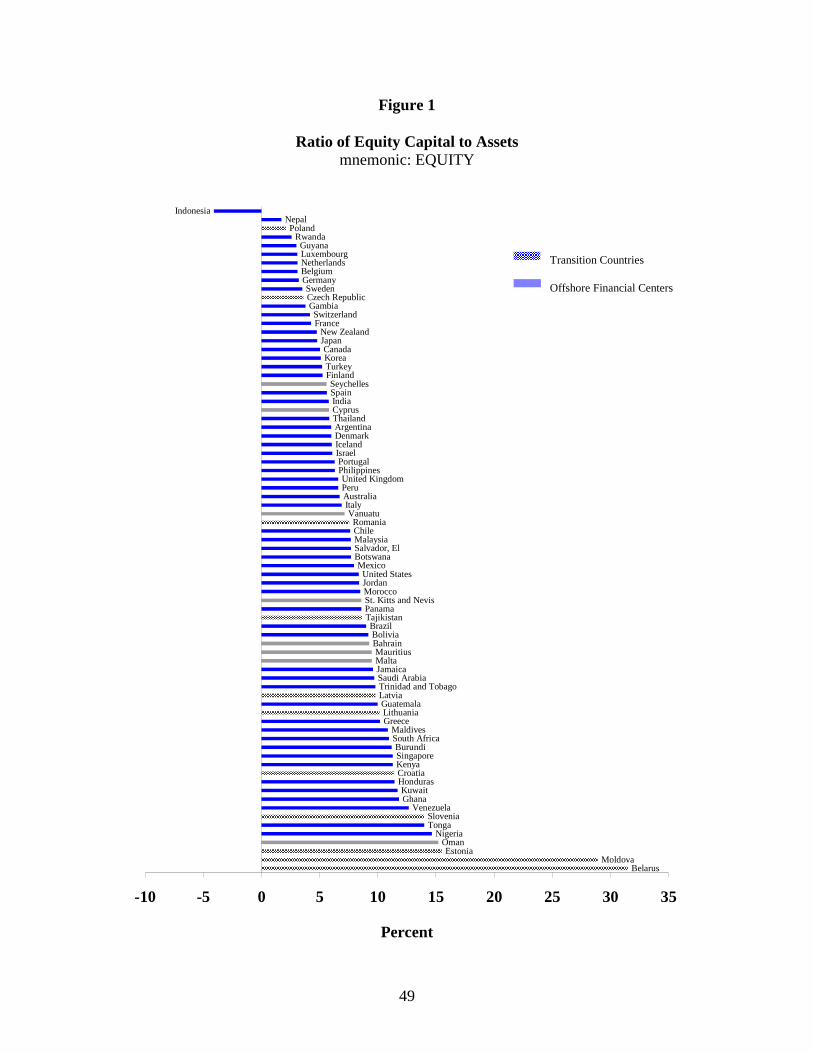
49
Figure 1
Ratio of Equity Capital to Assets mnemonic: EQUITY
BelarusMoldova
EstoniaOman
NigeriaTongaSlovenia
VenezuelaGhanaKuwait
HondurasCroatiaKenyaSingaporeBurundi
South AfricaMaldives
GreeceLithuaniaGuatemalaLatviaTrinidad and TobagoSaudi ArabiaJamaicaMaltaMauritius
BahrainBoliviaBrazil
TajikistanPanamaSt. Kitts and NevisMoroccoJordanUnited States
MexicoBotswanaSalvador, ElMalaysiaChileRomania
VanuatuItalyAustraliaPeruUnited Kingdom
PhilippinesPortugal
IsraelIcelandDenmarkArgentinaThailandCyprusIndiaSpainSeychelles
FinlandTurkeyKoreaCanada
JapanNew Zealand
FranceSwitzerland
GambiaCzech RepublicSweden
GermanyBelgiumNetherlandsLuxembourgGuyana
RwandaPoland
NepalIndonesia
-10 -5 0 5 10 15 20 25 30 35
Transition Countries
Offshore Financial Centers
Percent

50
Figure 2
Ratio of Non-Performing Loans to Total Loans mnemonic: NPL
ThailandRwanda
RomaniaKenya
IndonesiaSt. Kitts and Nevis
Czech RepublicNepal
RussiaMoldova
NigeriaGambia
GreeceIndia
JamaicaJordan
PolandKorea
PhilippinesLithuania
BahrainKuwait
Saudi ArabiaGuatemalaMalaysiaCroatiaBurundiMexico
TongaBelarusMaltaHondurasBrazilSingapore
CyprusArgentinaMauritius
TajikistanVenezuelaPeruItalyMoroccoBoliviaJapanLatviaOmanFranceGhanaSlovenia
Trinidad and TobagoTurkeySwitzerland
MaldivesSouth AfricaBotswana
Salvador, ElEstoniaIsrael
PanamaPortugal
ChileBelgiumUnited KingdomSpainSwedenAustraliaCanadaUnited StatesFinlandDenmark
LuxembourgNew Zealand
0 10 20 30 40 50
Transition Countries
Offshore Financial Centers
Percent
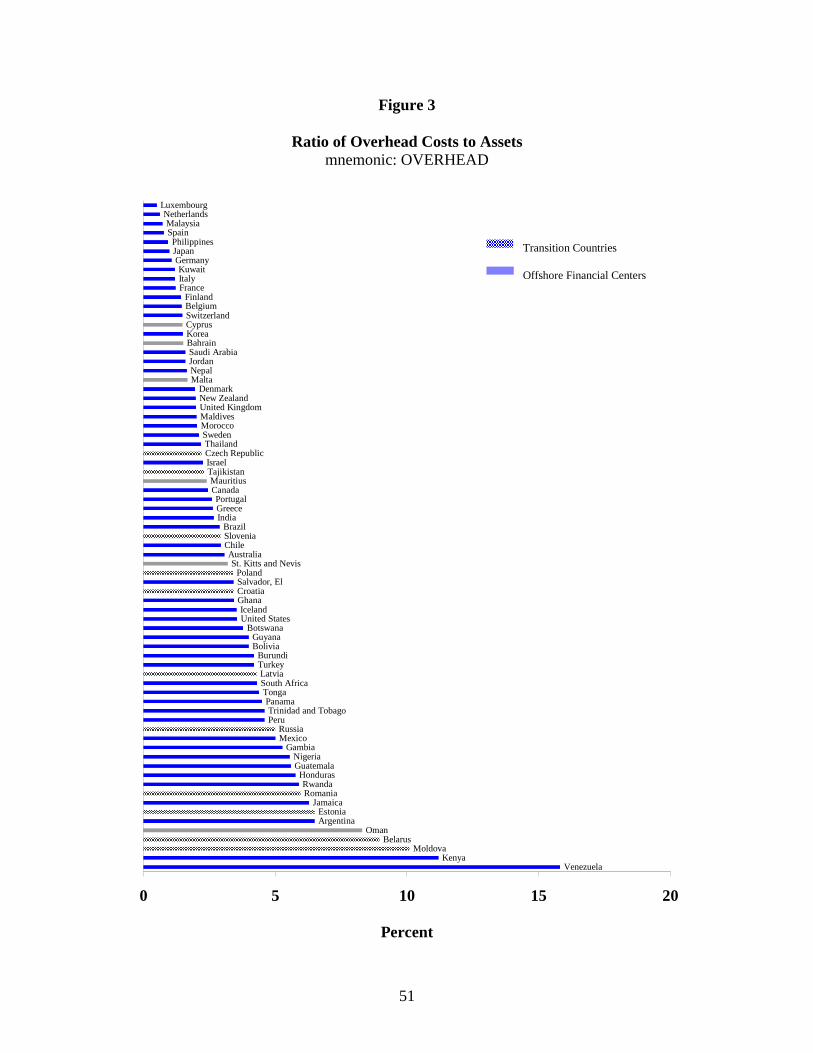
51
Figure 3
Ratio of Overhead Costs to Assets mnemonic: OVERHEAD
VenezuelaKenya
MoldovaBelarus
OmanArgentinaEstonia
JamaicaRomaniaRwanda
HondurasGuatemalaNigeria
GambiaMexicoRussia
PeruTrinidad and Tobago
PanamaTongaSouth AfricaLatvia
TurkeyBurundi
BoliviaGuyana
BotswanaUnited StatesIceland
GhanaCroatiaSalvador, ElPoland
St. Kitts and NevisAustralia
ChileSloveniaBrazil
IndiaGreecePortugal
CanadaMauritius
TajikistanIsraelCzech RepublicThailandSwedenMoroccoMaldivesUnited KingdomNew ZealandDenmark
MaltaNepalJordanSaudi ArabiaBahrainKoreaCyprusSwitzerlandBelgiumFinland
FranceItalyKuwait
GermanyJapanPhilippines
SpainMalaysia
NetherlandsLuxembourg
0 5 10 15 20
Transition Countries
Offshore Financial Centers
Percent
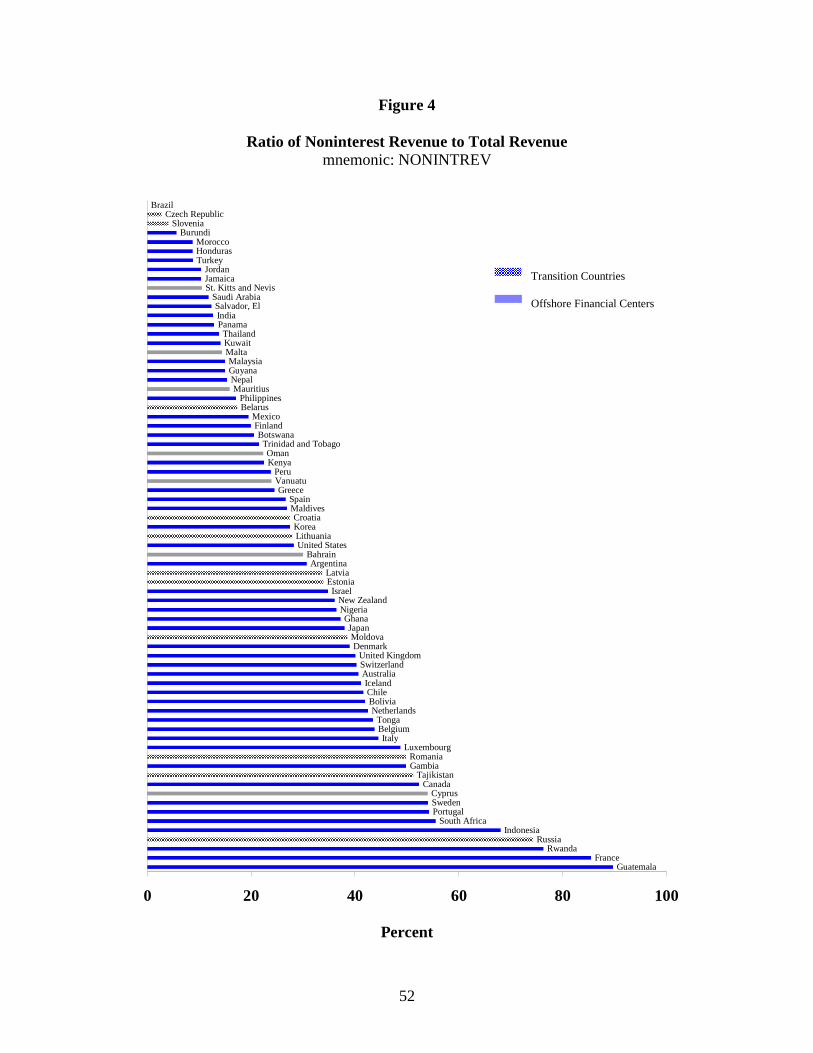
52
Figure 4
Ratio of Noninterest Revenue to Total Revenue mnemonic: NONINTREV
GuatemalaFrance
RwandaRussia
IndonesiaSouth Africa
PortugalSwedenCyprus
CanadaTajikistan
GambiaRomania
LuxembourgItaly
BelgiumTonga
NetherlandsBoliviaChileIceland
AustraliaSwitzerlandUnited Kingdom
DenmarkMoldova
JapanGhana
NigeriaNew Zealand
IsraelEstoniaLatvia
ArgentinaBahrain
United StatesLithuaniaKoreaCroatia
MaldivesSpain
GreeceVanuatuPeru
KenyaOman
Trinidad and TobagoBotswana
FinlandMexico
BelarusPhilippines
MauritiusNepalGuyanaMalaysia
MaltaKuwaitThailand
PanamaIndiaSalvador, El
Saudi ArabiaSt. Kitts and NevisJamaicaJordan
TurkeyHondurasMorocco
BurundiSlovenia
Czech RepublicBrazil
0 20 40 60 80 100
Transition Countries
Offshore Financial Centers
Percent
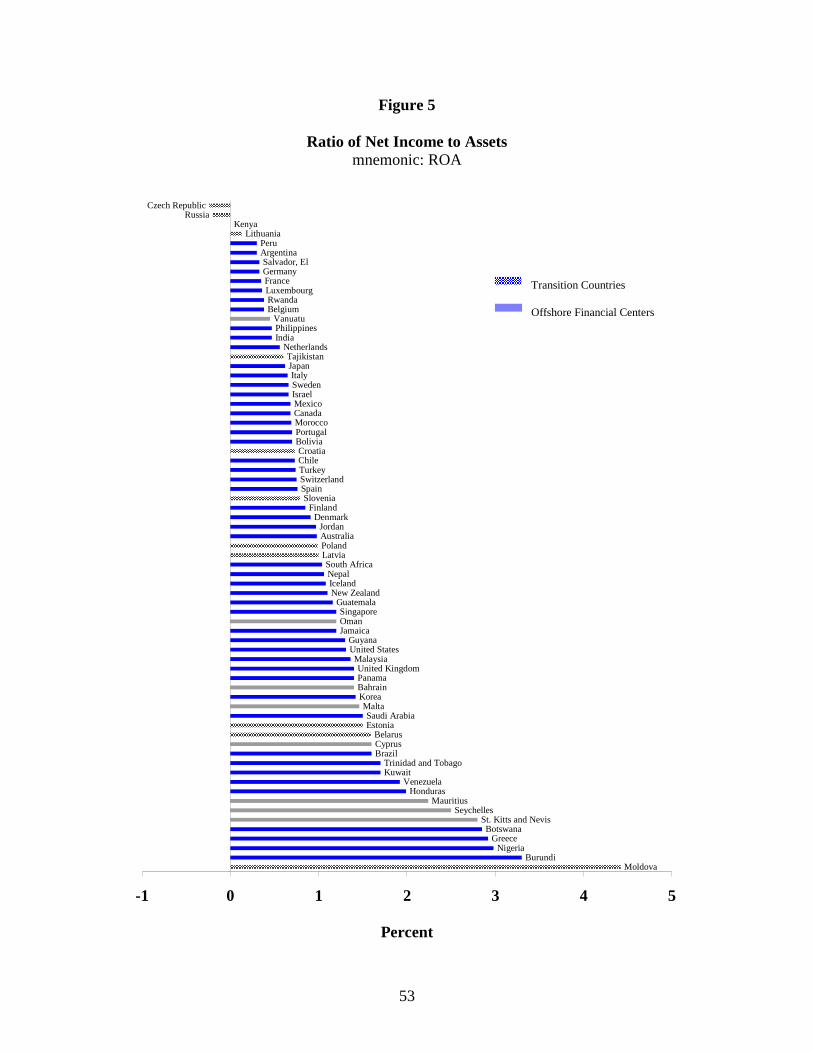
53
Figure 5
Ratio of Net Income to Assets mnemonic: ROA
MoldovaBurundi
NigeriaGreece
BotswanaSt. Kitts and Nevis
SeychellesMauritius
HondurasVenezuela
KuwaitTrinidad and Tobago
BrazilCyprusBelarus
EstoniaSaudi Arabia
MaltaKoreaBahrainPanamaUnited Kingdom
MalaysiaUnited StatesGuyana
JamaicaOmanSingapore
GuatemalaNew ZealandIcelandNepalSouth Africa
LatviaPolandAustraliaJordan
DenmarkFinland
SloveniaSpainSwitzerlandTurkeyChileCroatia
BoliviaPortugalMoroccoCanadaMexicoIsraelSwedenItaly
JapanTajikistan
NetherlandsIndiaPhilippinesVanuatu
BelgiumRwandaLuxembourgFranceGermanySalvador, El
ArgentinaPeru
LithuaniaKenya
RussiaCzech Republic
-1 0 1 2 3 4 5
Transition Countries
Offshore Financial Centers
Percent
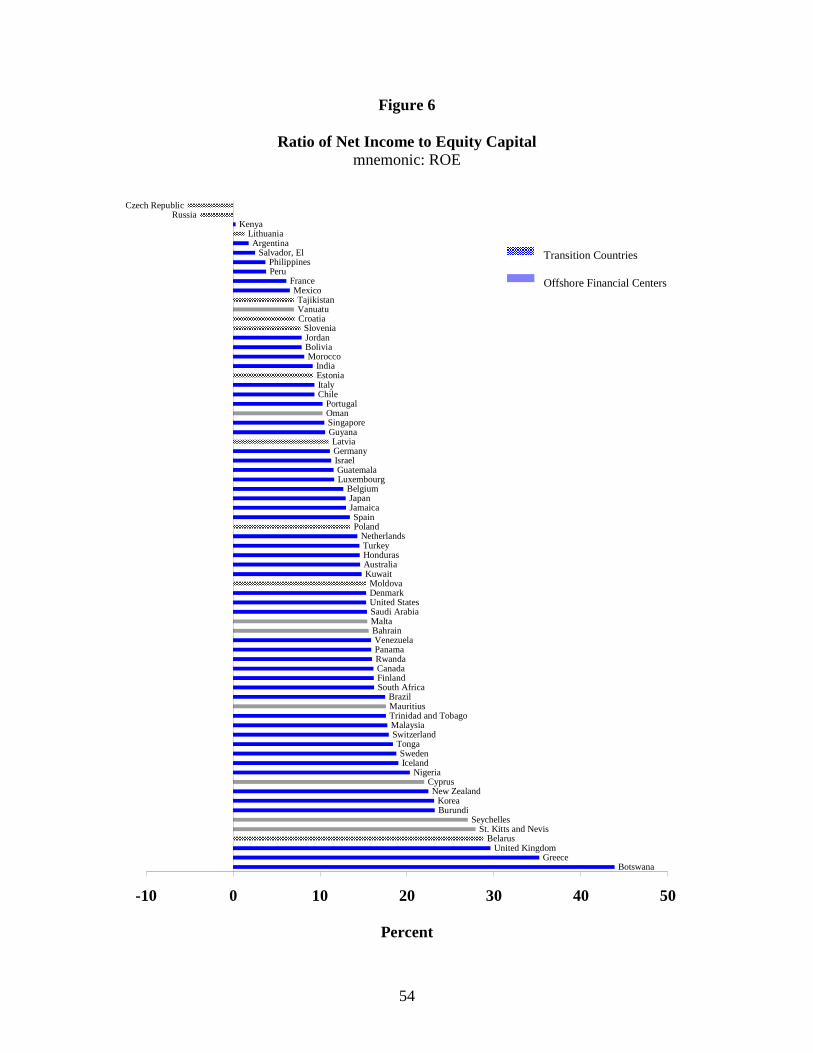
54
Figure 6
Ratio of Net Income to Equity Capital mnemonic: ROE
BotswanaGreece
United KingdomBelarus
St. Kitts and NevisSeychelles
BurundiKorea
New ZealandCyprus
NigeriaIcelandSweden
TongaSwitzerlandMalaysiaTrinidad and TobagoMauritiusBrazil
South AfricaFinlandCanadaRwandaPanamaVenezuela
BahrainMaltaSaudi ArabiaUnited StatesDenmarkMoldova
KuwaitAustraliaHondurasTurkeyNetherlands
PolandSpain
JamaicaJapan
BelgiumLuxembourgGuatemala
IsraelGermanyLatvia
GuyanaSingaporeOmanPortugal
ChileItalyEstoniaIndia
MoroccoBoliviaJordanSlovenia
CroatiaVanuatuTajikistan
MexicoFrance
PeruPhilippines
Salvador, ElArgentina
LithuaniaKenya
RussiaCzech Republic
-10 0 10 20 30 40 50
Transition Countries
Offshore Financial Centers
Percent

55
Figure 7
Sum of Ratios of Loans-to-Assets and Deposits-to-Assets mnemonic: LIQRISK
ThailandSouth Africa
GermanyUnited Kingdom
MexicoNew ZealandLuxembourg
Salvador, ElGuyanaIsraelKenya
St. Kitts and NevisMauritius
BoliviaRwandaKoreaOman
BotswanaSweden
PanamaMalaysiaJapanMaltaTongaAustralia
ChileUnited StatesCanada
NepalMoroccoIndia
HondurasBurundi
SloveniaCyprus
PeruGuatemalaBahrainGreeceMaldivesPhilippines
EstoniaSpainLithuaniaCroatiaVenezuela
LatviaNetherlandsIceland
FinlandArgentinaJordanVanuatuPolandGhana
MoldovaSaudi ArabiaTrinidad and Tobago
IndonesiaCzech Republic
PortugalRomaniaSeychellesDenmarkKuwaitTurkey
GambiaJamaicaSwitzerland
TajikistanRussiaBelgium
ItalyNigeria
BrazilSingapore
FranceBelarus
0 50 100 150 200
Transition Countries
Offshore Financial Centers
Percent