Embed Size (px)
DESCRIPTION
Banco do Brasil 3Q08. 18.0. 17.8. 13.3. 11.3. 7.6. 5.7. 4.5. 3.1. Interest Rate Selic. Price Index - IPCA. Economic Environment. Ratio - %. 13.8. 11.2. 4.8. 3.0. 2004. 2005. 2006. 2007. 9M07. 9M08. Economic Environment. 383. 303. 304. 222. 192. 172. 206.5. - PowerPoint PPT Presentation
Citation preview

1
Banco do Brasil3Q08
2
Economic EnvironmentEconomic Environment
Interest Rate Selic
Ratio - %
Price Index - IPCA
17.8
7.6
18.0
5.7
13.3
3.1
11.3
4.5
11.2
3.0
13.8
4.8
2004 2005 2006 2007 9M07 9M08
3
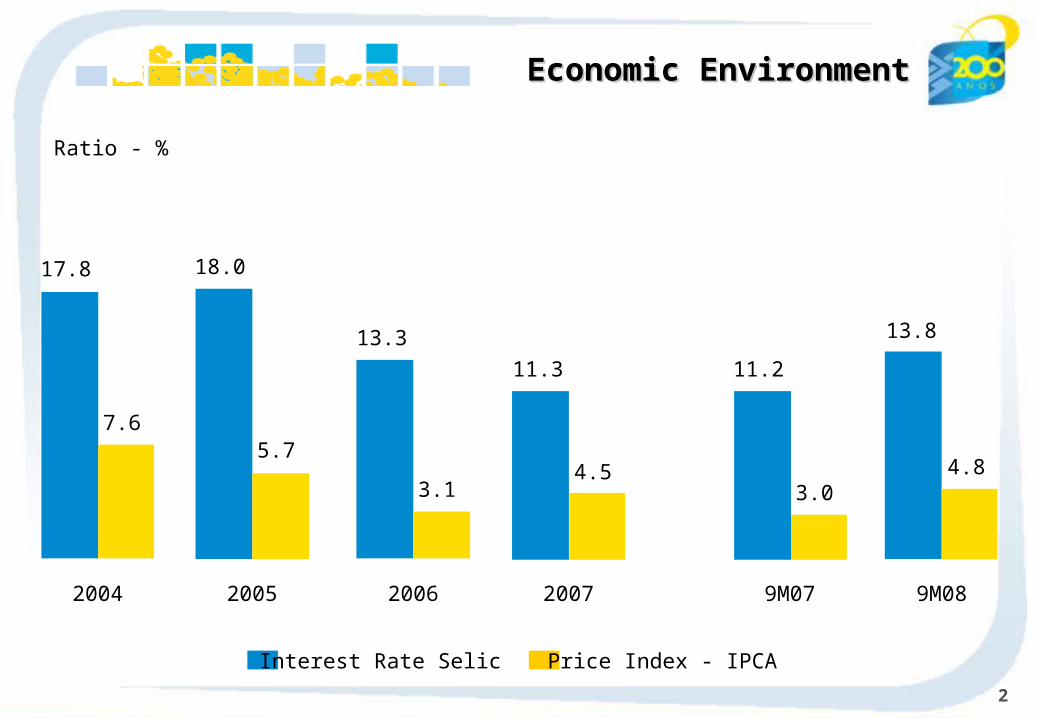
Economic EnvironmentEconomic Environment
International Reserves
Sovereign Risk - basis points
Trade Balance
US$ billion
33.644.7 46.1 40.0
30.919.7
52.9 53.8
85.8
180.3163.0
206.5
2004 2005 2006 2007 3Q07 3Q08
383
303
192222
172
304
4
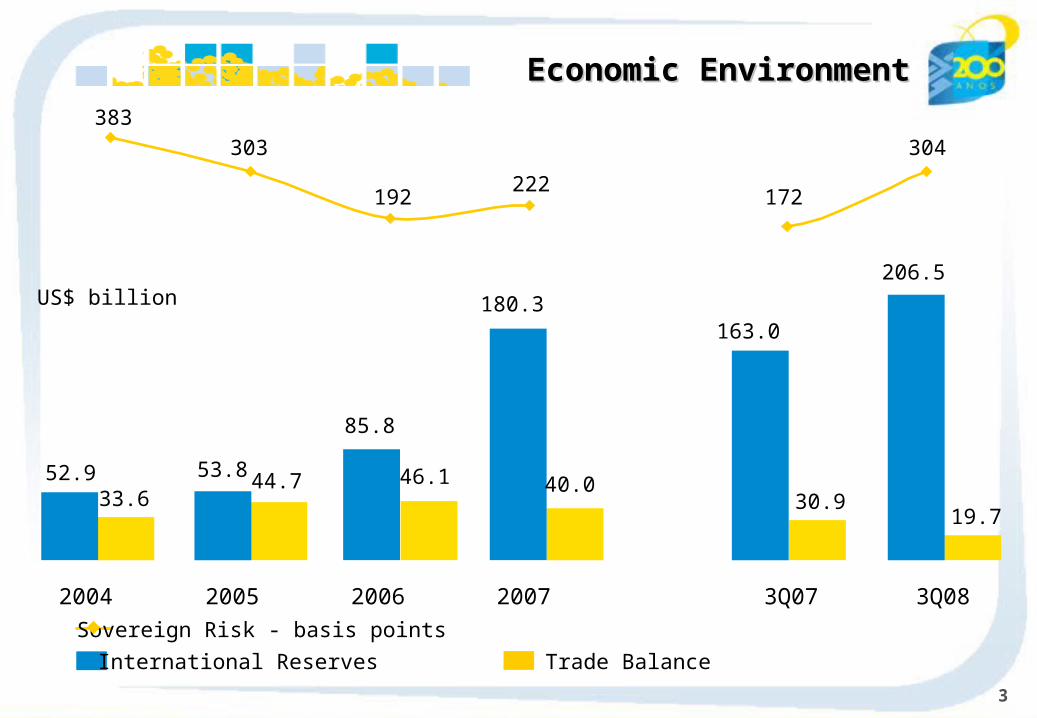
Banking IndustryBanking Industry
56.4
43.6
2004
52.847.2
2005
52.247.8
2006
51.948.1
2007
Businesses IndividualsLoan / GDP - %
53.646.4
3Q08
Loan Segments - Free Resources %
26.9
31.2 30.7
34.7
39.1
Source: Brazilian Central Bank
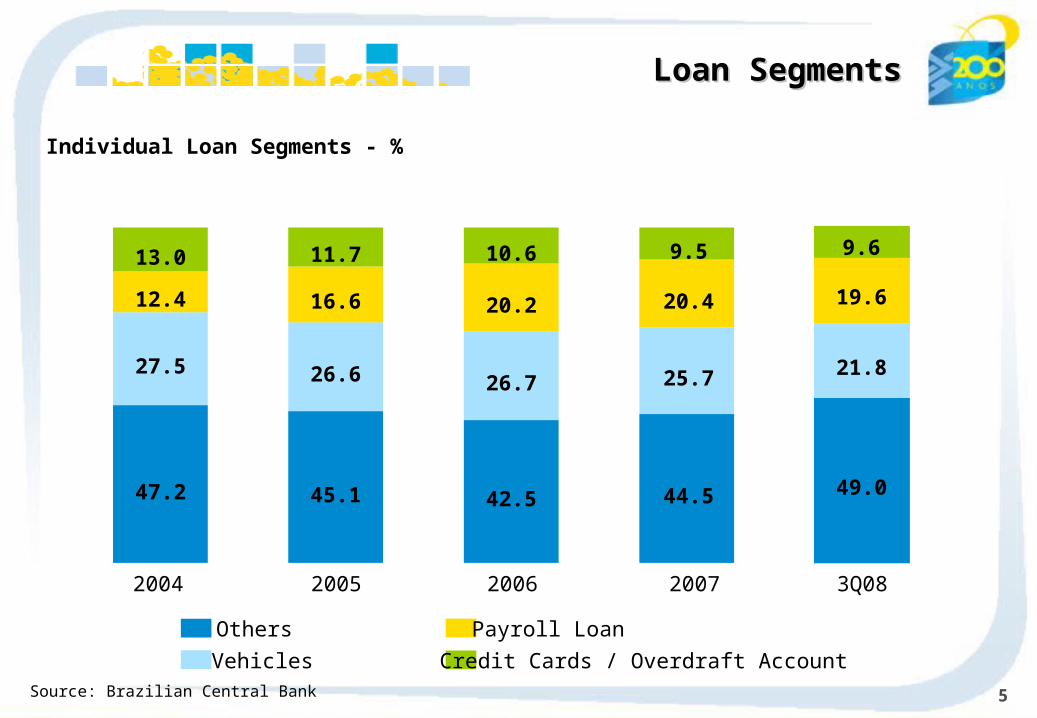
5
Others
Vehicles
Payroll Loan
Credit Cards / Overdraft Account
Loan SegmentsLoan Segments
2004 2005 2006 2007 3Q08
47.2
27.5
12.4
13.0
45.1
26.6
16.6
11.7
42.5
26.7
20.2
10.6
44.5
25.7
20.4
9.5
Individual Loan Segments - %
49.0
21.8
19.6
9.6
Source: Brazilian Central Bank
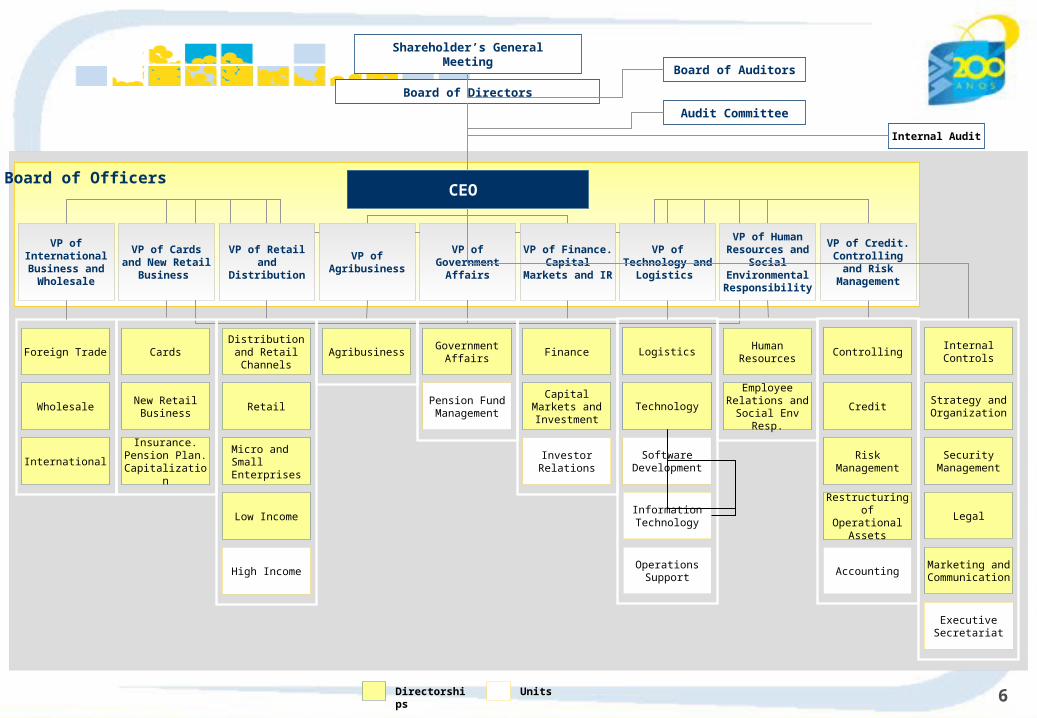
6
Board of Officers
Internal Audit
Board of Directors
Shareholder’s General Meeting
Board of Auditors
Directorships
Audit Committee
CEO
VP of International Business and
Wholesale
Foreign Trade
Wholesale
International
VP of Cards and New Retail Business
VP of Retail and Distribution
VP of Agribusiness
VP of Government
Affairs
VP of Finance. Capital Markets
and IR
VP of Technology and Logistics
VP of Human Resources and
Social Environmental Responsibility
VP of Credit. Controlling and
Risk Management
Cards
New Retail Business
Insurance. Pension Plan. Capitalization
Distribution and Retail Channels
Low Income
High Income
AgribusinessGovernment
Affairs
Pension Fund Management
Finance
Capital Markets and Investment
Investor Relations
Logistics
Technology
Software Development
Information Technology
Operations Support
Human Resources
Employee Relations and
Social Env Resp.
Controlling
Credit
Risk Management
Restructuring of Operational
Assets
Accounting
Internal Controls
Strategy and Organization
Security Management
Legal
Marketing and Communication
Executive Secretariat
Units
Micro and Small Enterprises
Retail
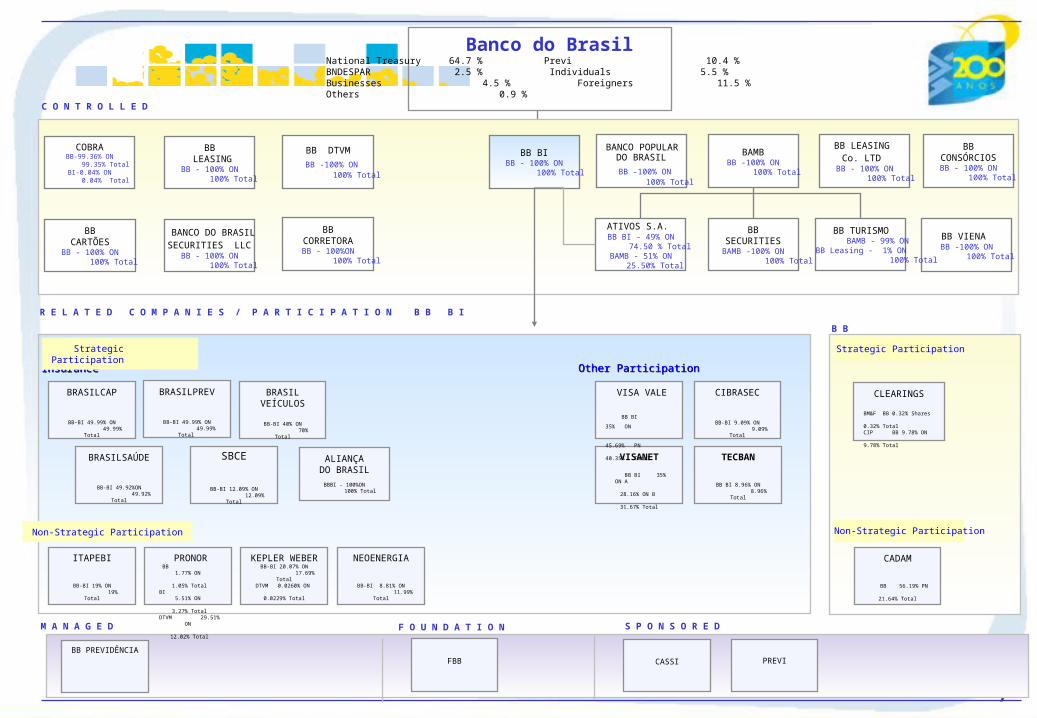
7
COBRABB-99.36% ON
99.35% TotalBI-0.04% ON
0.04% Total
BB LEASING
BB - 100% ON 100% Total
BB VIENA BB -100% ON
100% Total
BBCARTÕES
BB - 100% ON 100% Total
BB LEASING Co. LTD
BB - 100% ON 100% Total
BB DTVM
BB -100% ON 100% Total
BBCORRETORA
BB - 100%ON 100% Total
BAMBBB -100% ON
100% Total
BBCONSÓRCIOS
BB - 100% ON 100% Total
BB BIBB - 100% ON
100% Total
BANCO DO BRASIL
SECURITIES LLC BB - 100% ON
100% Total
BBSECURITIES
BAMB -100% ON 100% Total
BB TURISMO BAMB - 99% ONBB Leasing - 1% ON
100% Total
ATIVOS S.A. BB BI - 49% ON
74.50 % TotalBAMB - 51% ON 25.50% Total
BRASILPREV
BB-BI 49.99% ON 49.99% Total
CIBRASEC
BB-BI 9.09% ON 9.09% Total
SBCE
BB-BI 12.09% ON 12.09% Total
BRASILSAÚDE
BB-BI 49.92%ON 49.92% Total
VISANET
BB BI 35% ON A 28.16% ON B 31.67% Total
InsuranceInsurance
ITAPEBI
BB-BI 19% ON 19% Total
BRASILCAP
BB-BI 49.99% ON 49.99% Total
KEPLER WEBER
BB-BI 20.07% ON 17.69% TotalDTVM 0.0260% ON
0.0229% Total
VISA VALE
BB BI 35% ON
45.69% PN 40.35% Total
PRONORBB 1.77% ON
1.05% TotalBI 5.51% ON
3.27% Total DTVM 29.51% ON
12.02% Total
Strategic Participation
Non-Strategic Participation
BRASIL VEÍCULOS
BB-BI 40% ON 70% Total
NEOENERGIA
BB-BI 8.81% ON 11.99% Total
TECBAN
BB BI 8.96% ON 8.96% Total
CLEARINGS
BM&F BB 0.32% Shares 0.32% Total CIP BB 9.78% ON 9.78% Total
B B
Strategic Participation
CADAM
BB 56.19% PN 21.64% Total
Non-Strategic Participation
M A N A G E D
BB PREVIDÊNCIA
S P O N S O R E D
CASSI PREVIFBB
Other ParticipationOther Participation
R E L A T E D C O M P A N I E S / P A R T I C I P A T I O N B B B I
C O N T R O L L E D
BANCO POPULAR DO BRASIL
BB -100% ON 100% Total
F O U N D A T I O N
Banco do BrasilNational Treasury 64.7 % Previ 10.4 %BNDESPAR 2.5 % Individuals 5.5 %Businesses 4.5 % Foreigners 11.5 %Others 0.9 %
ALIANÇADO BRASIL
BBBI - 100%ON 100% Total
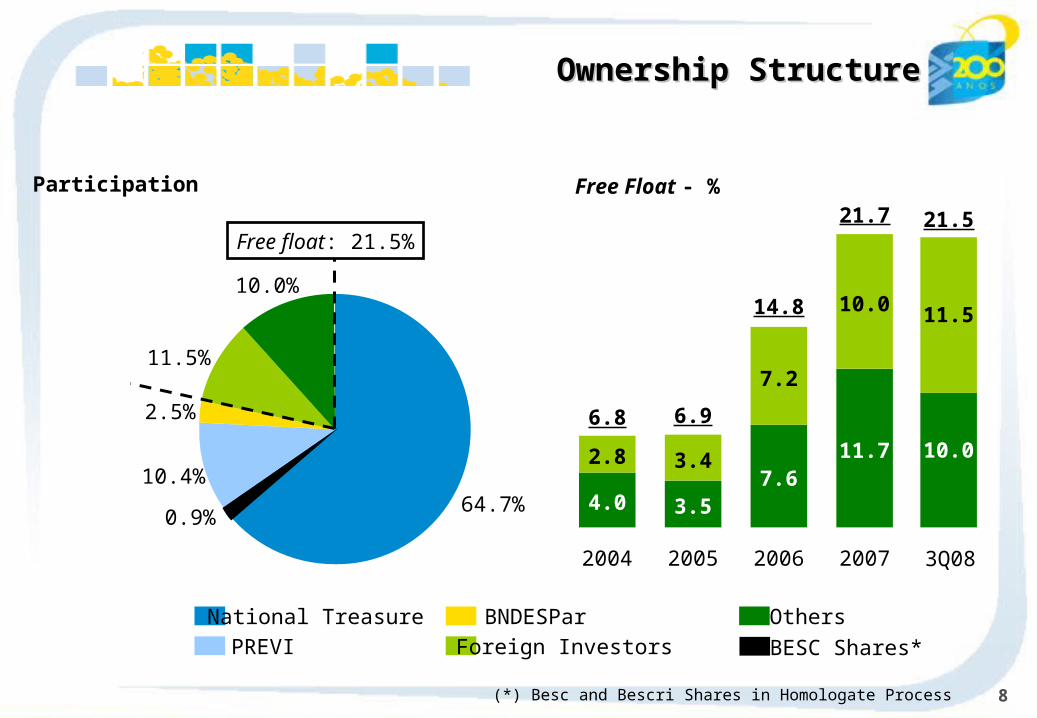
8
National Treasure
PREVI
BNDESPar
Foreign Investors
Others
Participation
64.7%10.4%
2.5%
11.5%
10.0%
Free float: 21.5%
Ownership StructureOwnership Structure
4.0
2.8
2004
6.8
3.5
3.4
2005
6.9
7.6
7.2
2006
14.8
11.7
10.0
2007
21.7Free Float - %
(*) Besc and Bescri Shares in Homologate Process
0.9%
BESC Shares*
3Q08
21.5
10.0
11.5
9
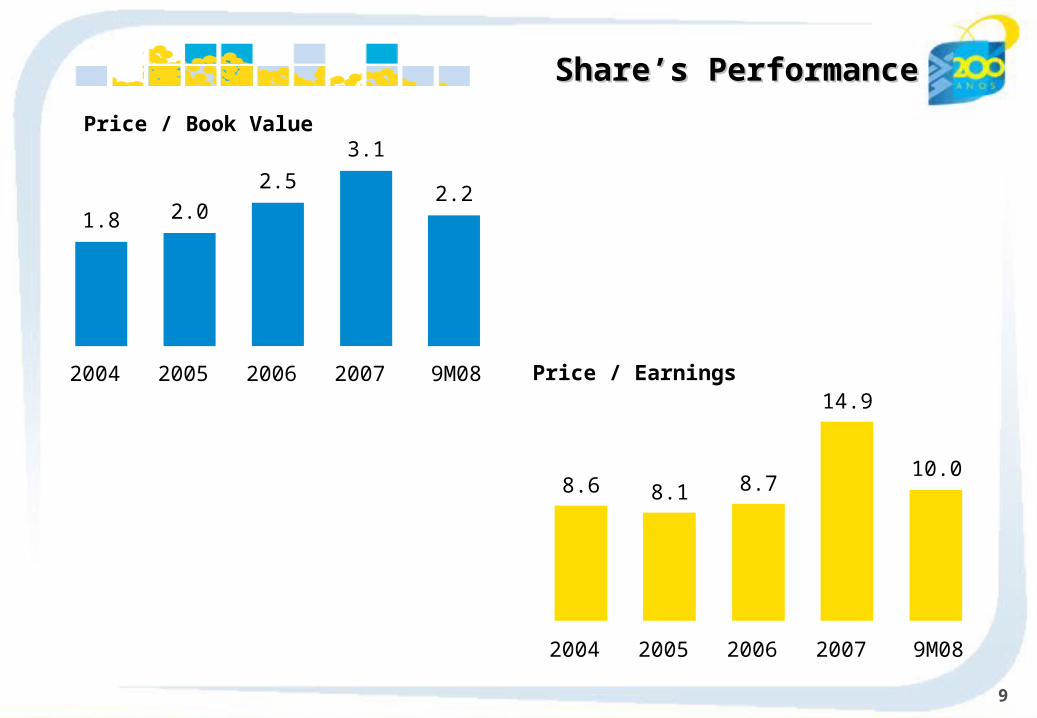
Price / Book Value
Price / Earnings
1.8
2004
2.0
2005
2.5
2006
3.1
2007
2.2
9M08
8.6
2004
8.1
2005
8.7
2006
14.9
2007
10.0
9M08
Share’s PerformanceShare’s Performance

10
Earnings / Share – R$
Dividends and Interest on Own Capital / Share – R$
1.3
2004
1.7
2005
2.4
2006
2.0
2007
2.3
9M08
0.4
2004
0.6
2005
1.0
2006
0.8
2007
0.9
9M08
Share’s PerformanceShare’s Performance
11
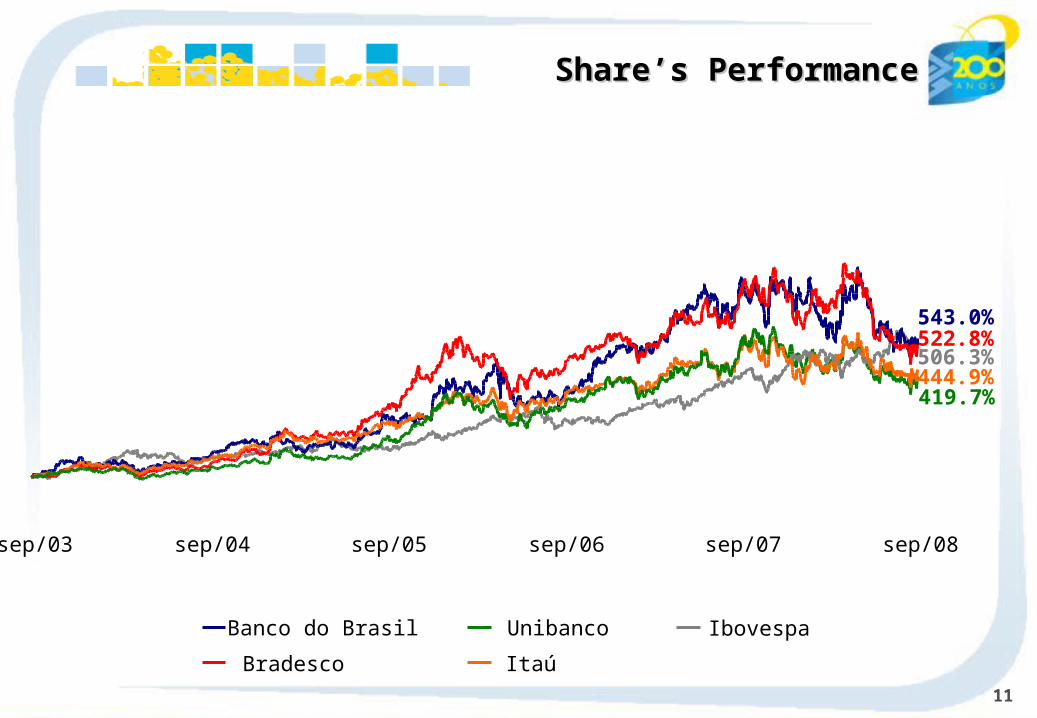
sep/03 sep/04 sep/05 sep/06 sep/07
IbovespaBanco do Brasil
Bradesco Itaú
Unibanco
Share’s PerformanceShare’s Performance
sep/08
543.0%
506.3%522.8%
444.9%419.7%
12
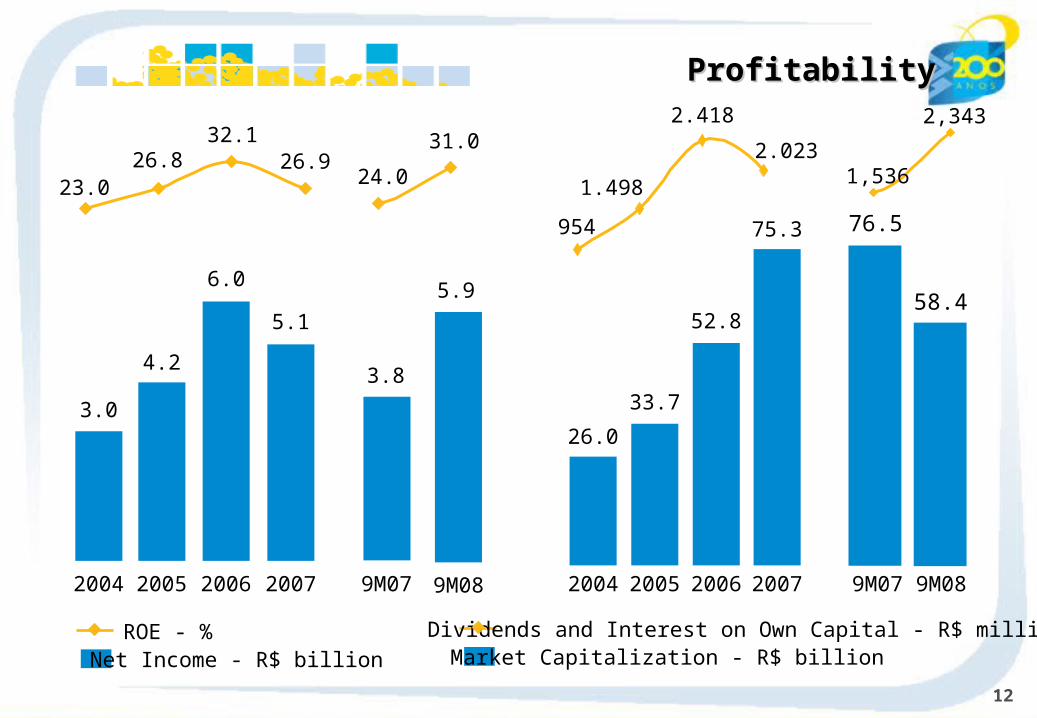
ProfitabilityProfitability
3.0
2004
4.2
2005
6.0
2006
5.1
2007 9M07 9M08
26.0
2004
33.7
2005
52.8
2006
75.3
2007 9M07 9M08
2.023
2.418
1.498
954
Net Income - R$ billionROE - %
Market Capitalization - R$ billionDividends and Interest on Own Capital - R$ million
3.8
5.9
31.0
24.026.9
32.126.8
23.0
76.5
58.4
1,536
2,343
13
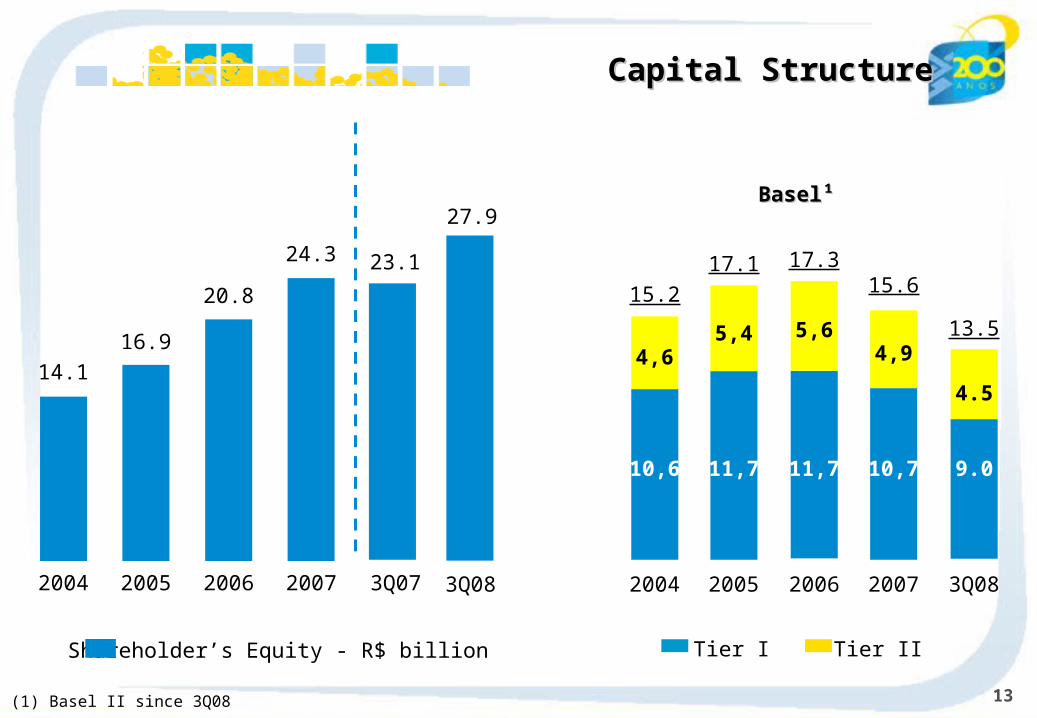
Shareholder’s Equity - R$ billion
14.1
2004
16.9
2005
20.8
2006
24.3
2007
23.1
3Q07
Capital StructureCapital Structure
27.9
3Q08
Tier IITier I
15.2
2004
17.1
2005
17.3
2006
15.6
2007
13.5
3Q08
9.0
4.5
(1) Basel II since 3Q08
Basel¹Basel¹
10,6
4,6
11,7
5,4
11,7
5,6
10,7
4,9

14
239.0
2004
253.0
2005
296.4
2006
357.8
2007
Market Share % Assets - R$ billions
AssetsAssets
(**) Economic-Financial Consolidated
458.9**
9M08
CAGR: 19.0%CAGR: 19.0%
19.5%17.7% 17.2% 16.4% 16.6%*
(*) Until Jun/08 - Source: Brazilian Central Bank
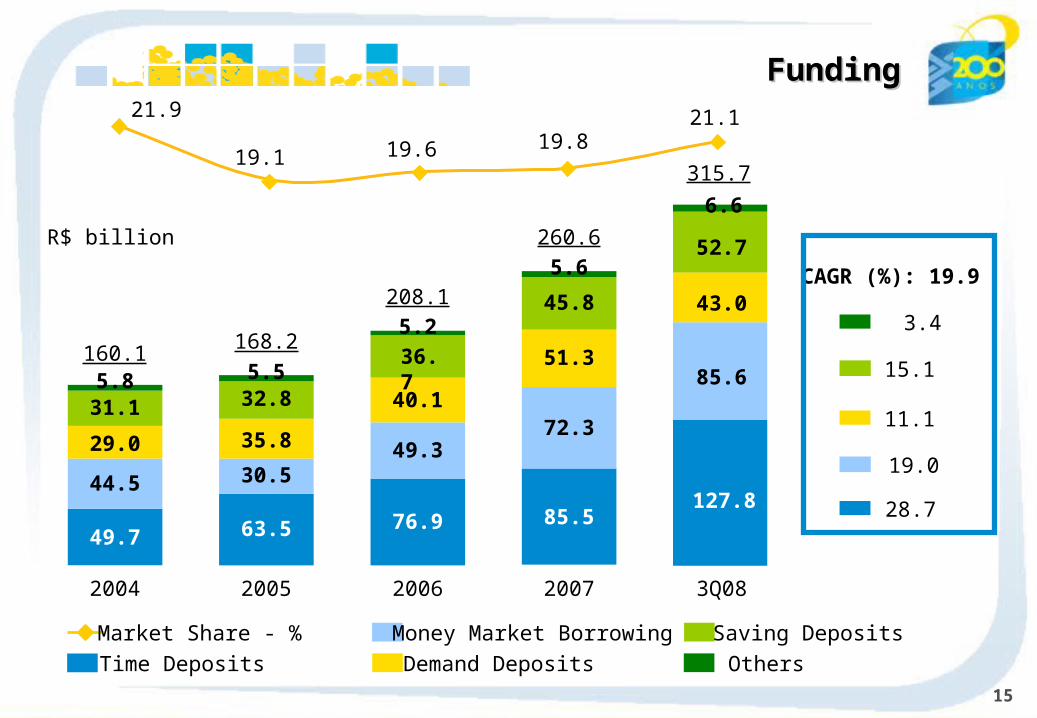
15
2004
49.7
44.5
29.0
31.15.8
160.1
2005
63.5
30.5
35.8
32.85.5
168.2
2006
76.9
49.3
40.1
36.7
5.2
208.1
2007
85.5
72.3
51.3
45.8
5.6
260.6
CAGR (%): 19.9
3.4
15.1
11.1
R$ billion
19.0
28.7
3Q08
315.7
FundingFunding21.1
19.819.619.1
21.9
127.8
85.6
43.0
52.7
6.6
Money Market Borrowing
Demand Deposits
Saving Deposits
Others
Market Share - %
Time Deposits
16
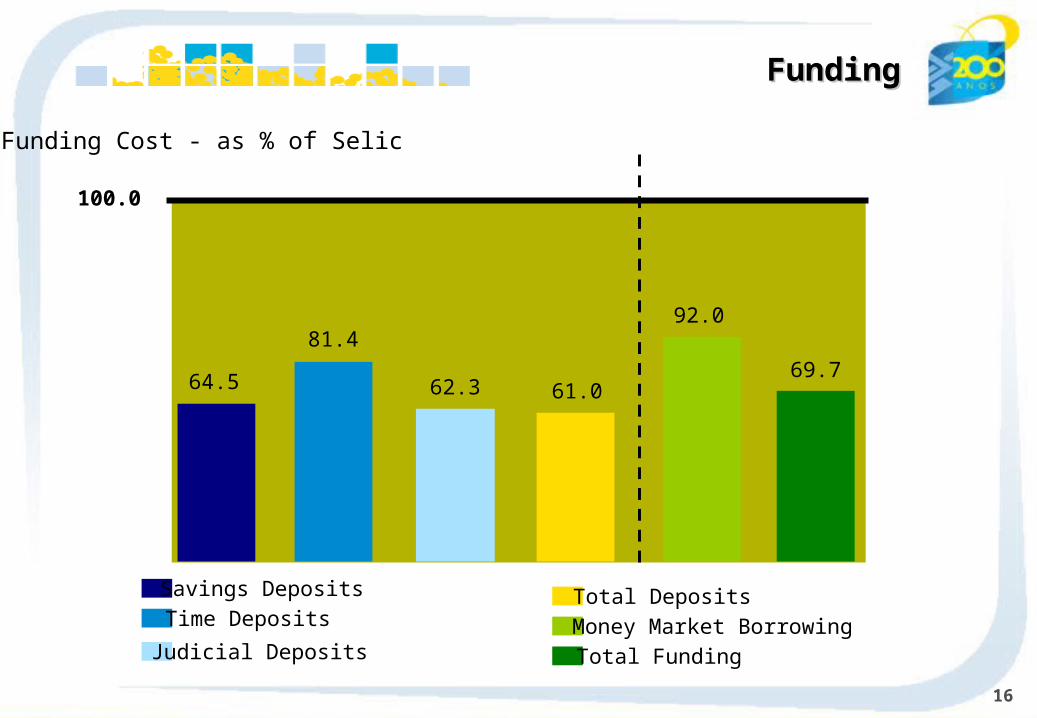
64.5
81.4
62.3
92.0
61.069.7
100.0
Funding Cost - as % of Selic
FundingFunding
Savings Deposits
Time Deposits
Judicial Deposits
Total Deposits
Money Market Borrowing
Total Funding
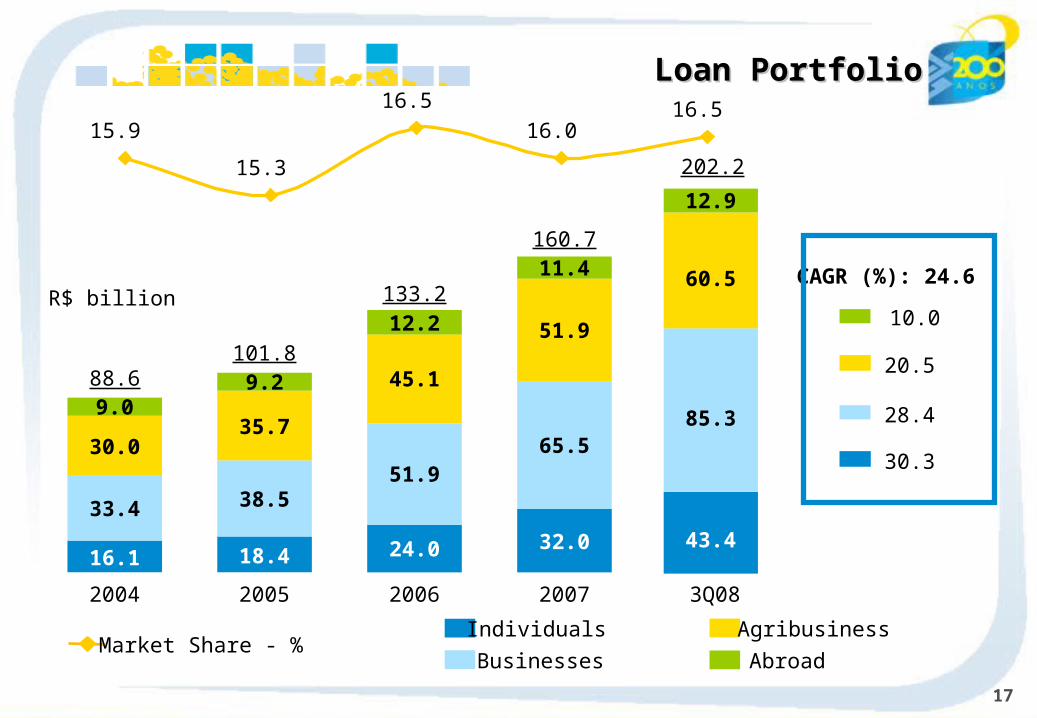
17
Individuals
Businesses
Agribusiness
Abroad
2004
16.1
33.4
30.0
9.088.6
2005
18.4
38.5
35.7
9.2101.8
2006
24.0
51.9
45.1
12.2133.2
2007
32.0
65.5
51.9
11.4160.7
Loan PortfolioLoan Portfolio
CAGR (%): 24.6
10.0
20.5
28.4
30.3
R$ billion
Market Share - %
3Q08
202.2
15.9
15.3
16.5
16.016.5
43.4
85.3
60.5
12.9
202.2
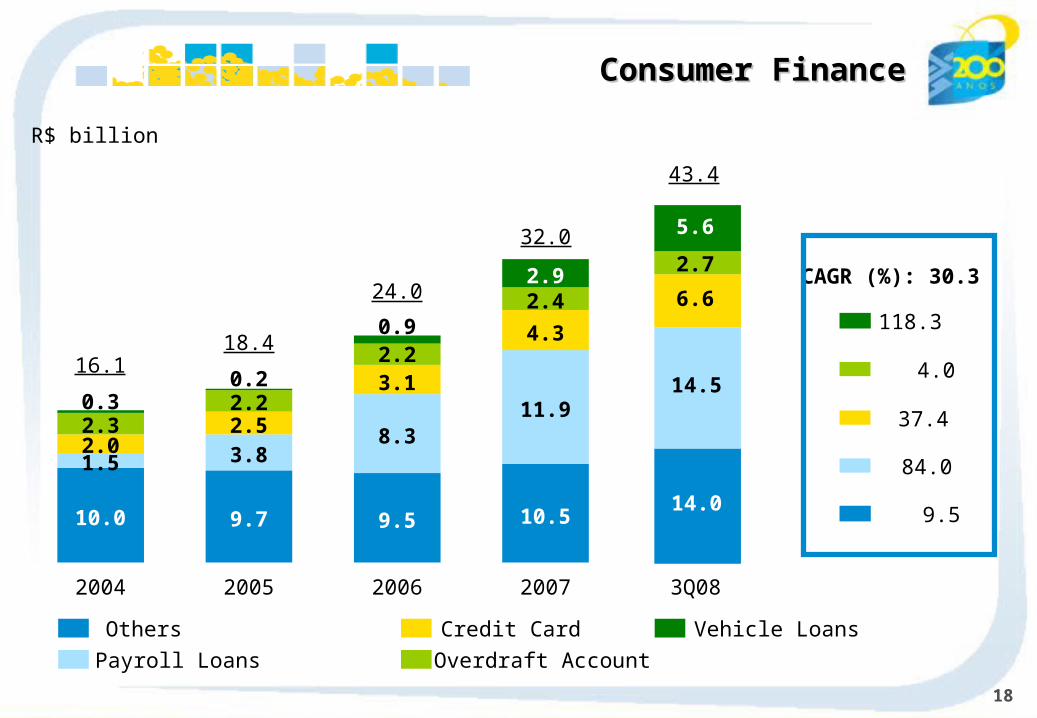
18
Others
Payroll Loans Overdraft Account
Credit Card Vehicle Loans
CAGR (%): 30.3
4.0
118.3
37.4
9.5
84.0
Consumer FinanceConsumer Finance
R$ billion
16.1
10.0
1.52.02.30.3
2004
18.4
9.7
3.82.52.20.2
2005
24.0
9.5
8.3
3.12.20.9
2006
32.0
10.5
11.9
4.3
2.42.9
2007
43.4
3Q08
14.0
14.5
6.6
5.6
2.7
19
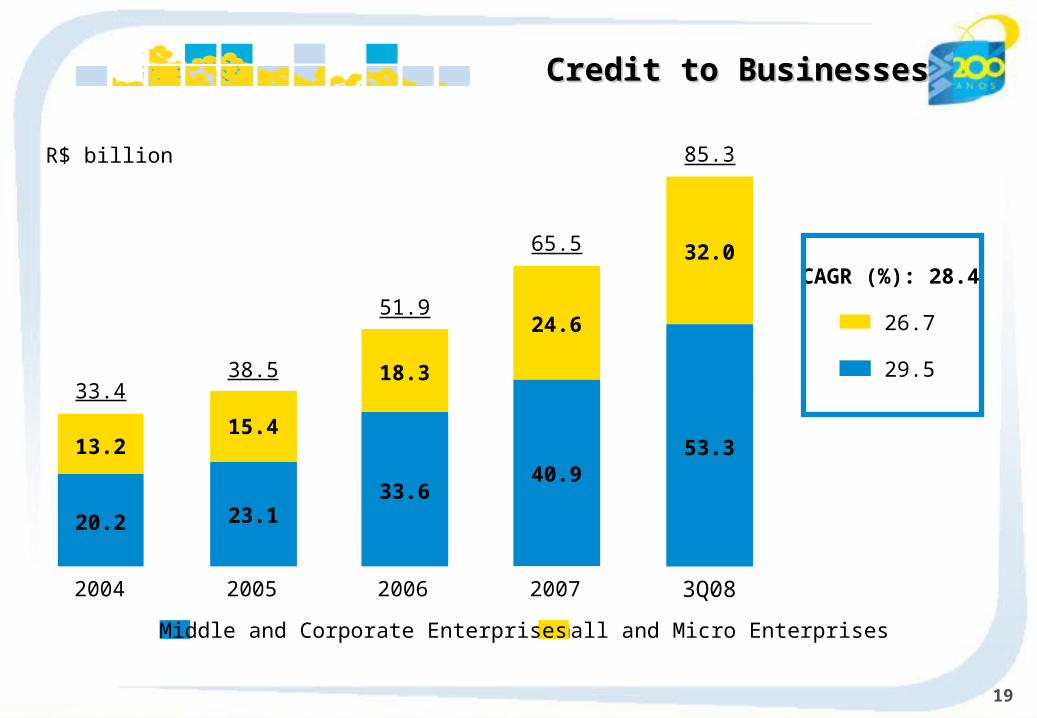
Small and Micro EnterprisesMiddle and Corporate Enterprises
2004
33.4
2005
38.5
2006
51.9
2007
65.5
CAGR (%): 28.4
26.7
29.5
Credit to BusinessesCredit to Businesses
R$ billion
3Q08
85.3
20.2 23.133.6
40.953.313.2
15.4
18.3
24.6
32.0
20
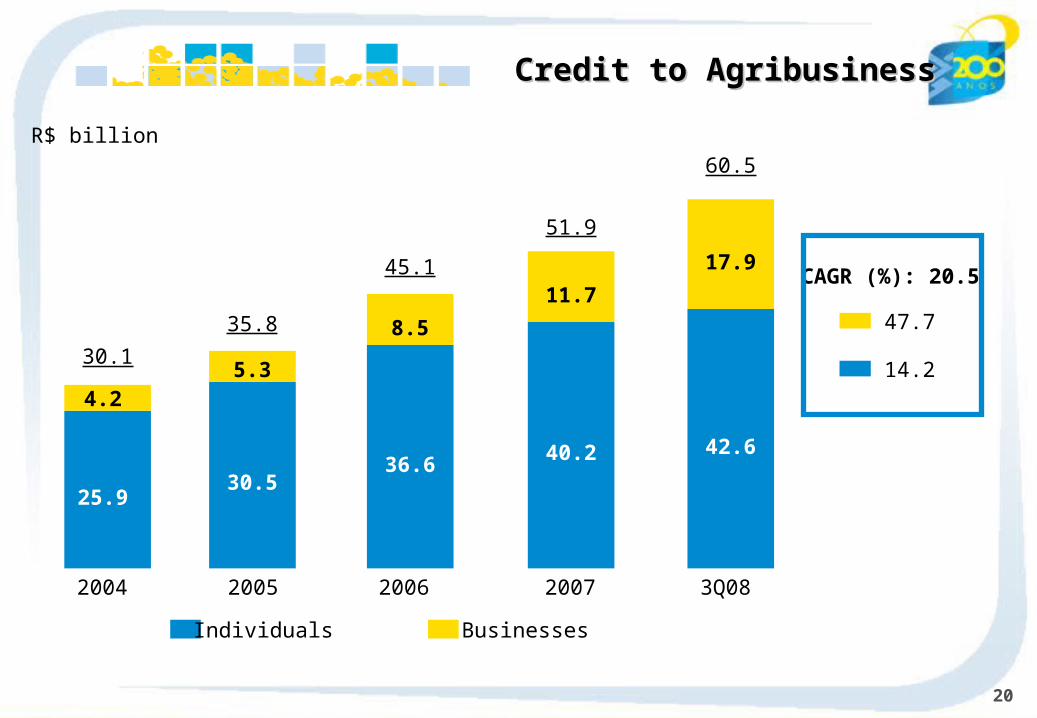
BusinessesIndividuals
CAGR (%): 20.5
47.7
14.2
Credit to AgribusinessCredit to Agribusiness
R$ billion
2004
30.1
2005
35.8
2006
45.1
2007
51.9
3Q08
60.5
25.930.5
36.640.2 42.6
4.25.3
8.5
11.7
17.9
21
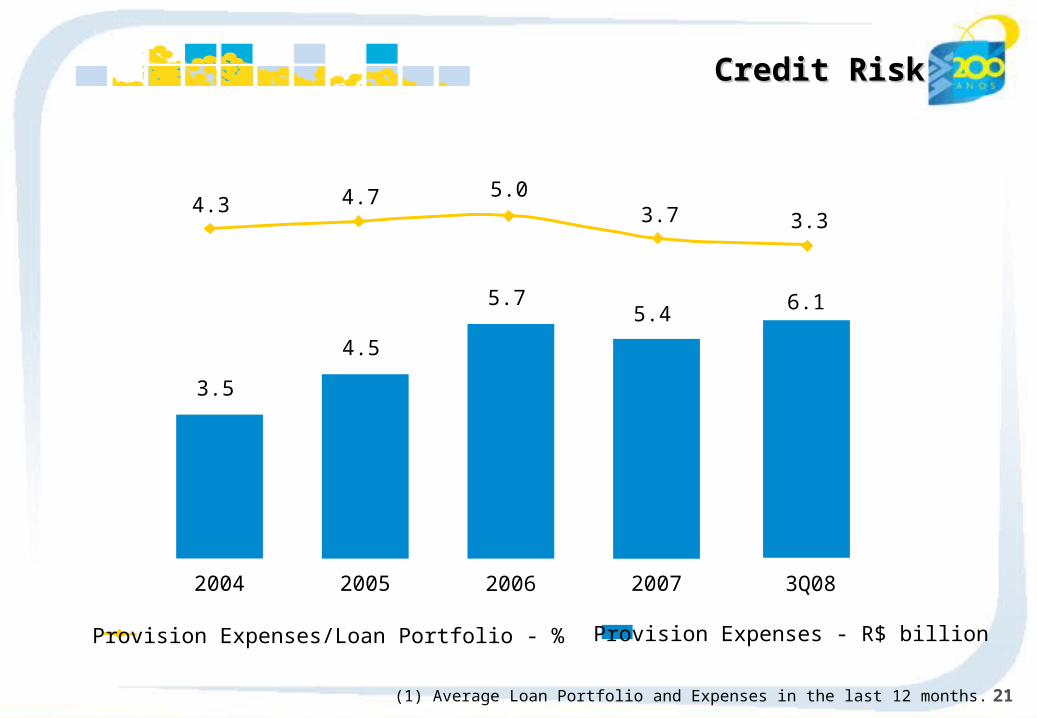
2004
3.5
2005
4.5
2006
5.7
2007
5.4
3Q08
6.1
Credit RiskCredit Risk
4.3 4.73.7 3.3
5.0
Provision Expenses - R$ billionProvision Expenses/Loan Portfolio - %
(1) Average Loan Portfolio and Expenses in the last 12 months.
22
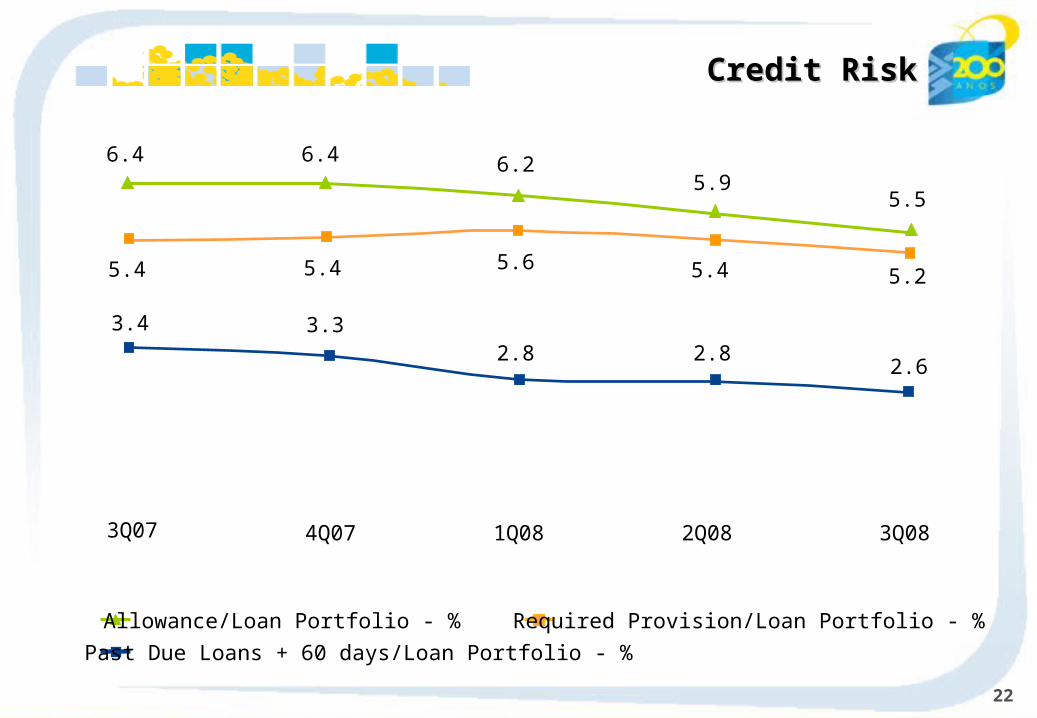
Credit RiskCredit Risk
3Q07 4Q07 1Q08 2Q08 3Q08
3.4 3.32.8 2.8
2.6
5.55.9
6.26.46.4
5.25.45.65.45.4
Past Due Loans + 60 days/Loan Portfolio - %
Allowance/Loan Portfolio - % Required Provision/Loan Portfolio - %
23
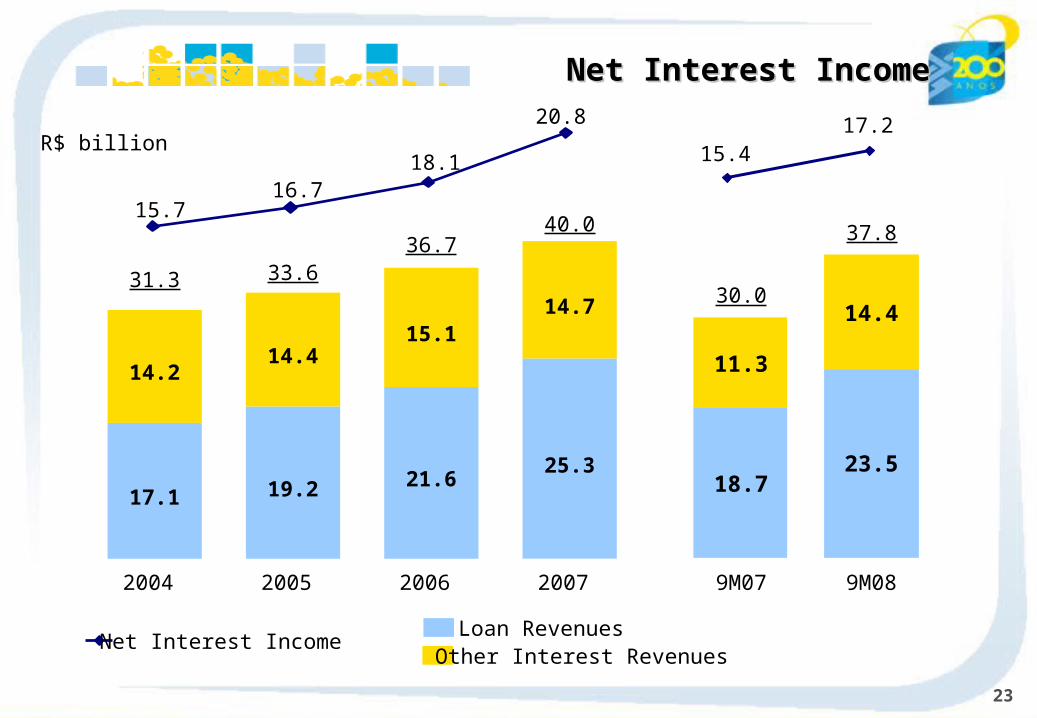
Net Interest IncomeNet Interest Income
Loan Revenues
15.716.7
18.1
20.8
Net Interest Income
R$ billion
17.1
14.2
2004
31.3
19.2
14.4
2005
33.6
21.6
15.1
2006
36.7
25.3
14.7
2007
40.0
9M07
30.0
9M08
37.8
15.417.2
18.723.5
11.3
14.4
Other Interest Revenues
24
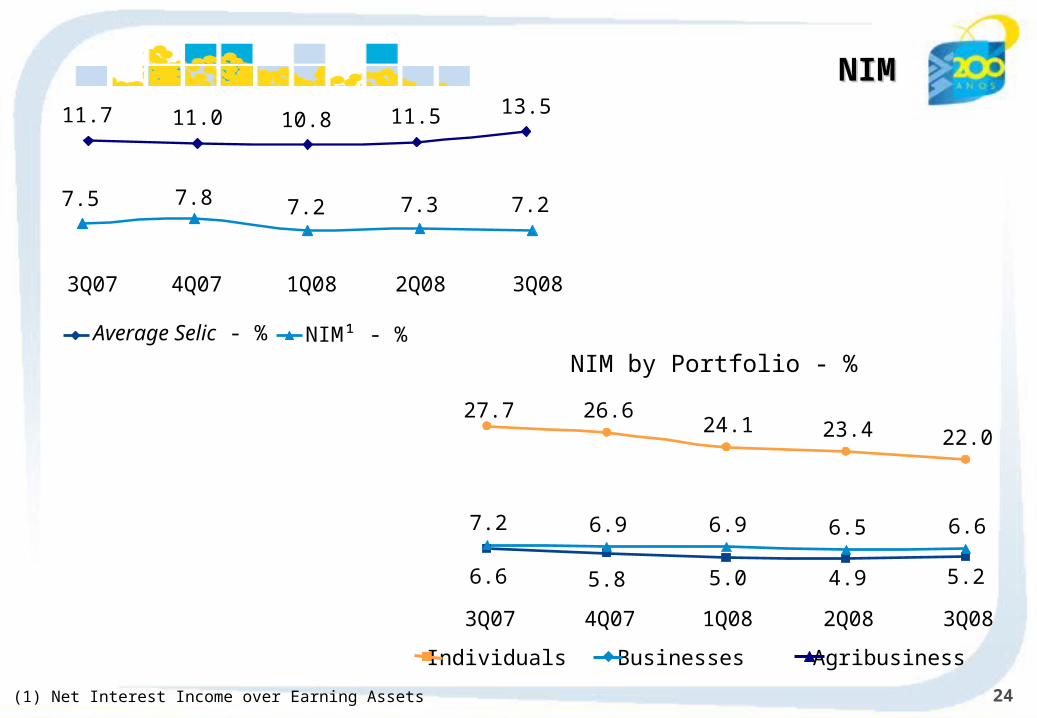
NIMNIM
3Q07 4Q07 1Q08 2Q08 3Q08
6.6 5.8 5.0 4.9 5.2
7.2 6.9 6.9 6.5 6.6
27.7 26.624.1 23.4 22.0
3Q07 4Q07 1Q08 2Q08 3Q08
7.27.37.27.87.5
11.7 11.0 10.8 11.5 13.5
(1) Net Interest Income over Earning Assets
Average Selic - % NIM¹ - %
NIM by Portfolio - %
Individuals Businesses Agribusiness
25
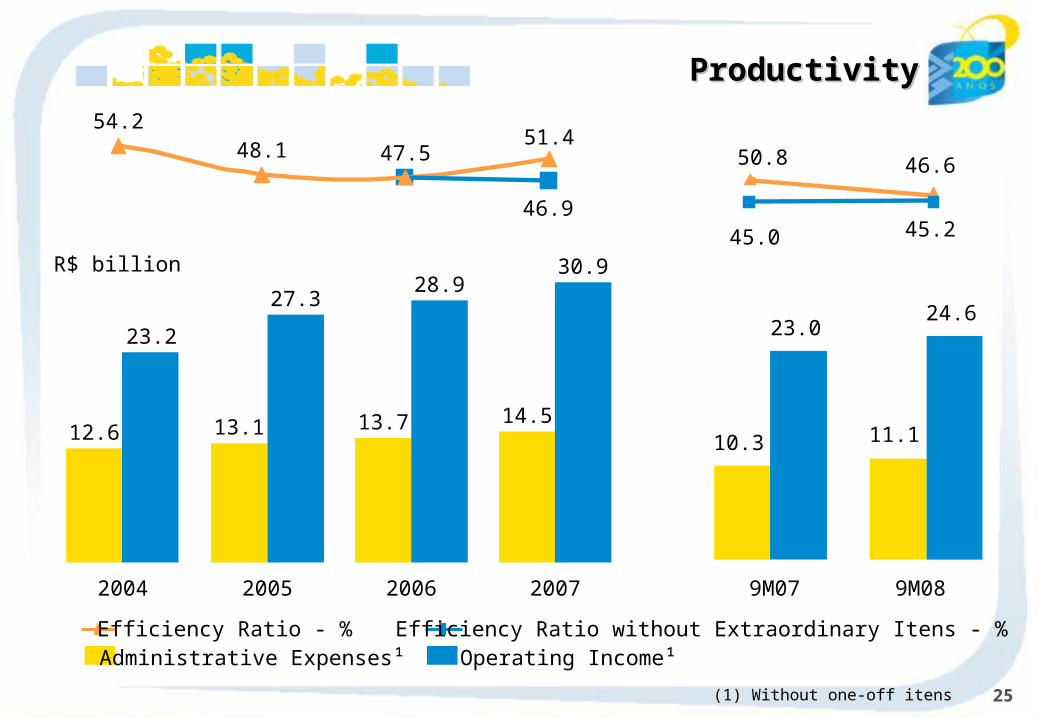
ProductivityProductivity
2004
12.6
23.2
2005
13.1
27.3
2006
13.7
28.9
2007
14.5
30.9
54.248.1 47.5
51.4
46.9
R$ billion
(1) Without one-off itens
9M07 9M08
10.3 11.1
23.024.6
50.8 46.6
45.245.0
Efficiency Ratio - %Administrative Expenses¹
Efficiency Ratio without Extraordinary Itens - %Operating Income¹
26
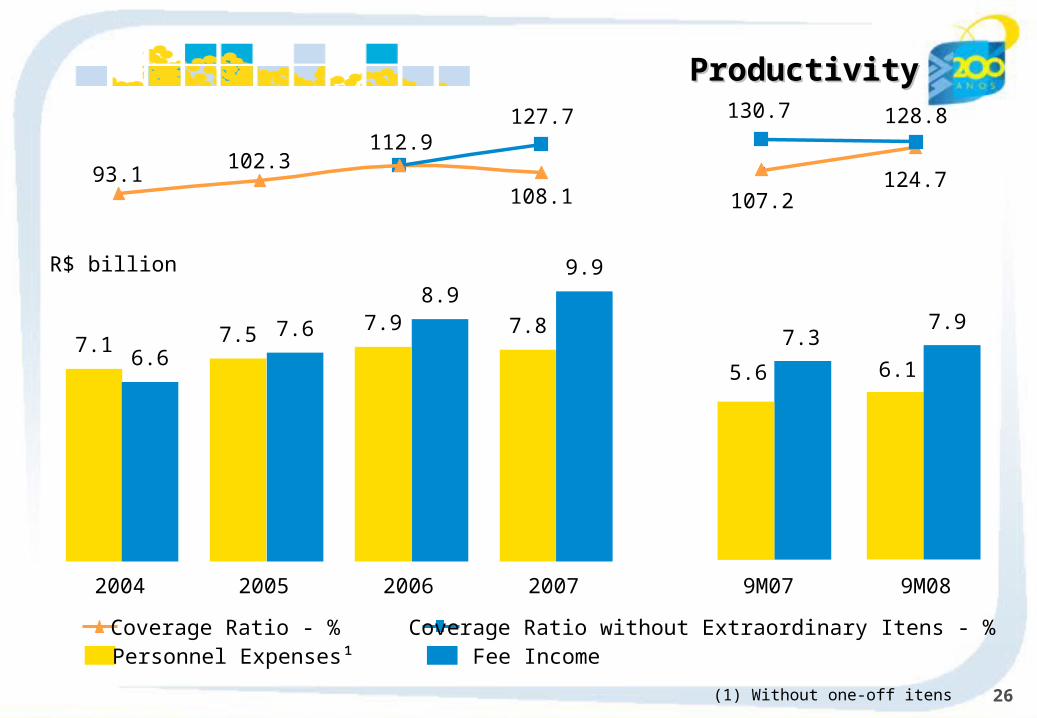
ProductivityProductivity
2004 2005 2006 2007
7.16.6
7.5 7.6 7.98.9
7.8
9.9
102.3
108.1
127.7
93.1
112.9
R$ billion
9M07 9M08
5.6 6.1
7.37.9
128.8130.7
107.2124.7
Coverage Ratio - %Personnel Expenses¹
Coverage Ratio without Extraordinary Itens - %Fee Income
(1) Without one-off itens
27
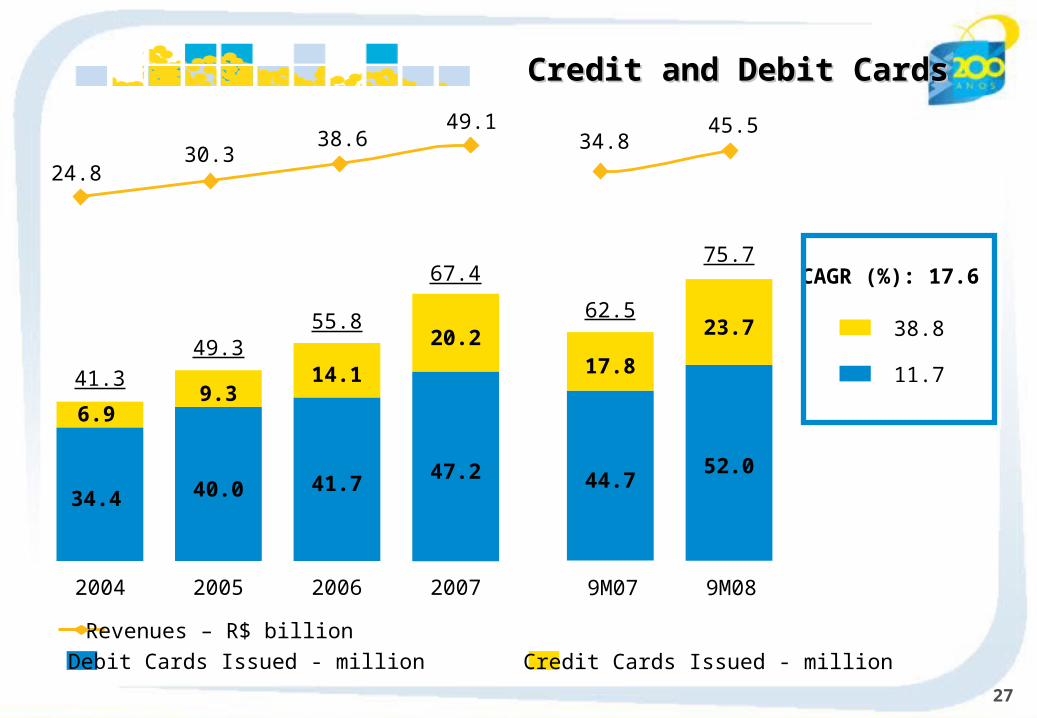
Credit and Debit CardsCredit and Debit Cards
CAGR (%): 17.6
38.8
11.7
2004
34.4
6.9
41.3
2005
40.0
9.3
49.3
2006
41.7
14.1
55.8
2007
47.2
20.2
67.4
9M07
44.7
17.8
62.5
52.0
23.7
9M08
75.7
Debit Cards Issued - million
Revenues – R$ billion
Credit Cards Issued - million
34.845.549.1
38.630.3
24.8
28
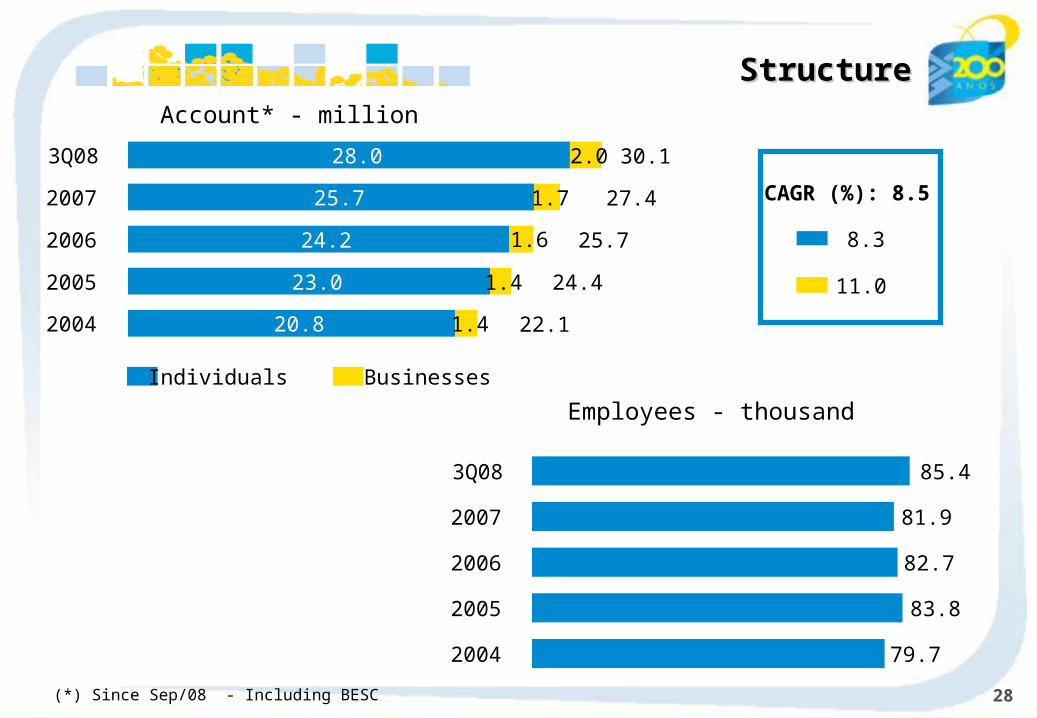
Individuals Businesses
Account* - million
CAGR (%): 8.5
8.3
11.0
StructureStructure
Employees - thousand
2004 22.120.8 1.4
2005 24.423.0 1.4
2006 25.724.2 1.6
2007 27.425.7 1.7
3Q08 30.128.0 2.0
2004 79.7
2005 83.8
2006 82.7
2007 81.9
3Q08 85.4
(*) Since Sep/08 - Including BESC
29
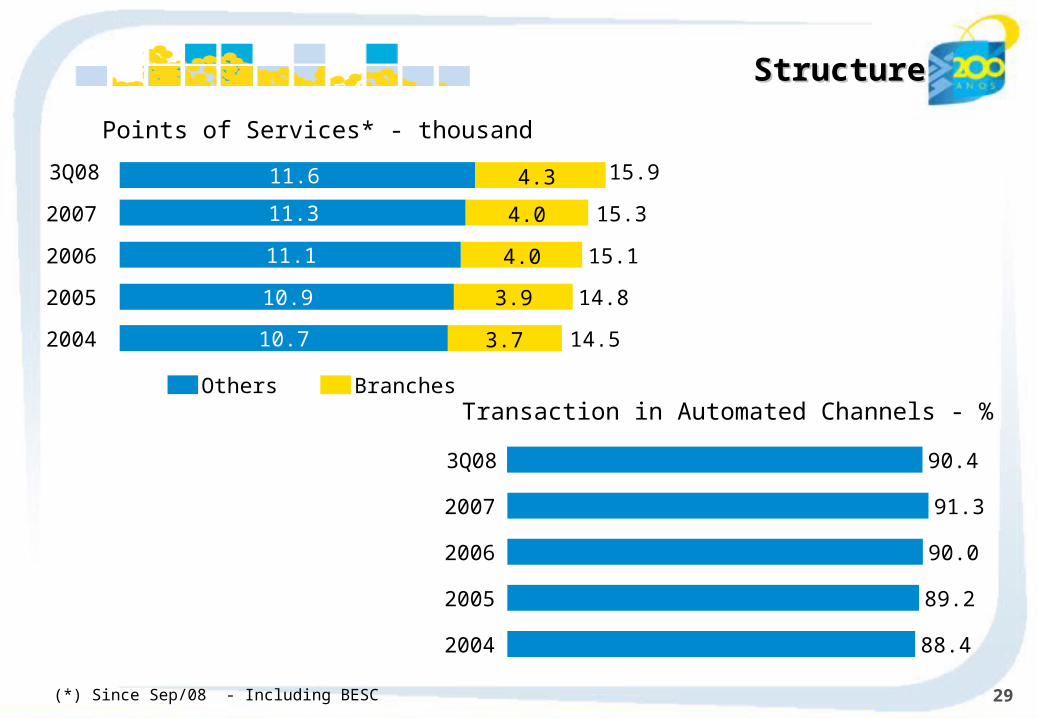
Others Branches
Points of Services* - thousand
88.42004
89.22005
90.02006
91.32007
Transaction in Automated Channels - %
StructureStructure
90.43Q08
2004 14.510.7 3.7
2005 14.810.9 3.9
2006 15.111.1 4.0
2007 15.311.3 4.0
3Q08 15.911.6
(*) Since Sep/08 - Including BESC
4.311.6
30
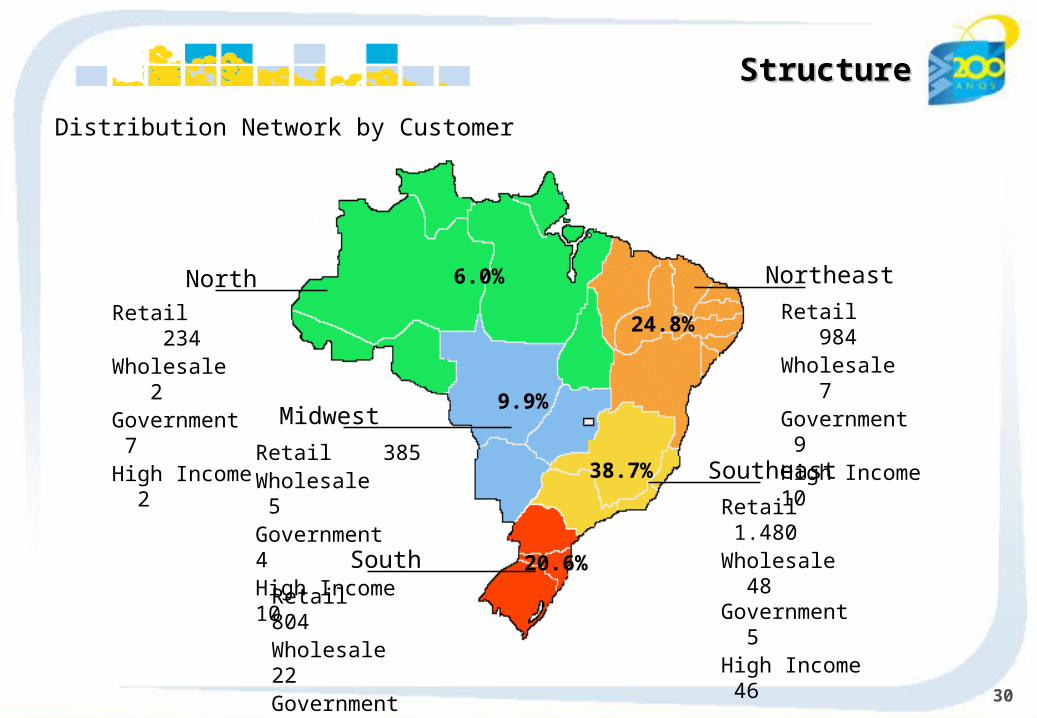
StructureStructure
Distribution Network by Customer
Northeast
Retail 984Wholesale 7Government 9High Income 10
Retail 1.480Wholesale 48 Government 5High Income 46Retail 804
Wholesale 22Government 3High Income 9
Retail 385Wholesale 5Government 4High Income 10
Retail 234Wholesale 2Government 7High Income 2
North
Midwest
South
Southeast
6.0%
9.9%
24.8%
38.7%
20.6%
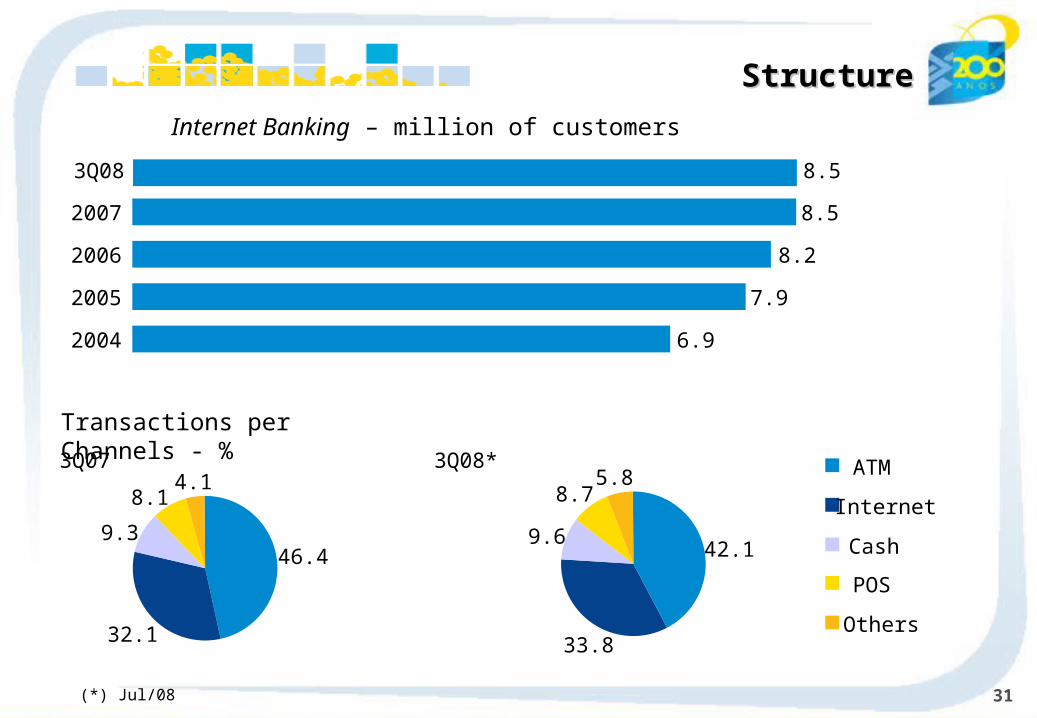
31
StructureStructure
Transactions per Channels - %
ATM
Internet
Cash
POS
Others
Internet Banking – million of customers
6.92004
7.92005
8.22006
8.52007
8.53Q08
3Q08*
42.1
33.8
9.6
8.75.8
3Q07
46.4
32.1
9.3
8.14.1
(*) Jul/08
32
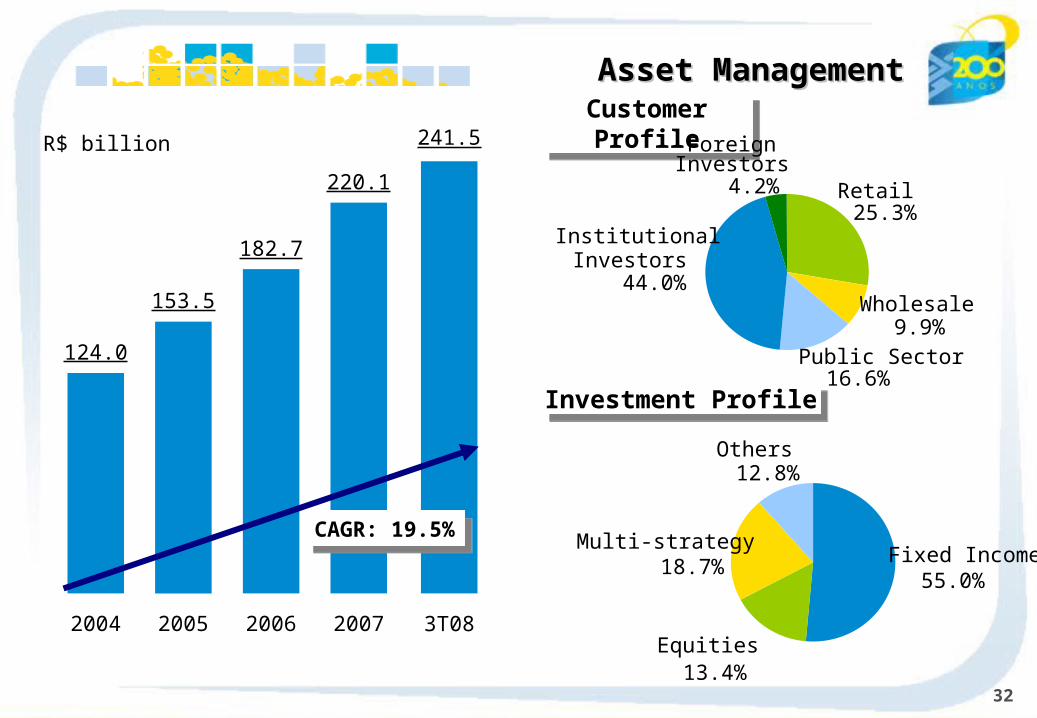
241.5
3T08
Asset ManagementAsset Management
124.0
2004
153.5
2005
182.7
2006
220.1
2007
CAGR: 19.5%CAGR: 19.5%
Customer ProfileCustomer Profile
Retail25.3%
Wholesale 9.9%
Public Sector16.6%
Institutional Investors
44.0%
Foreign Investors
4.2%
Investment ProfileInvestment Profile
Fixed Income55.0%
Equities13.4%
Multi-strategy18.7%
Others12.8%
R$ billion
33
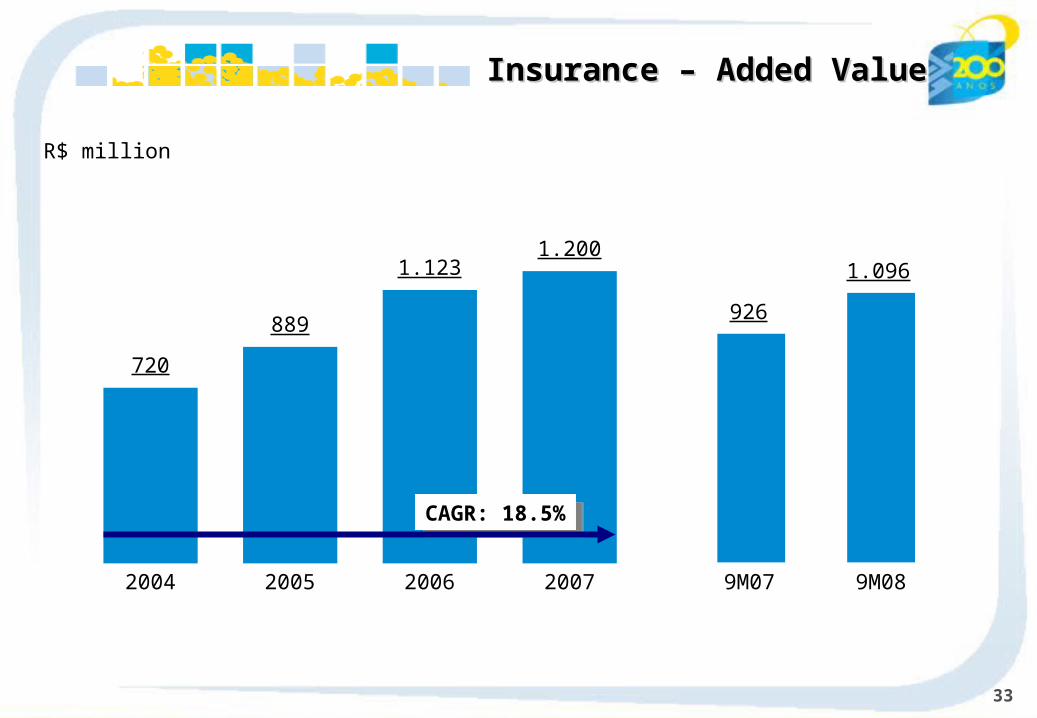
720
2004
889
2005
1.123
2006
1.200
2007 9M07 9M08
CAGR: 18.5%CAGR: 18.5%
R$ million
Insurance – Added ValueInsurance – Added Value
926
1.096
34
Investor Relations UnitSCN - Quadra 2 - Bloco A - 6th floor - Room 602
Ed. Corporate Financial Center70712-900 - Brasília (DF)Phone: 55 (61) 3101.8781
Fax: 55 (61) 3101.8793
DisclaimerDisclaimer - This presentation contains references and statements. planned synergies, increasing estimates, projections of results and future strategy for Banco do Brasil, it’s Associated and Affiliated Companies and Subsidiaries. Although these
references and statements reflect the management’s belief, it also involves imprecision and high difficult risks to be foreseen, consequently, it may conduct to a different result than the one anticipated here. These expectations are highly depended on market conditions, on the Brazilian economic performance, on the sector and the international market. Banco do Brasil is not
responsible for bringing up to date any estimate in this presentation.
For further information access www.bb.com.br/ir