Embed Size (px)
Citation preview

9
Ballistics Image Processing and Analysis for Firearm Identification
Dongguang Li School of Computer and Security Science
Faculty of Computing, Health and Science
Edith Cowan University
2 Bradford Street, Mount Lawley,
Western Australia 6050
1. Introduction
The identification of firearms from forensic ballistics specimens is an exacting and intensive
activity performed by specialists with extensive experience. The introduction of imaging
technology to assist the identification process of firearms has enhanced the ability of forensic
ballisticians to conduct analyses of these specimens for identification.
The positive identification of ballistics specimens from imaging systems are important
applications of technology in criminal investigation [1] [2] [3] [4]. While the image capture
methodology for persons and forensic ballistics specimens is similar, the process of
identification for each is dependent upon the level of certainty required for the
identification.
The forensic identification of ballistics specimens relies on the detection, recognition and
ultimate matching of markings on the surfaces of cartridges and projectiles made by the
firearms [5]. Traditional methods for the comparison of these marks are based on incident
light microscopy. The image formed from the oblique illumination of the mark gives a
representation of the surface of the specimen in the region of the mark [6]. This
representation is critically dependent on the material of the surface on which the marks
have been made, and the geometry and intensity of the illumination system. The assessment
by the ballistician of the similarity between comparable marks on respective ballistics
specimens from crime scenes and test firings will be based on the expertise and experience
of the technologist. Thus the traditional method of matching markings has inherent
difficulties, and entails an element of subjectivity [7].
The need for firearm identification systems by police services continues to increase with
greater accessibility to weapons in the international contexts. The characteristic markings on
the cartridge and projectile of a bullet fired from a gun can be recognized as a fingerprint for
identification of the firearm [8]. Forensic ballistics imaging has the capacity to produce high-
resolution digital images of cartridge cases and projectiles for matching to a library of
ballistics images [9]. However, the reliance upon imaging technologies makes identification
of ballistics specimens both a demanding and exacting task, where the control of the error of
Source: Image Processing, Book edited by: Yung-Sheng Chen, ISBN 978-953-307-026-1, pp. 572, December 2009, INTECH, Croatia, downloaded from SCIYO.COM
www.intechopen.com
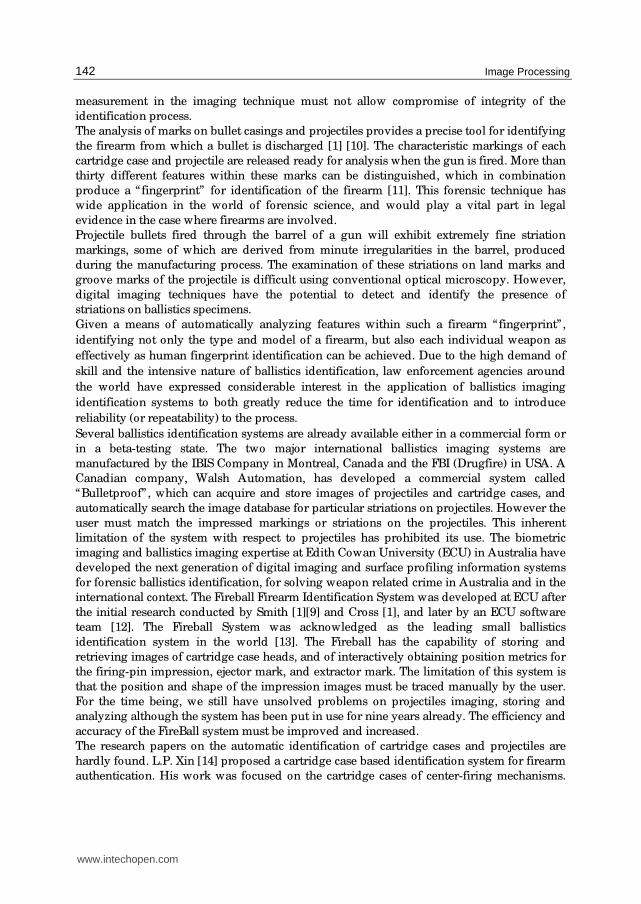
Image Processing
142
measurement in the imaging technique must not allow compromise of integrity of the
identification process.
The analysis of marks on bullet casings and projectiles provides a precise tool for identifying
the firearm from which a bullet is discharged [1] [10]. The characteristic markings of each
cartridge case and projectile are released ready for analysis when the gun is fired. More than
thirty different features within these marks can be distinguished, which in combination
produce a “ fingerprint” for identification of the firearm [11]. This forensic technique has
wide application in the world of forensic science, and would play a vital part in legal
evidence in the case where firearms are involved.
Projectile bullets fired through the barrel of a gun will exhibit extremely fine striation
markings, some of which are derived from minute irregularities in the barrel, produced
during the manufacturing process. The examination of these striations on land marks and
groove marks of the projectile is difficult using conventional optical microscopy. However,
digital imaging techniques have the potential to detect and identify the presence of
striations on ballistics specimens.
Given a means of automatically analyzing features within such a firearm “fingerprint” ,
identifying not only the type and model of a firearm, but also each individual weapon as
effectively as human fingerprint identification can be achieved. Due to the high demand of
skill and the intensive nature of ballistics identification, law enforcement agencies around
the world have expressed considerable interest in the application of ballistics imaging
identification systems to both greatly reduce the time for identification and to introduce
reliability (or repeatability) to the process.
Several ballistics identification systems are already available either in a commercial form or
in a beta-testing state. The two major international ballistics imaging systems are
manufactured by the IBIS Company in Montreal, Canada and the FBI (Drugfire) in USA. A
Canadian company, Walsh Automation, has developed a commercial system called
“Bulletproof” , which can acquire and store images of projectiles and cartridge cases, and
automatically search the image database for particular striations on projectiles. However the
user must match the impressed markings or striations on the projectiles. This inherent
limitation of the system with respect to projectiles has prohibited its use. The biometric
imaging and ballistics imaging expertise at Edith Cowan University (ECU) in Australia have
developed the next generation of digital imaging and surface profiling information systems
for forensic ballistics identification, for solving weapon related crime in Australia and in the
international context. The Fireball Firearm Identification System was developed at ECU after
the initial research conducted by Smith [1][9] and Cross [1], and later by an ECU software
team [12]. The Fireball System was acknowledged as the leading small ballistics
identification system in the world [13]. The Fireball has the capability of storing and
retrieving images of cartridge case heads, and of interactively obtaining position metrics for
the firing-pin impression, ejector mark, and extractor mark. The limitation of this system is
that the position and shape of the impression images must be traced manually by the user.
For the time being, we still have unsolved problems on projectiles imaging, storing and
analyzing although the system has been put in use for nine years already. The efficiency and
accuracy of the FireBall system must be improved and increased.
The research papers on the automatic identification of cartridge cases and projectiles are
hardly found. L.P. Xin [14] proposed a cartridge case based identification system for firearm
authentication. His work was focused on the cartridge cases of center-firing mechanisms.
www.intechopen.com
Ballistics Image Processing and Analysis for Firearm Identification
143
And he also provided a decision strategy by which the high recognition rate would be
achieved interactively. C. Kou et al. [15] described a neural network based model for the
identification of chambering marks on cartridge cases. But no experimental results were
given in their paper. Using a hierarchical neural network model, a system for identifying the
firing pin marks of cartridge cases images automatically is proposed in this paper. We
mainly focus on the consideration of rim-firing pin mark identification. A significant
contribution towards the efficient and precise identification of cartridge cases in the further
processing, such as the locating and coding of ejector marks, extractor marks and
chambering marks of cartridge cases will be made through this system. The SOFM neural
network and the methods of image processing in our study is described briefly in Section 4.
The identification of the ballistics specimen from the crime scene with the test specimen is
traditionally conducted by mapping the marks by visual images from a low-powered optical
microscope (Fig. 1). The selection of features within the identifying mark is chosen for their
apparent uniqueness in an attempt to match both crime scene and test specimens. A
decision is made whether the same firearm was responsible for making the marks under
examination on the crime scene and test ballistics specimens. The selection of the mark or set
of marks for examination and comparison is a critical step in the identification process, and
has the capacity to influence subsequent stages in the comparison process [2].
Fig. 1. Landmarks and groove marks of a fired projectile
However, optical and photonic techniques have the capability of a quantum improvement
in quality of images for comparison, and as a result will enhance reliability and validity of
www.intechopen.com
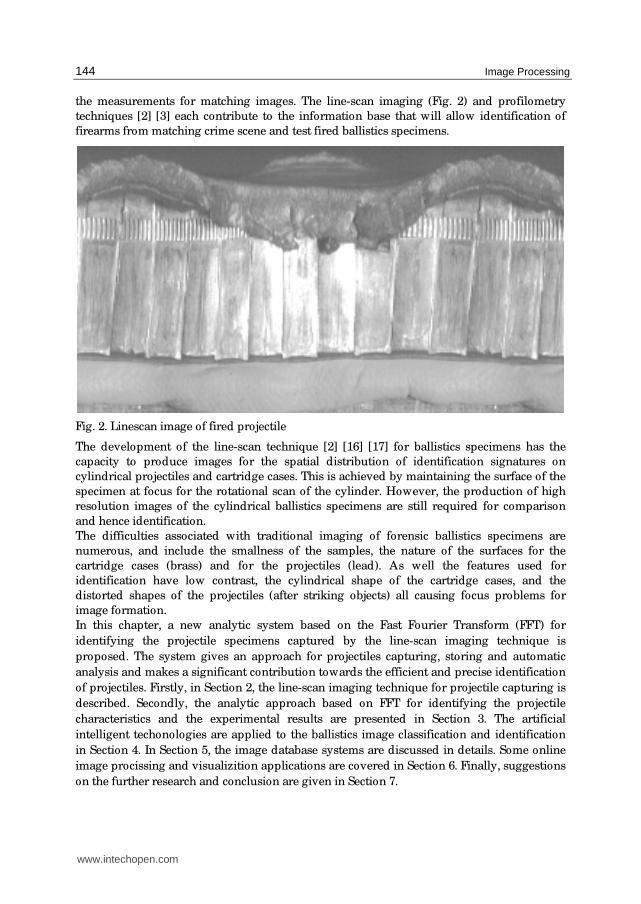
Image Processing
144
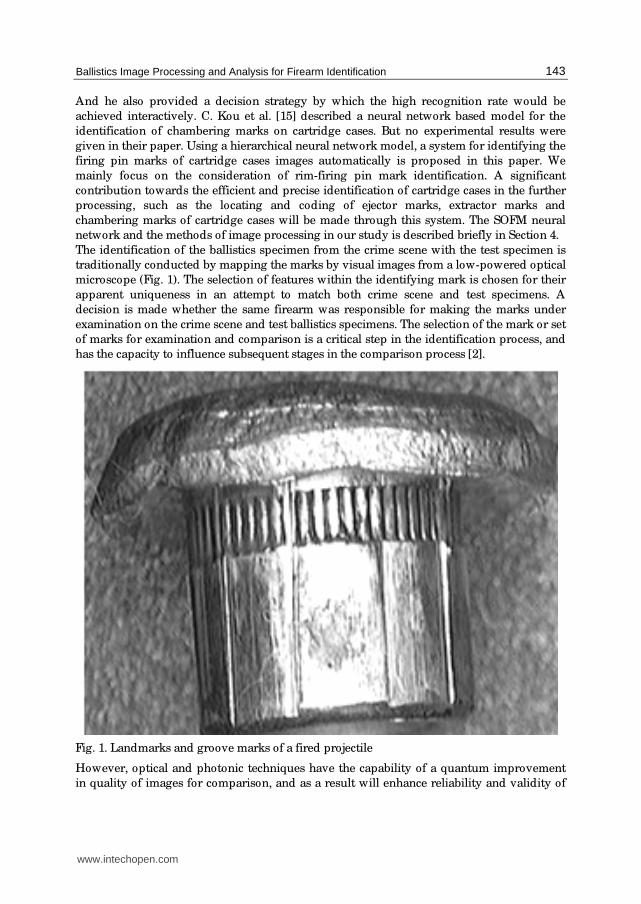
the measurements for matching images. The line-scan imaging (Fig. 2) and profilometry
techniques [2] [3] each contribute to the information base that will allow identification of
firearms from matching crime scene and test fired ballistics specimens.
Fig. 2. Linescan image of fired projectile
The development of the line-scan technique [2] [16] [17] for ballistics specimens has the
capacity to produce images for the spatial distribution of identification signatures on
cylindrical projectiles and cartridge cases. This is achieved by maintaining the surface of the
specimen at focus for the rotational scan of the cylinder. However, the production of high
resolution images of the cylindrical ballistics specimens are still required for comparison
and hence identification.
The difficulties associated with traditional imaging of forensic ballistics specimens are
numerous, and include the smallness of the samples, the nature of the surfaces for the
cartridge cases (brass) and for the projectiles (lead). As well the features used for
identification have low contrast, the cylindrical shape of the cartridge cases, and the
distorted shapes of the projectiles (after striking objects) all causing focus problems for
image formation.
In this chapter, a new analytic system based on the Fast Fourier Transform (FFT) for
identifying the projectile specimens captured by the line-scan imaging technique is
proposed. The system gives an approach for projectiles capturing, storing and automatic
analysis and makes a significant contribution towards the efficient and precise identification
of projectiles. Firstly, in Section 2, the line-scan imaging technique for projectile capturing is
described. Secondly, the analytic approach based on FFT for identifying the projectile
characteristics and the experimental results are presented in Section 3. The artificial
intelligent techonologies are applied to the ballistics image classification and identification
in Section 4. In Section 5, the image database systems are discussed in details. Some online
image procissing and visualizition applications are covered in Section 6. Finally, suggestions
on the further research and conclusion are given in Section 7.
www.intechopen.com

Ballistics Image Processing and Analysis for Firearm Identification
145
2. Line-scan imaging technique for projectile capturing
The proposed analysis system for identifying firearms based on the projectiles images is
composed of three parts (shown in Fig. 3), and each part is described in detail in following
sections.
Fig. 3. The proposed analysis system for firearm identification based on projectiles
2.1 Line-scan Imaging Due to the expected high contrast imaging involved in imaging the cylindrical shapes of
ballistics specimens, the traditional optical microscopy technique is inherently unsuitable.
As the specimen is translated and rotated [17], it is difficult to maintain image quality using
oblique lighting on a cylindrical surface at low magnification microscopy. However, in
order to obtain the surface information from a cylindrical shaped surface, a line-scan
imaging technique is used by scanning consecutive columns of picture information and
storing the data in a frame buffer so that a 2D image of the surface of the cylindrical
specimen is produced.
The precursor-imaging device to the line-scan camera is the periphery camera, which
consists of a slit camera with moving film in order to ‘unwrap’ cylindrical objects by
rotating them on a turntable [18]. Relative motion between the line array of sensors in the
line-scan camera and the surface being inspected is the feature of the line-scan technique. To
achieve this relative motion, the cylindrical ballistics specimen relative to the stationary line
array sensors are rotated [17][18][19][20].
Due to the line-scan technique, all points on the imaging line of the sample are in focus. This
is because the cylindrical ballistics specimen is rotated about an axis of rotation relative to a
stationary line array of sensor. Thus, during one full rotation of the cylindrical ballistics
specimen, all points on the rotating surface will be captured on the collated image. [17].
The line-scan imaging analysis system for projectiles in our study is shown in Fig. 4. The
stepper motor rotates with 360 degrees/ 2400 steps, namely 0.15 degree each step. The 0.15
degree stepper motor is used in order to acquire sufficient details from the surface of the
projectile. For example, a projectile with a diameter of 5-15mm has a perimeter range of 15-
50mm roughly. With 2400 steps a round the lowest resolution of the line-scan image will
still be 2400/ 50=48 lines per mm. A CCD camera (Sony, Model DXC-151AP) is used instead
of the traditional camera used in [17] [18]. The graphic capturing card installed in the PC has
an image size of 320× 240 pixels. A ring light source (Leica 30120202) is adopted, which can
provide uniform lighting conditions [21]. The optical system used was just a standard
optical microscope (Leica MZ6).
Being quite different from the method used in [17] [18], the procedure in our line-scan
imaging approach is as follows:
1. With the stepper motor’s every step
2. the CCD camera captures the current image of projectile specimen and
3. sends the image to Graphic card in PC;
4. The middle column of pixels in this image is extracted and saved consecutively in an
array in the buffer on PC, and
Spectrum
AnalysisIdentification Projectile
Specimen
Line-scan
Imaging
www.intechopen.com
Image Processing
146
5. steps 1. and 2. are repeated until the whole surface of the projectile specimen is scanned;
6. The array in the buffer is used to produce a 2-D line-scanned image for the whole
surface of the projectile.
Fig. 4. The line-scan imaging and analyzing system
The resolution of the line-scan image is dependent on,
• the rotational degree per step of the stepper motor
• the resolution of CCD camera
• the resolution of graphic capturing card
• the columns captured at each step in step
By adjusting the length of each step of the stepper motor and the number of columns
captured in each step to meet forensic investigation requirements, the resolution of the line-
scanned image of projectile specimen could be manipulated. The resolution required to
detect the major striations on land marks and groove marks is not necessary to be very high.
The line-scan image resolution is set by the rotational steps and sizes of the projectile
specimen.
2.2 Projectile specimens and their line-scanned images The projectile specimens in our study, provided by Western Australia Police Department,
are in four classes and belong to four different guns. They are:
1. Browning, semiautomatic pistol, caliber 9mm.
2. Norinco, semiautomatic pistol, caliber 9mm.
3. and 4. Long Rifle, semiautomatic pistol, caliber 22 (5.59mm).
Through the use of the line scan imaging technique as discussed in Section 2.1, all the
projectile specimens in our study are recorded under the same conditions (e.g light
conditions, the stepping angle of the stepper motor etc…). All the landmarks and groove
marks of projectile specimen are captured and displayed in the line scanned image through
adjusting the stepping angle of the stepper motor by just one full rotation (360 degrees).
CCD camera
Microscope
Ring-light source
Projectile specimen
Stepper motor
PC with graphic card
Projectile on screen
Rotating
www.intechopen.com
Ballistics Image Processing and Analysis for Firearm Identification
147
a
b
c
d
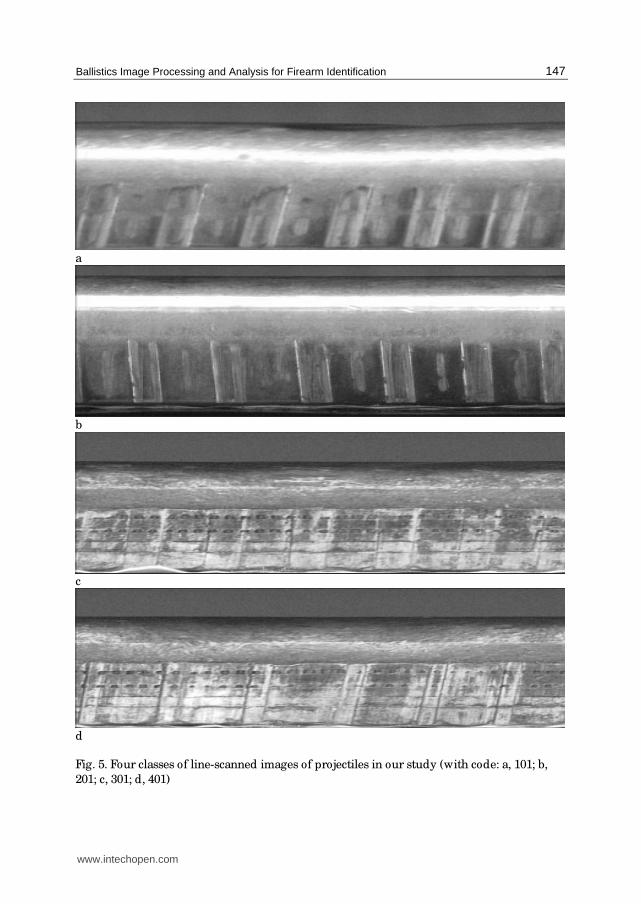
Fig. 5. Four classes of line-scanned images of projectiles in our study (with code: a, 101; b,
201; c, 301; d, 401)
www.intechopen.com
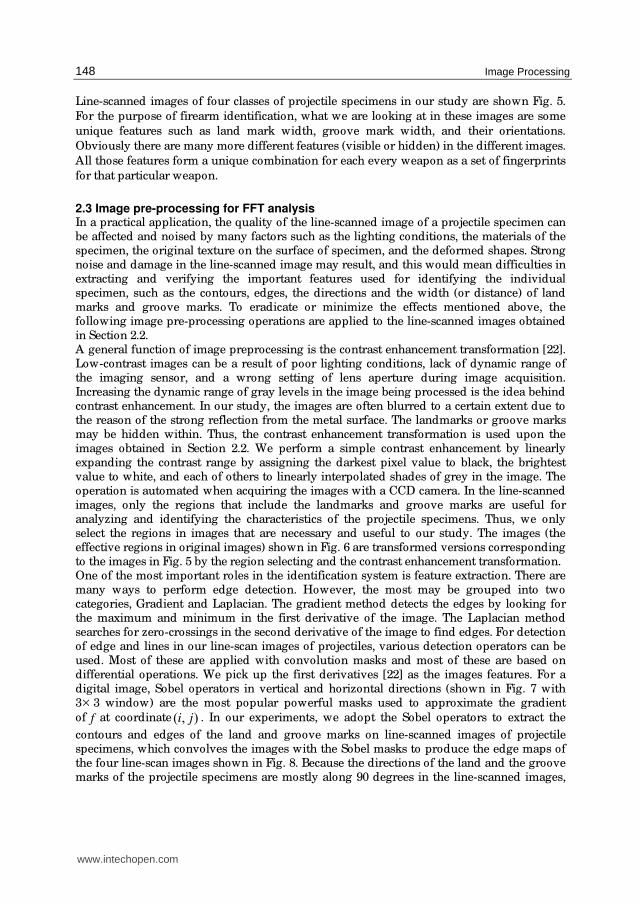
Image Processing
148
Line-scanned images of four classes of projectile specimens in our study are shown Fig. 5.
For the purpose of firearm identification, what we are looking at in these images are some
unique features such as land mark width, groove mark width, and their orientations.
Obviously there are many more different features (visible or hidden) in the different images.
All those features form a unique combination for each every weapon as a set of fingerprints
for that particular weapon.
2.3 Image pre-processing for FFT analysis In a practical application, the quality of the line-scanned image of a projectile specimen can be affected and noised by many factors such as the lighting conditions, the materials of the specimen, the original texture on the surface of specimen, and the deformed shapes. Strong noise and damage in the line-scanned image may result, and this would mean difficulties in extracting and verifying the important features used for identifying the individual specimen, such as the contours, edges, the directions and the width (or distance) of land marks and groove marks. To eradicate or minimize the effects mentioned above, the following image pre-processing operations are applied to the line-scanned images obtained
in Section 2.2. A general function of image preprocessing is the contrast enhancement transformation [22]. Low-contrast images can be a result of poor lighting conditions, lack of dynamic range of the imaging sensor, and a wrong setting of lens aperture during image acquisition. Increasing the dynamic range of gray levels in the image being processed is the idea behind contrast enhancement. In our study, the images are often blurred to a certain extent due to the reason of the strong reflection from the metal surface. The landmarks or groove marks may be hidden within. Thus, the contrast enhancement transformation is used upon the images obtained in Section 2.2. We perform a simple contrast enhancement by linearly expanding the contrast range by assigning the darkest pixel value to black, the brightest value to white, and each of others to linearly interpolated shades of grey in the image. The operation is automated when acquiring the images with a CCD camera. In the line-scanned
images, only the regions that include the landmarks and groove marks are useful for analyzing and identifying the characteristics of the projectile specimens. Thus, we only select the regions in images that are necessary and useful to our study. The images (the effective regions in original images) shown in Fig. 6 are transformed versions corresponding to the images in Fig. 5 by the region selecting and the contrast enhancement transformation. One of the most important roles in the identification system is feature extraction. There are many ways to perform edge detection. However, the most may be grouped into two categories, Gradient and Laplacian. The gradient method detects the edges by looking for the maximum and minimum in the first derivative of the image. The Laplacian method searches for zero-crossings in the second derivative of the image to find edges. For detection of edge and lines in our line-scan images of projectiles, various detection operators can be used. Most of these are applied with convolution masks and most of these are based on
differential operations. We pick up the first derivatives [22] as the images features. For a digital image, Sobel operators in vertical and horizontal directions (shown in Fig. 7 with 3× 3 window) are the most popular powerful masks used to approximate the gradient
of f at coordinate ),( ji . In our experiments, we adopt the Sobel operators to extract the
contours and edges of the land and groove marks on line-scanned images of projectile specimens, which convolves the images with the Sobel masks to produce the edge maps of the four line-scan images shown in Fig. 8. Because the directions of the land and the groove marks of the projectile specimens are mostly along 90 degrees in the line-scanned images,
www.intechopen.com
Ballistics Image Processing and Analysis for Firearm Identification
149
a
b
c
d
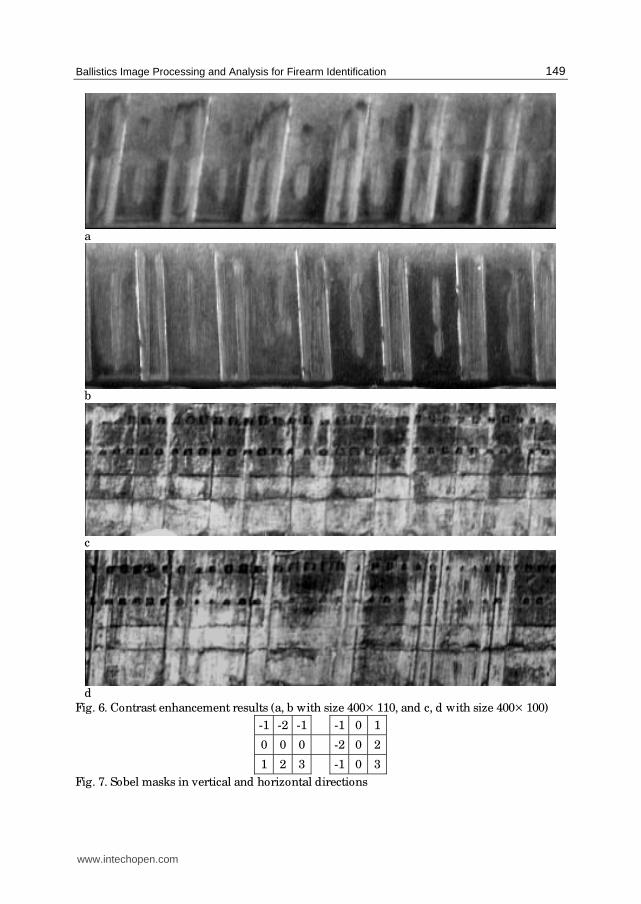
Fig. 6. Contrast enhancement results (a, b with size 400× 110, and c, d with size 400× 100)
-1 -2 -1 -1 0 1
0 0 0 -2 0 2
1 2 3 -1 0 3
Fig. 7. Sobel masks in vertical and horizontal directions
www.intechopen.com
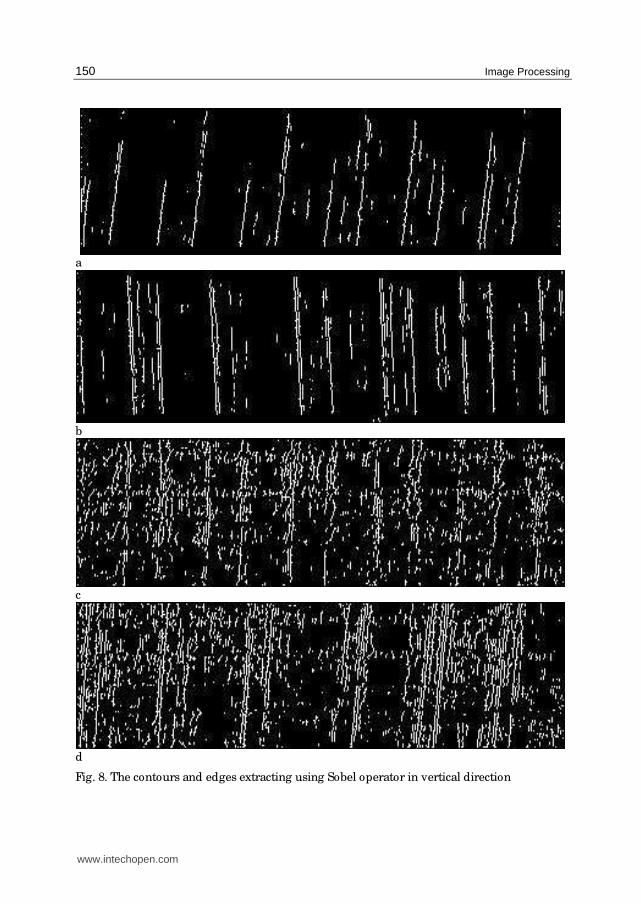
Image Processing
150
a
b
c
d
Fig. 8. The contours and edges extracting using Sobel operator in vertical direction
www.intechopen.com

Ballistics Image Processing and Analysis for Firearm Identification
151
we only adopt the vertical direction mask (Fig. 7) for extracting the features of the line-
scanned images. Through an observation of Fig. 8 in which there are lots of noises and
disconnection on the land and groove marks, the conventional spatial techniques are not
suitable for the nature of locally. Hence, a FFT-based analysis for projectiles is introduced.
a
b
c
d
Fig. 9. Fourier transformation results of the images in Fig. 8
www.intechopen.com

Image Processing
152
3. FFT-based analysis
3.1 FFT and spectrum analysis
The Fourier transform of a two-dimensional, discrete function (image), ),( yxf , of
size NM × , is given by the equation
∑ ∑−=
−=
+−= 1
0
1
0
)//(2 ),(1
),(M
x
N
y
NvyMuxjeyxf
MNvuF
π (1)
where 1−=j , for all 1 , ,2 ,1 ,0 −= Mu A , 1 , ,2 ,1 ,0 −= Nv A . We define the Fourier
spectrum by the equation
[ ] 21
22 ),(),(|),(| vuIvuRvuF += (2)
where ),( vuR and ),( vuI are the real and imaginary parts of ),( vuF , respectively.
For describing the directionality of periodic or almost periodic 2-D patterns in an image, the
Fourier spectrum is ideal. As easily distinguishable as concentrations of high-energy burst in
the spectrum, these global texture patterns are generally not convenient to detect with
spatial methods because of the local nature of these techniques. In the feature extraction
process some of texture descriptors are considered both in Fourier and spatial domains. It is
noticed that some of spatial domain descriptors can be used with success for geology
recordings where the image appears to be very similar to the one in this research [23].
For the specific research interests in this study we only consider a set of features of the
Fourier spectrum that are used for analyzing and describing the line-scanned images of
projectiles:
1. Principal direction of the texture patterns are shown by prominent peaks in the
spectrum.
2. Fundamental spatial period of the patterns are shown by the location of the peaks in the
frequency plane.
3. Some statistical features of the spectrum.
By expressing the spectrum in polar coordinates to yield a function ),( θrS , where S is the
spectrum function, and r and θ are the variables in this coordinate system, detection and
interpretation of the spectrum features just mentioned often are simplified. For each
directionθ , ),( θrS is a 1-D function )(rSθ . Similarly, for each frequency r , )(θrS is a 1-
D function. Analyzing )(rSθ for a fixed value of θ yields the behavior of the spectrum
(such as the presence of peaks) along a radial direction from the origin, whereas analyzing
)(θrS for a fixed value of r yields the behavior along a circle centered on the origin. A
more global description is obtained by integrating (summing for discrete variables) these
functions [22]:
∑ == πθ θ0
)()( rSrS (3)
and
∑ == 0
1)()(
R
r rSS θθ (4)
www.intechopen.com
Ballistics Image Processing and Analysis for Firearm Identification
153
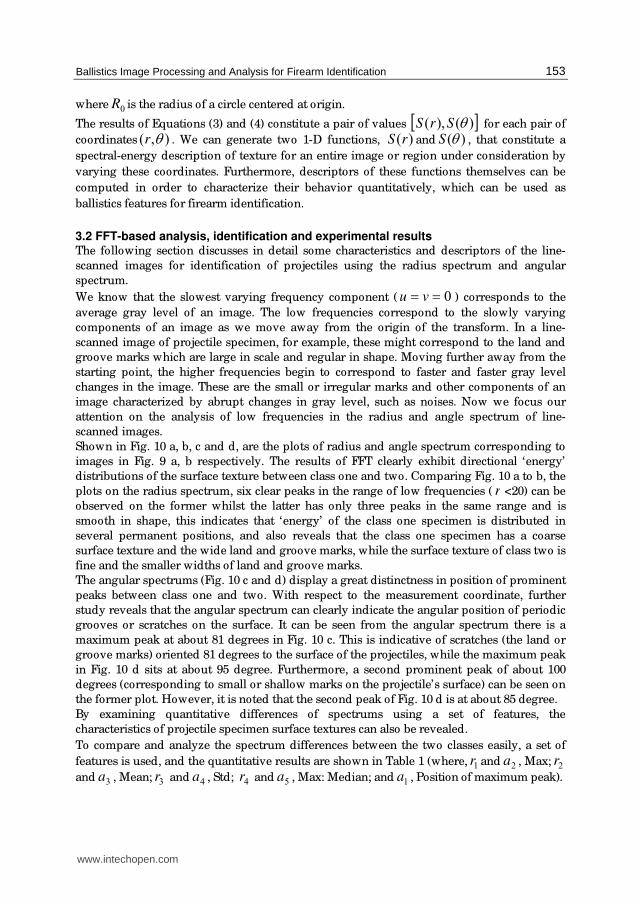
where 0R is the radius of a circle centered at origin.
The results of Equations (3) and (4) constitute a pair of values [ ])(),( θSrS for each pair of
coordinates ),( θr . We can generate two 1-D functions, )(rS and )(θS , that constitute a
spectral-energy description of texture for an entire image or region under consideration by
varying these coordinates. Furthermore, descriptors of these functions themselves can be
computed in order to characterize their behavior quantitatively, which can be used as
ballistics features for firearm identification.
3.2 FFT-based analysis, identification and experimental results The following section discusses in detail some characteristics and descriptors of the line-
scanned images for identification of projectiles using the radius spectrum and angular
spectrum.
We know that the slowest varying frequency component ( 0== vu ) corresponds to the
average gray level of an image. The low frequencies correspond to the slowly varying
components of an image as we move away from the origin of the transform. In a line-
scanned image of projectile specimen, for example, these might correspond to the land and
groove marks which are large in scale and regular in shape. Moving further away from the
starting point, the higher frequencies begin to correspond to faster and faster gray level
changes in the image. These are the small or irregular marks and other components of an
image characterized by abrupt changes in gray level, such as noises. Now we focus our
attention on the analysis of low frequencies in the radius and angle spectrum of line-
scanned images.
Shown in Fig. 10 a, b, c and d, are the plots of radius and angle spectrum corresponding to
images in Fig. 9 a, b respectively. The results of FFT clearly exhibit directional ‘energy’
distributions of the surface texture between class one and two. Comparing Fig. 10 a to b, the
plots on the radius spectrum, six clear peaks in the range of low frequencies ( r <20) can be
observed on the former whilst the latter has only three peaks in the same range and is
smooth in shape, this indicates that ‘energy’ of the class one specimen is distributed in
several permanent positions, and also reveals that the class one specimen has a coarse
surface texture and the wide land and groove marks, while the surface texture of class two is
fine and the smaller widths of land and groove marks.
The angular spectrums (Fig. 10 c and d) display a great distinctness in position of prominent
peaks between class one and two. With respect to the measurement coordinate, further
study reveals that the angular spectrum can clearly indicate the angular position of periodic
grooves or scratches on the surface. It can be seen from the angular spectrum there is a
maximum peak at about 81 degrees in Fig. 10 c. This is indicative of scratches (the land or
groove marks) oriented 81 degrees to the surface of the projectiles, while the maximum peak
in Fig. 10 d sits at about 95 degree. Furthermore, a second prominent peak of about 100
degrees (corresponding to small or shallow marks on the projectile’s surface) can be seen on
the former plot. However, it is noted that the second peak of Fig. 10 d is at about 85 degree.
By examining quantitative differences of spectrums using a set of features, the
characteristics of projectile specimen surface textures can also be revealed.
To compare and analyze the spectrum differences between the two classes easily, a set of
features is used, and the quantitative results are shown in Table 1 (where, 1r and 2a , Max; 2r
and 3a , Mean; 3r and 4a , Std; 4r and 5a , Max: Median; and 1a , Position of maximum peak).
www.intechopen.com
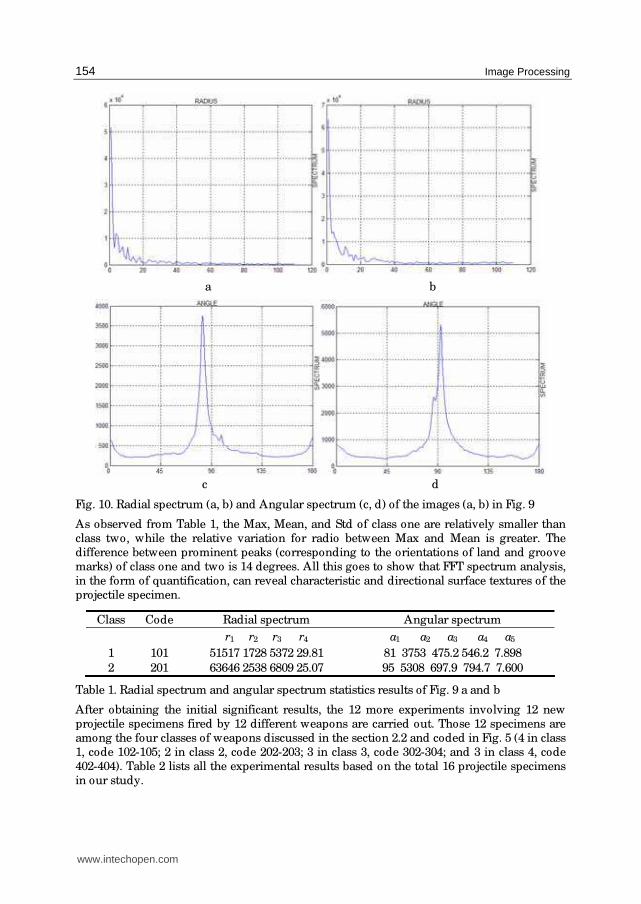
Image Processing
154
a b
c d
Fig. 10. Radial spectrum (a, b) and Angular spectrum (c, d) of the images (a, b) in Fig. 9
As observed from Table 1, the Max, Mean, and Std of class one are relatively smaller than class two, while the relative variation for radio between Max and Mean is greater. The difference between prominent peaks (corresponding to the orientations of land and groove marks) of class one and two is 14 degrees. All this goes to show that FFT spectrum analysis,
in the form of quantification, can reveal characteristic and directional surface textures of the projectile specimen.
Class Code Radial spectrum Angular spectrum
r1 r2 r3 r4 a1 a2 a3 a4 a5
1 101 51517 1728 5372 29.81 81 3753 475.2 546.2 7.898
2 201 63646 2538 6809 25.07 95 5308 697.9 794.7 7.600
Table 1. Radial spectrum and angular spectrum statistics results of Fig. 9 a and b
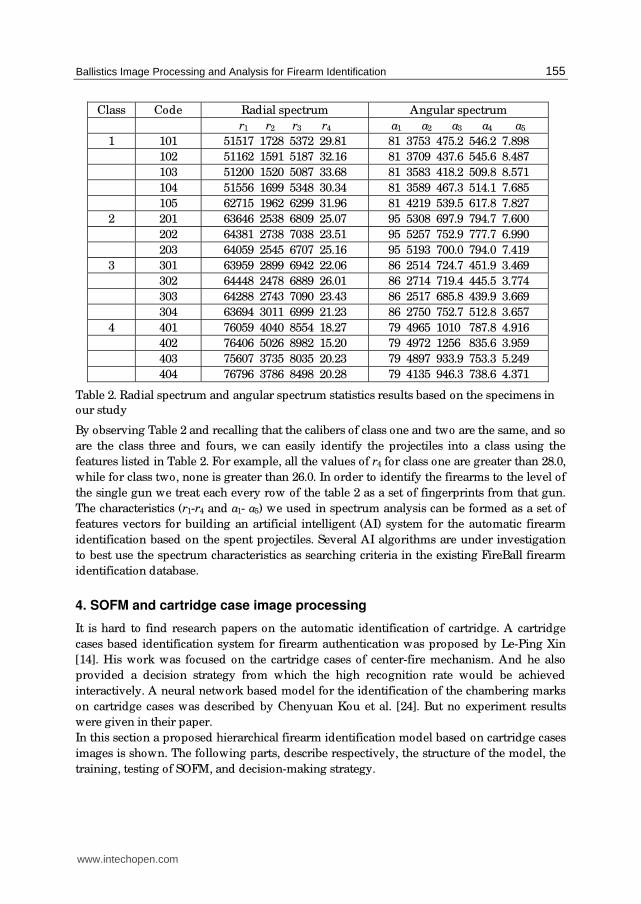
After obtaining the initial significant results, the 12 more experiments involving 12 new projectile specimens fired by 12 different weapons are carried out. Those 12 specimens are among the four classes of weapons discussed in the section 2.2 and coded in Fig. 5 (4 in class 1, code 102-105; 2 in class 2, code 202-203; 3 in class 3, code 302-304; and 3 in class 4, code
402-404). Table 2 lists all the experimental results based on the total 16 projectile specimens in our study.
www.intechopen.com
Ballistics Image Processing and Analysis for Firearm Identification
155
Class Code Radial spectrum Angular spectrum
r1 r2 r3 r4 a1 a2 a3 a4 a5
1 101 51517 1728 5372 29.81 81 3753 475.2 546.2 7.898
102 51162 1591 5187 32.16 81 3709 437.6 545.6 8.487
103 51200 1520 5087 33.68 81 3583 418.2 509.8 8.571
104 51556 1699 5348 30.34 81 3589 467.3 514.1 7.685
105 62715 1962 6299 31.96 81 4219 539.5 617.8 7.827
2 201 63646 2538 6809 25.07 95 5308 697.9 794.7 7.600
202 64381 2738 7038 23.51 95 5257 752.9 777.7 6.990
203 64059 2545 6707 25.16 95 5193 700.0 794.0 7.419
3 301 63959 2899 6942 22.06 86 2514 724.7 451.9 3.469
302 64448 2478 6889 26.01 86 2714 719.4 445.5 3.774
303 64288 2743 7090 23.43 86 2517 685.8 439.9 3.669
304 63694 3011 6999 21.23 86 2750 752.7 512.8 3.657
4 401 76059 4040 8554 18.27 79 4965 1010 787.8 4.916
402 76406 5026 8982 15.20 79 4972 1256 835.6 3.959
403 75607 3735 8035 20.23 79 4897 933.9 753.3 5.249
404 76796 3786 8498 20.28 79 4135 946.3 738.6 4.371
Table 2. Radial spectrum and angular spectrum statistics results based on the specimens in
our study
By observing Table 2 and recalling that the calibers of class one and two are the same, and so
are the class three and fours, we can easily identify the projectiles into a class using the
features listed in Table 2. For example, all the values of r4 for class one are greater than 28.0,
while for class two, none is greater than 26.0. In order to identify the firearms to the level of
the single gun we treat each every row of the table 2 as a set of fingerprints from that gun.
The characteristics (r1-r4 and a1- a5) we used in spectrum analysis can be formed as a set of
features vectors for building an artificial intelligent (AI) system for the automatic firearm
identification based on the spent projectiles. Several AI algorithms are under investigation
to best use the spectrum characteristics as searching criteria in the existing FireBall firearm
identification database.
4. SOFM and cartridge case image processing
It is hard to find research papers on the automatic identification of cartridge. A cartridge
cases based identification system for firearm authentication was proposed by Le-Ping Xin
[14]. His work was focused on the cartridge cases of center-fire mechanism. And he also
provided a decision strategy from which the high recognition rate would be achieved
interactively. A neural network based model for the identification of the chambering marks
on cartridge cases was described by Chenyuan Kou et al. [24]. But no experiment results
were given in their paper.
In this section a proposed hierarchical firearm identification model based on cartridge cases
images is shown. The following parts, describe respectively, the structure of the model, the
training, testing of SOFM, and decision-making strategy.
www.intechopen.com
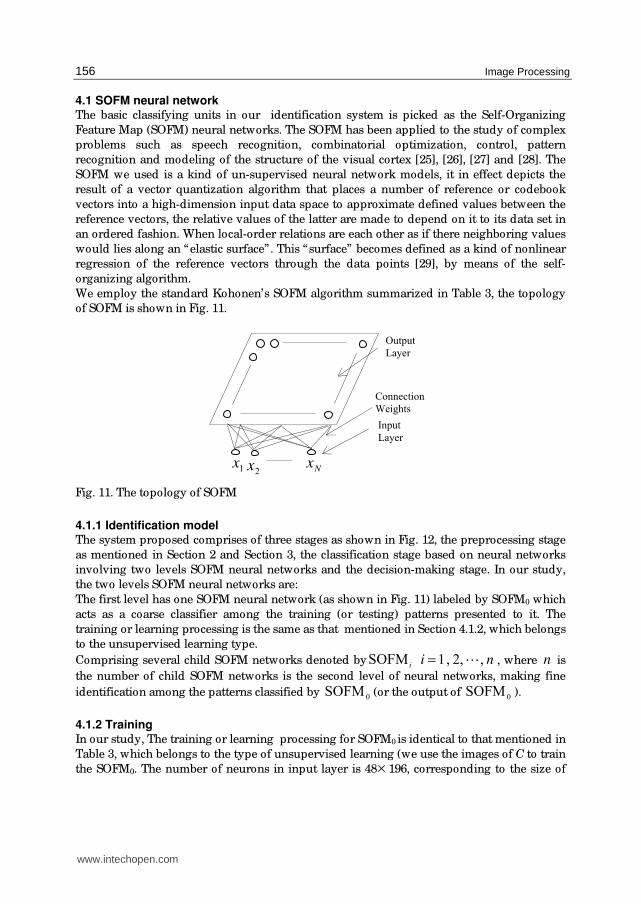
Image Processing
156
4.1 SOFM neural network The basic classifying units in our identification system is picked as the Self-Organizing
Feature Map (SOFM) neural networks. The SOFM has been applied to the study of complex
problems such as speech recognition, combinatorial optimization, control, pattern
recognition and modeling of the structure of the visual cortex [25], [26], [27] and [28]. The
SOFM we used is a kind of un-supervised neural network models, it in effect depicts the
result of a vector quantization algorithm that places a number of reference or codebook
vectors into a high-dimension input data space to approximate defined values between the
reference vectors, the relative values of the latter are made to depend on it to its data set in
an ordered fashion. When local-order relations are each other as if there neighboring values
would lies along an “elastic surface” . This “surface” becomes defined as a kind of nonlinear
regression of the reference vectors through the data points [29], by means of the self-
organizing algorithm.
We employ the standard Kohonen’s SOFM algorithm summarized in Table 3, the topology
of SOFM is shown in Fig. 11.
Fig. 11. The topology of SOFM
4.1.1 Identification model The system proposed comprises of three stages as shown in Fig. 12, the preprocessing stage
as mentioned in Section 2 and Section 3, the classification stage based on neural networks
involving two levels SOFM neural networks and the decision-making stage. In our study,
the two levels SOFM neural networks are:
The first level has one SOFM neural network (as shown in Fig. 11) labeled by SOFM0 which
acts as a coarse classifier among the training (or testing) patterns presented to it. The
training or learning processing is the same as that mentioned in Section 4.1.2, which belongs
to the unsupervised learning type.
Comprising several child SOFM networks denoted byi
SOFM ni , ,2 , 1 A= , where n is
the number of child SOFM networks is the second level of neural networks, making fine
identification among the patterns classified by 0SOFM (or the output of 0SOFM ).
4.1.2 Training In our study, The training or learning processing for SOFM0 is identical to that mentioned in
Table 3, which belongs to the type of unsupervised learning (we use the images of C to train
the SOFM0. The number of neurons in input layer is 48×196, corresponding to the size of
Connection
Weights
2 x
Output
Layer
1 x Nx
Input
Layer
www.intechopen.com

Ballistics Image Processing and Analysis for Firearm Identification
157
Fig. 12. The proposed identification system
windows normalized (as mentioned before). In the training phase, when a neuron of output
layer is inactive for a period of time, it is removed from the network. If a neuron is not
chosen frequently as the winner over a finite time interval, it may be considered inactive.
After being trained, the neurons, which are active with high output value in the output layer
of SOFM0, stand for the classes to which the training images (or the testing specimens)
belong. Due to the result of classification of SOFM0 in our study, the training set C has been
parted into several subsets. Combination of these subsets in a proper manner achieve
training sets for the SOFMs at the second level. When the positions of two classes in the
output layer are very close or overlapping the second level SOFM neural networks are
generated. The training sets are formed by combining the twoclass patterns for those that
are close or overlapping. This training process is identical to that of SOFM0.
4.1.3 Testing The testing procedure for firearm identification system is as follows:
Step 1. Using a selected testing cartridge case image from the testing set T, present this
testing pattern to the first stage of the identification system--the preprocessing stage.
Step 2. Select a type of window from all types in turn, and move this window over the
testing pattern processed in Step1 at every location by every pixel horizontally and
vertically, pick up the sub-images.
Step 3. Using Formula (5) calculated the confidence values for each sub-image, to do this,
present all the sub-images to the SOFM0 in turn, and then to SOFMi by the result of
SOFM0. Return Step2 until all type windows are used up.
Step 4. These confident values are presented to the third stage which is the decision
making stage, and using Formula (6) and (7), the final result for the testing cartridge
case image is calculated.
Cartridge Cases Images
Preprocessing & Feature Extaction
Final
Identification
Neural Network Level-
Confidence
Value 1
Neural
Network1
Level-2
Neural
Network2
Level-2
Neural
Networkn
Level-2
Confidence
Value 2
Confidence
Value n
www.intechopen.com

Image Processing
158
4.1.4 Decision-making strategy For the reasons of noise, lighting conditions, and the trademarks on the head of cartridge
cases images, the following situation could generally be encountered in the testing phase:
a. For a testing cartridge case image, when a type of detecting window is used over the
image, more than one sub-image under this type window is classified to include a firing
pin mark.
b. For a particular testing cartridge case image, when all types of windows are used over
the pattern, more than one sub-image under the different windows is classified to
include a type of firing pin mark.
To improve the performance and accuracy, we use a final decision-making mechanism in
the decision-making stage to solve these problems mentioned above, defining a Confidence
Function ),( jiD for the testing pattern i to the thj class which measures the ratio between
the testing pattern distance to the weight vectors and the average distance of training
patterns to the weight vectors, as follows:
( , ) ( ) / ( , )D i j D j D i j= , (5)
where )( jdist is the average distant when all the training patterns, which belong to the
thj class, are tested with the thj type window, ),( jidist is the distant resulted when the
thi testing pattern is tested using the thj type window. Defining a decision-making rule as
follows: Ki Class∈ , if
}),({min),(jj
jiDkiD Δ>= , nj A,2 ,1= , (6)
where jΔ nj A,2 ,1= , is an appropriate threshold selected for the class j by
experiments. In General, the unbalance in the neural network for each class results from the
unbalanced distribution of training patterns we get in the pattern space. Hence, jΔ for
every class is not unique.
Defining a rejection rule as follows, testing pattern i is rejected by all classes, if
j
jiD Δ<),( , nj A,2 ,1= , (7)
where jΔ nj A,2 ,1= , is same as in Formula (6).
4.2 Image processing for feature extraction Contrast Enhancement: The contrast enhancement transformation [30] is one of the general
functions in image preprocessing, and function is expressed in Equation (8). Lack of
dynamic range in the imaging sensor, or even wrong setting of a lens aperture during image
acquisition can all lead to low-contrast images. To increase the dynamic range of the gray
levels in the image being processed is the main idea behind contrast enhancement. The
image shown in Fig. 13b is transformed by contrast enhancement.
Polar Transaction: Another useful tool in the stage of image preprocessing is polar
transformation. In our study, the polar transformation can bring us some advantages: In the
test phase, we only move the detecting windows over the testing images in direction of
horizontal and vertical rather than rotating the testing images or the detecting windows.
This will decrease the numerical error and increase the efficiency. We can get more
www.intechopen.com

Ballistics Image Processing and Analysis for Firearm Identification
159
informations about the testing images under the Polar systems. Some images that have
similar shapes may be different in shapes and be distinguished in Polar Systems.
Step1: Initialize the weights for the given size map.
Initialize the learning rate parameter, neighborhood
size and set the number of unsupervised learning
iterations.
Step2: Present the input feature vector
],,,,,[ 21 Nnxxxxx AA= in the training data set,
wherenx is the n th element in the feature vector.
Step3: Determine the winner node c such that
}{miniic
wxwx −=−
Step4. Update the weights,i
w ’s, within the
neighborhood of node c , )(tNc
, using the standard
updating rule: )]()[()()1( twxttwtwinii
−+=+ α ,
where )(tNic
∈ .
Step5: Update learning rate, )(tα , and neighborhood
size, )(tNc
. }/1){0()1( Ktt −=+ αα ;
}/1){0()1( KtNtNii
−=+ , where K is a constant
and is usually set to be equal to the total number of
iterations in the self-organizing phase.
Step6: Repeat 2-5 for the specified number of
unsupervised learning iterations.
Table 3. The Unsupervised SOFM Algorithm
a b c
Fig. 13. Low-contrast image, a. Result of contrast enhancement, b. Result of threshold, c.
⎪⎪⎪⎩
⎪⎪⎪⎨
⎧
>+−−−
≤≤+−−−
<=
222
2
2
2111
12
12
1
1
1
x x,)(255
255
x,)(
x x ,
)(
yxxx
y
xxyxxxx
yy
xx
y
xf. (8)
www.intechopen.com

Image Processing
160
Feature Extracting: Feature extracting plays an important role in recognition system. In the
real application, the time consuming feature extracting technique is also a crucial factor to be
considered. So we pick up the morphological gradient [30] of the images processed by the
two steps mentioned aboved as the images features. We deal with digital image functions of
the form ),( yxf and ),( yxb , where ),( yxf is the input image and ),( yxb is a structuring
element , itself a subimage function.
Gray-scale dilation of f by b , denoted bf ⊕ , is defined as
}),(;)(),(
|),(),(max{
),)((
bfDyxDytxs
yxbytxsf
tsbf
∈∈−−+−−
=⊕ (9)
where f
D and b
D are the domains of f and b , respectively.
Gray-scale erosion of f by b , denoted f Өb , is defined as
( f Өb ) =),( ts min{ ( , ) ( , ) |
( ),( ) ;( , ) }f b
f s x t y b x y
s x t y D x y D
+ + −+ + ∈ ∈ (10)
where f
D and b
D are the domains of f and b , respectively.
The morphological gradient of an image, denoted g , is defined as
−⊕= )( bfg ( f Өb ). (11)
The firing mechanism of the weapon is generally of two types: the firing pin is either rim-
firing mechanism or center-firing mechanism, as shown in Fig. 14. The firing pin mark of
cartridge case is formed when the bullet is fired. It is one of the most important
characteristics for identifying the individual firearm. A variety of firing pins marks have
been used in the manufacture of firearms for the rim-firing cartridge cases. In our study, the
cartridge cases belonged to six guns can be classified into six types by shape of firing pin
marks (shown in Fig. 15).
Fig. 14. Rim-firing, first row; Center-firing, second row.
www.intechopen.com
Ballistics Image Processing and Analysis for Firearm Identification
161
1 2 3
4 5 6
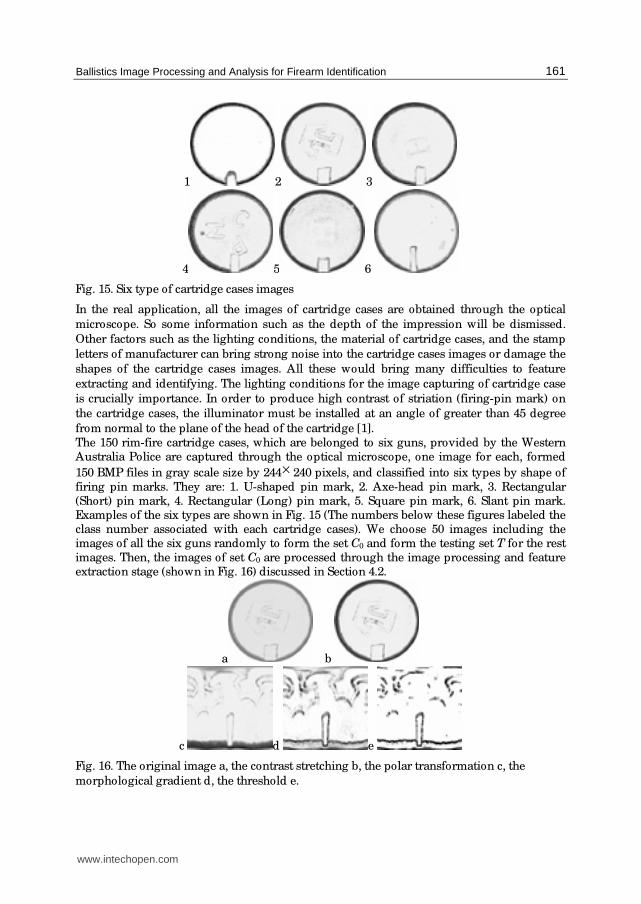
Fig. 15. Six type of cartridge cases images
In the real application, all the images of cartridge cases are obtained through the optical
microscope. So some information such as the depth of the impression will be dismissed.
Other factors such as the lighting conditions, the material of cartridge cases, and the stamp
letters of manufacturer can bring strong noise into the cartridge cases images or damage the
shapes of the cartridge cases images. All these would bring many difficulties to feature
extracting and identifying. The lighting conditions for the image capturing of cartridge case
is crucially importance. In order to produce high contrast of striation (firing-pin mark) on
the cartridge cases, the illuminator must be installed at an angle of greater than 45 degree
from normal to the plane of the head of the cartridge [1].
The 150 rim-fire cartridge cases, which are belonged to six guns, provided by the Western Australia Police are captured through the optical microscope, one image for each, formed
150 BMP files in gray scale size by 244×240 pixels, and classified into six types by shape of
firing pin marks. They are: 1. U-shaped pin mark, 2. Axe-head pin mark, 3. Rectangular (Short) pin mark, 4. Rectangular (Long) pin mark, 5. Square pin mark, 6. Slant pin mark. Examples of the six types are shown in Fig. 15 (The numbers below these figures labeled the class number associated with each cartridge cases). We choose 50 images including the images of all the six guns randomly to form the set C0 and form the testing set T for the rest
images. Then, the images of set C0 are processed through the image processing and feature extraction stage (shown in Fig. 16) discussed in Section 4.2.
a b
c d e
Fig. 16. The original image a, the contrast stretching b, the polar transformation c, the
morphological gradient d, the threshold e.
www.intechopen.com
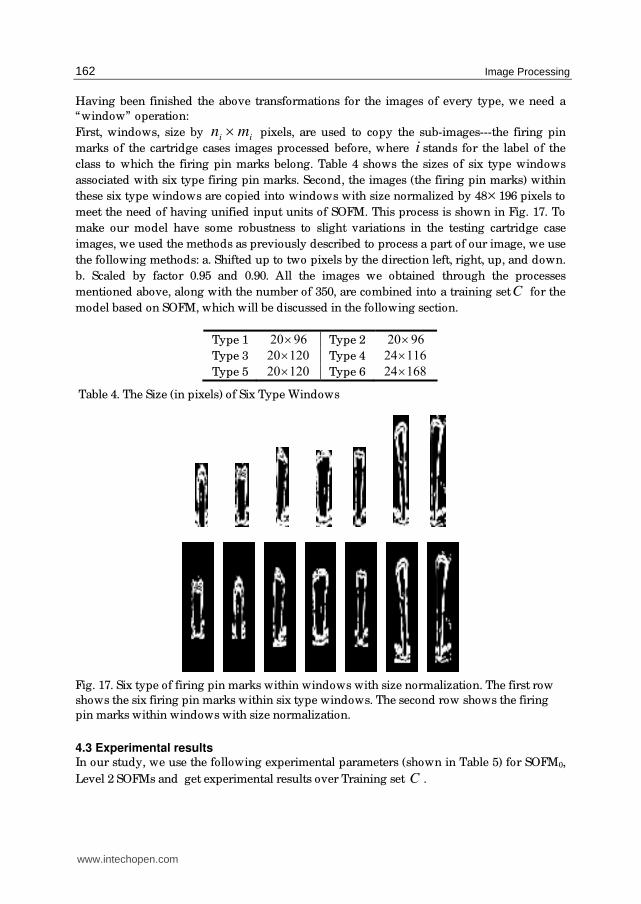
Image Processing
162
Having been finished the above transformations for the images of every type, we need a
“window” operation:
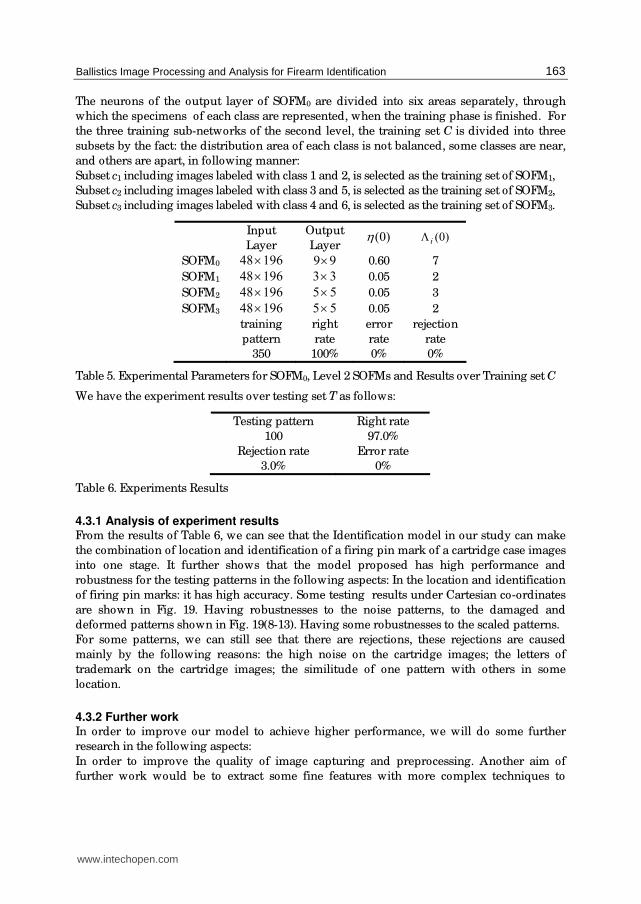
First, windows, size by ii mn × pixels, are used to copy the sub-images---the firing pin
marks of the cartridge cases images processed before, where i stands for the label of the
class to which the firing pin marks belong. Table 4 shows the sizes of six type windows
associated with six type firing pin marks. Second, the images (the firing pin marks) within
these six type windows are copied into windows with size normalized by 48×196 pixels to
meet the need of having unified input units of SOFM. This process is shown in Fig. 17. To
make our model have some robustness to slight variations in the testing cartridge case
images, we used the methods as previously described to process a part of our image, we use
the following methods: a. Shifted up to two pixels by the direction left, right, up, and down.
b. Scaled by factor 0.95 and 0.90. All the images we obtained through the processes
mentioned above, along with the number of 350, are combined into a training setC for the
model based on SOFM, which will be discussed in the following section.
Type 1 9620× Type 2 9620× Type 3 12020× Type 4 11624×
Type 5 12020× Type 6 16824×
Table 4. The Size (in pixels) of Six Type Windows
Fig. 17. Six type of firing pin marks within windows with size normalization. The first row
shows the six firing pin marks within six type windows. The second row shows the firing
pin marks within windows with size normalization.
4.3 Experimental results In our study, we use the following experimental parameters (shown in Table 5) for SOFM0,
Level 2 SOFMs and get experimental results over Training set C .
www.intechopen.com
Ballistics Image Processing and Analysis for Firearm Identification
163
The neurons of the output layer of SOFM0 are divided into six areas separately, through
which the specimens of each class are represented, when the training phase is finished. For
the three training sub-networks of the second level, the training set C is divided into three
subsets by the fact: the distribution area of each class is not balanced, some classes are near,
and others are apart, in following manner:
Subset c1 including images labeled with class 1 and 2, is selected as the training set of SOFM1,
Subset c2 including images labeled with class 3 and 5, is selected as the training set of SOFM2,
Subset c3 including images labeled with class 4 and 6, is selected as the training set of SOFM3.
Input
Layer
Output
Layer )0(η )0(iΛ
SOFM0 19648× 99× 0.60 7
SOFM1 19648× 33× 0.05 2
SOFM2 19648× 55× 0.05 3
SOFM3 19648× 55× 0.05 2
training
pattern
right
rate
error
rate
rejection
rate
350 100% 0% 0%
Table 5. Experimental Parameters for SOFM0, Level 2 SOFMs and Results over Training set C
We have the experiment results over testing set T as follows:
Testing pattern Right rate
100 97.0%
Rejection rate Error rate
3.0% 0%
Table 6. Experiments Results
4.3.1 Analysis of experiment results From the results of Table 6, we can see that the Identification model in our study can make
the combination of location and identification of a firing pin mark of a cartridge case images
into one stage. It further shows that the model proposed has high performance and
robustness for the testing patterns in the following aspects: In the location and identification
of firing pin marks: it has high accuracy. Some testing results under Cartesian co-ordinates
are shown in Fig. 19. Having robustnesses to the noise patterns, to the damaged and
deformed patterns shown in Fig. 19(8-13). Having some robustnesses to the scaled patterns.
For some patterns, we can still see that there are rejections, these rejections are caused
mainly by the following reasons: the high noise on the cartridge images; the letters of
trademark on the cartridge images; the similitude of one pattern with others in some
location.
4.3.2 Further work In order to improve our model to achieve higher performance, we will do some further
research in the following aspects:
In order to improve the quality of image capturing and preprocessing. Another aim of
further work would be to extract some fine features with more complex techniques to
www.intechopen.com
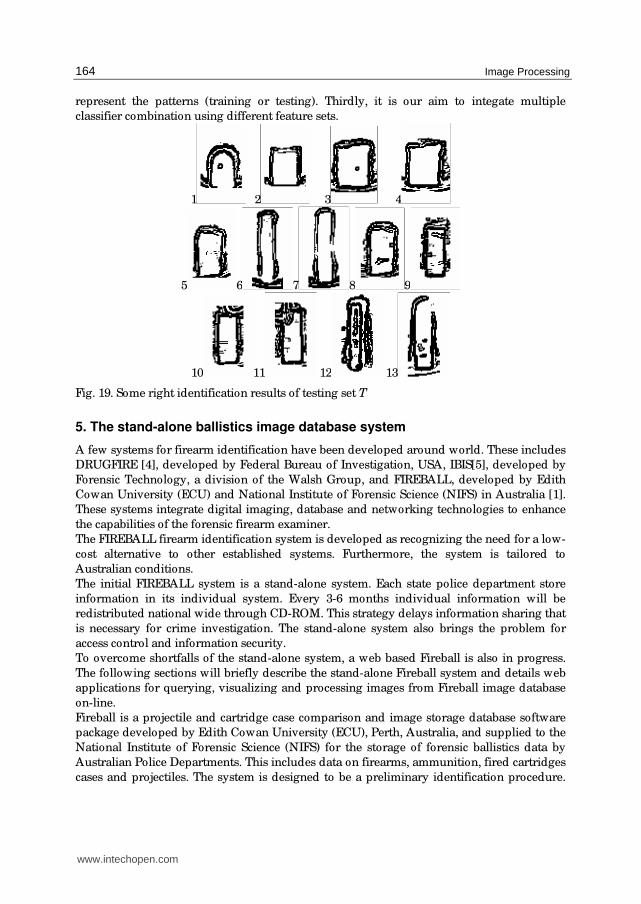
Image Processing
164
represent the patterns (training or testing). Thirdly, it is our aim to integate multiple
classifier combination using different feature sets.
1 2 3 4
5 6 7 8 9
10 11 12 13
Fig. 19. Some right identification results of testing set T
5. The stand-alone ballistics image database system
A few systems for firearm identification have been developed around world. These includes
DRUGFIRE [4], developed by Federal Bureau of Investigation, USA, IBIS[5], developed by
Forensic Technology, a division of the Walsh Group, and FIREBALL, developed by Edith
Cowan University (ECU) and National Institute of Forensic Science (NIFS) in Australia [1].
These systems integrate digital imaging, database and networking technologies to enhance
the capabilities of the forensic firearm examiner.
The FIREBALL firearm identification system is developed as recognizing the need for a low-
cost alternative to other established systems. Furthermore, the system is tailored to
Australian conditions.
The initial FIREBALL system is a stand-alone system. Each state police department store
information in its individual system. Every 3-6 months individual information will be
redistributed national wide through CD-ROM. This strategy delays information sharing that
is necessary for crime investigation. The stand-alone system also brings the problem for
access control and information security.
To overcome shortfalls of the stand-alone system, a web based Fireball is also in progress.
The following sections will briefly describe the stand-alone Fireball system and details web
applications for querying, visualizing and processing images from Fireball image database
on-line.
Fireball is a projectile and cartridge case comparison and image storage database software
package developed by Edith Cowan University (ECU), Perth, Australia, and supplied to the
National Institute of Forensic Science (NIFS) for the storage of forensic ballistics data by
Australian Police Departments. This includes data on firearms, ammunition, fired cartridges
cases and projectiles. The system is designed to be a preliminary identification procedure.
www.intechopen.com
Ballistics Image Processing and Analysis for Firearm Identification
165
Class characteristics of projectile and cartridge cases only are obtained and stored by this
system. Class characteristics are gross identifying features that are identical on all cartridge
cases and projectiles fired from a particular make and model of firearm (eg. firing pin mark
shape).
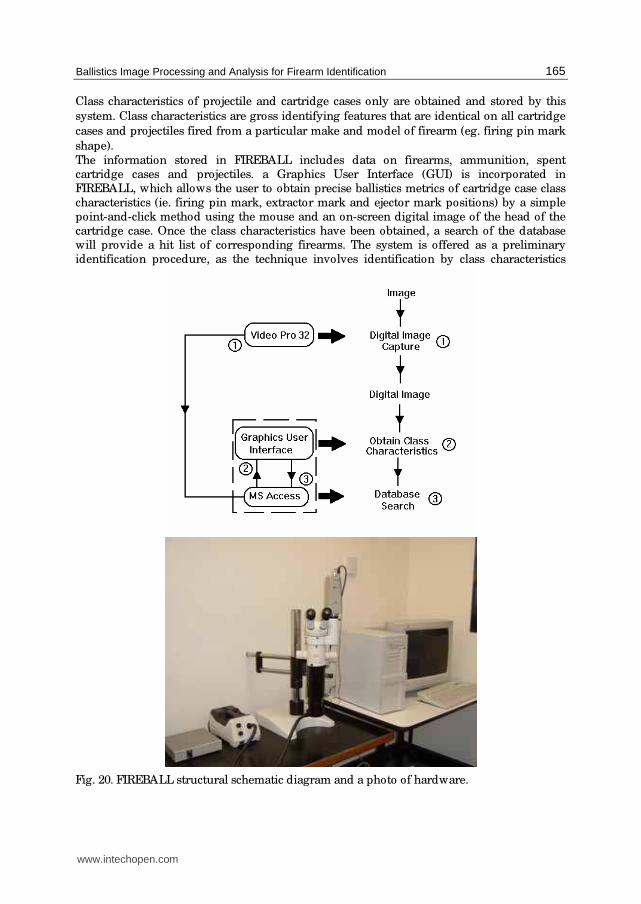
The information stored in FIREBALL includes data on firearms, ammunition, spent cartridge cases and projectiles. a Graphics User Interface (GUI) is incorporated in FIREBALL, which allows the user to obtain precise ballistics metrics of cartridge case class
characteristics (ie. firing pin mark, extractor mark and ejector mark positions) by a simple point-and-click method using the mouse and an on-screen digital image of the head of the cartridge case. Once the class characteristics have been obtained, a search of the database will provide a hit list of corresponding firearms. The system is offered as a preliminary identification procedure, as the technique involves identification by class characteristics
Fig. 20. FIREBALL structural schematic diagram and a photo of hardware.
www.intechopen.com
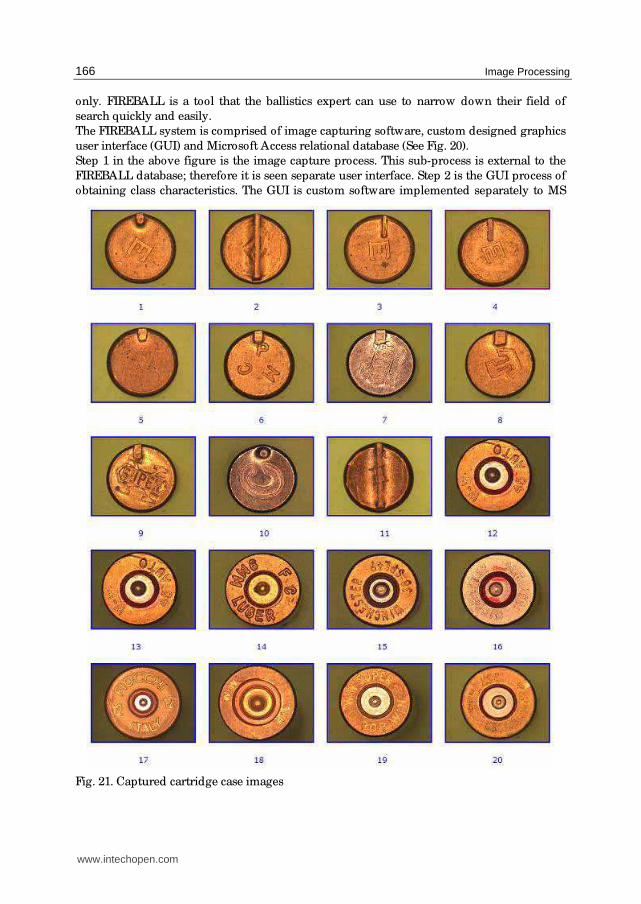
Image Processing
166
only. FIREBALL is a tool that the ballistics expert can use to narrow down their field of
search quickly and easily.
The FIREBALL system is comprised of image capturing software, custom designed graphics
user interface (GUI) and Microsoft Access relational database (See Fig. 20).
Step 1 in the above figure is the image capture process. This sub-process is external to the
FIREBALL database; therefore it is seen separate user interface. Step 2 is the GUI process of
obtaining class characteristics. The GUI is custom software implemented separately to MS
Fig. 21. Captured cartridge case images
www.intechopen.com
Ballistics Image Processing and Analysis for Firearm Identification
167
Access; but to the end user the GUI software appears to be part of the database package.
This is due to the GUI software being initiated and controlled from the database itself. The
database search is implemented when control is returned to the database (ie. step 3). Fig. 21
shows some of acquired images of cartridge case heads in our database.
6. Web-based image processing and visualization
To overcome the limit and inconveience in infromation sharing arround the country, we are
moving the system on-line. Applications have been developed to query the image database
and display results on-line.
The original MS Acess database has be migrated to Oracle database to facilitate the database
security and scalability. Since image data from all states wil be stored in this central
database, MS Access may not be able to accomendate the amount of the data and the on-line
transactions.
After migration, the image data are stored in an Oracle database as LOB datatype, which
can store unstructured data and is optimised for large amounts of such data. Oracle
provides a uniform way of accessing large unstructured data within the database or outside.
We employ Oracle Objects for OLE (OO4O) and ASP for client to access the data including
image data stored in BLOBs.
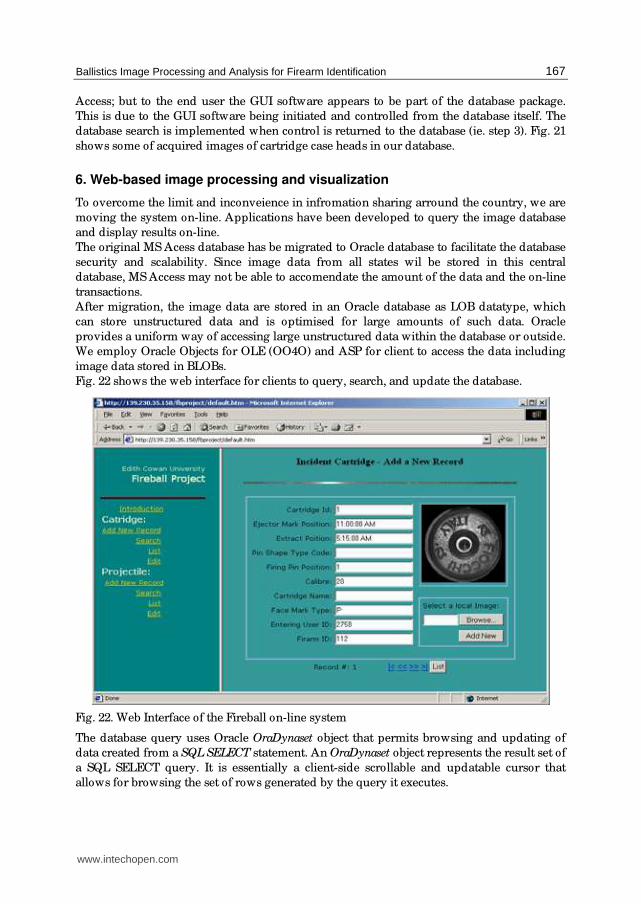
Fig. 22 shows the web interface for clients to query, search, and update the database.
Fig. 22. Web Interface of the Fireball on-line system
The database query uses Oracle OraDynaset object that permits browsing and updating of
data created from a SQL SELECT statement. An OraDynaset object represents the result set of
a SQL SELECT query. It is essentially a client-side scrollable and updatable cursor that
allows for browsing the set of rows generated by the query it executes.
www.intechopen.com
Image Processing
168
This object provides transparent mirroring of database operations, such as updates. When
data is updated via the Update method, the local mirror image of the query is updated so
that the data appears to have been changed without reevaluating the query. The same
procedure is used automatically when records are added to the Dynaset. Integrity checking
is performed to ensure that the mirrored image of the data always matches the actual data
present on the Oracle database.
To display the image on the Web retrieved from the database, we may use HTML tag
<img src=location/ filename>.
However, the image data is actually stored in the database instead of a file. To overcome this
burden, we use the method provided by ASP, request.binaryWrite() method. First, we
compiled a ASP code to retrieve the image data from the database and write the image data
as binary using request.binarywrite() to the web form to display the image. The cartridge case
image shown in figure 3 is obtained in this way.
In general, the acquired image shows randomises in orientation, position and noise in the
background. It is necessary to reduce the background noise and normalise the orientation,
position and size of the image. If these simple image processing can be done on-line, that
will bring much convenience.
We used ActiveX control techniques to realise the on-line image processing. The client
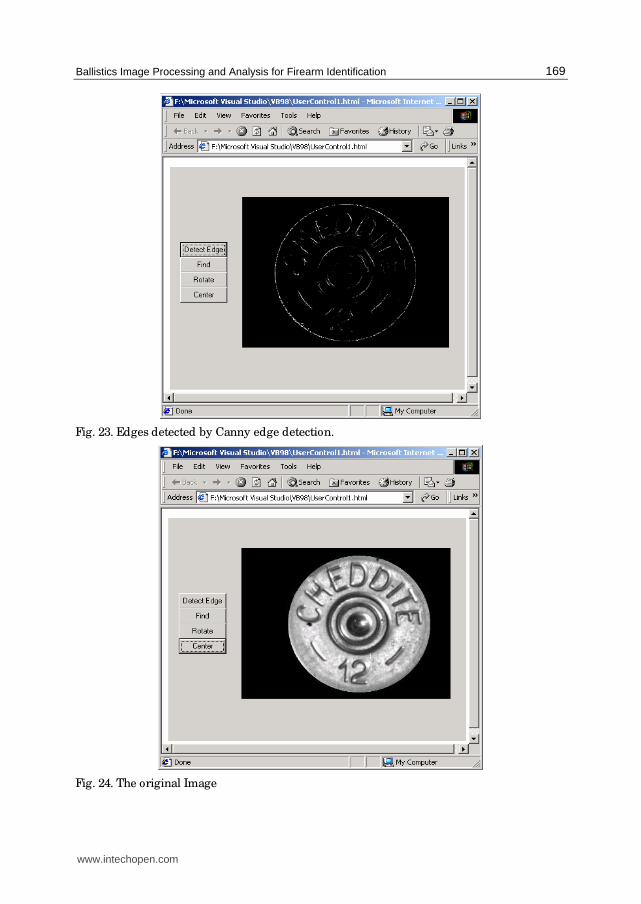
retrieves the image data from the server database to the client browser. After processing, the image data is saved back to the database. The first step of the image pre-processing is to find the cartridge case area in the image. Because of the good illumination and focusing, the acquired image has higher brightness in the cartridge case area than that in the rest. There is a clear edge around the cartridge case area. The edge detection should be an efficient way to detect cartridge case. The proposed method employs Sobel Edge Operator [31] for detecting edges. At each point in the image a vertical slope and a horizontal slope are calculated. The maximum value of the two slopes is taken as the output value of that pixel. A threshold was chosen according to the average slope of the edge magnitude to eject noise edges. Fig. 23 shows the edges detected using Sobel edge operator. Strong edges are obvious. The outside circular edge defines the cartridge case area.
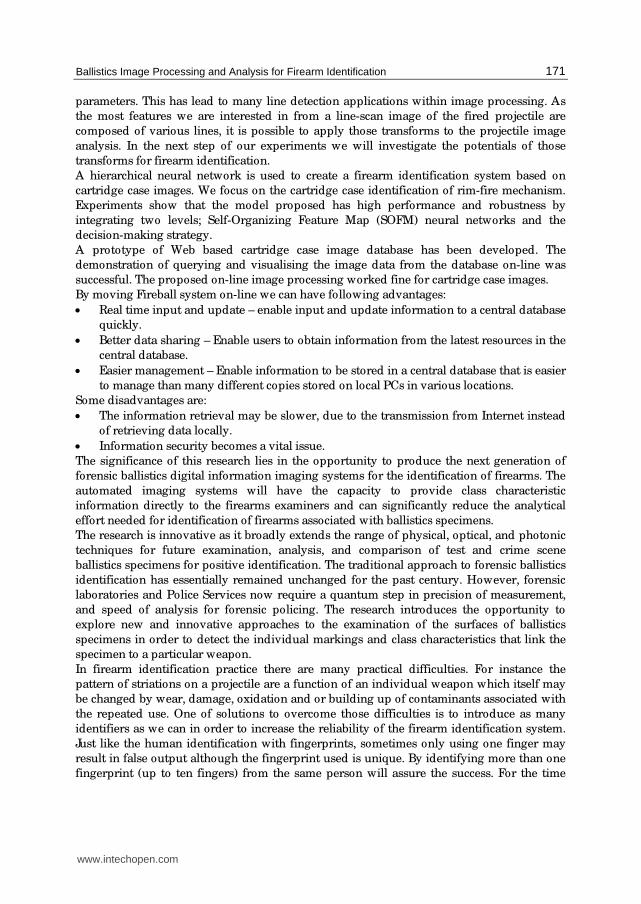
The feature extraction is performed based upon the result of the edge detection. Since the bottom of the cartridge case appears as a large circle, after edge detection, we use “direct least squares fitting of ellipses” [32] to fit the cartridge case edge data set. This fitting algorithm provides an efficient method for fitting ellipses to scattered data. It solves the problem naturally by a generalized eigensystem and is extremely robust and computationally efficient. It should be possible to use the same algorithm for the active control in our proposed automatic image acquisition system. After extracting the cartridge case area, we can manipulate the image, such as cleaning the background, centralising and rotating the image. These can all be done by clicking buttons in a Web browser. Suppose the centre of the cartridge case and that of the image are (Xc, Yc) and (Xi, Yi), the spatial transformation of
⎩⎨⎧
−+=−+=
ci
ci
YYyy
XXxx
'
'
will take the cartridge to the center of the image. Figure 24 and 25 show the cartridge case image before and after centralising.
www.intechopen.com
Ballistics Image Processing and Analysis for Firearm Identification
169
Fig. 23. Edges detected by Canny edge detection.
Fig. 24. The original Image
www.intechopen.com
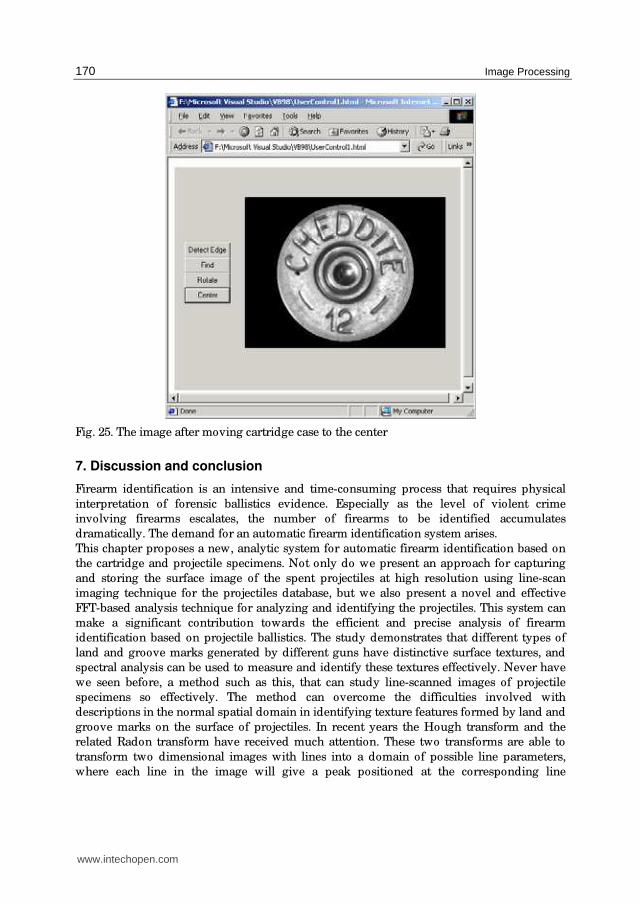
Image Processing
170
Fig. 25. The image after moving cartridge case to the center
7. Discussion and conclusion
Firearm identification is an intensive and time-consuming process that requires physical
interpretation of forensic ballistics evidence. Especially as the level of violent crime
involving firearms escalates, the number of firearms to be identified accumulates
dramatically. The demand for an automatic firearm identification system arises.
This chapter proposes a new, analytic system for automatic firearm identification based on
the cartridge and projectile specimens. Not only do we present an approach for capturing
and storing the surface image of the spent projectiles at high resolution using line-scan
imaging technique for the projectiles database, but we also present a novel and effective
FFT-based analysis technique for analyzing and identifying the projectiles. This system can
make a significant contribution towards the efficient and precise analysis of firearm
identification based on projectile ballistics. The study demonstrates that different types of
land and groove marks generated by different guns have distinctive surface textures, and
spectral analysis can be used to measure and identify these textures effectively. Never have
we seen before, a method such as this, that can study line-scanned images of projectile
specimens so effectively. The method can overcome the difficulties involved with
descriptions in the normal spatial domain in identifying texture features formed by land and
groove marks on the surface of projectiles. In recent years the Hough transform and the
related Radon transform have received much attention. These two transforms are able to
transform two dimensional images with lines into a domain of possible line parameters,
where each line in the image will give a peak positioned at the corresponding line
www.intechopen.com
Ballistics Image Processing and Analysis for Firearm Identification
171
parameters. This has lead to many line detection applications within image processing. As
the most features we are interested in from a line-scan image of the fired projectile are
composed of various lines, it is possible to apply those transforms to the projectile image
analysis. In the next step of our experiments we will investigate the potentials of those
transforms for firearm identification.
A hierarchical neural network is used to create a firearm identification system based on
cartridge case images. We focus on the cartridge case identification of rim-fire mechanism.
Experiments show that the model proposed has high performance and robustness by
integrating two levels; Self-Organizing Feature Map (SOFM) neural networks and the
decision-making strategy.
A prototype of Web based cartridge case image database has been developed. The
demonstration of querying and visualising the image data from the database on-line was
successful. The proposed on-line image processing worked fine for cartridge case images.
By moving Fireball system on-line we can have following advantages:
• Real time input and update – enable input and update information to a central database
quickly.
• Better data sharing – Enable users to obtain information from the latest resources in the
central database.
• Easier management – Enable information to be stored in a central database that is easier
to manage than many different copies stored on local PCs in various locations.
Some disadvantages are:
• The information retrieval may be slower, due to the transmission from Internet instead
of retrieving data locally.
• Information security becomes a vital issue.
The significance of this research lies in the opportunity to produce the next generation of
forensic ballistics digital information imaging systems for the identification of firearms. The
automated imaging systems will have the capacity to provide class characteristic
information directly to the firearms examiners and can significantly reduce the analytical
effort needed for identification of firearms associated with ballistics specimens.
The research is innovative as it broadly extends the range of physical, optical, and photonic
techniques for future examination, analysis, and comparison of test and crime scene
ballistics specimens for positive identification. The traditional approach to forensic ballistics
identification has essentially remained unchanged for the past century. However, forensic
laboratories and Police Services now require a quantum step in precision of measurement,
and speed of analysis for forensic policing. The research introduces the opportunity to
explore new and innovative approaches to the examination of the surfaces of ballistics
specimens in order to detect the individual markings and class characteristics that link the
specimen to a particular weapon.
In firearm identification practice there are many practical difficulties. For instance the
pattern of striations on a projectile are a function of an individual weapon which itself may
be changed by wear, damage, oxidation and or building up of contaminants associated with
the repeated use. One of solutions to overcome those difficulties is to introduce as many
identifiers as we can in order to increase the reliability of the firearm identification system.
Just like the human identification with fingerprints, sometimes only using one finger may
result in false output although the fingerprint used is unique. By identifying more than one
fingerprint (up to ten fingers) from the same person will assure the success. For the time
www.intechopen.com
Image Processing
172
being, more than 30 different identifiers (such as make, model, brand, and type of the
weapon; and shape, size, and position of marks on the specimen) are used in firearm
identification. The FFT approach with the information on the frequency domain adds more
identifiers to the collection of projectile features. In particularly with deformed projectile
specimens routinely examined by ballisticians the FFT approach can still reveal the features
of the markings created by weapon based on the spectrum analysis.
The research is also innovative in placing the development of optical and photonic
techniques in the context of forensic science. The bench mark for forensic ballistics imaging
has been set by the commercial products of IBIS and Drugfire, and the ECU Fireball imaging
system. The research has markedly extended the optical and photonic physical methods of
analysis of minute markings on the surfaces of forensic specimens.
For the future research the precise measurement of these features through imaging analyses
will allow discrimination between the properties of the class characteristics and individual
characteristics to identify the types of weapons. The development of multi-dimensional
cluster analysis models for forensic ballistics specimens will identify the type of weapons
that produced these ballistics specimens through intelligent imaging. Then the matching of
metrics from line-scan and profilometry will allow identification of the weapon. Thus, by
mapping the crime scene specimen to the multi-dimensional ballistics data, it will be
possible to provide a rapid analysis of the involvement of the firearm. The potential to
reduce the labour intensive activity of traditional ballistics identification provides the
opportunity for rapid response in forensic ballistics analyses. Also the opportunity will be
presented for better crime detection rates by police at crime scenes.
Experiments discussed in this chapter are performed on images by 16 various weapons
only. Some more detailed experiments on features of various guns of the same kind and
same make will be carried out in the next step of the research.
The need for intelligence applied to high resolution digital images systems for image
processing is considerable, realizing the intensive nature of comparator microscope
identification of forensic ballistics specimens. The future research will determine the
optimum optical conditions for imaging ballistics specimens for comparison crime scene
and test specimens.
In terms of cartridge case images, our main focus was on the consideration of rim-firing pin
mark identification. Through the use of a hierarchical neural network model, this study
investigated a system for identifying the firing pin marks of cartridge case images. The
identification model in our study incorporates the combination of location and identification
of firing pin marks of cartridge case images into one stage. It shows that the model proposed
has high performance and robustness for real testing patterns.
Through further processing, such as the more efficient and precise identification of cartridge
cases by combination with several characteristics on cartridge case images, the efficiency of
this system will also make a significant contribution towards the efficient and precise
identification of ballistics specimens.
8. References
[1] C.L. Smith, and J.M. Cross, (1995): Optical Imaging Techniques for Ballistics Specimens
to Identify Firearms. Proceedings of the 29th Annual 1995 International Carnahan
Conference on Security Technology, pp. 275-289, Oct. 1995, England.
www.intechopen.com

Ballistics Image Processing and Analysis for Firearm Identification
173
[2] Smith, CL. (2001a). Profile measurements as a technique for forensic ballistics
identification. Proceedings of 5th Australian Security Research Symposium, July,
Perth, Western Australia, 153-162.
[3] Smith, C.L. (2002). Linescan imaging of ballistics projectile markings for identification.
Proceedings of IEEE 36th Annual 2002 International Carnahan Conference on
Security Technology, 216-222. Altantic City.
[4] Evans, JPO, Smith, CL and Robinson, M. (2004). Validiation of the linescan imaging
technique for imaging cylindrical forensic ballistics specimens. American Firearm
and Toolmark Examiners Journal. In press.
[5] Nichols, RG 1997. Firearm and toolmark identification criteria: A review of the literature.
Journal of Forensic Science, 42(30, 466-474.
[6] Bunch, SG 2000. Consecutive matching striation criteria: A general critique. Journal of
Forensic Science, 45(5), 955-962.
[7] Bonfanti, MS and Ghauharali, RJ 2000. Visualisation by confocal microscopy of traces on
bullets and cartridge cases. Science and Justice, 40(40, 241-256.
[8] Springer, E. 1995. Toolmark examinations – A review of its development in the literature.
Journal of Forensic Sciences, 40(6), 964-968.
[9] Smith, C.L. (1997). Fireball: A forensic ballistics imaging system. Proceedings of IEEE 31st
Annual International Carnahan Conference on Security Technology, October,
Canberra, Australia, 64-70.
[10] R. Saferstein (ED), (1988) Forensic Science Handbook: Volume 2. Englewood Cliffs:
Prentice Hall, 1988.
[11] G.Burrard, (1951): Identification of Firearms and Forensic Ballistics. London: Herbert
Jenkins,1951.
[12] Li, D.G. and Watson, A.C. (1998). Ballistics firearms identification based on images of
cartridge case and projectile. Proceedings of 1998 SPIE Enabling Technologies for
Law Enforcement and Security Symposium, Boston, USA, November 3-5.
[13] C.L. Smith, J.M. Cross, and G.J. Variyan, (1995): FIREBALL: An Interactive Database for
the Forensic Ballistic Identification of Firearms. Research Report, Australian
Institute of Security and Applied Technology, Edith Cowan University, Western
Australia, 1995.
[14] Le-Ping Xin, (2000): A Cartridge Identification System for Firearm Authentication,
Signal Processing Proceedings, 2000. WCCC_ICSP 2000. 5th International
Conference on Volume: 2, P1405-1408.
[15] Chenyuan Kou, Cheng-Tan Tung and H. C. FU, (1994): FISOFM: Firearms Identification
based on SOFM Model of Neural Network, Security Technology, 1994.
Proceedings. Institute of Electrical and Electronics Engineers 28th Annual 1994
International Carnahan Conference on , 12-14 Oct. Pages: 120-125.
[16] Zographos, A., Robinson, M., Evans, J.P.O. and Smith, C.L. (1997). Ballistics
identification using line-scan imaging techniques. Proceedings of IEEE
International Carnahan Conference on Security Technology, Canberra, Australia.
[17] C.L. Smith, Robinson, M. and Evans, P.: (2000): Line-scan Imaging for the positive
identification of ballistics, 2000. IEEE International Carnahan Conference on
Security Technology, 269-275. 2000.
[18] Kingslake, R., Optics in Photography. SPIE Optical Engineering Press. Bellingham,
Washington, USA, 1992.
www.intechopen.com

Image Processing
174
[19] Evans J.P.O., Zhu C and Robinson M.: Line-scan imaging using an area array camera,
The 5th Int. Conf on Control, Automation, Robotics and Vision, pp. 1471-1475,
Singapore, 1998, ISBN 981-04-0318-6.
[20] Patent number EP1418767 Line-scan imaging system in 3-D.
[21] Jun Kong, D. G. Li., A. C. Watson: A Firearm Identification System Based on Neural
Network, AI 2003, Lecture Notes in Artificial Intelligence, 315-326, 2003, Springer.
[22] Rafael C. Gonzalez, Richard E. Woods: Digital Image Processing, Second Edition,
Beijing: Publishing House of Electronics Industry, 2002, 7, 519-566.
[23] Pitas I.: Digital image processing algorithms, Prentice Hall, ISBN 0-13-145814-0, 1993
[24] Chenyuan Kou, Cheng-Tan Tung and H. C. FU, (1994) “FISOFM: Firearms
Identification based on SOFM Model of Neural Network”, Security Technology,
1994. Proceedings. Institute of Electrical and Electronics Engineers 28th Annual 1994
International Carnahan Conference on , 12-14 Oct. Pages: 120-125.
[25] T. Kohonen, (1990) “Self-organising Maps” , Springer, Berlin, 1995, The self-organising
Maps, Proc. IEEE 78 (9) (1990) 1464-1480.
[26] S.B. Cho, “Pattern Recognition with Neural Networks Combined by Genetic
Algorithm”, Fuzzy Set and System 103(1999) 339-347.
[27] T.M. Ha, H. Bunke, “Off-line Handwritten Numeral Recognition by Perturbation
Method”, IEEE Trans. Pattern Anal. Mach.Intell. 19(5) (1997)535 -539.
[28] P.N. Suganthan, “Structure Adaptive Multilayer Overlapped SOMs with Partial
Supervision for Handprinted Digit Classification ” , Proceedings of International
Joint Conference on Neural Networks, WCCI’98, Alaska, May 1998.
[29] T. Kohonen, Tutorial Notes, (1993) International Symposium on Artificial Neural
Networks, pp. 9-15, Dec.20-22, 1993.
[30] Rafael C. Gonzalez, Richard E. Woods, Digital Image Processing, Second Edition,
Beijing: Publishing House of Electronics Industry, 2002, 7, 519-566.
[31] k. R. Castleman Digital Image Processing, 1996, Prentice Hall, Inc.
[32] A. W. Fitzgibbon, M. Pilu and R. B. Fisher, “Direct least squares fitting of ellipses” , in
Proceedings of International Conference on Pattern Recognition, Vienna, 1996
www.intechopen.com

Image ProcessingEdited by Yung-Sheng Chen
ISBN 978-953-307-026-1Hard cover, 516 pagesPublisher InTechPublished online 01, December, 2009Published in print edition December, 2009
InTech EuropeUniversity Campus STeP Ri Slavka Krautzeka 83/A 51000 Rijeka, Croatia Phone: +385 (51) 770 447 Fax: +385 (51) 686 166www.intechopen.com
InTech ChinaUnit 405, Office Block, Hotel Equatorial Shanghai No.65, Yan An Road (West), Shanghai, 200040, China
Phone: +86-21-62489820 Fax: +86-21-62489821
There are six sections in this book. The first section presents basic image processing techniques, such asimage acquisition, storage, retrieval, transformation, filtering, and parallel computing. Then, some applications,such as road sign recognition, air quality monitoring, remote sensed image analysis, and diagnosis of industrialparts are considered. Subsequently, the application of image processing for the special eye examination and anewly three-dimensional digital camera are introduced. On the other hand, the section of medical imaging willshow the applications of nuclear imaging, ultrasound imaging, and biology. The section of neural fuzzypresents the topics of image recognition, self-learning, image restoration, as well as evolutionary. The finalsection will show how to implement the hardware design based on the SoC or FPGA to accelerate imageprocessing.
How to referenceIn order to correctly reference this scholarly work, feel free to copy and paste the following:
Dongguang Li (2009). Ballistics Image Processing and Analysis for Firearm Identification, Image Processing,Yung-Sheng Chen (Ed.), ISBN: 978-953-307-026-1, InTech, Available from:http://www.intechopen.com/books/image-processing/ballistics-image-processing-and-analysis-for-firearm-identification

© 2009 The Author(s). Licensee IntechOpen. This chapter is distributedunder the terms of the Creative Commons Attribution-NonCommercial-ShareAlike-3.0 License, which permits use, distribution and reproduction fornon-commercial purposes, provided the original is properly cited andderivative works building on this content are distributed under the samelicense.