Embed Size (px)
Citation preview

Independent research by
June 2018
Balance Sheet Management Technology 2018Vendor Analysis: Moody’s Analytics

© Copyright Chartis Research Ltd 2018. All Rights Reserved 1
About Chartis Chartis Research is the leading provider of research and analysis on the global market for risk technology. It is part of Infopro Digital, which owns market-leading brands such as Risk and Waters Technology. Chartis’s goal is to support enterprises as they drive business performance through improved risk management, corporate governance and compliance and to help clients make informed technology and business decisions by providing in-depth analysis and actionable advice on virtually all aspects of risk technology. Areas of expertise include:
• Credit risk• Operational risk and governance, risk and compliance (GRC)• Market risk• Asset and liability management (ALM) and liquidity risk• Energy and commodity trading risk• Financial crime including trader surveillance, anti-fraud and anti-money laundering• Cyber risk management• Insurance risk• Regulatory requirements including Basel 2 and 3, Dodd-Frank, MiFID II and Solvency II
Chartis is solely focused on risk and compliance technology, which gives it a significant advantage over generic market analysts.
The firm has brought together a leading team of analysts and advisors from the risk management and financial services industries. This team has hands-on experience of implementing and developing risk management systems and programs for Fortune 500 companies and leading consulting houses.
Visit www.chartis-research.com for more information.
Join our global online community at www.risktech-forum.com.
© Copyright Chartis Research Ltd 2018. All Rights Reserved. Chartis Research is a wholly owned subsidiary of Infopro Digital Ltd.
No part of this publication may be reproduced, adapted, stored in a retrieval system or transmitted in any form by any means, electronic, mechanical, photocopying, recording or otherwise, without the prior permission of Chartis Research Ltd. The facts contained within this report are believed to be correct at the time of publication but cannot be guaranteed.
Please note that the findings, conclusions and recommendations Chartis Research delivers will be based on information gathered in good faith, whose accuracy we cannot guarantee. Chartis Research accepts no liability whatever for actions taken based on any information that may subsequently prove to be incorrect or errors in our analysis. See Chartis ‘Terms of Use’ on www.chartis-research.com.
RiskTech100®, RiskTech Quadrant®, FinTech Quadrant™ and The Risk Enabled Enterprise® are Registered Trade Marks of Chartis Research Limited.
Unauthorized use of Chartis’s name and trademarks is strictly prohibited and subject to legal penalties.

© Copyright Chartis Research Ltd 2018. All Rights Reserved 2
Table of contents1. Report context .......................................................................................................................................4
2. Quadrant context ..................................................................................................................................9
3. Vendor context ................................................................................................................................... 14
4. Methodology ....................................................................................................................................... 19
5. Further reading ................................................................................................................................... 24
© Copyright Chartis Research Ltd 2018. All Rights Reserved 3
List of figures and tablesFigure 1: The four ‘cogs’ of balance sheet management .....................................................................4
Figure 2: FinTech Quadrant™ for balance sheet management technology, 2018 ...................... 10
Figure 3: Moody’s Analytics’ RiskConfidence™ BSM system ........................................................ 14
Figure 4: Fund Transfer Pricing framework ......................................................................................... 17
Table 1: Completeness of offering – Moody’s Analytics (Balance Sheet Management Technology 2018) ..................................................................................................................................... 12
Table 2: Broad market potential – Moody’s Analytics (Balance Sheet Management Technology 2018) ..................................................................................................................................... 13
Table 3: Moody’s Analytics – company information ......................................................................... 14
Table 4: Evaluation criteria for Chartis’ BSM report ......................................................................... 20

© Copyright Chartis Research Ltd 2018. All Rights Reserved 4
1. Report contextThis Vendor Analysis is based on the Chartis quadrant report Balance Sheet Management Technology 2018 (published in March 2018). This section summarizes the key theses in that report; subsequent sections take a detailed look at Moody’s Analytics’ quadrant positioning and scoring, and Chartis’ underlying opinion and analysis.
Key thesis
Making the same mistakes?
In the wake of the financial crisis, across the spectrum of banking, insurance, capital markets and investment management, Balance Sheet Management (BSM) as a discipline has evolved rapidly. It is now a much more complex, holistic process focused around four discrete elements: capital adequacy/ solvency, leverage, liquidity and funding (see Figure 1). Despite describing fundamentally different management objectives and regulatory concerns depending on where across the spectrum they are expressed, each of these critical ‘cogs’ in the BSM process is present, all are interconnected, and each exerts influence on the others, amplifying the inherent intricacy of modern BSM.
Figure 1: The four ‘cogs’ of balance sheet management
Capital Adequacy/ Solvency
Liquidity
Leverage
Funding
Source: Chartis Research
For the last decade, regulators have focused much of their attention on improving the measurement of risk in banks and investment firms, and the focus of Financial Institutions (FIs) – especially banks – has been on improving how they manage risk. This has involved understanding the connections they have (to clients, other parts of their business and other FIs), and determining which buffers are appropriate to absorb the volatility caused by unexpected events.
Increasingly, banks are focusing their attention on a specific challenge, namely to establish a stress-testing regime that not only embraces the scenarios set out each year by the regulators, but also takes into account the idiosyncratic nature of banks’ balance sheets and business profiles. This challenge is amplified by two interconnected and embedded risks in banks’ balance sheets that are difficult to pinpoint, model, measure, manage and mitigate against.
The first of these is the behavior of those holding assets and liabilities; the other concerns the optionality given to customers in ‘business as usual’ conditions and in various situations of market stress (such as banking crises or other irregular circumstances). Since the crisis, regulators have moved

© Copyright Chartis Research Ltd 2018. All Rights Reserved 5
to implement two new measures to address these risks: the Liquidity Coverage Ratio (LCR) and the Net Stable Funding Ratio (NSFR), both of which include assumptions about behavior and optionality. However, for many banks themselves, with both these risks effectively lying ‘hidden’ in their balance sheets, the threats they pose may not be fully realized.
Nevertheless, several market participants, regulators and consultants in the industry believe that other vital lessons have been learned from the crisis, and that a new set of rules finalized by the Basel Committee in December 2017 will be enough to avert or mitigate any future crisis. And yet, for a number of reasons, the reality could be very different. For example:
• A number of banks are still going through the knotty process of implementing software to help them comply with new post-crisis regulation.
• In particular, the industry is still grappling with the complexities involved in modeling stress testing, as well as the practical ramifications of the LCR and the NSFR.
• As a result, banks’ assumptions about behavior and optionality have yet to be stress-tested, and remain unobserved by some banks. Dangerously, the price of ignoring these risks may not yet be properly understood by either the banks or their customers.
The ability to identify and mitigate these risks with appropriate software solutions and management processes could emerge as a strong axis of competitive advantage. However, to seize this opportunity, institutions must first tackle the problems inherent in BSM, including the often confusing array of terms and capabilities it employs – even within the same industry vertical. Because the risks banks face tend to be the same, there is a need for a more unified approach to BSM. But the geographical differences in how regulations are applied have their own disparate effects on how BSM is developed and used.
Technology vendors, we believe, are well positioned to influence how banks respond to these challenges. Key to this, though, will be their success in identifying a clear underlying set of capabilities in BSM – what we refer to as the ‘BSM value chain’ – and the mathematical processes underpinning its analytical components. By understanding the intricacies of the value chain, banks and vendors can communicate clearly with each other, aiding the successful development of new BSM solutions. Most will continue to offer regulatory compliance modules, which are likely to be an essential part of any offering for some time. However, pressure will mount for new solution offerings to tackle the vagaries of the balance sheet, and this will become a vital area of differentiation for vendors of all stripes going forward.
Demand-side takeaways
What is BSM?
For FIs, BSM is the process of managing and optimizing the assets and cash flow they use to meet their obligations. Effective BSM not only protects FIs against risks in maintaining liquidity, it also offers an opportunity to enhance value by optimizing reward versus risk. BSM solutions nowadays broadly cover portfolio accounting, analytics and optimization, using a suite of tools for transaction capture, forecasting, interest rate risk measurement, stress testing, liquidity modeling and behavioral analytics.
BSM comprises four interconnected ‘cogs’ that drive much of the machinery of financial services: capital adequacy/solvency, leverage, liquidity and funding. Each of these influences the other, and – depending on the institution concerned – can have different relative levels of importance in the

© Copyright Chartis Research Ltd 2018. All Rights Reserved 6
organization. It is this interplay, and the different ways in which BSM is used across different financial industry sectors, that can make a complex discipline even more intricate.
In which industries is BSM used?
BSM is an essential tool for banks, insurance firms and capital markets/asset management firms. Balance sheet structures differ widely across these types of institution, which have different operational needs and areas of focus, as well as unique requirements imposed on them by regulators (local, regional and global), investors and their own board members. As such, FIs in these industry sectors use BSM in very different ways and for different purposes.
As a result, BSM means different things to different people in different industries. Addressing the complex differences and variations in the way BSM solutions are defined and used is a significant task. With this in mind, in this report we will focus on BSM for the banking sector, largely because of the substantial change banks are facing in the way they manage their balance sheets in the post-crisis world.
Embedded risks
The big question for bankers is whether they truly understand what is embedded in their balance sheets. Banks and asset managers are having to grapple with two somewhat conflicting, but nevertheless linked concepts:
• The concept of behavioralization: the behavior of customers in areas like repaying credit cards debts, repaying mortgages and withdrawing money.
• The concept of optionality, which is given to customers by the bank implicit in the assets that the customer is buying, or the liability they are placing.
Banks generally don’t want to admit that they are providing such optionality, since the price associated depends entirely on the expected behavior of their customers. The fundamentals of banking are therefore difficult to model, as it can be hard to accurately estimate the cost of many aspects, and this has led to optionality being frequently overlooked. But the risks are there – and while they are the essence of the LCR and NSFR, they remain untested.
Tackling the new normal with ‘ideal’ BSM
So far banks seem to be responding well to the existing regulation. However, there is a risk that BSM departments may come to regard blind compliance as their primary function, rather than the application of BSM to optimize their operations, driving performance and protecting against risks not otherwise covered by the current suite of regulations. Banks and regulators must ask themselves how well prepared the financial industry is for the next crisis, and question the extent to which existing software solutions provide the tools necessary to identify new risks as they emerge.
Chartis believes that there is some variation in banks’ current attitudes to BSM: some believe in the notion of an ‘ideal’ state, while for others BSM is strictly a compliance process. We also believe that there are steps that banks and software vendors can take to develop better BSM systems and solutions.
© Copyright Chartis Research Ltd 2018. All Rights Reserved 7
Supply-side takeaways
BSM vendor landscape
So far, reflecting their clients’ needs, vendors of BSM solutions mostly cover regulatory compliance. No vendor we have seen currently offers complete coverage of the entire BSM value chain. Instead, they tend to favor solutions positioned either as ‘balance sheet management software’ or ‘asset and liabilities management software’. Naturally, this can make the classification of vendors difficult, so Chartis considers all such solutions according to the following, more meaningful categories:
• Vertically integrated providers of Enterprise Risk Management (ERM).
• Niche solution providers.
• Liquidity risk system providers.
• Basel regulatory capital providers.
• Actuarial modeling providers.
• Providers of internally developed solutions.
• Consultants.
By developing their offerings or acquiring other firms, vendors may start to offer end-to-end coverage of the value chain. So far, though, no vendor stands far ahead of its competitors. This means that the landscape is very competitive, and vendors would do well to target potential clients carefully to ensure they don’t waste resources targeting banks with requirements that are ill-suited to their offerings.
One recent trend that Chartis has identified is the migration – or attempted migration – of Basel II solution providers into the ERM space. Since they have bank data mapped for Basel, they believe, it should be relatively straightforward to expand their knowhow into areas such as Asset Liability Management (ALM) market risk, liquidity, profitability or simulation-based economic capital.
In reality, however, this is problematic. At their core, Basel II solutions are based around data management, simple calculations and reporting. As such, they lack many crucial components of the BSM value chain (such as behavioral analytics, liability-side modeling and optimization). Indeed, Basel databases rarely contain data on anything much beyond product classification, probability of default, loss-given default and exposure at default. Adding functionality for ALM, market risk, liquidity risk, financial planning and macroeconomic stress testing would create a significant burden for developers.
Some vendors have sought to circumvent this developmental issue by purchasing standalone valuation engines. Again, though, this complicates the process, introducing significant model and operational risks, and potentially creating a solution that is inferior to those offered by vendors developing integrated BSM.

© Copyright Chartis Research Ltd 2018. All Rights Reserved 8
Actions for technology vendors
The journey toward more effective BSM is a challenging one, but software vendors are well positioned to influence banks’ culture in this area. They could start by offering additional functionality to banks beyond mere compliance, although, in the current climate, such extended functionality may not be something the banks themselves are clamoring for. As a result, with neither banks nor vendors in the BSM space incentivized to use or develop additional BSM functionality, uptake may be slow. Nevertheless, in the context of new emerging risks, and the benefits to institutions of being ready for them, there remains significant merit in trying.

© Copyright Chartis Research Ltd 2018. All Rights Reserved 9
2. Quadrant contextIntroducing the Chartis FinTech™ Quadrant
This section of the report contains:
• The Chartis FinTech Quadrant™ for balance sheet management solutions for 2018.
• An examination of Moody’s Analytics’ positioning and its scores as part of Chartis’ analysis.
• A consideration of how the quadrant reflects the broader vendor landscape.
Summary information
What does the Chartis quadrant show?
The FinTech Quadrant™ uses a comprehensive methodology that involves in-depth independent research and a clear scoring system to explain which technology solutions meet an organization’s needs. The FinTech Quadrant™ does not simply describe one technology option as the best BSM solution; rather it has a sophisticated ranking methodology to explain which solutions are best for specific buyers, depending on their implementation strategies.
The FinTech Quadrant™ is a proprietary methodology developed specifically for the financial technology marketplace. It takes into account vendors’ product, technology and organizational capabilities. Section 4 sets out the generic methodology and criteria used for the FinTech Quadrant™.
How are quadrants used by technology buyers?
Chartis’ RiskTech and FinTech quadrants provide a view of the vendor landscape in a specific area of risk, financial and/or regulatory technology. We monitor the market to identify the strengths and weaknesses of different solutions, and track the post-sales performance of companies selling and implementing these systems. Users and buyers can consult the quadrant as part of their wider research when considering the most appropriate solution for their needs.
Note, however, that Chartis Research does not endorse any vendor, product or service depicted in its research publications, and does not advise technology users to select only those vendors with the highest ratings or other designation. Chartis Research’s publications consist of the opinions of its research analysts and should not be construed as statements of fact.
How are quadrants used by technology vendors?
Technology vendors can use Chartis’ quadrants to achieve several goals:
• Gain an independent analysis and view of the provider landscape in a specific area of risk, financial and/or regulatory technology.
• Assess their capabilities and market positioning against their competitors and other players in the space.

© Copyright Chartis Research Ltd 2018. All Rights Reserved 10
• Enhance their positioning with actual and potential clients, and develop their go-to-market strategies.
In addition, Chartis’ Vendor Analysis reports, like this one, offer detailed insight into specific vendors and their capabilities, with further analysis of their quadrant positioning and scoring.
Chartis Research FinTech Quadrant™ for Balance Sheet Management Risk Technology, 2018
Figure 2 illustrates Chartis’ view of the BSM vendor landscape, highlighting Moody’s Analytics’ position.
Figure 2: FinTech Quadrant™ for balance sheet management technology, 2018
Best-of-breed
Point solutions
Category leaders
Enterprise solutions
COMPLETENESS OF OFFERING
MA
RK
ET
PO
TE
NT
IAL
Finastra
FIS
IBMIntellect Design
Moody's Analytics
MORS Software
Oracle
Prometeia
QRM
Wolters Kluwer
zeb
ZM Financial Systems
Source: Chartis Research
© Copyright Chartis Research Ltd 2018. All Rights Reserved 11
Quadrant dynamics
General quadrant takeaways
Vendors on the BSM quadrant fall into three broad categories:
• The strongest category leaders – including Moody’s Analytics – all have vast sets of libraries that address the many regional nuances that exist in BSM analytics. These vendors have a global reach, and the organizational heft required to support clients in diverse economies facing many different regulatory and competitive requirements.
• Vendors in the enterprise solutions category tended to have broad analytical capabilities but many lacked a clear strategy for integrating these disparate analytical assets. Client support tended to be limited to one or two regions where the vendor specialized.
• Best-of-breed vendors provided strong solutions focusing on specific regional or institutional-type niches. While this depth of understanding makes them well-suited to service clients that fit their current focus, however it limits how applicable their solutions are to the largest global FIs.
Vendor positioning in context – completeness of offering
Moody’s Analytics’ BSM solutions scored strongly on the completeness of offering axis of the Chartis quadrant for a number of reasons:
• Among the vendors evaluated, Moody’s Analytics provided data from the widest set of sources. This contributed to the depth of analytical rigor in its BSM libraries, as well as the breadth of geographies covered by its solution. Moody’s Analytics’ access to such a wealth of data further bolsters its BSM solution by enabling it to offer strong quantitative support to clients. This was a key factor that marked Moody’s Analytics as a leading vendor of BSM solutions.
• Moody’s Analytics’ solution scored highly because of the vendor’s use of its proprietary pricing library, which integrates with clients’ own pricing libraries. This flexibility was further evident in the ease with which Moody’s Analytics’ BSM solution can be integrated with other Moody’s Analytics packages, from regulatory reporting to market risk and credit risk.
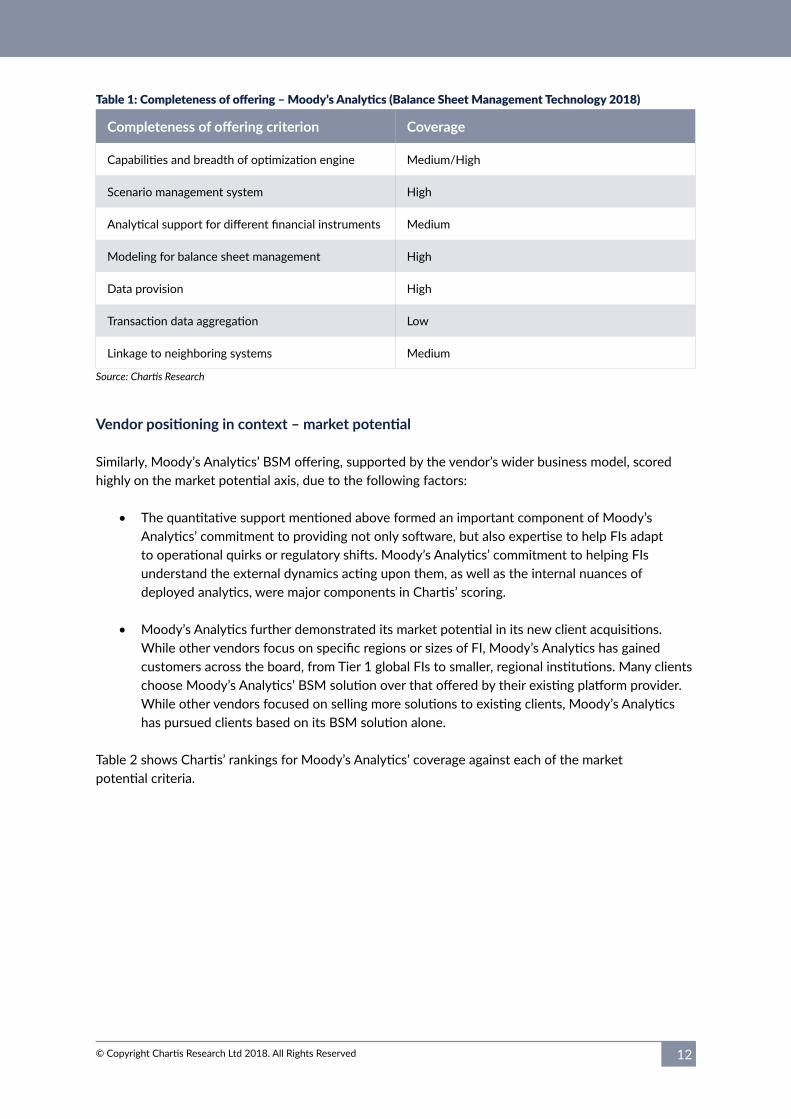
Table 1 shows Chartis’ rankings for Moody’s Analytics’ coverage against each of the completeness of offering criteria.
© Copyright Chartis Research Ltd 2018. All Rights Reserved 12
Table 1: Completeness of offering – Moody’s Analytics (Balance Sheet Management Technology 2018)
Completeness of offering criterion Coverage
Capabilities and breadth of optimization engine Medium/High
Scenario management system High
Analytical support for different financial instruments Medium
Modeling for balance sheet management High
Data provision High
Transaction data aggregation Low
Linkage to neighboring systems Medium
Source: Chartis Research
Vendor positioning in context – market potential
Similarly, Moody’s Analytics’ BSM offering, supported by the vendor’s wider business model, scored highly on the market potential axis, due to the following factors:
• The quantitative support mentioned above formed an important component of Moody’s Analytics’ commitment to providing not only software, but also expertise to help FIs adapt to operational quirks or regulatory shifts. Moody’s Analytics’ commitment to helping FIs understand the external dynamics acting upon them, as well as the internal nuances of deployed analytics, were major components in Chartis’ scoring.
• Moody’s Analytics further demonstrated its market potential in its new client acquisitions. While other vendors focus on specific regions or sizes of FI, Moody’s Analytics has gained customers across the board, from Tier 1 global FIs to smaller, regional institutions. Many clients choose Moody’s Analytics’ BSM solution over that offered by their existing platform provider. While other vendors focused on selling more solutions to existing clients, Moody’s Analytics has pursued clients based on its BSM solution alone.
Table 2 shows Chartis’ rankings for Moody’s Analytics’ coverage against each of the market potential criteria.

© Copyright Chartis Research Ltd 2018. All Rights Reserved 13
Table 2: Market potential – Moody’s Analytics (Balance Sheet Management Technology 2018)
Market potential criterion Coverage
Customer satisfaction Medium
Market penetration High
Growth strategy High
Financials High
Business model Medium
Source: Chartis Research
© Copyright Chartis Research Ltd 2018. All Rights Reserved 14
3. Vendor contextOverview of relevant solutions/capabilities
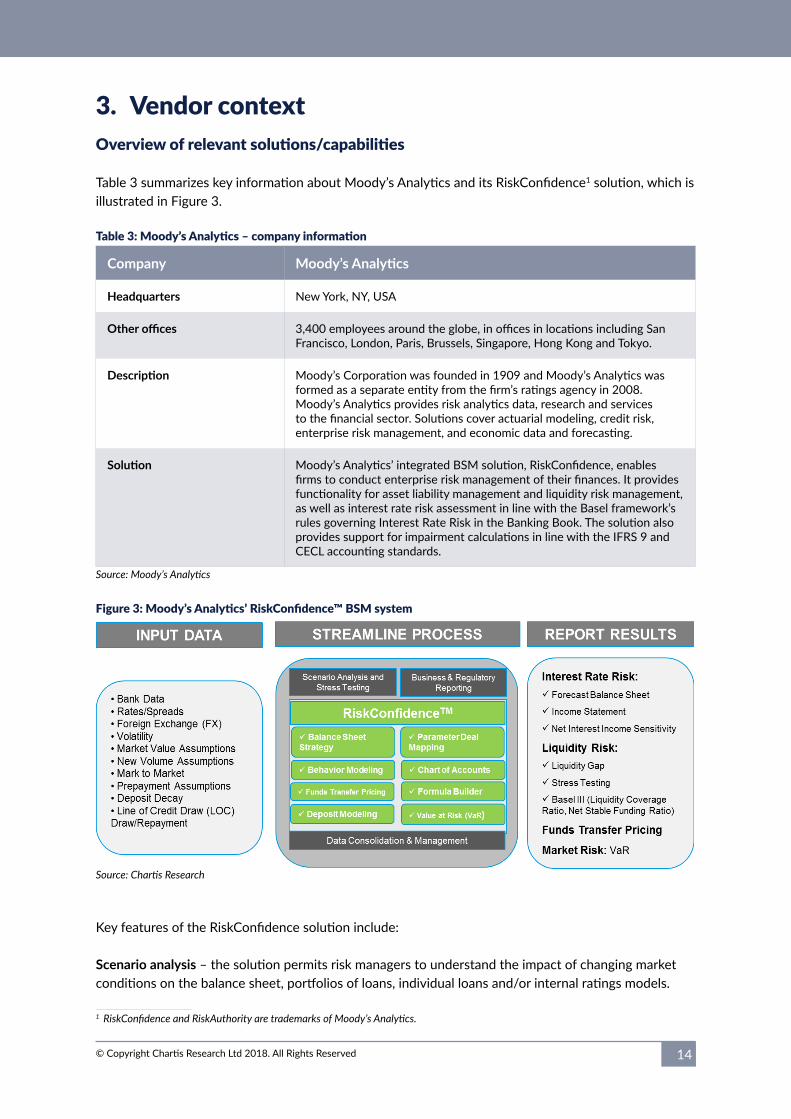
Table 3 summarizes key information about Moody’s Analytics and its RiskConfidence1 solution, which is illustrated in Figure 3.
Table 3: Moody’s Analytics – company information
Company Moody’s Analytics
Headquarters New York, NY, USA
Other offices 3,400 employees around the globe, in offices in locations including San Francisco, London, Paris, Brussels, Singapore, Hong Kong and Tokyo.
Description Moody’s Corporation was founded in 1909 and Moody’s Analytics was formed as a separate entity from the firm’s ratings agency in 2008. Moody’s Analytics provides risk analytics data, research and services to the financial sector. Solutions cover actuarial modeling, credit risk, enterprise risk management, and economic data and forecasting.
Solution Moody’s Analytics’ integrated BSM solution, RiskConfidence, enables firms to conduct enterprise risk management of their finances. It provides functionality for asset liability management and liquidity risk management, as well as interest rate risk assessment in line with the Basel framework’s rules governing Interest Rate Risk in the Banking Book. The solution also provides support for impairment calculations in line with the IFRS 9 and CECL accounting standards.
Source: Moody’s Analytics
Figure 3: Moody’s Analytics’ RiskConfidence™ BSM system
Source: Chartis Research
Key features of the RiskConfidence solution include:
Scenario analysis – the solution permits risk managers to understand the impact of changing market conditions on the balance sheet, portfolios of loans, individual loans and/or internal ratings models.
1 RiskConfidence and RiskAuthority are trademarks of Moody’s Analytics.
© Copyright Chartis Research Ltd 2018. All Rights Reserved 15
Chart of account structure – The Chart of Accounts (COA), which organizes all financial instruments on a bank’s balance sheet into a tree-like structure, is an important building block for risk methodology, assumption, and navigation. Moody’s Analytics’ solution maintains a single COA to ensure compatibility of data, processing and results, and provides consistency between all levels of the application. Features including contractual characteristics, client behavior, valuation formulas and FTP methods can all be specified at the account level.
Market data manager – centrally manages all capital markets time series to ensure coherent and uniform usage across the enterprise. It can perform simple to complex transformations on the various capital markets time series data, and custom equations to construct new datasets.
Multi-factor behavior model – users can create their own multi-factor behavior models using predefined and user-defined factors, multi-dimensional look-up matrices and multiplier matrices, interpolation, and unit settings. The model allows users to leverage their understanding of client behavior and embedded optionality.
Advanced deposit modeling – precise cash flow modeling of non-maturing deposits allows for realistic use cases where balances and deposit rates change and interest payments take place at different time intervals. The model also accounts for interests that are compounded periodically, as well as interests that are reinvested at each payment date.
Dynamic credit line utilization – a dynamic line utilization methodology allows the modeling of contingent credit usage, which varies with the economic environment and the credit quality of borrowers. Forecasts of usage for on- and off-balance sheet commitments are incorporated into the liquidity and earnings analysis to provide a holistic view of the credit exposure of the institution.
Equation builder – The advanced equation builder permits users to exercise a high degree of configuration, and allows them to define new volume strategies (including wholesale funding strategies). The equation builder leverages a full repertoire of mathematical functions and operators in order to access and manipulate bank data, market data, or cash flow engine results.
Grid computing – The solution’s grid computing architecture allows for large and complex calculations to be performed and scaled linearly in a distributed server environment. This architecture allows clients to make a small initial investment and then grow according to their business needs. This technology helps Moody’s Analytics to enable FIs to change assumptions easily and integrate several practices on the same set of data (balance sheet management, regulation, liquidity risk and so on).
Vendor leading practices
The RiskConfidence solution facilitates risk management across the balance sheet by enabling FIs to do the following.
Quantify risk across the enterprise:
• Covers a wide range of assets, liabilities and derivatives, including constant installment loans and non-maturing deposits.
• Leverages a multi-factor behavior model to permit the projection of behavioral cash flows.

© Copyright Chartis Research Ltd 2018. All Rights Reserved 16
• Uses precise modeling of contractual and optional cash flows.
Manage BSM and compliance for banks according to the drivers of balance-sheet optimization:
• Quantifies sources and uses of funds, taking into account both contractual and behavioral cash flows.
• Computes cash flow-based projections daily.
• Provides an understanding of the impact on the balance sheet (or specific portfolios) of changing market conditions.
• Quantifies counterbalancing liquidity buffers.
• Is natively integrated with RiskAuthority – Moody’s Analytics’ Basel I, II and III regulatory capital calculation solution. It calculates and forecasts the new Basel III liquidity ratios – Liquidity Coverage Ratio (LCR) and Net Stable Funding Ratio (NSFR) – and offers local regulator liquidity monitoring metrics and reports.
Determine funds transfer pricing:
• The RiskConfidence solution features a Funds Transfer Pricing (FTP) module that permits clients to (see Figure 4):
o Measure business unit profitability separately from interest rate risk.
o Centralize the measurement and management of interest rate risk.
o Provide consistent product pricing guidance to business lines.
o Set profitability targets for business units.
• The solution allows users to assign multiple FTP curves and economic FTP methodologies at the account level. In addition, users can define institution-specific FTP methodologies via custom Dynamic Link Libraries (DLLs) or simple lookup tables. Finally, users are able to make adjustments to the base funding curve for liquidity risk, credit risk, basis risk and options risk.

© Copyright Chartis Research Ltd 2018. All Rights Reserved 17
Figure 4: Fund Transfer Pricing framework
Source: Moody’s Analytics
Create opportunities for yield enhancement through enhanced decision making:
• Forecasts future balance sheet activity based on the most recent bank data.
• Enables users to target new volumes, beginning balances, average balances or ending balances.
• Empowers users to perform dynamic net interest income simulations under multiple scenarios, and to forecast the economic value of equity over time and under multiple scenarios that mix market data (IR, FX, EI) and behavior shifts.
• Provides a scenario analysis tool that allows for transparent scenario development.
Perform impairment calculation:
• IFRS9 ECL.
• FASB CECL.
• Multi-scenario support.
• Multi GAAPs support.
• Compute exposure profile.
• Integrated with Moody’s Analytics’ EL GCORR models.
• Integrated with Moody’s Analytics’ Scenario Analyzer model management software for custom PD modeling.
• Allows users to import pre-computed PD, LGD term structure per scenario.
• Built-in LGD engine to assess LGD based on collateralization levels (e.g., LTV)
• Configurable rule-based engine for stage allocation.

© Copyright Chartis Research Ltd 2018. All Rights Reserved 18
• Allows auditable user adjustments and overlays.
• Variance analysis feature.
• ‘Out of the box’ management reports.
• Integrated with Moody’s Analytics’ regulatory reporting engine.
Facilitate risk reporting, monitoring and communication:
• Offers predefined reports with drill-down functionality.
• A reporting interface allows users to distribute and articulate a firm’s risk profile.
Example integrations with the RiskConfidence system
1. Integration of structured cash flow engine and the RiskConfidence solution for ALM and stress testing.
Users can:
• Leverage the macroeconomic, credit and prepayment models integrated with the cash engine to analyze their structured portfolios.
• Forecast and stress test contractual cash flows for over 21,000 structured finance transactions.
• Generate, review and export asset and liability cash flows for their structured portfolios.
• Use standardized data for structured securities drawn from major servicer/trustee reports.
2. Monte Carlo Value at Risk (VaR) module integration.
Clients using the RiskConfidence solution can use enhanced Monte Carlo Value at Risk (VaR) calculations. This new module – part of Moody’s Analytics’ Economic Scenario Generator (ESG) – supports Monte Carlo simulation of a range of underlying risk drivers, including interest rates and foreign exchange rates.

© Copyright Chartis Research Ltd 2018. All Rights Reserved 19
4. MethodologyOverview
Chartis is a research and advisory firm that provides technology and business advice to the global financial services industry. Chartis provides independent market intelligence regarding market dynamics, regulatory trends, technology trends, best practices, competitive landscapes, market sizes, expenditure priorities, and mergers and acquisitions. Chartis’ RiskTech and FinTech Quadrants™ reports are written by experienced analysts with hands-on experience of selecting, developing and implementing financial technology solutions for a variety of international companies in a range of industries including banking, insurance and capital markets. The findings and analyses in our quadrant reports reflect our analysts’ considered opinions, along with research into market trends, participants, expenditure patterns, and best practices.
Chartis seeks to include RiskTech and FinTech vendors that have a significant presence in a given target market. The significance may be due to market penetration (e.g., a large client base) or innovative solutions. Chartis uses detailed ‘vendor evaluation forms’ and briefing sessions to collect information about each vendor. If a vendor chooses not to respond to a Chartis request for information, Chartis may still include the vendor in the report. Should this happen, Chartis will base its opinion on direct data collated from technology buyers and users, and from publicly available sources.
Chartis’ research clients include leading financial services firms and Fortune 500 companies, leading consulting firms and financial technology vendors. The vendors evaluated in our quadrant reports can be Chartis clients or firms with whom Chartis has no relationship.
Chartis evaluates all vendors using consistent and objective criteria, regardless of whether or not they are Chartis clients. Chartis does not give preference to its own clients and does not request compensation for inclusion in a quadrant report, nor can vendors influence Chartis’ opinion.
Selection criteria
In selecting vendors for this report, we took an expansive view of BSM. As well as traditional areas of BSM (like asset liability management and liquidity management), we considered vendors that support the surrounding operational components that deliver additional benefit to users. These included:
• Stress testing.
• Contingent claims valuation.
• Behavioral analytics.
Vendors that provided support for core BSM functions, as well as those supporting services, were of prime interest in deciding our research coverage.
© Copyright Chartis Research Ltd 2018. All Rights Reserved 20
Briefing process
We conducted face-to-face and/or web-based briefings with each vendor2. During these sessions, Chartis experts asked in-depth, challenging questions to establish the real strengths and weaknesses of each vendor. Vendors provided Chartis with:
• A business update – an overview of solution sales and client satisfaction.
• A product update – an overview of relevant solutions and R&D roadmaps.
• A product demonstration – key differentiators of their solutions relative to those of their competitors.
In addition to briefings, Chartis used other third-party sources of data, such as conferences, academic and regulatory studies, and publicly available information.
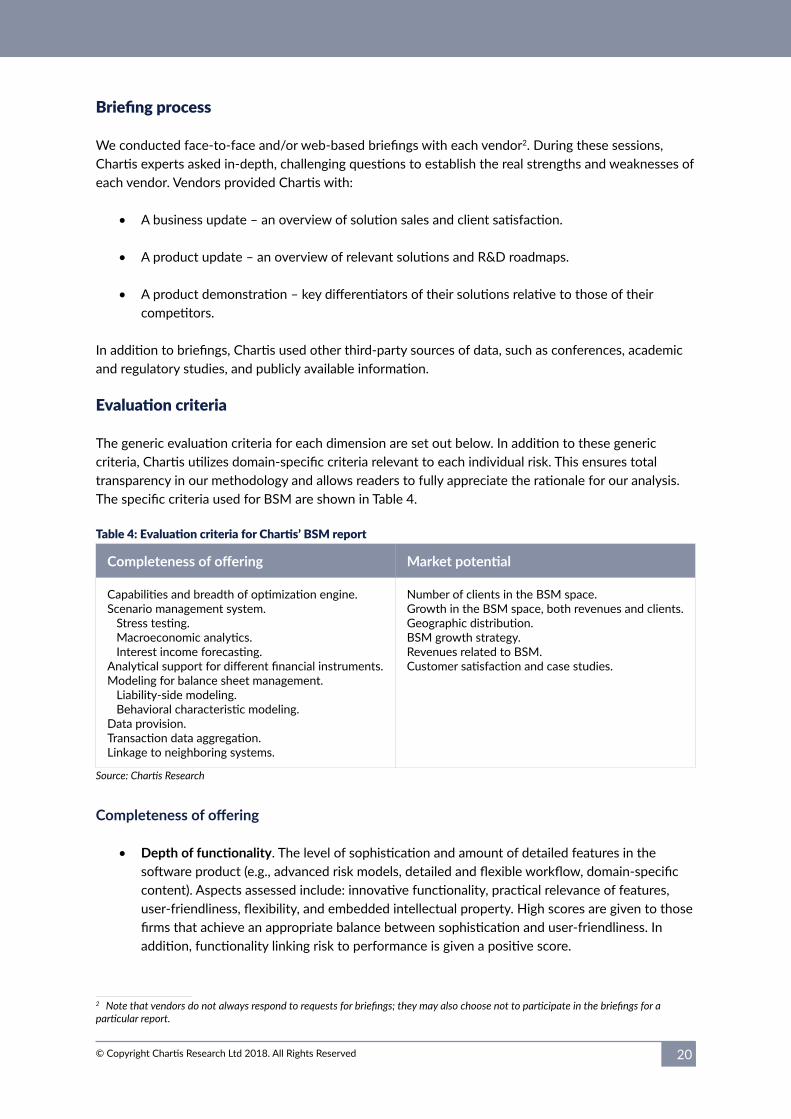
Evaluation criteria
The generic evaluation criteria for each dimension are set out below. In addition to these generic criteria, Chartis utilizes domain-specific criteria relevant to each individual risk. This ensures total transparency in our methodology and allows readers to fully appreciate the rationale for our analysis. The specific criteria used for BSM are shown in Table 4.
Table 4: Evaluation criteria for Chartis’ BSM report
Completeness of offering Market potential
Capabilities and breadth of optimization engine.Scenario management system. Stress testing. Macroeconomic analytics. Interest income forecasting.Analytical support for different financial instruments.Modeling for balance sheet management. Liability-side modeling. Behavioral characteristic modeling.Data provision.Transaction data aggregation.Linkage to neighboring systems.
Number of clients in the BSM space.Growth in the BSM space, both revenues and clients.Geographic distribution.BSM growth strategy.Revenues related to BSM.Customer satisfaction and case studies.
Source: Chartis Research
Completeness of offering
• Depth of functionality. The level of sophistication and amount of detailed features in the software product (e.g., advanced risk models, detailed and flexible workflow, domain-specific content). Aspects assessed include: innovative functionality, practical relevance of features, user-friendliness, flexibility, and embedded intellectual property. High scores are given to those firms that achieve an appropriate balance between sophistication and user-friendliness. In addition, functionality linking risk to performance is given a positive score.
2 Note that vendors do not always respond to requests for briefings; they may also choose not to participate in the briefings for a particular report.

© Copyright Chartis Research Ltd 2018. All Rights Reserved 21
• Breadth of functionality. The spectrum of requirements covered as part of an enterprise risk management system. This will vary for each subject area, but special attention will be given to functionality covering regulatory requirements, multiple risk classes, multiple asset classes, multiple business lines, and multiple user types (e.g. risk analyst, business manager, CRO, CFO, Compliance Officer). Functionality within risk management systems and integration between front-office (customer-facing) and middle/back office (compliance, supervisory and governance) risk management systems are also considered.
• Data management and technology infrastructure. The ability of risk management systems to interact with other systems and handle large volumes of data is considered to be very important. Data quality is often cited as a critical success factor and ease of data access, data integration, data storage, and data movement capabilities are all important factors. Particular attention is given to the use of modern data management technologies, architectures and delivery methods relevant to risk management (e.g., in-memory databases, complex event processing, component-based architectures, cloud technology, and Software as a Service). Performance, scalability, security and data governance are also important factors.
• Risk analytics. The computational power of the core system, the ability to analyze large amounts of complex data in a timely manner (where relevant in real time), and the ability to improve analytical performance are all important factors. Particular attention is given to the difference between ‘risk’ analytics and standard ‘business’ analytics. Risk analysis requires such capabilities as non-linear calculations, predictive modeling, simulations, scenario analysis, etc.
• Reporting and presentation layer. The ability to present information in a timely manner, the quality and flexibility of reporting tools, and ease of use, are important for all risk management systems. Particular attention is given to the ability to do ad-hoc ‘on-the-fly’ queries (e.g., ‘what-if’ analysis), as well as the range of ‘out of the box’ risk reports and dashboards.
Market potential
• Market penetration. Both volume (i.e., number of customers) and value (i.e., average deal size) are considered important. Also, rates of growth relative to sector growth rates are evaluated.
• Brand. Brand awareness, reputation, and the ability to leverage current market position to expand horizontally (with new offerings) or vertically (into new sectors) are evaluated.
• Momentum. Performance over the previous 12 months is evaluated, including financial performance, new product releases, quantity and quality of contract wins, and market expansion moves.
• Innovation. New ideas, functionality and technologies to solve specific risk management problems are evaluated. Developing new products is only the first step in generating success. Speed to market, positioning and translation into incremental revenues are critical success factors for exploiting the new product. Chartis also evaluates business model or organizational innovation (i.e., not just product innovation).
• Customer satisfaction. Feedback from customers regarding after-sales support and service (e.g., training and ease of implementation), value for money (e.g., price to functionality ratio)

© Copyright Chartis Research Ltd 2018. All Rights Reserved 22
and product updates (e.g., speed and process for keeping up to date with regulatory changes) is evaluated.
• Sales execution. The size and quality of the vendor’s sales force, and its sales distribution channels, global presence, focus on risk management, messaging and positioning are all important factors.
• Implementation and support. Important factors include size and quality of implementation team, approach to software implementation, and post-sales support and training. Particular attention is given to ‘rapid’ implementation methodologies and ‘packaged’ services offerings.
• Thought-leadership. Business insight and understanding, new thinking, formulation and execution of best practices, and intellectual rigor are considered important by end users.
• Financial strength and stability. Revenue growth, profitability, sustainability and financial backing (e.g., the ratio of license to consulting revenues) are considered key to the scalability of the business model for risk technology vendors.
Quadrant construction process
Chartis constructs its quadrants after assigning scores to vendors for each component of the completeness of offering and market potential criteria. By aggregating these values, we produce total scores for each vendor on both axes, which are used to place the vendor on the quadrant.
Definition of quadrant boxes
Chartis’ quadrant reports do not simply describe one technology option as the best solution in a particular area. Our ranking methodology is designed to highlight which solutions are best for specific buyers, depending on the technology they need and the implementation strategy they plan to adopt. Vendors that appear in each quadrant have characteristics and strengths that make them especially suited to that particular category, and by extension to particular users’ needs.
Point solutions
• Point solutions providers focus on a small number of component technology capabilities, meeting a critical need in the risk technology market by solving specific risk management problems with domain-specific software applications and technologies.
• They are often strong engines for innovation, as their deep focus on a relatively narrow area generates thought leadership and intellectual capital.
• By growing their enterprise functionality and utilizing integrated data management, analytics and Business Intelligence (BI) capabilities, vendors in the point solutions category can expand their completeness of offering, market potential and market share.
Best-of-breed
• Best-of-breed providers have best-in-class point solutions and the ability to capture significant market share in their chosen markets.
© Copyright Chartis Research Ltd 2018. All Rights Reserved 23
• They are often distinguished by a growing client base, superior sales and marketing execution, and a clear strategy for sustainable, profitable growth. High performers also have a demonstrable track record of R&D investment, together with specific product or ‘go-to-market’ capabilities needed to deliver a competitive advantage.
• Because of their focused functionality, best-of-breed solutions will often be packaged together as part of a comprehensive enterprise risk technology architecture, co-existing with other solutions.
Enterprise solutions
• Enterprise solution providers typically offer risk management technology platforms, combining functionally rich risk applications with comprehensive data management, analytics and BI.
• A key differentiator in this category is the openness and flexibility of the technology architecture and a ‘toolkit’ approach to risk analytics and reporting, which attracts larger clients.
• Enterprise solutions are typically supported with comprehensive infrastructure and service capabilities, and best-in-class technology delivery. They also combine risk management content, data and software to provide an integrated ‘one stop shop’ for buyers.
Category leaders
• Category leaders combine depth and breadth of functionality, technology and content with the required organizational characteristics to capture significant share in their market.
• They demonstrate a clear strategy for sustainable, profitable growth, matched with best-in-class solutions and the range and diversity of offerings, sector coverage and financial strength to absorb demand volatility in specific industry sectors or geographic regions.
• They will typically benefit from strong brand awareness, a global reach, and strong alliance strategies with leading consulting firms and systems integrators.

© Copyright Chartis Research Ltd 2018. All Rights Reserved 24
5. Further reading• RiskTech100® 2018
• Data Integrity and Control in Financial Services: Market Update 2018
• Hedge Fund Risk Management Technology 2018
• Open Source in Capital Markets 2018
• MiFID II Reporting Solutions 2017
• FRTB Solutions 2017
For all these reports see www.chartis-research.com.