Embed Size (px)
Citation preview

L r 1 .’
/
30
REPORT TO THE CONGRESS
Examination Of Financial Statements Of The Tennessee Valley Authority For Fiscal Year 1970,-,,,,,,
BY THE COMPTROLLER GENERAL OF THE UNITED STATES
7 5bfif
c *- .
REPORT TO THE CONGRESS
Examination Of Financial Statements Of The Tennessee Valley Authority For Fiscal Year 1970B-l,,,50
BY THE COMPTROLLER GENERAL OF THE UNITED STATES
COMPTROLLER GENERAL OF THE UNITED STATES
WASHINGTON. D.C. 20548
B- 114850
To the President of the Senate and the Speaker of the House of Representatives
This is our report on the examination of the financial statements of the Tennessee Valley Authority for fiscal year 1970, made pursuant to the Government Corporation Control Act (31 U.S.C. 841). We have included as an appendix to this report a description of TVA’s retirement system together with financial statements and the certified public accounting firm’s opinion thereon.
Copies of this report are being sent to the Director, Office of Management and Budget; the Secretary of the Treasury; and the Chairman of the Board of Directors of the Tennessee Valley Authority,
z nb Comptroller General of the United States
50TH ANNIVERSARY 1921- 1971

I I
I . ,
I . I
I I I I I I
COMPTROLLER GENERAL'S EXAMINATION OF FINANCIAL STATEMENTS OF REPORT TO THE CO??GRESS THE TENNESSEE VALLEY AUTHORITY FOR FISCAL
YEAR 1970 B-114850
DIGEST _-----
VHY THE EXAIUNATION ‘WAS MADE
The Government Corporation Control Act requires the Comptroller Gen- eral to audit the Tennessee Valley Authority annually.
FINDINGS AiVD CCdCLUSIONS
In the opinion of the General Accounting Office, the Authority's fi- nancial statements present fairly its financial position at June 30, 1970, and the results of its operations and the source and disposition of its funds for the year then ended, in conformity with generally ac- cepted accounting principles applied on a basis consistent with that of the preceding year and with applicable Federal laws. (See p. 20.)
Net income from power operations for fiscal year 1970 was $74.6 mil- lion, $24 million more than for fiscal year 1969. (See p, 6.) Of the $74.6 million, $57.6 million was paid into the U.S. Treasury as a return on the Government's investment in power facilities (see p. 8) and $15 million was paid into the U.S. Treasury as a partial repayment of the Government's investment (see p. 8) as required by section 15d of the Tennessee Valley Authority Act and the remaining $2 million in- creased proprietary capital.
Operating expenses and interest charges increased during fiscal year 1970 over comparable fiscal year 1969 amounts by 13 and 35 percent, respectively. As a result, the Authority increased power rates in August and October 1970. (See p. 7.)
On October 14, 1970, Public Law 91-446 was enacted, which increased the amount of bonds, notes, and other evidence of indebtedness which the Authority may have outstanding at any one time from $1.75 billion to $5 billion. (See p. 9.)
During fiscal year 1970, power-revenue bond sales of $300 million were made at effective interest rates ranging from 8.3 to 9.3 percent. (See p. 9.)
The aggregate net power income for the latest 5 fiscal years was about $2 million less than required under the Basic Bond Resolution to en- able the Authority to increase the amount of bonds outstanding. As
Tear Sheet
1

I I
a result, the Authority may issue only short-term securities during fiscal year 1971. (See pp. 9 and 10.)
The third Paradise steam unit in western Kentucky began commercial op- eration in February 1970. (See p. 12.)
The Authority now expects to begin operating its first nuclear power generating unit at Browns Ferry, Alabama, in April 1972, although originally planned for operation in fiscal year 1970. (See pa 12.)
Construction was started during the year on a new pumped-storage plant. During off-peak power usage periods, water will be pumped into a moun- taintop reservoir. Electricity generated when the water is released will help meet peak-period loads. (See p. 12.)
The quantity of coal available in the Authority's supply area declined to an all-time low and prices reached an all-time high in fiscal year 1970. The Authority's efforts to ensure adequate coal supplies in- cluded visiting coalfields to seek new sources of supply and obtaining advance deliveries of coal. (See pp. 12 to 14.)
Pollution control and abatement activities during fiscal year 1970 cost $30.3 million. TVA estimates that these activities will cost $38 mil- lion during fiscal year 1971. This program is concentrated largely on problems caused by the Authority's operations, such as emissions from s%eam plant stacks and warmwater discharges from steam plant cooling systems. (See pp. 1% to 18.)
RECOkPlENDATIONS OR SUGGESTIONS
None.
AGENCY ACTIONS AND UNRESOLVED ISSUES
MATT!YRS FOR CONSIDERATION BY THE CONGRESS
This report contains no recommendations or suggestions requiring action by the Congress. It is submitted to the Congress, as required by the Government Corporation Control Act, to disclose the results of the an- nual audit of the Authority's financial statements and such other in- formation deemed necessary to keep the Congress informed of the opera- tions and financial conditions of the Authority.
2

Contents
DIGEST
CHAPTER
1
2
3
4
EXHIBIT
I
II
III
IV
INTRODUCTION
GENERAL COMMENTS Power operations Fiscal year 1971 rate increases Proprietary capital and payments to the
Treasury of the United States Borrowing authority Fiscal year 1971 security sales Construction program Coal procurement Environmental quality activities
Air quality Water quality
SCOPE OF EXAMINATION
OPINION OF THE FINANCIAL STATEMENTS
Balance sheets, June 30, 1970, and 1969 25
Power program, net income and retained earnings for the years ended June 30, 1970, and 1969 a
Nonpower programs, net expense and accu- mulated net expense for the years ended June 30, 1970, and 1969
Source and disposition of funds for the years ended June 30, 1970, and 1969
Notes to financial statements
Page
1
3
5 5 7
8 9 9
11 12 15 15 17
19
20
27
28
30
31

SCHEDULE Page
A Completed plant, June 30, 1970 37
B Construction and investigations in progress, June 30, 1970 38
C Details of power expense for the year ended June 30, 1970 39
D Details of nonpower net expense for the year ended June 30, 1970 40
E Operating expenses of multiple-use facili- ties for the year ended June 30, 1970 44
F Administrative and general expenses for the year ended June 30, 1970 45
APPENDIX
1 Retirement system of the Tennessee Valley Authority 50
l3.t.u British thermal unit
TVA Tennessee Valley Authority

COMPTROLLER GENERAL'S RZPORT TO ?.'HE CONGRESS
EXAMINATION OF FINANCIAL STATEMENTS OF THE TENNESSEE VALLEY AUTHORITY FOR FISCAL YEAR 1970 B-114850
DIGEST ----we
WHY THE EXAMZNATION'WAS MADE
The Government Corporation Control Act requires the Comptroller Gen- eral to audit the Tennessee Valley Authority annually.
FINDINGS AND C~dCLUSIONS
In the opinion of the General Accounting Office, the Authority's fi- nancial statements present fairly its financial position at June 30, 1970, and the results of its operations and the source and disposition of its funds for the year then ended, in conformity with generally ac- cepted accounting principles applied on a basis consistent with that of the preceding year and with applicable Federal laws. (See p. 20.)
Net income from power operations for fiscal year 1970 was $74.6 mil- lion, $24 million more than for fiscal year 1969. (See p. 6.) Of the $74.6 million, $57.6 million was' paid into the U.S. Treasury as a return on the Government's investment in power facilities (see p. 8) and $15 million was paid into the U.S. Treasury as a partial repayment of the Government's investment (see p. 8) as required by section 15d of the Tennessee Valley Authority Act and the remaining $2 million in- creased proprietary capital.
Operating expenses and interest charges increased during fiscal year 1970 over comparable fiscal year 1969 amounts by 13 and 35 percent, respectively. As a result, the Authority increased power rates in August and October 1970. (See p. 7.)
On October 14, 1970, Public Law 91-446 was enacted, which increased the amount of bonds, notes, and other evidence of indebtedness which the Authority may have outstanding at any one time from $1.75 billion to $5 billion. (See p. 9.)
During fiscal year 1970, power-revenue bond sales of $300 million were made at effective interest rates ranging from 8.3 to 9.3 percent. (See p. 9.)
The aggregate net power income for the latest 5 fiscal years was about $2 million less than required under the Basic Bond Resolution to en- able the Authority to increase the amount of bonds outstanding. As
1

a result, the Authority may issue on1 short-term securities during fiscal year 1971. (See pp. 9 and 10. 3
The third Paradise steam unit in western Kentucky began commercial op- eration in February 1970. (See p. 12.)
The Authority now expects to begin operating its first nuclear power generating unit at Browns Ferry, Alabama, in April 1972, although originally planned for operation in fiscal year 1970. (See p. 12.)
Construction was started during the year on a new pumped-storage plant. During off-peak power usage periods, water will be pumped into a moun- taintop reservoir. Electricity generated when the water is released will help meet peak-period loads. (See p. 12.)
The quantity of coal available in the Authority's supply area declined to an all-time low and prices reached an all-time high in fiscal year 1970. The Authority's efforts to ensure adequate coal supplies in- cluded visiting coalfields to seek new sources of supply and obtaining advance deliveries of coal. (See pp. 12 to 14.)
Pollution control and abatement activities during fiscal year 1970 cost $30.3 million. TVA estimates that these activities will cost $38 mil- lion during fiscal year 1971. This program is concentrated largely on problems caused by the Authority's operations, such as emissions from steam plant stacks and warmwater discharges from steam plant cooling systems. (See pp. 15 to 18.)
RECOMMi7NDATIONS OR SUGGESTIONS
None.
AGENCY ACTIONS AlVD UNRESOLVED ISSUES
None.
MATTERS FOR CONSIDERATION BY TEE CONGRESS
This report contains no recommendations or suggestions requiring action by the Congress. It is submitted to the Congress, as required by the Government Corporation Control Act, to disclose the results of the an- nual audit of the Authority's financial statements and such other in- formation deemed necessary to keep the Congress informed of the opera- tions and financial conditions of the Authority.
2

CHAPTER1
INTRODUCTION
The General Accounting Office has examined the finan- cial statements of the Tennessee Valley Authority (TVA) for the fiscal year ended June 30, 1970.
A description of TVA's retirement system, together with related financial statements and the certified public accounting firm's opinion thereon, is included in the ap- pendix.
The Tennessee Valley Authority Act of May 18, 1933 (48 Stat. 58; 16 U.S.C. 831) created TVA, a Government cor- poration, to provide for the unified development of the Ten- nessee River system. TVA's functions include both the power program and nonpower.programs, such as flood control, navigation, and fertilizer and munitions development.
TVA expects that increasing power demands in the Ten- nessee Valley region will require a doubling of capacity in the next decade. During fiscal year 1970, 19.4 million kilowatts of generating capacity were in service and 10 mil- lion kilowatts of capacity were under construction. In- creasing construction and operating costs, coal shortages, and construction slippages hampered the power program dur- ing the year, and TVA expects these problems to continue.
At the end of fiscal year 1970, TVA had about 22,200 employees-- an increase of about 2,700 over the previous year. According to TVA, the increase resulted primarily from the accelerated power construction program.
A three-man Board of Directors manages TVA, Members are appointed to g-year terms, which expire at 3-year inter- vals, by the President of the United States with the advice and consent of the Senate, Board members at June 30, 1970, and the expiration dates of their terms are:
Aubrey J. Wagner, Chairman May 18, 1978 Frank E. Smith, Director II 81 1972 Don McBride, Director I? 11 1975

CHAPTER 2
GENERAL COMMENTS
In addition to providing for our examination of the financial statements, the Government Corporation Control Act (31 U.S.C. 841) provides for the Comptroller General to include in his annual report on the audit of each Government corporation such other information and comments as may be appropriate to keep the Congress informed of the financial condition and operations of each such corporation. There- fore we are including in the following sections of this re- port, information and comments on matters which we believe may be of interest to the Congress.
POWER OPERATIONS
TVA supplies power, at wholesale, to 160 municipal and cooperative electric systems and one small privately owned system, which distribute power to'more than two million customers in parts of seven States. Power is also sold di- rectly to 46 industrial power consumers having large or un- usual power requirements and to several Federal atomic, aerospace, and military installations.
Section 14 of the TVA Act requires that power accounts be kept in accordance with the uniform system prescribed for electric utilities by the Federal Power Commission. Operat- ing results of the power program for fiscal year 1970 are shown in exhibit II of the financial statements. The results are summarized and compared with those of fiscal year 1969, as follows:
I
5

1970 1969
Operating revenues: Sales of electric
energy $461,477,970 $388,099,883 Rents and other
revenues
Total operating revenues
Operating expenses
Operating in- come
Interest income
Total income
Interest charges
Net income
Payment of return on appropriation in- vestment
Increase or de- crease(-) in
18.137.729 15,181,053
479,615,699 403,280,936
374.214.625 329,822,456
105,401,074
15,360a
105,416,434
30,799,564
74,616,870
57,648,798 53.082.238
73,458,480
73,458,480
22,768,320
50,690,160
Percent ' in-
crease
19
19
19
13
43
44
35
47
9
retained earn- ings $ 16,968,072 $ -2,392,078
aIncome on temporary investments,
Substantially greater revenues were realized in fiscal year 1970 than in fiscal year 1969, because (1) more elec- tricity was sold during 1970 and (2) the average rate charged for electricity was higher during 1970. In March 1969 TVA increased the rates charged to consumers to help meet higher costs. Automatic adjustment provisions to cover increases in TVA's cost of fuel and borrowing money were put into effect in August 1969.
6

Operating and interest costs during 1970, however, were significantly higher than during 1969. TVA informed us that these costs were greater than anticipated. Also TVA bought more electrical power from other power producers than it sold to power producers during the year at a net cost of $9.6 million.
FISCAL YEAR 1971 BATE INCREASES
The act requires that TVA sell power at rates as low as feasible and yet adequate to maintain the financial soundness of the power program. Operating expenses and interest charges increased during fiscal year 1970 over comparable fiscal year 1969 amounts by 13 and 35 percent, respectively, According to TVA, these cost increases necessitated rate increases in fiscal year 1971.
The rate increases, which TVA expects will provide an increase in revenue of about 23 percent, were effective in two increments --on August 1 and October 2, 1970. The Au-' gust increase was based on existing rate schedules which provided that higher rates be effective automatically on August 1, 1970, in response to rises in the cost of fuel and money.
Since the automatic, August adjustment failed to provide revenues sufficient to cover the rapid increases in TVA op- erating costs, it had to be supplemented by a substantial increase in power rates on October 1 to obtain the additional revenues needed to meet rising costs, TVA and the distribu- tors agreed at that time to substitute a quarterly review procedure for the automatic annual adjustment.
Under the new procedure TVA's prospective power revenues and expenses are reviewed at the end of each 3-month period by a committee representing the distributors. The TVA Board then determines whether a rate adjustment--upward or down- ward--will be needed.

PROPRIETARY CAPITAL AND PAYMENTS TO THE TREASURY OF THE UNITED STATES
From the inception of TVA in 1933 to June 30, 1970, the United States made available to TVA $2,567 million in propri- etary capital through appropriations, bond purchases, and property transfers. During the same period, TVA repaid $417 million to the U.S. Treasury, retained earnings of $661 million from its power programs and incurred net ex- penses of $454 million on its other programs. At June 30, 1970, the Government's proprietary capital in TVA was $2,358 million,
Under section 15d of the TVA Act, as added by Public Law 86-137 on August 6, 1959, TVA is required to repay each year into the Treasury part of the net appropriation invest- ment in power facilities and pay a return on the outstanding investment. Beginning with fiscal year 1961, repayments to the Treasury are required, as follows: $10 million annually for the first 5 years, $15 million annually for the next 5 years, and $20 million annually thereafter until a total of $1 billion has been repaid. Although the Board of Directors may defer the payments for 2 years, this option has not been exercised. TVA had repaid $125 million to the Treasury un- der this provision at June 30, 1970, and about $292 million prior to fiscal year 1961.
The required payment to the Treasury of an annual re- turn on the net appropriation investment in power facilities is based on the average interest rate payable by the Treasury on its total marketable public obligations at the beginning of the fiscal year and on the unrepaid appropriation invest- ment as of the same time. The 10 annual payments of the re- turn on the appropriation investment that had been made as of June 30, 1970, amounted to $448.2 million and included a payment of $57.6 million in fiscal year 1970.
During fiscal year 1971, TVA will be required to pay into the Treasury from power proceeds $20 million as a re- payment of the appropriation investment and $65.1 million as a return on the investment. Computation of the return was based on the unrepaid appropriation investment of $1,088 million at July 1, 1970, and on the average Treasury interest rate of 5.986 percent at that date.

BORROWING AUTHORITY
TVA is authorized, under section 15d of the act, to issue and sell bonds, notes, and other evidence of indebt- edness to assist in financing its power program, Prior to the enactment of Public Law 91-446 on October 14, 1970, the amount outstanding at any one time was not to exceed $1.75 billion. Public Law 91-446 increased this limit to $5 billion.
Section 15d provides that the time of issuance and max- imum interest rates to be borne by the obligations are sub- ject to approval by the Secretary of the Treasury, who is authorized to purchase TVA interim obligations up to $150 million outstanding at any one time. Debt service on these obligations is payable solely from TVA's net power proceeds and has precedence over repayments of the appropriation in- vestment and payments of a return on investment made to the Treasury. Bond sales, which began in 1960, totaled $675 mil- lion as of June 30, 1970. Of this amount, power-revenue bond sales of $300 million were made in fiscal year 1970 at effective interest rates ranging from 8.3 to 9.3 percent.
Short-term power notes , generally maturing in about 4 months, were sold on a competitive-bid basis during the fiscal year to various underwriters at an average interest rate of 8.172 percent. At June 30, 1970, TVA had short-term notes outstanding of $321 million, a decrease of $31.7 mil- lion from the amount outstanding at the beginning of the fiscal year.
Advances from the Treasury, under provisions of section 15d of the act, were obtained at an average interest rate of 7.303 percent for the year. TVA had advances outstanding of $100 million from the Treasury at June 30, 1970.
FISCAL YEAR 1971 SFCURITY SALES
Under section 3.4 of the Basic Tennessee Valley Author- ity Power Bond Resolution, adopted October 6, 1960, TVA's net power income for the latest 5 fiscal years must have ag- gregated at least $200 million before the amount of bonds outstanding might be increased. Moreover,that minimum re- quirement is increased by $15 million for each one quarter
9

of 1 percent (or major fraction thereof) by which the aver- age interest rate that TVA is required to use in calculating the annual return on the net appropriation investment in power has exceeded 3-l/4 percent during those 5 years.
TVA failed to meet this requirement for the 5-year period ended June 30, 1970, as shown below, and, as a result may issue only short-term securities during fiscal year 1971.
Amount
Required aggregate income: Minimum Additional requirement .
Net power income: Fiscal year:
1966 1967 1968 1969 1970
(000 omitted)
$200,000 75,000a
$275,000
$ 47,889 40,746 59,082 50,690 74,617
$273,024
aThe applicable interest rate was 4.418. Therefore the ad- ditional requirement was 5 times $15 million, or $75 mil- lion.
10

CONSTRUCTION PROGRAM
At June 30, 1970, TVA's gross investment in fixed as- sets for all programs-- including construction and investi- gations in progress--was $4,423 million, During fiscal year 1970, additions to construction in progress amounted to $357.5 million and transfers to completed plant amounted to $253.5 million. A summary of additions to construction in progress during the year follows.
Direct power: Generating facilities:
Nuclear plants: Browns Ferry--3 units Sequoyah--2 units
Coal-fired steam plants: Paradise--l unit
(in commercial operation) Cumberland--2 units
Pumped-storage plant: Raccoon Mountain--4 units
Transmission lines, substations, and other facilities
Total direct power
Multipurpose facilities: Tellico Dam and Reservoir Tims Ford Dam and Reservoir Upper French Broad water
control system Bear Creek water control system Other
Chemical plant Land Between the Lakes and other
recreation and educational facilities
Navigation facilities General plant and equipment
Total additions to construction in progress in fiscal year 1970
Less reduction due to write-off of prior-year costs of flood control facilities
Net additions to construction in progress in fiscal year 1970
$116,183,736 la,427,474
14,277,420 100,613,282
6,090,303 9,591,653
45,381 448,258 609,355
$134,611,210
114,890,702
3,170,247
76,644,465
329,316,624
16,784,950
2,925,078
3,296,427 418,733
4,827,015
357,568,827
-44,542
$357,524,285
11

According to TVA's original plans9 one or more of the eight nuclear and coal-fired units were scheduled to go into operation in each of the 5 succeeding years beginning with 1970. In February 1970, the third Paradise steam unit in western Kentucky began commercial operation, The first of the nuclear units at Browns Ferry was scheduled to begin operation in 1970, the second in 1971, and the third in 1972. The units are now scheduled to go into operation in April 1972, January 1973, and October 1973, respectively.
According to TVA, construction at the Cumberland steam plant is on schedule and the units are expected to be in op- eration in July 1972 and April 1973. The two Sequoyah nu- clear units are scheduled for operation in April and Decem- ber 1974. Construction continued on the Tims Ford Dam which is scheduled for operation in 1971.
In addition to expansion of extra-high-voltage trans- mission lines and substations to facilitate increased power interchange and effect peak-load economies, TVA started con- struction of the Raccoon Mountain pumped-storage plant. During off-peak power usage periods, water will be pumped from the Tennessee River into a mountaintop reservoir, Electricity generated when the water is released will help meet peak-period loads.
Also gas turbines to be installed at the Allen steam plant had been ordered, as of the end of fiscal year 1970, for use during periods of peak power demands and emergency conditions. TVA expects these to be operational by the sum- mer of 1971.
Because of limited funds, construction on the Tellico Dam and Reservoir was limited primarily to land acquisition and road. and bridge relocation. Modernization of chemical facilities and construction of facilities for the recreation project, Land Between the Lakes, were continued during fis- cal year 1970.
COAL PROCUREMENT
TVA officials advised us that the quantity of coal available in TVA's supply area declined to an all-time low
12

and prices reached an all-time high in fiscal year 1970. Stockpiles decreased from 4.4 million tons on June 30, 1969, to 2.9 million tons on June 30, 1970. On January 21, 1971, 4.4 million tons of coal were stockpiled. Over 32 million tons of coal were burned during the fiscal year.
To provide for its coal needs, TVA makes term, spot, and emergency purchases of coal. Term purchases are made under normal bidding procedures, and contracts for such purchases call for regular deliveries over periods of at least 6 months and usually longer than 1 year. Spot pur- chases are similar to term purchases except that the deliv- ery period may not exceed 4 weeks. For emergency purchases contracts are negotiated, rather than advertised, and usu- ally the delivery period is 6 months or less. TVA consid- ers an emergency to exist when the coal stockpiled at any one steam plant is insufficient for 60 days of continuous operation.
Because of the decline in coal stockpiles and because of poor response to invitations to bid on term purchases, TVA negotiated 42 contracts for emergency purchases during fiscal year 1970 compared with six contracts for emergency purchases in fiscal year 1969. The statistics on the method of coal procurement under contracts awarded in fiscal years 1969 and 1970 for power operations are shown below.
Method Tons
(millions) Percent 1969
Term 158.0 98.9 Emergency 0.9 0.6 spot 0.8 0.5
Total 159.7 100.0
1970
Term 46.1 91.3 Emergency 3.8 7.5 spot 0.6 1.2
Total 50.5 100.0
13

TVA indicates that there is a coal supply shortage caused by such factors as the coal industry's not develop- ing new coal mines to meet increased demands for coal, in- creased competition for the available coal supply, shortage of railroad coal cars and trained miners, wildcat strikes, equipment breakdowns, and adverse mining conditions. Ac- cording to TVA, the coal supply shortage resulted in rap- idly increasing prices. In addition, TVA pointed out that price increases under escalation provisions of existing contracts and increases in transportation costs also con- tributed to higher coal costs.
Most of TVA's contracts for term purchases provide for price escalation based on the Bureau of Labor Statistics Index of Wholesale Prices, All Commodities, During fiscal year 1970, the value of the index increased 3.4 percent, Consequently, prices for coal purchased under these con- tracts increased about $56,000.
Several of TVA's coal suppliers have made claims for price increase adjustments under the gross inequities clause, the renegotiation clause, or other clauses of their contracts. During fiscal year 1970, TVA reached agreement with several suppliers for price increases ranging from 9 cents to $1.69 a ton. Usually TVA was able to negotiate amendments to contracts and to reschedule excusable delivery deficiencies when otherwise the coal would not have been delivered because of cancellation of the contracts.
TVA's efforts to ensure adequate coal supplies included visiting coalfields to seek new sources of supply and ob- taining advance deliveries of coal. In addition, TVA nego- tiated a contract with a coal producer for the mining of about 1.5 million tons of coal from TVA-owned reserves. Also TVA entered into two long-term contracts under which it guaranteed payments on the producers' capital invest- ments. In return for TVA's guarantee of principal and in- terest on notes of $25 million, TVA received liens on the producers' equipment. The contracts call for the delivery of 2.35 million tons of coal a year for 17 years.
14

ENVIRONMENIXL QUALITY ACTIVITIES
Research, monitoring, and surveillance of environmental quality of the Tennessee Valley are coordinated with pro- grams of Federal and State pollution control agencies. TVA's program, however, is concentrated largely on problems caused by its own operations, such as emissions from steam plant stacks and warmwater discharges from steam plant cool- ing systems.
TVA's pollution control and abatement activities, dur- ing fiscal year 1970, cost $30.3 million. TVA estimates that these activities will cost $38 million during fiscal year 1971. The nature and cost of such activities and the source of funds used during fiscal year 1970 are as follows:
Remedial action to control pollution at TVA facilities (largely electrostatic precipitators, see p. 16) $25,676,000
Research, development, and demonstra- tions 3,122,OOO
Monitoring and surveillance of pollution sources 1,155,ooo
Assistance to State, local, and interstate agencies 316,000
Laboratory equipment and facilities 75,000
Total $30,344,000
Source of funds: Power program Appropriations Reimbursements
Total
from others
$26,158,000 1,855,OOO 2,331,OOO
$30,344,000
Air quality
All 11 coal-fired power plants in TVA's power system are equipped either with cyclone furnaces which discharge about 30 percent of the ash produced during combustion as fly ash or with pulverized fuel furnaces which discharge over half of the ash produced as fly ash. The remaining ash stays in the furnaces as bottom slag.
15

TVA plants built in the 1950's had mechanical fly ash collectors capable of removing about two thirds of the fly ash produced. This equipment met prevailing air-quality standards at the time of construction, but the rapid growth of power generation and the advent of more stringent State. air-quality standards required better ash collection methods. In 1960, TVA began adding more efficient electrostatic pre- cipitators at an estimated cost of $100 million. TVA esti- mated that, of 3.2 million tons of fly ash generated at its power plants in 1969, about 0.6 million tons were released into the atmosphere, an ash removal efficiency of 81 percent. TVA estimates that by 1975 only 2 percent of the fly ash gen- erated will be released into the atmosphere, if all equip- ment being installed meets specifications.
In addition to producing fly ash, the burning of coal produces significant quantities of gaseous sulfur dioxide. TVA estimates that in 1969 its power plants released 1.8 mil- lion tons of sulfur dioxide into the atmosphere. Pending the development and application of more effective processes, high stacks have been used to disperse the gas and thus limit its concentration at ground level.
With few exceptions the use of tall stacks has been ef- fective in preventing significant vegetation damage, but the construction of larger units and the trend toward more strin- gent air-quality standards have led to long-range plans for developing sulfur dioxide removal systems. TVA plans to in- stall a research and demonstration wet limestone scrubber system for sulfur dioxide removal on a unit at the Widows Creek steam plant at a projected cost for the unit of more than $10 million.
In addition to its programs, TVA for several years has been carrying out studies and tests of sulfur dioxide re- moval processes under the sponsorship of the National Air Pollution Control Administration. Full-scale tests at the Shawnee steam plant of a dry limestone injection process and additional research are expected to cost $7.3 million over a 3-year period. TVA hopes to incorporate advances in tech- nology resulting from the studies and tests at Shawnee into the wet limestone scrubber unit planned for the Widows Creek plant.
16

Water quality
Steam plant electric power production involves the dis- posal of large amounts of waste heat into cool water circu- lating through heat exchangers. For each kilowatt-hour of electrical energy produced in a modern coal-fired plant, about two thirds of the heat from the coal is waste heat, most of which must be dissipated- in cool water. Nuclear plants are expected to produce about 40 percent more waste heat than coal-fired plants.
Since 1955 TVA has been studying the distribution of heated-water discharges into streams and reservoirs from its coal-fired plants. The first plants presented few problems since their discharges were relatively small compared with the size of receiving streams. Larger discharges of waste heat evolved with the increased production of electricity and the use of larger generating units. For example, the Watts Bar plant, placed in operation during the 1940's, has a generating capacity of 240,000 kilowatts and uses 280,800 gallons of cooling water a minute to dissipate the 24.7 mil- lion B.t.u.'sl of waste heat a minute. In contrast, the Browns Ferry nuclear plant will have a generating capacity of 3.5 million kilowatts and will use 1.8 million gallons of cooling water a minute to dissipate 370 million B.t.u.'s of waste heat a minute.
TVA advised us that the standards for stream tempera- ture for the design of water-cooling equipment at the Browns Ferry nuclear plant and subsequent plants used by TVA are predicated to some extent on the standards which the Federal Water Quality Administration approved for the State of Geor- gia in 1967. In 1969, according to TVA, the Administration approved more stringent standards for two other States--Vir- ginia and North Carolina. TVA has no thermal power plants in these three States where water temperature standards have
1 A British thermal unit is the amount of heat required to raise the temperature of 1 pound of water lo F. at or near its point of maximum density.
17

been approved. A TVA official has informed us that TVA will, in every case, do what is required to meet applicable State standards when they are formally established.
The Federal Water Quality Administration and TVA are planning a $2.4 million research project at the Browns Ferry nuclear plant to study thermal pollution effects on aquatic life. Eight naturalistic stream channels are planned, each varying in depth from 1 to 4 feet. Two channels will serve as biological controls, and the other six channels will con- tain water at temperatures above that in the control chan- nels. TVA officials stated that results from this project should contribute greatly to the knowledge of actual effects of heated discharges on aquatic life.
TVA also conducts projects and sponsors research at various schools on methods of controlling aquatic plants. The luxuriant growth of aquatic plants sometimes forms dense mats of plants in shallow water, which block small boats and swimmers, clog water intakes at steam plants, and create hab- itats for mosquito breeding.
TVA began a program on environmental radioactivity mon- itoring at Browns Ferry early in 1968. This program will provide a continuing check on the effectiveness of controls incorporated into the plant's design and operation in con- trolling the levels of radioactivity in the atmosphere, earth, and aquatic environments.
18

CHAPTER 3
SCOPE OF EXAMINATION
Our examination of TVA's balance sheet as of June 30, 1970, and the related statements of power and nonpower pro- grams and of source and disposition of funds for the year then ended was made in accordance with generally acceIfted auditing standards and included such tests of the account- ing records and such other auditing procedures as we con- sidered necessary in the circumstances. ':i I
As provided by section 15d(c) of the TVA Act, TVA em- ploys a firm of certified public accountants to audit its accounts and financial statements for each fiscal year, to facilitate TVA's issuance and sale of revenue bonds, The audit does not take the place of that required of our Office under the Government Corporation Control Act. Cur audit included observations and tests of the firm's audit work.
19
CHAPTER 4
OPINION OF THE FINANCIAL STATEMENTS
The financial statements (exhibit I through IV and schedules A through F) were prepared by TVA. In our opinion, these financial statements present fairly TVA's financial position at June 30, 1970, and the results of its operations and the sources and disposition of its funds for the year then ended, in conformity with generally accepted account- ing principles applied on a basis consistent with that of the preceding year and with applicable Federal laws,
The public accounting firm's opinion on the financial statements follows.
20

LYBRA?VD,ROSSBROS.&MONTGOMERY CERTIFIED PUBLIC ACCOUNTANTS
COOPERS r: LYRRAND IN P*INCIP*L AFlEA5
OF THE W09LO
To the Board of Directors of Tennessee Valley Authority:
We have examined the accompanying financial statements of TENNESSEE VALLEY AUTHORITY at June 30, 1970 and 1969 and for the years then ended. Our examination was made in accordance with gener- ally accepted auditing standards, and accordingly included such tests of the accounting records and such other auditing procedures as we considered necessary in the circumstances.
In our opinion, Exhibits I, II, III and IV of the aforemen- tioned financial statements present fairly:
(1) the financial position of the Authority at June 30, 1970 and 1969, and the results of operations and source and disposition of funds of its several programs for the years then ended; and
(2) the assets and liabilities of the Authority at June 30, 1970 and 1969, relating to the power program, and the results of operations and source and disposition of funds of that program for the years then ended,
all in conformity with generally accepted accounting principles applied on a consistent basis.
The supplemental information appearing in Schedules A to F, inclusive, which has been subjected to audit procedures applied in the examination of the basic financial statements, is, in our opinion, fairly stated in relation to the basic financial statements taken as a whole.
New York, August 28, 1970.
21

-CIAL STATEMENTS
23

TENNESSEE VALLEY AUTHORITY (A CORPORATION WHOLLY OWNED By THE UNITED STATES OF AMERICA)
BALANCE SHEETS JUNE 30. 1970 AND 1969
ASSETS
Power program All programs 1970 1969 1970 1969
( Thousands ) PROPERTY, PLANT, AND EQUIPMENT,
substantially all at original cost
Completed plant; schedule A Multipurpose dams; note 1 Single-purpose dams
Steam production plants Other electric plant
Other plant
Less accumulated depreciation; note 2
Construction and investigations in progress; schedule B and note 3
Nuclear fuel in process of fabrication; note 4
$ 478,167 $ 477,324 62,891 61,204
1,686,930 1,516,730 974,870 922,046
3,202,858 29977,304 924,447 855,979
2,278,411 2,121,325
481,918 386,354
24,807 13,230
Total property, plant, and equipment 2,785,136 2,520,909
$ 961,970 $ 955,403 62,891 61,204
l&86,930 1,516,730 gi'4,87o 922 ) 046 161,851
3,848,512 -+? 3,610, 62
549,557 445,264
24,807 13,230
3,378,266 3,097,978
CURRENT ASSETS
Cash U. S. Treasury bills, at cost
(approximates market)
Total cash and investments Accounts receivable
Inventories , principally at average cost; note 4
42,384
15,982 58,366 45,853
37,507
23,275
23,275 36,519
44,214
64,210 44,928
15,982 80,192 %928 50,562 41,295
43,044 ' 50,541
Total current assets 141,726 104,008 173,798 136,764 '
DEFERRED CR4.RGES Unamortized debt discount and expense 7,078 7,063
Total assets $2,933,940 $2,631,980
7,078 7,063
$3,559,142 $3,241,805
Notes 1 through 8 following the exhibits are an integral part of the financial statements.
*Deduct

EXHIBIT I
LIABILITIES
PROPRIETARY CAPITAL I Appropriation investment; note 5
Total congressional appropriations Transfers of property from other Federal agencies
Less repayments to General Fund of the U. S. Treasury; note 6
Appropriation investment
Retained earnings of power program; exhibit II
Accumulated net expense of nonpower programs; exhibit III
Total proprietary capital
LONGTERM DEBT; note 7
SHORT-TERM NOTES; note 7
OTHER CURRENT LIABILITIES Accounts payable IQnployees' accrued leave Payrolls accrued Interest accrued
B .
Total other current liabilities z. 9 DEZTRREDCREDITS
Unamortized debt premium
CONTRIBUTIONS IN AID OF CONSTRUCTION
COMMILitBWrE; note 3
Total liabilities $2,933,940 $2,631,980 $3,559,142 $33241,805
Power program All programs 1970 1969 1970 1969
(Thousands )
$19377,545 $1,376,237 &449,944 $2,399,3@'
3lO,O59 295,059 351,601 336,593 1,088,315 1~01,850 2~50,781 2,113,248
660,879 643,911 660,879 643', 911
1,749,194 1,745,761 2,357,634 2,339,w
675,000 375,000 675,000 375,000
421,000 452,655 421,000 452,655
69,268 43,980 76,251 52,262 7,641 7,510 15,370 15,015 3,531 2,323 4,581 2,983 8,244 3,819 8,244 3,819
87,684 57,632 104,446 74,079
303 183 303 183
759 749 759 749
454,026* 418,020*
25

EXHIBIT II
TENNESSEE VALLEY AUTHORITY POWER PROGRAM
NET INCOME AND RETAINED EARNINGS FOR THE YEARS ENDED JUNE 30. 1070 AND 1969
Kwh Amount Kwh Amount (Thousands)
OPERATING REXRNGKS Sales of electric energy
Municipalities and cooperatives Federal agencies Industries Electric utilities
Total outside sales Interdivisional
Total sales of electric energy Rents
Total operating revenues
53,692,918 $285,483 49,008,196 $222,235 13,069,614 59,426 14,826,9W 63,570 22,012,611 105,995 20,568,110 92,239
1,273,680 90,048,823
1,300,494 859703,709
2% 3,2 1
OPERATING EKPENSES; schedule C Production Transmission Customer accounts Demonstration of power use Administrative and general Payments in lieu of taxes Social security taxes Provision for depreciation
Total operating expenses
246,071 15,085
335 1,060
18,043 16,098 2,456
75-067 37&5
Operating income 105,401
yx$
'304 1,022
15,551 14,510 2,198 1 672
&%3 A 73,458
INTEREST INCOME 15 Total income 105,416 73,458
INTEREST CHARGES Interest on long-term debt Other interest expense Amortization of long-term debt discount,
premium, and expense, net Interest charged to construction and
nuclear fuel; note 4 Total interest charges
30,721 14,797 31,559 23,924
71 83
16 036+ 22,768
Net income
31,552* 30,799 74,617 50,690
Payment of return on appropriation investment; note 6
Increase or decrease* in retained earnings 57,649 16,968
53,082 2,392*
646,303
$643,911
Retained earnings at beginning of period 643,911
Retained earnings at end of period $66~879 - Notes 1 through 8 following the exhibits are an integral part of the financial statements.
*Deduct
27

EXHlBlT .I11 Page 1
TENNESSEE VALLEY AUTHORITY NONPOWER PROGRAM§
NET EXPENSE AND ACCUMULATED NET EXPENSE
FOR THE YEARS ENDED JUNE 30. 1970 AND 1969
WATER RESOURCES DEVELOPMENT Navigation operations
Studies and investigations Operation and maintenance of facilities Provision for depreciation
Total expense of navigation operations
Flood control operations Studies and investigations Operation and maintenance of facilities Local flood control improvements Provision for depreciation
Total expense of flood control operations
Regional water quality management Fish and wildlife development Surveys and general studies for river development Recreation projects
Total expense of water resources development
FERTILIZER AND MUNITIONS DEVELOPMENT Developmental production
Cost of products distributed, including depre- ciation and depletion of $l,843,oOo in 1970, $1,674,000 in 1969
General expenses Retirements of manufacturing plant and equipment Other general expenses
Total general expenses Total production expense
Less transfers and sales of products Transfers to TVA programs, at market prices
Fertilizer industry demonstrations Farm test demonstrations Agricultural projects Other
Direct sales Total transfers and sales Net expense of developmental production
Fertilizer introduction Fertilizer industry demonstrations
Fertilizers used Educational distribution expense
Less industry payments for fertilizer
1970 1969 (Thousands)
$ 2 2: 2:751
$ 2 2: 2:723
5,745 5,721
699 2,198
906 1,264 5,067
1,389 306
E;
13,937
700 2,181
331 1.240 k’+%’
u77 287 868 506
13,111
22,912 20,643
2,469 1
-+d 2&i
YE 508
0 -8 13,95
ii$z 7,783
z!i -%5- 3 s&r5
14fz 453 38
1?291 -3 17,22
7,291
14,877 1 14
-5-t f4sz6 -i@3
28

EXHIBIT .I11 Page 2
TENNESSEE VALLEY AUTHORITY NONPOWER PROGRAMS
NET EXPENSE AND ACCUMULATED NET EXPENSE
FOR THE YEARS ENDED JUNE 30. 1970 AND 1969
FERTILIZER AND MUNITIONS DEVELOPMENT - continued Fertilizer introduction - continued
Farm test demonstrations outside the Valley Fertilizers used Planning and supervision
Less farmer payments for fertilizer
Net expense of fertilizer introduction
Research and development Net expense of fertilizer and munitions
development
GENERAL RESOURCES DEVELOPMENT Agricultural projects
Fertilizers used Planning and supervision
Less farmer payments for fertilizer
Development investigations and general expenses Net expense of agricultural projects
Forestry projects Tributary area development Regional development planning Demonstrations in education and manpower development Minerals projects Environmental quality projects
Net expense of general resources development
LAND BETWEEN THE LAKES OPERATIONS
TOPOGRAPHIC MAPPING
OTHER EXPENSE, NET
Net expense; schedule D
Accumulated net expense at beginning of period
Accumulated net expense at end of period $454,026 $418,020
1970 1969 (Thousands)
$ 423 $ 410 509 510 932 920
-+% -+f 2,497 2,279
4,674 4,468
14,462 14,530
453
+4
A$ '327
1,346
508
-T-E '293
-Tz 1,488
995 1,362
8%
:2 215
5,712
1,449
405
41
36,006
418,020
987 1,175
299 40
162 167
4,318
1,272
374
22
33,627
3% 393
Notes 1 through 8 following the exhibits are an integral part of the financial statements.
29

EXHIBIT IV
TENNESSEE VALLEY AUTHORlYY SOURCE AND DISPOSITION OF FUND5
FOR THE YEARS ENDED JUNE 30. 1970 AND 1969
SOURCE Net power proceeds
Power operations; exhibit II Operating revenues Interest income
Deduct operating expenses, less noncash charges; note below
Sale of power facilities Total net power proceeds
Gross proceeds from nonpover programs Sales of fertilizer; exhibit III
Industry payments Farmer payments Direct sales
Recoveries of operating expense
Sale of nonpower facilrties Total nonpower proceeds
Sale of long-term bonds Increase in chart-term notes Congressional appropriations Property transfers Contributions in aid of construction
Total source
DISPOSITION Expended for plant and equipment, excluding
capitalized interest; note 4 Less salvage from plant transfers, and
depreciation charged to construction and clearing accounts
Payments to U. S. Treasury; note 6 Return on appropriation investment Repayment of appropriation investment
Expensa of nonpower programs, less noncash charges; note below
Interest Deferred debt expense, net Decrease in short-term notes Increase or decrease* In current assets lesr other current liabilities; note 4
Total disposition
Power progrem All programs 1970 -,.- 1969 1970 1%9 ---
( Thousanas )
$479,616
m&
fiz%J 180,959
299,241
1,308 157 10
$481,675
8311,382 $252,272 $337,809 $281,760
3tJ-$% 57,&9
w
62,28i 7930
31,655
7,666 8,771* s lo, 674*
$481,675 $349,548‘ b550,202 #+15,5c$
8403,281
403,281
F&g
d
100,227 102,655
862
3
$3491548
i&3
53,082
-it%%
38,72; 2,on
8479,616 $403,281
d 403,281
14,206 504
Tifg
x%
$2
5?$i ’ 10
12,451 596
2,288 15,335
-i&i ‘618
ia+ l&655
50,250 230
0
$550,205 $415,508
57,649
9 T2,
45,573 62,280
793s 3,655
Power Nonpower Note: Noncash charges consist of: provisions for depreciation
Provisions for depletion $ 7516; $ 71,672 8 6,4;; $ 6,250
Retirements of fertilizer manufacturing facilities 677 --- 2,di;
$ 75,069 b 71,672 $ 7,150 $ 8,734 -- Notes 1 through 8 following the exhibits are an integral part ~finan~tements. *Deduct
30

NOTES TO FINANCIAL STATEMENTS
1. Allocation of cost of multipurpose projects--Section 14 of the TVA Act requires TVA's Board of Directors to allocate the cost of completed multipurpose projects, subject to the approval of the President of the United States. The cost of facilities installed exclusively for a single purpose is assigned directly to that purpose; the cost of multiple-use facilities is allocated among the various purposes served.
The total investment of $~1,970,000 in ccmpleted multipurpose dams at June 30, 1970, is classified as follows:
Power
Navigation
Flood control
Investment
Direct Multiple-use Total
(Thousands)
$302,683 $175 9 484 $478,167
150,473 137,309 287,782
59,662 128,516 188,178
Tributary area development
Total
19 7,824 7,843
$5~ ,837 $449,133 $961,970
2. Depreciation policy--Straight-line depreciation is provided for substantially on a composite basis. Rates of depreciation are derived from engineering studies of useful life and are reviewed each year.
3. Estimates of cost to complete major construction projects, and commitments--The cost to complete the major power projects (including nuclear fuel) under construction or authorized for construction at June 30, 1970, is estimated to be $1,614,210,000, including commitments of $858,686,000 for materials and services contracted for and not delivered. The corresponding estimate for multipurpose snd nonpower projects is $233,140,000, including commitments of $5,204,000. Additional contractual commit- ments of $5,742,000 for multipurpose and nonpower projects had been entered into at June 30, 1970, on which TVA's obligation is limited by the availability of funds from congressional appropriations for succeeding fiscal periods.
TVA and the City of Memphis, Tennessee, have entered into agreements under which (1) TVA sells to the City all the power and energy requirements of its electric dis- tribution system, and (2) the City leases to TVA the Thomas H. Allen steam-electric generating plant with an installed capacity of 990,000 kilowatts; each agreement is for a term of 20 years, beginning January 1, 1965. The lease agreement provides for annual rental payments of $~,~OO,OOO and grants TVA an option to buy the plant for $2,000,000 at the end of the lease term.
4. Nuclear fuel-Nuclear fuel has been reclassified from inventories to property, plant, and equipment, and includes interest of $1,944,000 recorded during the year ended June 30, 1970, of which $475,000 relates to the prior year.
31

TENNESSEE VALLEY AUTHORITY NOTES - CONTINUED
5. Appropriation investment --Changes in appropriation investment during ti,e years ended June 30, 1970 and 1969, were as follows:
Power program All programs 1970 1969 1970 1969
(Thousands)
Congressional appropriations $ 1,308 $ 862 Transfers of property from
other Federal agencies 5 $6:
112 974
Less repayments to General Fund of the U. S. Treasury 15,000 15,000
Increase or decrease* for the period 13,535* 14,026*
Balance, beginning of period 1,101,850 1~15,876
Balance, end of period $1,088,315 $1,101,850
Action on a request for an additional appropriation available as of July 1, 1970, is pending in the Congress.
6. Payments to the U. S. Treasury--Section 15d of the TVA Act requires the payment from power proceeds of a return on the net appropriation investment in power facilities plus repayments of such investment, beginning with fiscal year 1961. The amount of return payable during each fiscal year is based'on the appropriation investment as of the beginning of that fiscal year and the computed average interest rate payable by the U. S. Treasury on its total marketable public obligations as of the same date. The repayment schedule calls for payment of not less than $10 million for each of the first five fiscal years (1961-19651, $15 million for each of the next five years (1966-1970), and $20 million for each year thereafter until a total of $1 billion shall have been repaid. The payments required by Section 15d may be deferred under certain circumstances for not more than two years.
$ 50,600 $ 50,250
1,941 L 52,541 50,:S:
15,008 15,002
37,533 35,478 2,113,248 2,077,770
$2,150,781 $2,113,248
of $50,080,000 to become
Required payments have been made as follows:
Total to June 30, 1969 Fiscal year 1970
Return Repayment Total (Thousands)
$390,597 $110,000 $500,597 57,649 15,000 72,649
$448,246_ $125,000 $573,246
For fiscal year 1971 the required payments will be $65,147,000 as a return and $~O,OOO,OOO as a repayment, a total of $85,147,000.
32

TENNESSEE VALLEY AUTHORITY NOTES-CONTINUED
In addition to the payments from power proceeds, $8,000 of nonpower proceeds was paid to the U. S. Treasury in fiscal year 1970 under the provisions of Section 26 of the TVA Act. This brought the total payments from nonpower proceeds to $41,542,000.
Prior to 1961, under then existing legislation, TVA paid to the Treasury $185,05g,OOO of power proceeds. In addition, $65,072,000 of bonds sold to the Treasury and Recon- struction Finance Corporation in fiscal years 1939-1941 have been fully repaid from power proceeds. Section 26 of the TVA Act provides for annual payments to the Treasury of any power or nonpower proceeds not needed for the operation of dams and reservoirs, the conduct of the power program, and the manufacture and distribution of fertilizers.
7. Borrowing authority--Section 15d of the TVA Act authorizes TVA to issue bonds, notes, and other evidences of indebtedness up to a total of $1,750 million outstanding at any one time to assist in 'financing its power program. Action is pending in the Congress on an increase in this borrowing authority from $1,750 million to $5 billion. Debt service on these obligations, which is payable solely from TVA's net power proceeds, has precedence over the payments to the U. S. Treasury described in note 6.
Evidences of indebtedness issued under Section 15d and outstanding on June 30, 1970, consist of the following:
(Thousands) Long-term debt
4.40$ Power Bonds 1960 Series A, due November 15, 1985 4-5/s Power Bonds 1961 Series A, due July 1, 1986 4-l/2$ Power Bonds 1962 Series A, due February 1, 1987 5.7@ Power Bonds 1967 Series A, due May 15, 19% 6-3/&S Power Bonds 1967 Series B, due November 1, 1992 % Power Bonds 1969 Series A, due June 1, 1974 8-l/4$ Power Bonds 1969 Series B, due October 15, 1994 9% Power Bonds 1970 Series A, due March 15, 1995 g-l/@ Power Bonds 1970 Series due 8-3/4%
B, June 15, 1995 Power Bonds 1970 Series C, due June 15, 1975
Total long-term debt 675,000
$ 50,000 50,000 45,000 70,000 60,000
100,000 100,000 100,000
50,000 50,000
Short-term notes
Payable to U. S. Treasury 100,000 Payable to public 321,000
Total short-term notes 421,000
$l,og6,ooo
8. Retirement plan--TVA has a contributory retirement plan which covers substantially all of its salaried employees. The cost of currently accruing benefits is funded cur- rently, ana“the unfunded prior service cost is being amortized and funded over a period of 36 years from July 1, 1969. The cost of the plan to TVA for the fiscal years ended June 30, 1970 and 1969, was $l2,355,000 and $10,593,000, respectively.
33

SCHEDULES

SCHEDULE A
TENNESSEE VALLEY AUTHORITY COMPLETED PLANT
JUNE 10. 1070
Assets
Power Multipurpose dams; note a Single-purpose dams Steam production plants Other electric plant
Total power
$ 478,167,051 62,891,043
1,686,929,'790 974,870,528
3,202,858,412
Navigation Multipurpose dams; note a 287,781,773 2,751,020 43,985,631
Flood control Multipurpose dams; note a Multipurpose dams; note b Bristol flood control plant
T&al flood control
181,243,572 6,934,238 2,072,966
190,250,776
!lYibutszy erea development Multipurpose dams; note b 7,843,170
Recreation and conservation education Land between the lakes 44.241.556 Other'
Total recreation aa conservation education
- 395.; $2
44,637,058
Chemical 68,057,556 2,094,219 25&5,802
General 47,083,366 2,5&,796 17,158,080
Total $3,848,512,1~ $Ww,67~ $1,044,610,382
Total completed plant Multipurpose dams Single-purpose am Steam production plants Other electric plaut Other plant
8 W,%WW+ $10,626,007 62,891,043 795,899
1,686,929,790 974,87%528
43,966,106
161,850,946 23,731,228
4,974,437
Total $3,848,512,1+ $@+,093,677 $1,044,Q0,382
GAO Notes: a. Common to power, navigation and flood control. b. Beech River and Bear Creek water control projects.
Depreciation Provision Accumulated year ended balance
June 30. 1970 June 30, 1970
$ “J,‘;,;;;
43,%X:106 23,731,228
$ U+4,m9,178 23,160,906
500;628;515 256,548,807
751068,351 g24,447,406
1,198,m 52,433 13,573
1,264,521 32,045,249
48,921 151,209
270,991 9,858
947,517 9,488
28o,84g 957,005
$ 220,225,777 23,160,906
5~,628,515
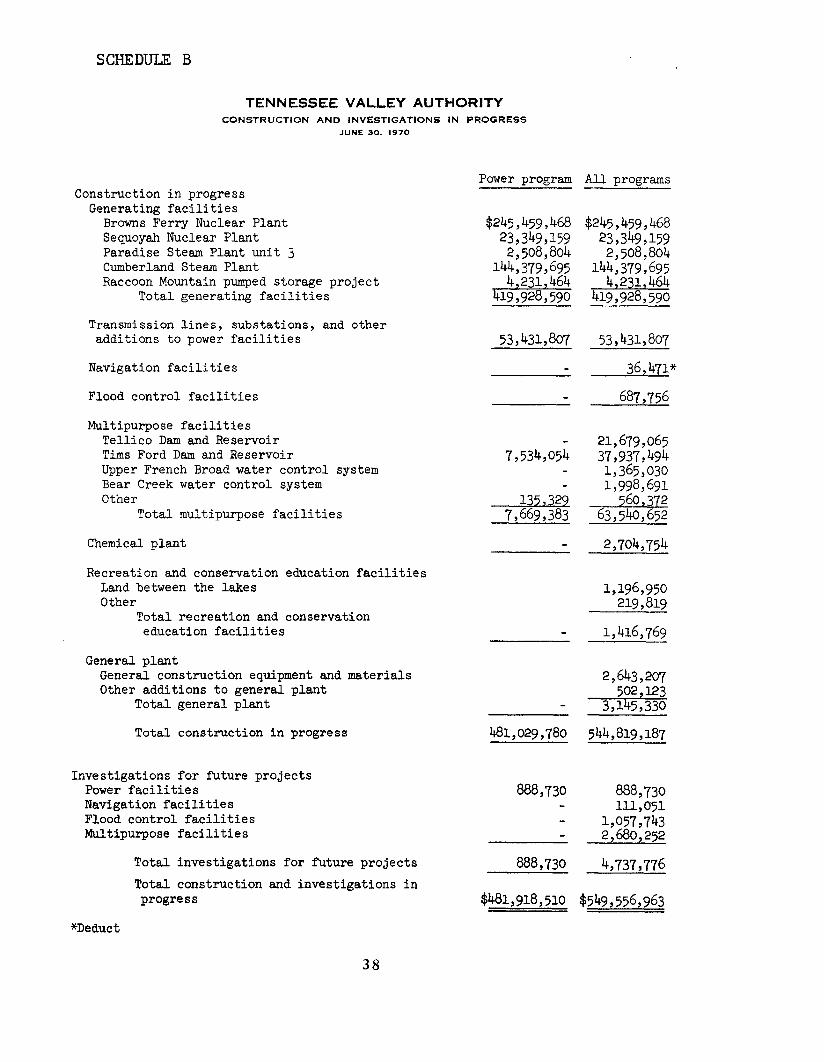
SCHEDULE B
TENNESSEE VALLEY AUTHORITY CONSTRUCTION AND INVESTIGATIONS IN PROGRESS
JUNE 30. 1970
Power program All programs Construction in progress
Generating facilities Browns Ferry Nuclear Plant Sequoyah Nuclear Plant Paradise Steam Plant unit 3 Cumberland Steam Plant Raccoon Mountain pumped storage project
Total generating facilities
Transmission lines, substations, and other additions to power facilities
Navigation facilities 36,471”
Flood control facilities 687,756
Multipurpose facilities Tellico Dam and Reservoir Tims Ford Dam and Reservoir Upper French Broad water control system Bear Creek water control system Other
Total multipurpose facilities
Chemical plant
Recreation and conservation education facilities Land between the lakes Other
~196,950 219,819
Total recreation and conservation education facilities 1,416,769
General plant General construction equipment and materials 2,643,207 Other additions to general plant 502,123
Total general plant 3,145,330
Total construction in progress 481,029,780 54’+,819,187
Investigations for future projects Power facilities Navigation facilities Flood control facilities Multipurpose facilities
Total investigations for future projects
Total construction and investigations in progress
$245,459,468 $2455459,468 23,349,159 23,349,159
2,508,804 2,508,804 144,379,695 144,379,695
Ji&$i$$ 41;$%:;;::
53,431,807 53,431,807
7,534,054 21,679,065 3: m;,;;o”
1:998:691 7,:69,3:3 3533 9 63,540,652 560,372
2,704,754
888,730 888,730 111,051
1,057,743 2,680,252
888,730 49737,776
$4&918,510 $549,556,963
*Deduct
38

SCHEDULE C
TENNESSEE VALLEY AUTHORITY DETAILS OF POWER EXPENSE
FOR THE YEAR ENDED JUNE SO.. lS70
Provision Total before for depreciation
depreciation (exhibit II) SUMMARY Production
Multipurpose dsms Direct Multiple-use; schedule E
Single-purpose dams Cumberlsnd Basin projects; note a steam plants
Total generation Purchased power Interchange power received Interchange power delivered System control end load dispatching Other
Total production TIXtlSlSiSSiOIl Customer accounts Demonstration of power use Payments in lieu of taxes; note b Social security taxes Administrative and general
Direct Multiple-use
Total operating expense
operation &intenance Other Total
8 2,914,503 $ 2,:;;,g
4951213 .
2,036,146 5,%l,o95
1,240,247 5r%l,O95 5,96l,O95
5,%1,095 1,314,729
u,aa0,895 p;:;g
5&k%&
&oya,46i 2,455,%2
*gig-g
'3351123 l,O59,446
WHW’+ 2,455,9@
190,216,372 082,543
335,u3 1,059.446
5lr337J.23 22J78.944
19,438,253 155,107
17,@37,736 17,884,776 155.107 155,107
2,960
$75,06w34 $299,148,041 $218,633,367 $38,489,728 $42,024,946 $3741214,625
Kti generated Installed Ratio of e.verase
Production expense capacity at - Juoe 30, 1970
gross generatS& to installed
Total (mills1 (kilowatts) capacity (percent) less station use
(thousands)
l1,265,995 $ 10,364,470
SYS'ICM STATISTTCS Generation
Multipurpose dams Direct Multiple-use; schedule E
Total multipurpose dams Single-purpose dams Cumberland Basin projects; note a Alcoa dams; note c
Total hydra aeneratfon steam plants
Total generation; note d Purchased power Interchange power received System control and load dispatching Other
Total system input Delivered under Alcoa agreement Interchange power delivered
Net energy supply Shop and internal uses Transmission and transformation losses
Total kwh sales and production expense
.920
.344 1.264 1.944 2.436
3.384
29869,230 45.08
45.08 47.97 38.26 48.07
1;fy399 214471231
2,869,230 250.200
44.37 62.45 58.30
257,665,081
13314,729 17330m
1~23,830 warn
101,285,32; 1,847,4W
Tk%3% 6:917*
tp7,408,470
w: a. TVA purchases substantially all of the output of seven hydra plants in the Cumberlsnd River Basin. In accordance with memorandums
of understanding with the Corps of Engineers, Department of the Army, the Cumberlsnd Basin projects we operated for optimum pro- duction of power in conjunction with TVA’s power system, subJect to flood control, navigation, and other operating requirements of the Army.
b. Payments made to states and counties in which power operations are carried out. The basic amount is 5 percent of gross revenues from the sale of power to other than Federal agencies during the preceding year, with the provision of minimum payments under certain circumstances.
c. Operation of tvelve hydra plants of the Aluminum Company of America is coordinated with the operation of TVA’s power plants under an arrangement whereby the storage and release of water from the Alcoa plants are carried out by the company under TVA’s direction.
d. Installed capacity increased 1,183,200 kilowatts during fiscal year 1970. Additions consisted of 1,150,2OC kilowatts in s new unit at the Paradise Steam Plant, one 28,000 kilowatt unit. at the new J. Percy Priest Dam in the Cumberland Basin, and 5,000 kilowatts from modifications to B generator.
*Deduct
39

SCHEDULE D Page 1
TENNESSEE VALLEY AUTHORITY DETAILS OF NONPOWER NET EXPENSE
FOR THE YEAR ENDED JUNE SO. 1WO
Multiple-use Direct (schedule E) Total
WATER RESOURCES DEVELOPMENT
Navigation operations Studies and investigations
Navigation engineering and investigations Administrative end general expenses; schedule F
Operation and maintenance of facilities Operation Maintenance Administrative and general expenses
Provision for depreciation
Total expense of navigation operations
Flood control operations Studies and investigations
System studies and investigations Local flood studies and cooperation with other
agencies Administrative and general expenses; schedule F
Operation and maintenance of facilities Operation Maintenance Administrative and general expenses
Local flood control improvements Provision for depreciation
Total expense of flood control operations
Regional water quality management Regional water quality management Provision for depreciation Administrative and general expenses; schedule F
Total expense of regional water quality menagement
Fish and wildlife development Fish and wildlife development Provision for depreciation Administrative and general expenses; schedule F
Total expense of fish and wildlife development
Surveys and general studies for river development Surveys and general studies for river development Administrative and general expenses; schedule F
$ - - $ 806,688
T%%!
$ 806,688
-7zig
16,843 1,749,589 1’1298
1,766,432 215,864 233,162
116j330 2,X15,924 2,751,020
$2,?23,652 $3,02L743 5,745,395
$ 282,956 $ - 282,956
384,206
dk%
1,846,254 230,750
384,206
+%
23,649 1,822,605 230,750
99 2,%,3$
120;991 2497,995
* 902,91; $3,077,261 5,&6,775
1,346,385 8,410
34,447 1,389,242
284,074 6,576
15,310 305,960
Total expense of surveys and general studies for river development 784,668
Recreation projects Recreation resources development Provision for depreciation
612,114
Administrative and general expenses; schedule F 9,858
22,964 TOtal expense of recreation projects 6'+4,936
Total expense of water resources development $13,936,9?6
40

SCHEDULE D Page 2
TENNESSEE VALLEY AUTHORITY DETAILS OF NONPOWER NFf’ EXPENSE
FOR THE YEAR ENDED JUNE 30. 1970
FRRTILIZRR AND MUNITIONS DRVRLOPMSNT
Developmental production Cost of products distributed; note a
Materials used Direct manufacturing and shipping expense Indirect manufacturing and shipping expense Provisions for depreciation and depletion Recoveries from byproducts and in-process materials In-process inventory changes Finished inventory changes
Total cost of products distributed General expenses
Retirements of manufacturing plant and equipment Other general expenses
Administrative and general; schedule F Shipping order expense Provision for depreciation of idle manufacturing
plant and equipment Other
Total general expenses Total production expense
Less transfers and sales of products Transfers to TVA programs, at market prices
Fertilizer industry demonstrations Farm test demonstrations Agricultural projects Other
Total transfers Direct sales
Total transfers and sales
Net expense of developmental production
Fertilizer introduction Fertilizer industry demonstrations
Fertilizers used Educational distribution expense Administrative and general expenses; schedule F
Less industry payments for fertilizer; note b
Farm test demonstrations outside the Valley Fertilizers used Planning and supervision Administrative and general expenses; schedule F
Less farmer payments for fertilizer
Net expense of fertilizer introduction 2,497,OOl
Research and development Research and development of products and processes
Applied research Process engineering General expenses
*Deduct
812,523 19131,958
-&sz
$ 4,733,873 13,615,813 23564,511 1,842,528
748,420* 20,075
* 22,912,1 i 676,879
166,586 90s815 -$$g t ,
14,877,723 422,603 453,595 37 484 L5,791,405
i+g% 7,291,236
~092,356 14,877,723
54,553 ii$g?g 2$g%
480,108 422,603
28,712 508,820 931;rr23 -+@I3
41

SCHEDULE D Page 3
TENNESSEE VALLEY AUTHORITY OETAILS Of NONPOWER NET EXPENSE
FOR THE YEAR ENDED JUNE 30. IS70
FERTILIZER AND MUNITIONS DEVELOPMENT - continued
Research and development - continued Research and development of processes for recovery of sulfur Basic chemical and agronomic research Provision for depreciation Administrative and general expenses; schedule F
Total expense of research and development
Net expense of fertilizer and munitions development
GENERAL RESOURCES DEVELOPMENT
Agricultural projects Fertilizers used
In specific tributary areas Outside specific tributary areas
Planning and supervision In specific tributary areas Outside specific tributary areas
Less farmer payments for fertilizer In specific tributary areas Outside specific tributary areas
Agribusiness development Preliminary investigations in tributary watersheds Program planning and analysis Research on forage fertilization and utilization Alleviation of rural poverty Tenure and land use adjustment Tennessee Valley rural life conferences Provision for depreciation Administrative and general expenses; schedule F
Net expense of agricultural projects
Forestry projects Use of Valley forests Development of Valley forests Investigation of forest influences Provision for depreciation Administrative and general expenses; schedule F
Total expense of forestry projects
Tributary area development Basic investigations Development assistance in specific tributary areas Development assistance outside specific tributary areas Provision for depreciation Multiple-use operating expenses; schedule E Administrative and general expenses; schedule F
Total expense of tributary area development
Regional development planning Regional development planning Administrative and general expenses; schedule F
Total expense of regional development planning
Demonstrations in education and manpower development Demonstrations in education and manpower development Administrative and general expenses; schedule F
Total expense of demonstrations in education and manpower development
261,769 555,359
63,728 187,651
63,471 39,710 51,841 58,331 29,445 17,291
;'E 53:596
$ 185,621 1,615,618
81,685 198,114
4,673,407
$14,461,644
817,128 1,270,723
251,379 13019,344
326,655 1,345,999
410,726 5g;,t;89
131348 36,360
994,781
67,990 1,038,078
41,285 194
Opt
1,362:259
722,090 7,655
729,745
42
SCHEDULE D Page 4
TENNESSEE VALLEY AUTHdRlTY DETAILS OF NONPOWER NET EXPENSE
FOR THE YE*R ENOED JUNE 30. ,*,o
GENERAL RESOURCES DEVELOPMENT - continued
Minerals projects Mineral resources investigations Administrative and general expenses; schedule F
Total expense of minerals projects
Environmental quality projects Reservoir shoreline cleanup Regional air quality management Strip mine reclamation Research ondisposal of solid wastes Administrative and general expenses; schedule F
Total expense of environmental quality projects
Net expense of general resources development
LAID BETWEEN THE LAKES OPERATIONS
Land between the lakes operations Provision for depreciation Administrative and general expenses; schedule F
Total expense of land between the lakes operations
TOPCGRAPRICMAPPING
Topographic mapping Provision for depreciation Administrative and general expenses; schedule F
Total expense of topographic mapping
$ 385,853 5,974
13,044
$ 404.871
OTHER EXPENSE OR INCOME+'
Emergency preparedness Maintenance of bridges financed by others on TVA dams
$ 7,063
Interest income from receivables 55,901 21,592*
Other expense, net
Net expense
$ 41,372
$36,006,131
$ 16:‘% 167:775
63,816 34,787 84,292
‘,x2
215,284
$ 5,7p,l24
$ 1,142,750 270,991.
35,403
$ 1,44g,144
Notes:
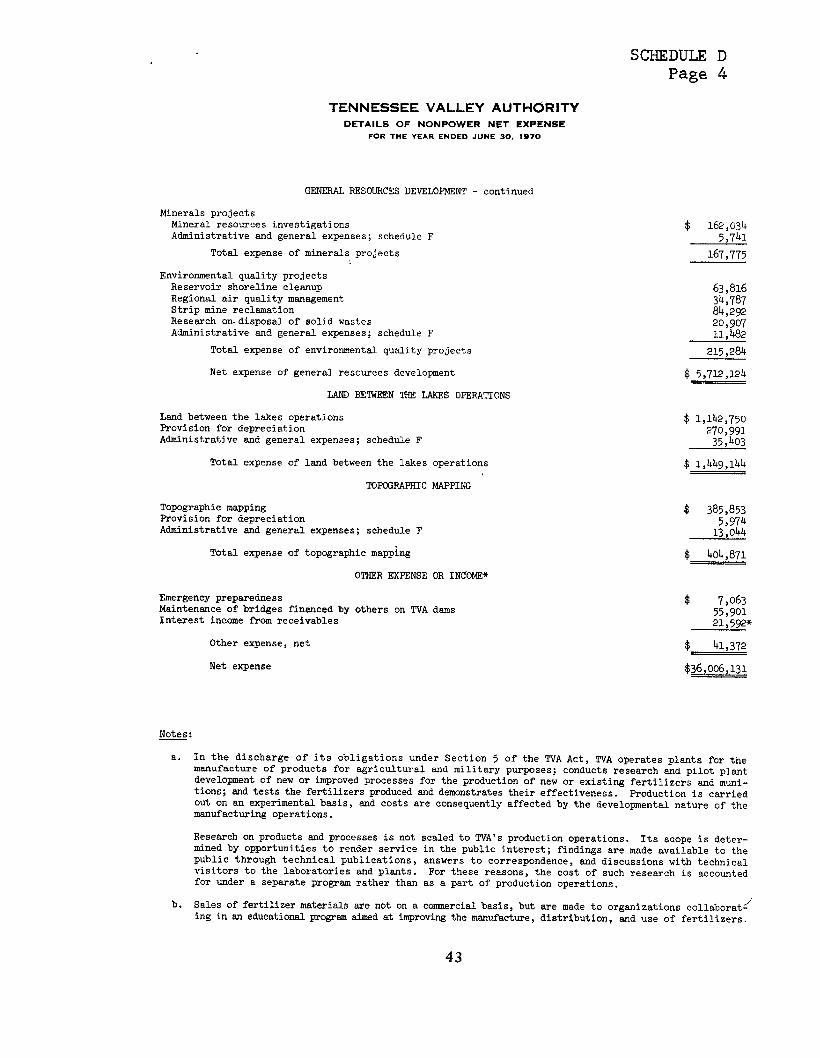
a. In the discharge of its obligations under Section 5 of the TVA Act, TVA operates plants for the manufacture of products for agricultural and military purposes; conducts research and pilot plant development of new or improved processes for the production of new or existing fertilizers and muni- tions; and tests the fertilizers produced and demonstrates their effectiveness. Production is carried out on an experimental basis, manufacturing operations.
and costs are consequently affected by the developmental nature of the
Research on products and processes is not scaled to TVA's production operations. Its scope is deter- mined by opportunities to render service in the public interest; findings are made available to the public through technical publications, answers to correspondence, and discussions with technical visitors to the laboratories and plants. For these reasons, the cost of such research is accounted for under a separate program rather than as a part of production operations.
b. Sales of fertilizer materials are not on a commercial basis, but are made to organizations collaboratj ing in an educational program aimed at improving the manufacture, distribution, and use of fertilizers.
43

SCHEDULE E
TENNESSEE VALLEY AUTHORITY OPERATING EXPENSES OF MULTIPLE-USE FACILITIES
FOR THE YEAR ENDED JUNE 30. 1970
Common to power, navigation, and flood control
Operation Water dispatching Water control investigations Investigations and control of
reservoir ecology Plant protection and services
to visitors Operation and upkeep of dam
reservations Reservoir land management Other expense
Total operation
Administrative and general expenses; schedule F
Maintenance
Provision for depreciation Total common to power, nav-
igation, and flood control
Other projects
Beech River water control system Operation Maintenance Provision for depreciation
Bear Creek water control system Operation Maintenance Provision for depreciation
Administrative and general expenses; schedule F
Total other projects
Total
Total expenses Operation Administrative and general Maintenance Depreciation
Total
Total
Distributed to Flood Tributary
Power Navigation control area operations operations operations development
$ 1,130,122 125,898
1,l53,577
1,364,319
888,492 1,083,160
86,396 5,831,964 $2,332,786 8~749,589 $1,749,589
387,767 155,107 116,330 116,330 752,404 310,708 215,864 225,832
3,044,645 1228,759 939,960 875,926
10,016,780 4P7,360 3,021,743 2,967,677
96,580 48,290 4,325 1,081
49,452 8,526
24,726
9,323 4,661 243,922 109,584
$10,260,702 $4,027,360 $3,021,743 $3,077&l --
$ 583;8$ $2,;;;~;;; $l,$,;%; $1,822,605
765:255 310:708 215;864 =0,991 230,750
3~0,361 1228,759 939,960 902,915
$10,260,702 $4@7,360 $3,021,743 $3,077,261
24,726 4,689
22,165 51,580
4,662 134,338
$134 338 A
$ 7;g
7:933 48,727
$134,338
44

SCHEDUIJT F
TENNESSEE VALLEY AUTHORITY ADMINISTRATIVE AND GENERAL EXPENSES
FOR THE YEAR ENDED JUNE SO. IS70
Expenses Board of directors Office of the general manager Budget staff Washington office Information office, including technical library service Division of personnel Division of finance Division of law Division of property and supply Medical and safety services Other administrative and general
Total $9,717,336
Distribution Construction Recovered through services billed to others at cost Expense of programs
Power Water resources development
Navigation Flood control Regional water quality management Fish and wildlife development Surveys and general studies for river development Recreation projects
Multiple-use operations Common to power, navigation, and flood control Other projects
Fertilizer and munitions development Developmental production Fertilizer industry demonstrations Farm test demonstrations Research and development
General resources development Agricultural projects Forestry projects Tributary area development Regional development planning Demonstrations in education and manpower development Minerals projects Environmental quality projects
Land between the lakes operations Topographic mapping
$4,pg ¶
3,727,894
42.92 1.51
38.36
71,763
xc; 15:310 36,888 22,964
:;Z
::2 .38 .24
387,767 3.99 9,323 .lO
5;:$$ 28:712
198,114
5.15 .56 .30
2.04
53,596 36,360 $,;7,"
7:655 5,741
11,482 35,403 13,044
.55
2; .38 no8 .06
:g .u
Total $9,717,336 100.00
$ 228,905 267,482 272,546 77,199
693,102 2,179,443 2,724,054
788,695 ~375,561 1,020,352
89,997
Amount Percent of total
45

APPENDIX
.’ t

APPENDIX I Page 1
RETIREMENT SYSTEM OF THE TENNESSEE VALLEY AUTHORITY
The TVA retirement system was.established in 1939 to provide a pro-
gram of retirement, disability, and death benefits financed jointly by
contributions of TVA and of its salaried employees. Administration of
the system is vested in its own Board of Directors, and its funds are
held and invested by two trustees. Of the seven members of the Board of
Directors, three are appointed by TVA, three are elected by the partici-
pants, and the seventh is chosen by these six directors.
The operation of the retirement system is regarded as a Federal
function in general and as a TVA function in particular. As authorized
in section 301(b) of the Government Corporation Control Act (31 U.S.C.
866(b)) the General Accounting Office contracted with a firm of certi-
fied public accountants to make the audit of the system. Following are
the balance sheet of the system at June 30, 1970, and the related state-
ments of change in fund balances for the year then ended with respect to
the Fixed Benefit, the Variable Annuity, the Supplement to Medicare Pre-
mium Reserve, and the Voluntary Retirement Savings and Investment Plan
Funds, together with the auditors' opinion.
48

APPENDIX I I Page 2
LYBRAND,ROSSBROS.&MONTGONERY CERTIFIED PUBLIC ACCOUNTANTS
COOPERS .%. LYBRAND
To the Comptroller General of the United States, Washington, D. C.:
We have examined the balance sheet of the RETIREMENT SYSTEM of the TENNESSEE VALLEY AUTHORITY as of June 30, 1970 and the related statement of changes in fund balances'for the year then ended. Our
examination was made in accordance with generally accepted auditing standards, and accordingly included confirmations from the trustees and custodiansof cash and investments held as of June 30, 1970 and such tests of the accounting records and such other auditing proce- dures as we considered necessary in the circumstances.
In our opinion, the aforementioned financial statements present fairly the financial position of the Retirement System of the Tennessee Valley Authority at June 30, 1970, and the changes in
fund balances for the year then ended, in conformity with generally
accepted accounting principles applied on a basis consistent with that of the preceding year.
New York, October 8, 1970.
49

RETIREMENT SYSTEM of the TENNESSEE BALANCE SHEET, June 30,
VALLEY AUTHORITY
ASSETS:
Investments: Securities:
Bonds and notes (details annexed): At amortized cost (current redemption values or
market quotations, $67,39X,183) At market (cost, $2,966,000)
Real estate mortgages (details annexed) Preferred stocks (details annexed):
“Ai Etie PTEE k , q~I;ki~%i~~ ’ $LW,625)
Common stocks (details annexed : At cost (market quotations, 1 At market (cost, $37,507,559)
133,765,461)
United States Government obligations, at cost (approximates market)
Fund shares: 148,212 shares, at market, $18.13 per share
(cost, $4,102,953) 61,745 shares, at market, $8.31 per share
(cost, $659,859)
Properties acquired under buy and leaseback agreements, at cost, less amortization of $542,044
Real property: Land, at cost Buildings, at cost, less allowance for depreciation
of $168,304
Cash: Treasurer's fund Trustee
Receivables: Contributions Dividends, accrued interest, etc. Securities sold
LIABILITIES and FUNDS: Payables:
Securities purchased Other
Fund balances (statement annexed)
Fixed Benefit Fund
$ gl,o16,35o
3,156,411
2,198,483
m,oo6,og3
2X),377,337
220,377,337
1,928,1x6 627,000
go1,446 223,,833,919
13,824 317,624
$ 154,500 186,231
226,054,485 $226,3g5,216
The accompanying note is an integral part Of these financial statements.

APPENDIX I Page 3
Voluntary Retirement. Supplement to Savings and Investment Plan Medicare -
Variable Fidelity Premium Annuity Fund Trend Fund Puritan Fund Reserve Fund
(Note)
8b 2,644,500
485,450
30,811,507
33,941,457
$2,687,082
$513,104 33,941,457 2,687,082 513,104
333941,457
22,942 178,680
333,134 66,176
$34,542,389 #2,687,165 $513,158 $72,530
$ 270,187
x4,272,202
$34,542,389
2,687,082 513,104
78 51
5 3
$ 98 $ 100 2,687,067 513,058
$2,687,165 $513,158
$70,173 70,173
70,173
70,173
1,210
1,147
#72,530 $72,530
51

APPENDIX I Page 4
RETIREMENT SYSTEM of the TENNESSEE VALLEY AUTHORITY INVESTMENTS in SECURITIES
June 30, 1970
FIXED BENEFIT FUND (at cost or amortized cost):
Bonds and notes: Principal amount:
Utility Industrial Financial Foreign Railroad
Unamortized (discounts) and premiums, net
Commercial paper Real estate mortgages:
Veterans Administration Federal Housing Administration Commingled Other
Preferred stocks: Industrial
Common stocks: Industrial Utility Commingled Other
VARIABLE ANNUITY FUND (at market): Bonds and notes:
Industrial Financial
Preferred stocks: Industrial
Common stocks: Industrial Utility Other
$22,885,000 26,130,765 15,977,421 11,556,ooo
3,531,583
L63ww) g,445,350
,571,ooo $ gl,o16,35o
195~0,035 9 ,-391 3,156,411
2,198,483
88,408,ogo 16,9@,645 13,8Oo,ooo
4,828,358 la,oo6,ogj
$220,377,337
1,078,500 ~L566,ooo # 2,644,500
485,450
29,502,497 7y735
,. 30,811,507
$ 33,94x,457
53

RETIREMENT SYSTEM of the TENNESSEE VALLEY AUTHORITY STATEMENT of CHANGES in FUND BALANCES
for the year ended June 30, 1970
Fixed Benefit Fund AnnuT Savings
Total Account
Contributions: Members Tennessee Valley Authority
Premiums retained Investment income:
Interest Dividends Rents (less depreciation and
amortization of $93,651)
Net realized gains (losses) on sales of investments
Capital gains distribution Net unrealized appreciation (depreciation)
of investments
$ 2,978,917 8 2,978,917
129355,380
5,576,002
3,464,678
178,650
(19419,599)
Transfers: Interest Accumulations
Administrative expenses Withdrawals Death benefits Retirement benefits
Net increase (decrease) Balances, June 30, 1969
Balances, June 30, 1970
23,134,028 2,978,917
(2.063.693)
# 21,070,335
4b 470,964 358,022
1,032,508 6,o29,6f&
$a 7,8gl,ug
9b 13,179,186 212,875,299
#226,054,4&-j
1,64i’,o% (4,490,917)
9b 135,095
4b 353,520 186,716
$ 540,236
(44 405,141) 42,396,913
$41,991,772
The accompanying note is an integral part of these financial statements.
54

APPENDIX I Page 5
Fixed Benefit Fund Pension Investment
Accumulation Reserve Account Account
8 12,355,380
5,576,002 33464,678
178,650
560,523
Variable Annuity
Fund
$ 4,125,606 $1,103,063 $238,735
288,239 658,677
($1,98o,lz) (5,932,161)
22,135,233 (1,980,122)
(1,967,o62) 2,427,224
$ 229595,395
$ 470,964 4,502
845,792 6,029,655
$ 7,350,913
$ 15,244,482 161,598,284
$176,842,766
319,967
(?&,660,155)
(@,660,155) 8,880,102
$79219,947
(7.138;319) (7,997,958)
2,o63,693
(?I 5,934,265)
$ 370,249
299,092
$ 669,341
($ 69603,606) 40,875,8o8
$34,272,202
Voluntary Retirement Savings and Investment Plan
Fidelity Trend Puritan
Fund Fund
71,784 22,897
98,6w 14,302
11,039,178) 1125,586) 234,269 150,348
(4,995) $ 229,274
8b 251,383
8 251,383
($ 22,109) 2,7og,176
$2,687,067
4995
$155,343
$ 48,352
$ 48,352
$106,991 406,067
8513,058
Supplement to Medicare
Premium Reserve Fund
(Note)
$71,897
633
729530
$72,530
$72,530
$72,530
55

APPENDIX I Page 6
NOTE to FINANCIAL STATEMENTS
D uring the year ended June 30, 1970, the Board of Directors approved an amendment, Medicare"
retroactive to July 1, 1966, to the "Supplement to contract between the Retirement System of the Tennessee
Valley Authority ("Retirement System") and Blue Cross - Blue Shield of Tennessee ("BCBST"). Under this amendment, if there is or will be an excess of funds over that considered necessary by BCBST to maintain adequate reserves under the contract,then monthly premiums (deducted from subscribers) may be retained by the Retirement System until it again becomes necessary to remit premiums to BCBST. Any such premiums retained are to be separately accounted for by Retirement System until the Board of Directors determines how they shall be used for additional benefits for subscribers, to reduce future increases in premium rates, to reduce existing premium rates or any combination thereof. For the year ended June 30, 1970, premiums retained by Retirement System under the contract amounted to $71,897. Subsequent thereto, premiums totaling $12,682 for the month of August, 1970 were not deducted from subscribers and that amount was paid from this fund to BCBST.
U.S. GAO Wash., D.C.
56