Embed Size (px)
Citation preview
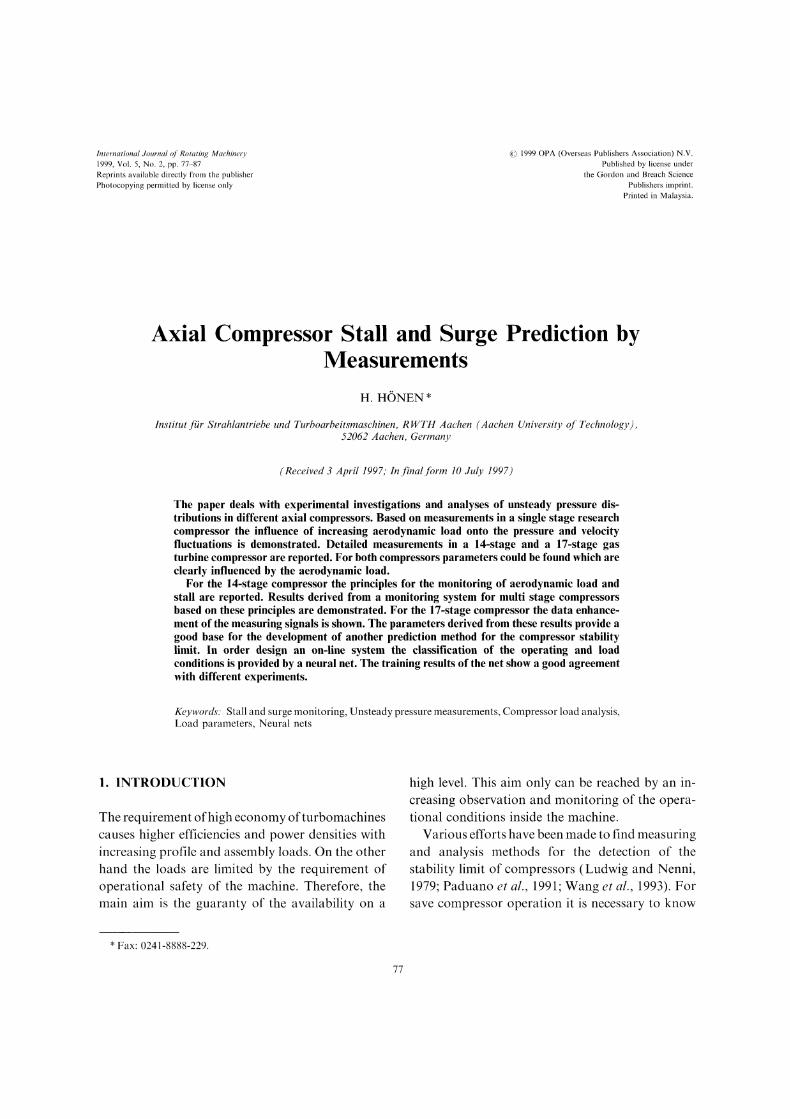
International Journal of Rotating Machinery1999, Vol. 5, No. 2, pp. 77-87
Reprints available directly from the publisherPhotocopying permitted by license only
(C) 1999 OPA (Overseas Publishers Association) N.V.Published by license under
the Gordon and Breach Science
Publishers imprint.Printed in Malaysia.
Axial Compressor Stall and Surge Prediction byMeasurements
H. HONEN *
Institut jFtr Strahlantriebe und Turboarbeitsmaschinen, RWTH Aachen /Aachen University of Technology),52062 Aachen, Germany
(Received 3 April 1997;In finalform 10 July 1997)
The paper deals with experimental investigations and analyses of unsteady pressure dis-tributions in different axial compressors. Based on measurements in a single stage researchcompressor the influence of increasing aerodynamic load onto the pressure and velocityfluctuations is demonstrated. Detailed measurements in a 14-stage and a 17-stage gasturbine compressor are reported. For both compressors parameters could be found which areclearly influenced by the aerodynamic load.
For the 14-stage compressor the principles for the monitoring of aerodynamic load andstall are reported. Results derived from a monitoring system for multi stage compressorsbased on these principles are demonstrated. For the 17-stage compressor the data enhance-ment of the measuring signals is shown. The parameters derived from these results provide agood base for the development of another prediction method for the compressor stabilitylimit. In order design an on-line system the classification of the operating and loadconditions is provided by a neural net. The training results of the net show a good agreementwith different experiments.
Keywords." Stall and surge monitoring, Unsteady pressure measurements, Compressor load analysis,Load parameters, Neural nets
1. INTRODUCTION
The requirement ofhigh economy ofturbomachinescauses higher efficiencies and power densities withincreasing profile and assembly loads. On the otherhand the loads are limited by the requirement ofoperational safety of the machine. Therefore, themain aim is the guaranty of the availability on a
high level. This aim only can be reached by an in-creasing observation and monitoring of the opera-tional conditions inside the machine.
Various efforts have been made to find measuringand analysis methods for the detection of thestability limit of compressors (Ludwig and Nenni,1979; Paduano et al., 1991; Wang et al., 1993). Forsave compressor operation it is necessary to know
Fax: 0241-8888-229.
77
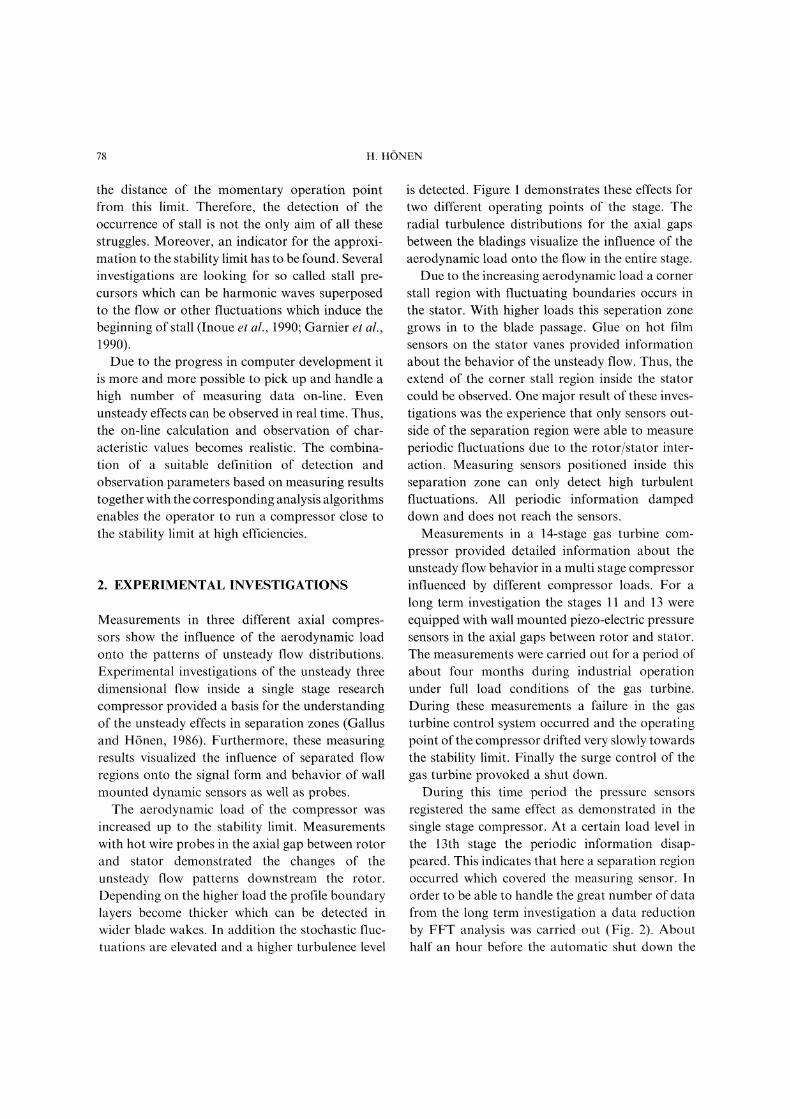
78 H. HONEN
the distance of the momentary operation pointfrom this limit. Therefore, the detection of theoccurrence of stall is not the only aim of all thesestruggles. Moreover, an indicator for the approxi-mation to the stability limit has to be found. Severalinvestigations are looking for so called stall pre-cursors which can be harmonic waves superposedto the flow or other fluctuations which induce thebeginning of stall (Inoue et al., 1990; Garnier et al.,1990).Due to the progress in computer development it
is more and more possible to pick up and handle ahigh number of measuring data on-line. Evenunsteady effects can be observed in real time. Thus,the on-line calculation and observation of char-acteristic values becomes realistic. The combina-tion of a suitable definition of detection andobservation parameters based on measuring resultstogether with the corresponding analysis algorithmsenables the operator to run a compressor close tothe stability limit at high efficiencies.
2. EXPERIMENTAL INVESTIGATIONS
Measurements in three different axial compres-sors show the influence of the aerodynamic loadonto the patterns of unsteady flow distributions.Experimental investigations of the unsteady threedimensional flow inside a single stage researchcompressor provided a basis for the understandingof the unsteady effects in separation zones (Gallusand H6nen, 1986). Furthermore, these measuringresults visualized the influence of separated flowregions onto the signal form and behavior of wallmounted dynamic sensors as well as probes.The aerodynamic load of the compressor was
increased up to the stability limit. Measurementswith hot wire probes in the axial gap between rotorand stator demonstrated the changes of theunsteady flow patterns downstream the rotor.
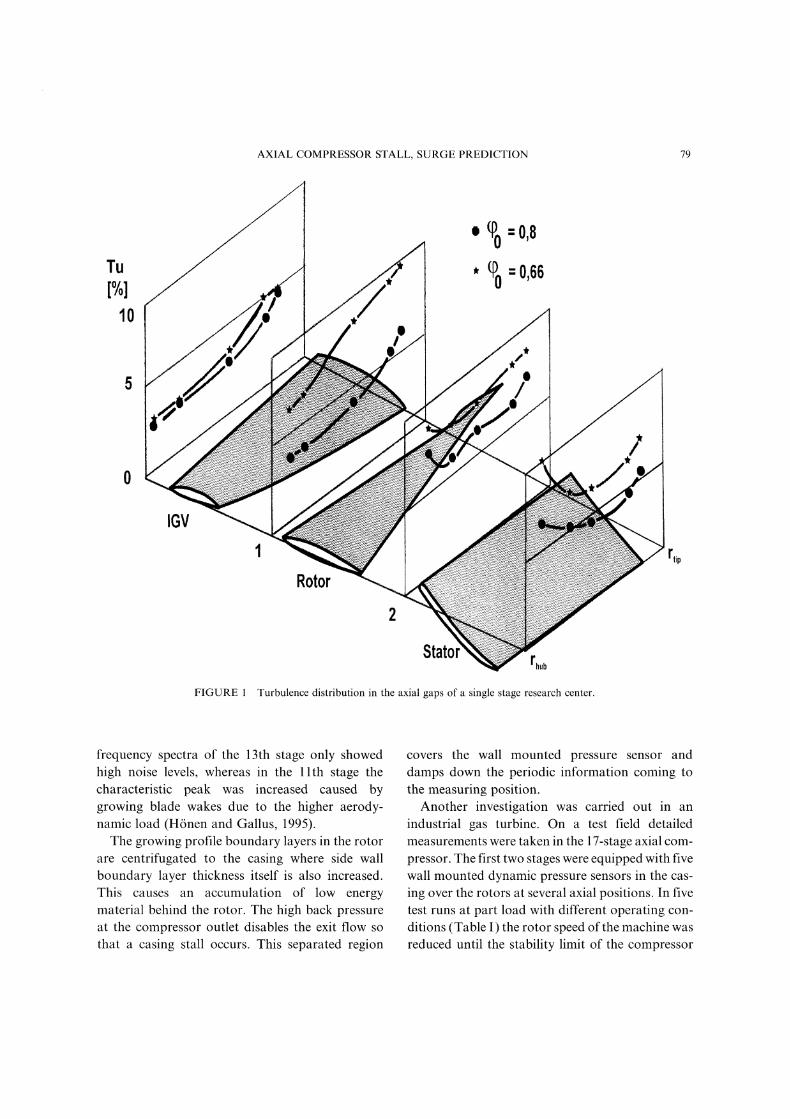
Depending on the higher load the profile boundarylayers become thicker which can be detected inwider blade wakes. In addition the stochastic fluc-tuations are elevated and a higher turbulence level
is detected. Figure demonstrates these effects fortwo different operating points of the stage. Theradial turbulence distributions for the axial gapsbetween the bladings visualize the influence of theaerodynamic load onto the flow in the entire stage.Due to the increasing aerodynamic load a corner
stall region with fluctuating boundaries occurs inthe stator. With higher loads this seperation zone
grows in to the blade passage. Glue on hot filmsensors on the stator vanes provided informationabout the behavior of the unsteady flow. Thus, theextend of the corner stall region inside the statorcould be observed. One major result of these inves-tigations was the experience that only sensors out-side of the separation region were able to measureperiodic fluctuations due to the rotor/stator inter-action. Measuring sensors positioned inside thisseparation zone can only detect high turbulentfluctuations. All periodic information dampeddown and does not reach the sensors.Measurements in a 14-stage gas turbine com-
pressor provided detailed information about theunsteady flow behavior in a multi stage compressorinfluenced by different compressor loads. For a
long term investigation the stages 11 and 13 were
equipped with wall mounted piezo-electric pressuresensors in the axial gaps between rotor and stator.The measurements were carried out for a period ofabout four months during industrial operationunder full load conditions of the gas turbine.During these measurements a failure in the gasturbine control system occurred and the operatingpoint of the compressor drifted very slowly towardsthe stability limit. Finally the surge control of thegas turbine provoked a shut down.During this time period the pressure sensors
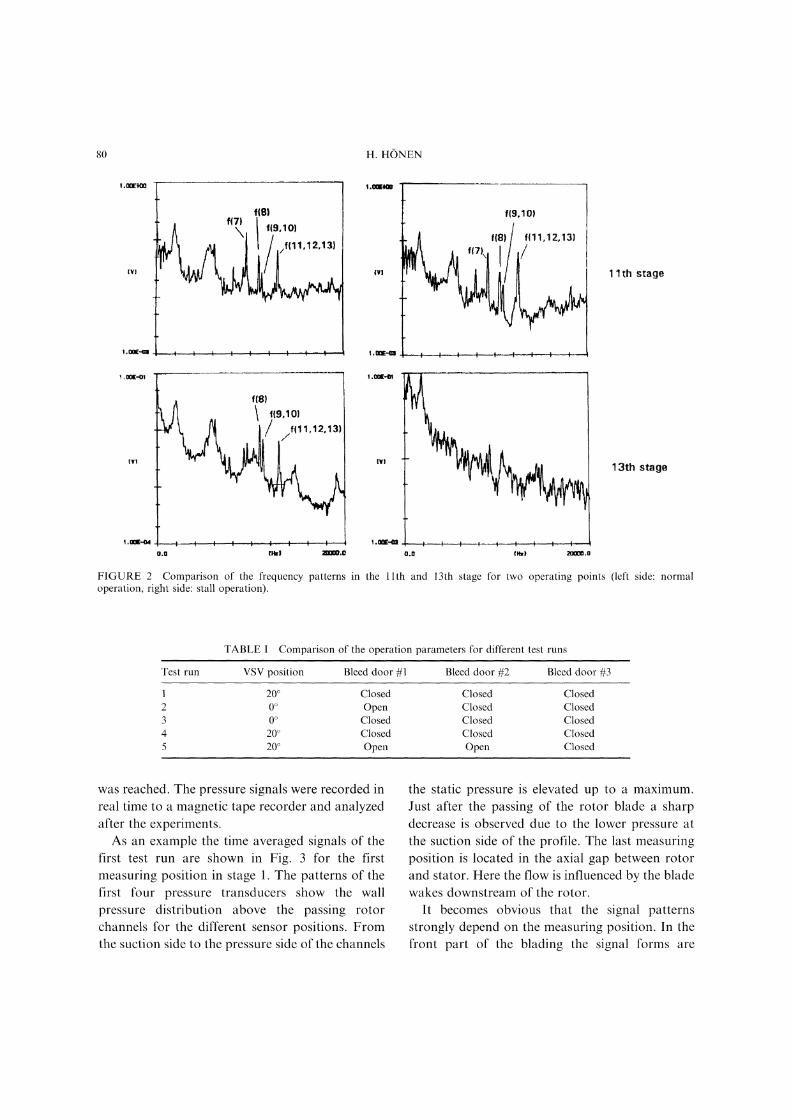
registered the same effect as demonstrated in thesingle stage compressor. At a certain load level inthe 13th stage the periodic information disap-peared. This indicates that here a separation regionoccurred which covered the measuring sensor. Inorder to be able to handle the great number of datafrom the long term investigation a data reductionby FFT analysis was carried out (Fig. 2). Abouthalf an hour before the automatic shut down the
AXIAL COMPRESSOR STALL, SURGE PREDICTION 79
Tu
10
IGV
Rotor
Stator rhubFIGURE Turbulence distribution in the axial gaps of a single stage research center.
rtip
frequency spectra of the 13th stage only showedhigh noise levels, whereas in the lth stage thecharacteristic peak was increased caused bygrowing blade wakes due to the higher aerody-namic load (H6nen and Gallus, 1995).The growing profile boundary layers in the rotor
are centrifugated to the casing where side wallboundary layer thickness itself is also increased.This causes an accumulation of low energymaterial behind the rotor. The high back pressureat the compressor outlet disables the exit flow sothat a casing stall occurs. This separated region
covers the wall mounted pressure sensor anddamps down the periodic information coming tothe measuring position.Another investigation was carried out in an
industrial gas turbine. On a test field detailedmeasurements were taken in the 17-stage axial com-pressor. The first two stages were equipped with fivewall mounted dynamic pressure sensors in the cas-
ing over the rotors at several axial positions. In fivetest runs at part load with different operating con-ditions (Table I) the rotor speed of the machine wasreduced until the stability limit of the compressor
80 H. HONEN
lh sage
(Y1
t jf(8)
t 1(9,10)
o.o lkl 29001).0 O.n (Hx) 20000.0
13th stage
FIGURE 2 Comparison of the frequency patterns in the lth and 13th stage for two operating points (left side: normaloperation, right side: stall operation).
TABLE Comparison of the operation parameters for different test runs
Test run VSV position Bleed door #1 Bleed door #2 Bleed door #3
20 Closed Closed Closed2 0 Open Closed Closed3 0 Closed Closed Closed4 20 Closed Closed Closed5 20 Open Open Closed
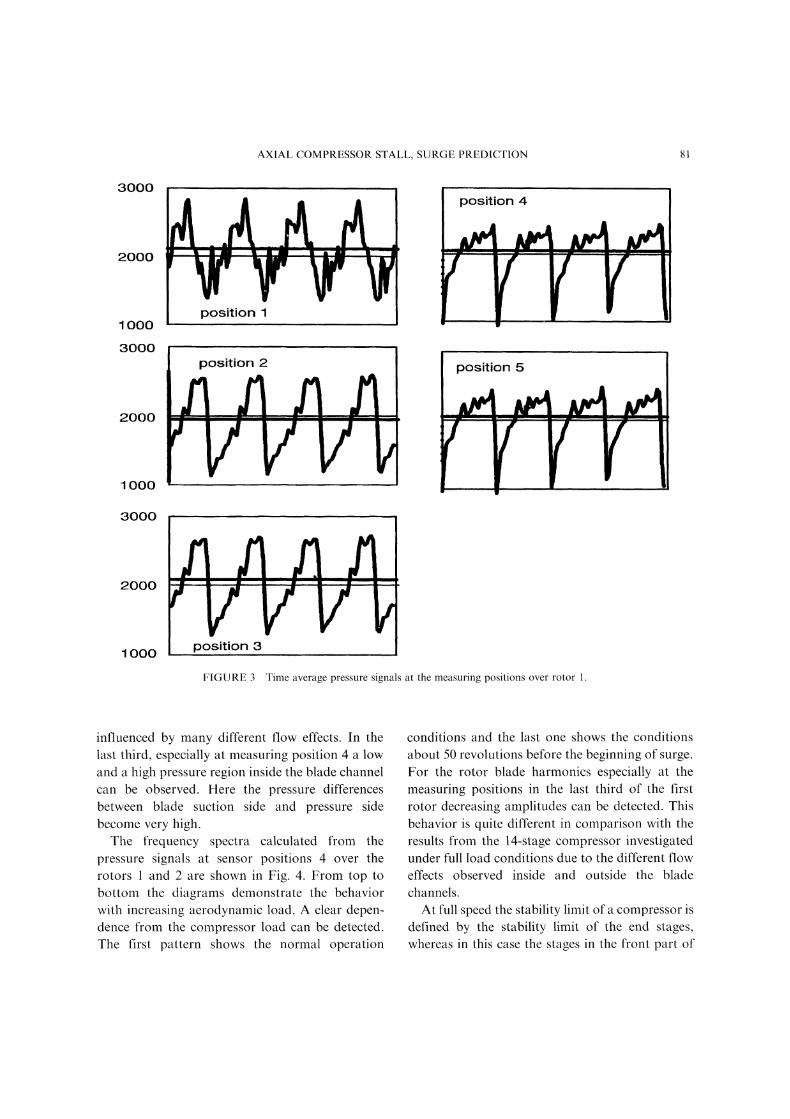
was reached. The pressure signals were recorded inreal time to a magnetic tape recorder and analyzedafter the experiments.As an example the time averaged signals of the
first test run are shown in Fig. 3 for the firstmeasuring position in stage 1. The patterns of thefirst four pressure transducers show the wallpressure distribution above the passing rotorchannels for the different sensor positions. Fromthe suction side to the pressure side of the channels
the static pressure is elevated up to a maximum.Just after the passing of the rotor blade a sharpdecrease is observed due to the lower pressure atthe suction side of the profile. The last measuringposition is located in the axial gap between rotorand stator. Here the flow is influenced by the bladewakes downstream of the rotor.
It becomes obvious that the signal patternsstrongly depend on the measuring position. In thefront part of the blading the signal forms are
30O0
2000
1 000
3000
20O0
1 000
3OOO
2000
1 000
AXIAL COMPRESSOR STALL, SURGE PREDICTION
position 1
position 4
position 2 position 5
p..osition 3
FIGURE 3 Time average pressure signals at the measuring positions over rotor 1.
influenced by many different flow effects. In thelast third, especially at measuring position 4 a lowand a high pressure region inside the blade channelcan be observed. Here the pressure differencesbetween blade suction side and pressure sidebecome very high.The frequency spectra calculated from the
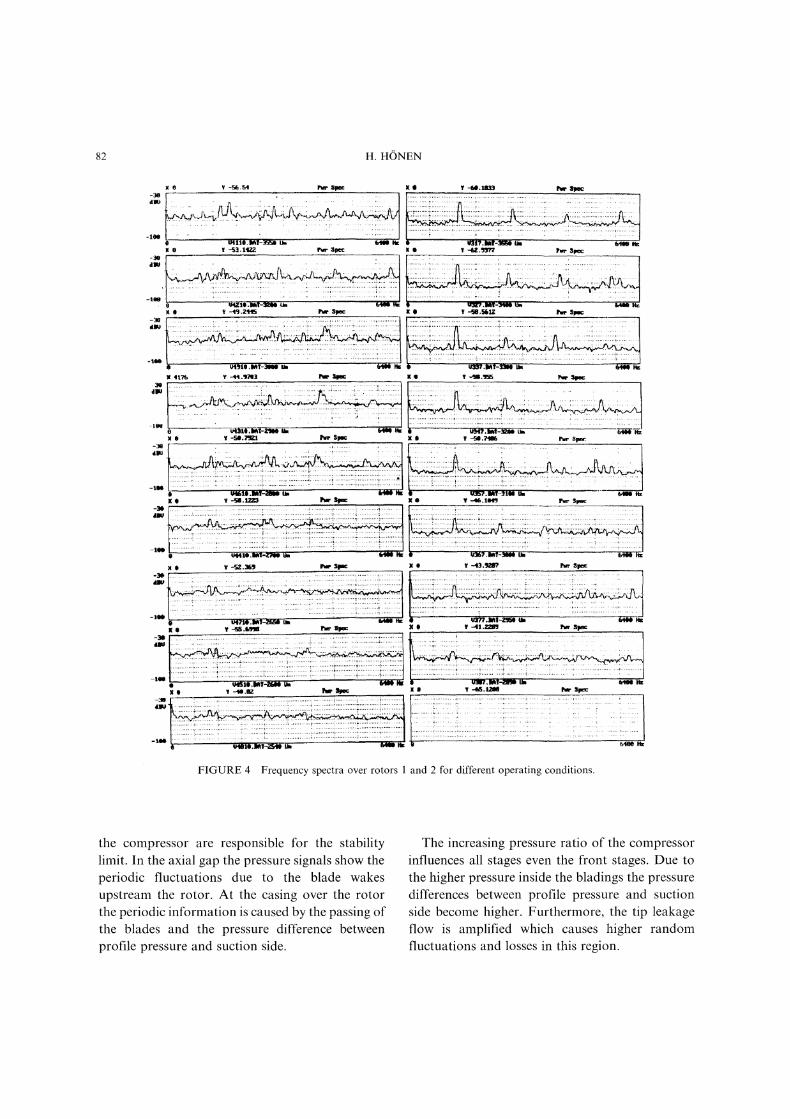
pressure signals at sensor positions 4 over therotors and 2 are shown in Fig. 4. From top to
bottom the diagrams demonstrate the behaviorwith increasing aerodynamic load. A clear depen-dence from the compressor load can be detected.The first pattern shows the normal operation
conditions and the last one shows the conditionsabout 50 revolutions before the beginning of surge.For the rotor blade harmonics especially at themeasuring positions in the last third of the first
rotor decreasing amplitudes can be detected. Thisbehavior is quite different in comparison with theresults from the 14-stage compressor investigatedunder full load conditions due to the different floweffects observed inside and outside the bladechannels.At full speed the stability limit of a compressor is
defined by the stability limit of the end stages,whereas in this case the stages in the front part of
82 H. HONEN
-63 .I’L :Spec .93’7 5pcc
x$ x4 .1
FIGURE 4 Frequency spectra over rotors and 2 for different operating conditions.
the compressor are responsible for the stabilitylimit. In the axial gap the pressure signals show theperiodic fluctuations due to the blade wakesupstream the rotor. At the casing over the rotorthe periodic information is caused by the passing ofthe blades and the pressure difference betweenprofile pressure and suction side.
The increasing pressure ratio of the compressorinfluences all stages even the front stages. Due tothe higher pressure inside the bladings the pressuredifferences between profile pressure and suctionside become higher. Furthermore, the tip leakageflow is amplified which causes higher randomfluctuations and losses in this region.
AXIAL COMPRESSOR STALL, SURGE PREDICTION 83
3. PARAMETER DEFINITION ANDANALYSIS
In order to enable the results and observationsshown above for a computerized analysis suitableparameters have to be defined. These parametersmust contain the main information from themeasuring results and transform it into a set ofvalues which can be analyzed by a computer. Themeasurement of unsteady flow signals provide anenormous number of data which must be reducedfor an analysis.The form of all real time signals shows clearly
different patterns with changing aerodynamic load.It becomes obvious that the shape of the rotorwakes as well as the distribution of the low andhigh pressure region over the rotor blades changes.In addition the random fluctuations become moreand more intensive. The behavior of the stochasticfluctuations is characterized by the calculation ofthe RMS values of the signals and the turbulencelevels. These parameters could be found as usableindicators for the increase of aerodynamic load.However, the transformation of the signal shapeinformation into a computer readable form is moredifficult. The problem is the definition of param-eters which make the signal pattern as well as itsvariation visible. One possibility is the definition ofa normalized value for the amplitude and theduration of the fluctuation.
tfluct /- AfluctWfluct Tp hfluct A
(1)
with fluct passing time of the high (low) pressureregion; Tv rotor blade passing time.For measurements in the axial gap these
parameters could be calculated with the wake data.For the investigations inside the blade channels thedifferent pressure regions (see Fig. 3) have to beanalyzed.Another method of data reduction is the FFT
analysis. The frequency spectra of the measuringsignals demonstrated the influence of the aero-
dynamic load onto the periodic fluctuations. The
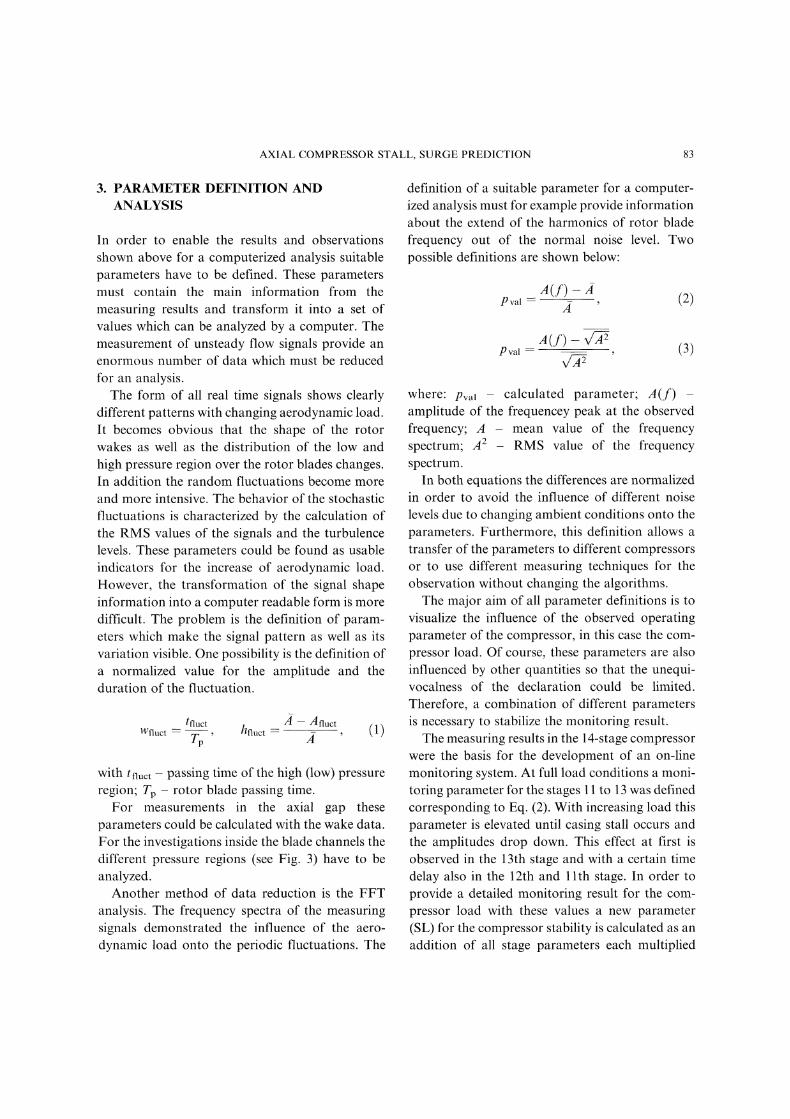
definition of a suitable parameter for a computer-ized analysis must for example provide informationabout the extend of the harmonics of rotor bladefrequency out of the normal noise level. Twopossible definitions are shown below:
A(f) APval (2)
A(f) v/A2
Pva v/A2
where: Pa- calculated parameter; A(f)amplitude of the frequencey peak at the observedfrequency; A mean value of the frequencyspectrum; A2 RMS value of the frequencyspectrum.
In both equations the differences are normalizedin order to avoid the influence of different noiselevels due to changing ambient conditions onto theparameters. Furthermore, this definition allows a
transfer of the parameters to different compressorsor to use different measuring techniques for theobservation without changing the algorithms.The major aim of all parameter definitions is to
visualize the influence of the observed operatingparameter of the compressor, in this case the com-pressor load. Of course, these parameters are alsoinfluenced by other quantities so that the unequi-vocalness of the declaration could be limited.Therefore, a combination of different parametersis necessary to stabilize the monitoring result.The measuring results in the 14-stage compressor
were the basis for the development of an on-line
monitoring system. At full load conditions a moni-toring parameter for the stages 11 to 13 was definedcorresponding to Eq. (2). With increasing load this
parameter is elevated until casing stall occurs andthe amplitudes drop down. This effect at first isobserved in the 13th stage and with a certain timedelay also in the 12th and th stage. In order to
provide a detailed monitoring result for the com-
pressor load with these values a new parameter(SL) for the compressor stability is calculated as an
addition of all stage parameters each multiplied
84 H. HONEN
with a weighing coefficient (a) (H6nen and Gallus,1995):
SL astagel3 Pvalstagel3 -Jr- astagel2 Pvalstagel2
L astagel Pvalstagell (4)
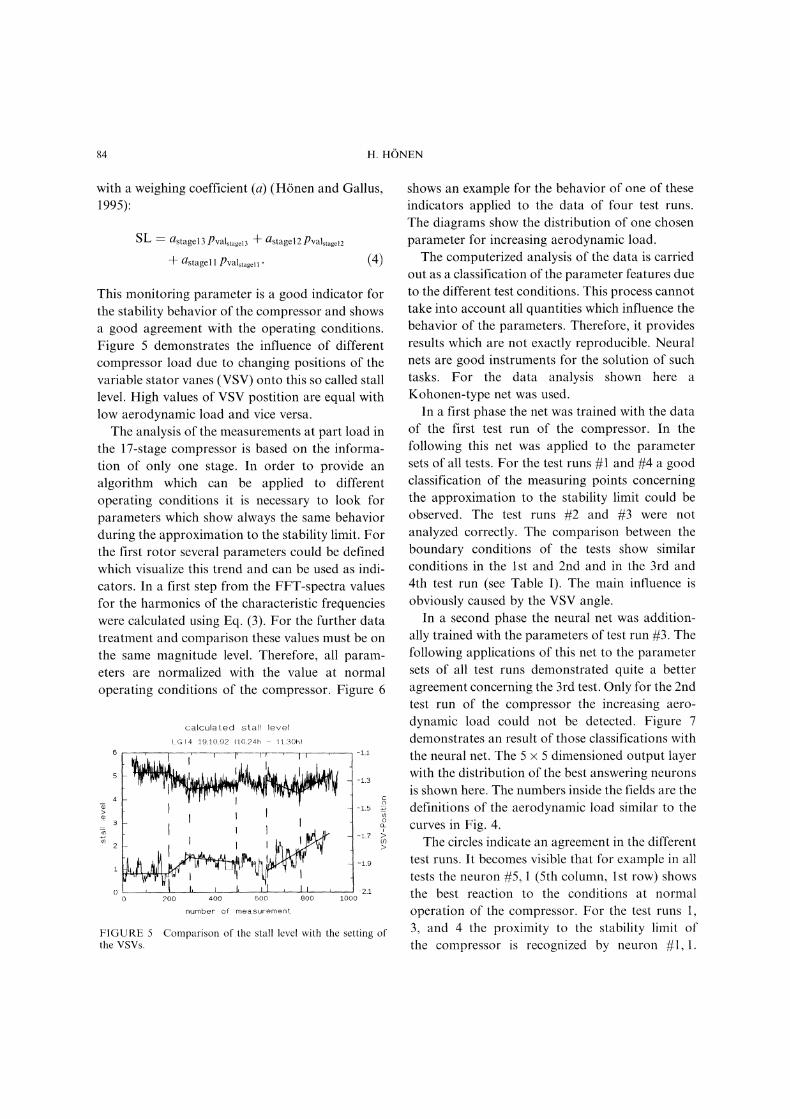
This monitoring parameter is a good indicator forthe stability behavior of the compressor and showsa good agreement with the operating conditions.Figure 5 demonstrates the influence of differentcompressor load due to changing positions of thevariable stator vanes (VSV) onto this so called stalllevel. High values of VSV postition are equal withlow aerodynamic load and vice versa.The analysis of the measurements at part load in
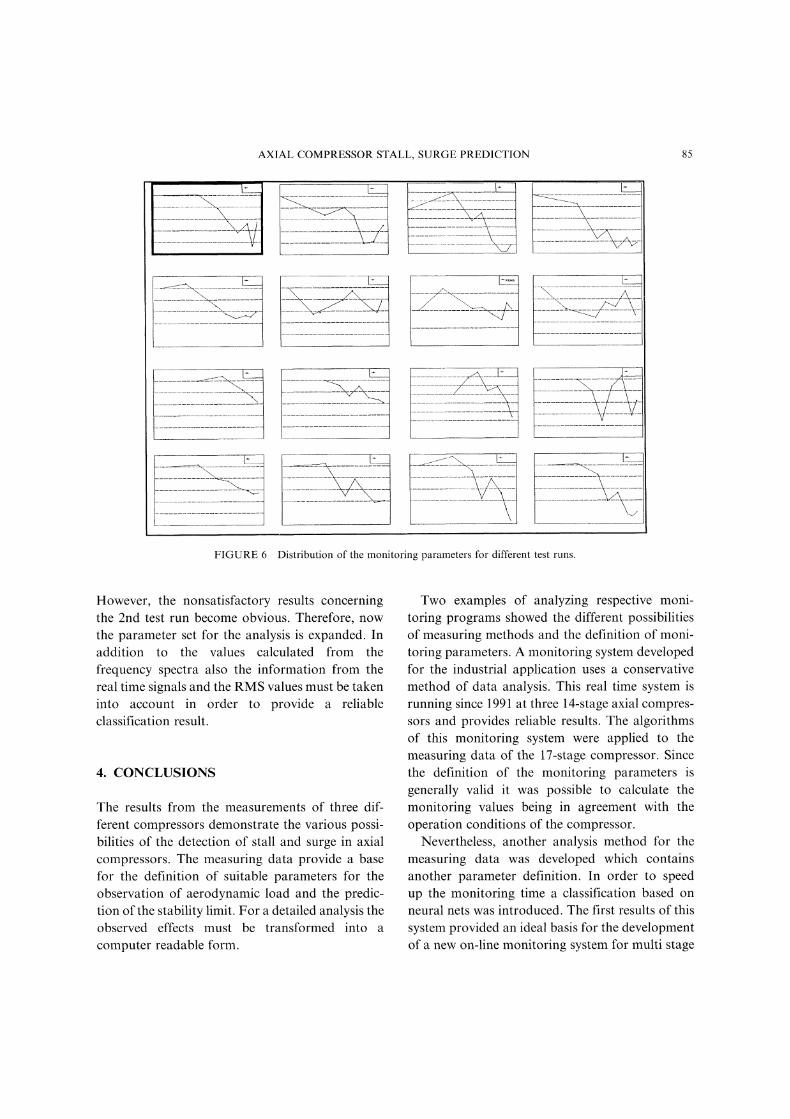
the 17-stage compressor is based on ttie informa-tion of only one stage. In order to provide an
algorithm which can be applied to differentoperating conditions it is necessary to look forparameters which show always the same behaviorduring the approximation to the stability limit. Forthe first rotor several parameters could be definedwhich visualize this trend and can be used as. indi-cators. In a first step from the FFT-spectra valuesfor the harmonics of the characteristic frequencieswere calculated using Eq. (3). For the further datatreatment and comparison these values must be onthe same magnitude level. Therefore, all param-eters are normalized with the value at normaloperating conditions of the compressor. Figure 6
calculated stall level
LGI4 19.:[0.92 (10.24h 11.30h)
/ 2’, " -JT--, I’ -L1
ol ’I II II -2.10 200 400 600 800 Iooo
number of measurement
FIGURE 5 Comparison of the stall level with the setting ofthe VSVs.
shows an example for the behavior of one of theseindicators applied to the data of four test runs.The diagrams show the distribution of one chosenparameter for increasing aerodynamic load.The computerized analysis of the data is carried
out as a classification of the parameter features dueto the different test conditions. This process cannottake into account all quantities which influence thebehavior of the parameters. Therefore, it providesresults which are not exactly reproducible. Neuralnets are good instruments for the solution of suchtasks. For the data analysis shown here a
Kohonen-type net was used.In a first phase the net was trained with the data
of the first test run of the compressor. In thefollowing this net was applied to the parametersets of all tests. For the test runs #1 and #4 a goodclassification of the measuring points concerningthe approximation to the stability limit could beobserved. The test runs #2 and #3 were not
analyzed correctly. The comparison between theboundary conditions of the tests show similarconditions in the 1st and 2nd and in the 3rd and4th test run (see Table I). The main influence isobviously caused by the VSV angle.
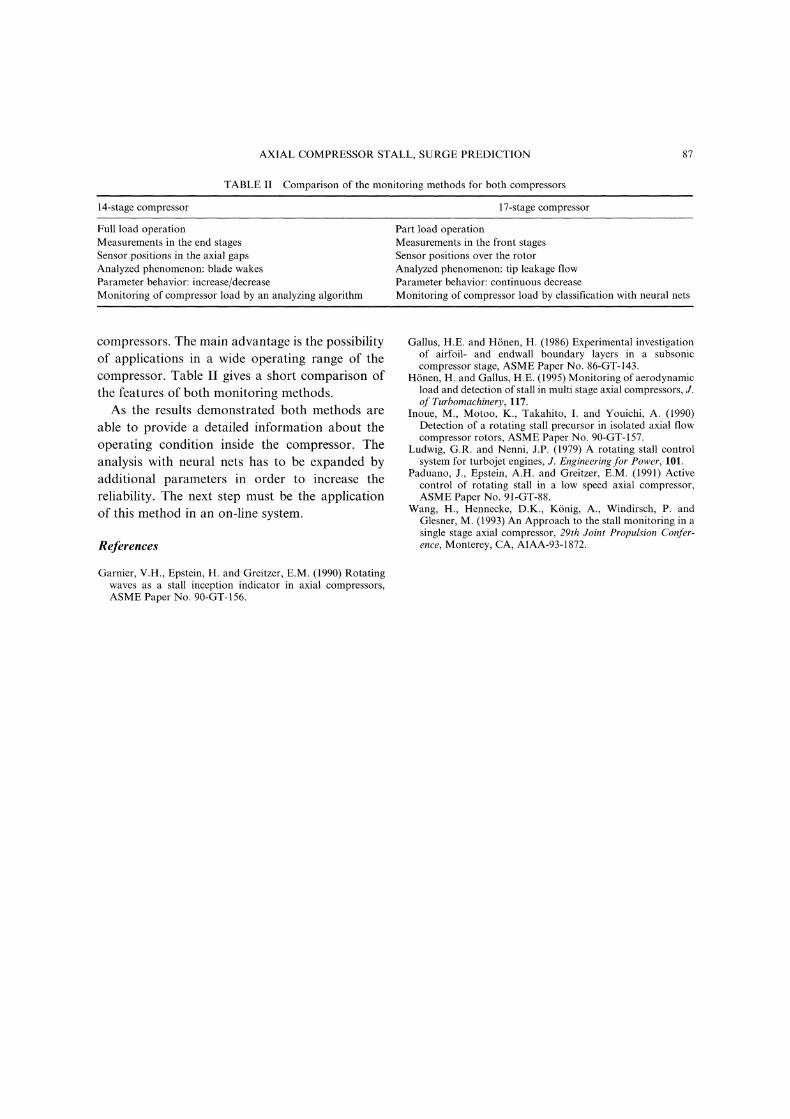
In a second phase the neural net was addition-ally trained with the parameters of test run #3. Thefollowing applications of this net to the parametersets of all test runs demonstrated quite a betteragreement concerning the 3rd test. Only for the 2ndtest run of the compressor the increasing aero-
dynamic load could not be detected. Figure 7demonstrates an result of those classifications withthe neural net. The 5 5 dimensioned output layerwith the distribution of the best answering neuronsis shown here. The numbers inside the fields are thedefinitions of the aerodynamic load similar to thecurves in Fig. 4.The circles indicate an agreement in the different
test runs. It becomes visible that for example in alltests the neuron #5, (5th column, 1st row) showsthe best reaction to the conditions at normaloperation of the compressor. For the test runs 1,3, and 4 the proximity to the stability limit ofthe compressor is recognized by neuron #1, 1.
AXIAL COMPRESSOR STALL, SURGE PREDICTION 85
FIGURE 6 Distribution of the monitoring parameters for different test runs.
However, the nonsatisfactory results concerningthe 2nd test run become obvious. Therefore, nowthe parameter set for the analysis is expanded. Inaddition to the values calculated from thefrequency spectra also the information from thereal time signals and the RMS values must be takeninto account in order to provide a reliableclassification result.
4. CONCLUSIONS
The results from the measurements of three dif-ferent compressors demonstrate the various possi-bilities of the detection of stall and surge in axialcompressors. The measuring data provide a basefor the definition of suitable parameters for theobservation of aerodynamic load and the predic-tion of the stability limit. For a detailed analysis theobserved effects must be transformed into a
computer readable form.
Two examples of analyzing respective moni-
toring programs showed the different possibilitiesof measuring methods and the definition of moni-toring parameters. A monitoring system developedfor the industrial application uses a conservativemethod of data analysis. This real time system is
running since 1991 at three 14-stage axial compres-sors and provides reliable results. The algorithmsof this monitoring system were applied to themeasuring data of the 17-stage compressor. Sincethe definition of the monitoring parameters is
generally valid it was possible to calculate themonitoring values being in agreement with theoperation conditions of the compressor.
Nevertheless, another analysis method for themeasuring data was developed which containsanother parameter definition. In order to speedup the monitoring time a classification based on
neural nets was introduced. The first results of thissystem provided an ideal basis for the developmentof a new on-line monitoring system for multi stage

86 H. HONEN
12345
12345
5
1234
123456
8
test run #1 test run #2
12345
12345/4 fl
6
2345
12345
6
test run #3 test run #4FIGURE 7 Analysis of the output layers of the neural net.
AXIAL COMPRESSOR STALL, SURGE PREDICTION
TABLE II Comparison of the monitoring methods for both compressors
14-stage compressor 17-stage compressor
87
Full load operationMeasurements in the end stagesSensor positions in the axial gapsAnalyzed phenomenon: blade wakesParameter behavior: increase/decreaseMonitoring of compressor load by an analyzing algorithm
Part load operationMeasurements in the front stagesSensor positions over the rotorAnalyzed phenomenon: tip leakage flowParameter behavior: continuous decreaseMonitoring of compressor load by classification with neural nets
compressors. The main advantage is the possibilityof applications in a wide operating range of thecompressor. Table II gives a short comparison ofthe features of both monitoring methods.As the results demonstrated both methods are
able to provide a detailed information about theoperating condition inside the compressor. Theanalysis with neural nets has to be expanded byadditional parameters in order to increase thereliability. The next step must be the applicationof this method in an on-line system.
References
Garnier, V.H., Epstein, H. and Greitzer, E.M. (1990) Rotatingwaves as a stall inception indicator in axial compressors,ASME Paper No. 90-GT- 156.
Gallus, H.E. and H6nen, H. (1986) Experimental investigationof airfoil- and endwall boundary layers in a subsoniccompressor stage, ASME Paper No. 86-GT-143.
H6nen, H. and Gallus, H.E. (1995) Monitoring of aerodynamicload and detection of stall in multi stage axial compressors, J.of Turbomachinery, 117.
Inoue, M., Motoo, K., Takahito, I. and Youichi, A. (1990)Detection of a rotating stall precursor in isolated axial flowcompressor rotors, ASME Paper No. 90-GT-157.
Ludwig, G.R. and Nenni, J.P. (1979) A rotating stall controlsystem for turbojet engines, J. Engineeringfor Power, 101.
Paduano, J., Epstein, A.H. and Greitzer, E.M. (1991) Activecontrol of rotating stall in a low speed axial compressor,ASME Paper No. 91-GT-88.
Wang, H., Hennecke, D.K., K6nig, A., Windirsch, P. andGlesner, M. (1993) An Approach to the stall monitoring in asingle stage axial compressor, 29th Joint Propulsion Confer-ence, Monterey, CA, AIAA-93-1872.

EENNEERRGGYY MMAATTEERRIIAALLSSMaterials Science & Engineering for Energy Systems
Economic and environmental factors are creating ever greater pressures for theefficient generation, transmission and use of energy. Materials developments arecrucial to progress in all these areas: to innovation in design; to extending lifetimeand maintenance intervals; and to successful operation in more demandingenvironments. Drawing together the broad community with interests in theseareas, Energy Materials addresses materials needs in future energy generation,transmission, utilisation, conservation and storage. The journal covers thermalgeneration and gas turbines; renewable power (wind, wave, tidal, hydro, solar andgeothermal); fuel cells (low and high temperature); materials issues relevant tobiomass and biotechnology; nuclear power generation (fission and fusion);hydrogen generation and storage in the context of the ‘hydrogen economy’; andthe transmission and storage of the energy produced.
As well as publishing high-quality peer-reviewed research, Energy Materialspromotes discussion of issues common to all sectors, through commissionedreviews and commentaries. The journal includes coverage of energy economicsand policy, and broader social issues, since the political and legislative contextinfluence research and investment decisions.
SSUUBBSSCCRRIIPPTTIIOONN IINNFFOORRMMAATTIIOONNVolume 1 (2006), 4 issues per year Print ISSN: 1748-9237 Online ISSN: 1748-9245Individual rate: £76.00/US$141.00Institutional rate: £235.00/US$435.00Online-only institutional rate: £199.00/US$367.00For special IOM3 member rates please emailssuubbssccrriippttiioonnss@@mmaanneeyy..ccoo..uukk
EEDDIITTOORRSSDDrr FFuujjiioo AAbbeeNIMS, Japan
DDrr JJoohhnn HHaalldd, IPL-MPT,Technical University ofDenmark, Denmark
DDrr RR VViisswwaannaatthhaann, EPRI, USA
FFoorr ffuurrtthheerr iinnffoorrmmaattiioonn pplleeaassee ccoonnttaacctt::Maney Publishing UKTel: +44 (0)113 249 7481 Fax: +44 (0)113 248 6983 Email: [email protected] Publishing North AmericaTel (toll free): 866 297 5154 Fax: 617 354 6875 Email: [email protected]
For further information or to subscribe online please visitwwwwww..mmaanneeyy..ccoo..uukk
CCAALLLL FFOORR PPAAPPEERRSSContributions to the journal should be submitted online athttp://ema.edmgr.com
To view the Notes for Contributors please visit:www.maney.co.uk/journals/notes/ema
Upon publication in 2006, this journal will be available via theIngenta Connect journals service. To view free sample contentonline visit: wwwwww..iinnggeennttaaccoonnnneecctt..ccoomm//ccoonntteenntt//mmaanneeyy
NNEEWW
FFOORR 22000066
Maney Publishing on behalf of the Institute of Materials, Minerals and Mining

International Journal of
AerospaceEngineeringHindawi Publishing Corporationhttp://www.hindawi.com Volume 2010
RoboticsJournal of
Hindawi Publishing Corporationhttp://www.hindawi.com Volume 2014
Hindawi Publishing Corporationhttp://www.hindawi.com Volume 2014
Active and Passive Electronic Components
Control Scienceand Engineering
Journal of
Hindawi Publishing Corporationhttp://www.hindawi.com Volume 2014
International Journal of
RotatingMachinery
Hindawi Publishing Corporationhttp://www.hindawi.com Volume 2014
Hindawi Publishing Corporation http://www.hindawi.com
Journal ofEngineeringVolume 2014
Submit your manuscripts athttp://www.hindawi.com
VLSI Design
Hindawi Publishing Corporationhttp://www.hindawi.com Volume 2014
Hindawi Publishing Corporationhttp://www.hindawi.com Volume 2014
Shock and Vibration
Hindawi Publishing Corporationhttp://www.hindawi.com Volume 2014
Civil EngineeringAdvances in
Acoustics and VibrationAdvances in
Hindawi Publishing Corporationhttp://www.hindawi.com Volume 2014
Hindawi Publishing Corporationhttp://www.hindawi.com Volume 2014
Electrical and Computer Engineering
Journal of
Advances inOptoElectronics
Hindawi Publishing Corporation http://www.hindawi.com
Volume 2014
The Scientific World JournalHindawi Publishing Corporation http://www.hindawi.com Volume 2014
SensorsJournal of
Hindawi Publishing Corporationhttp://www.hindawi.com Volume 2014
Modelling & Simulation in EngineeringHindawi Publishing Corporation http://www.hindawi.com Volume 2014
Hindawi Publishing Corporationhttp://www.hindawi.com Volume 2014
Chemical EngineeringInternational Journal of Antennas and
Propagation
International Journal of
Hindawi Publishing Corporationhttp://www.hindawi.com Volume 2014
Hindawi Publishing Corporationhttp://www.hindawi.com Volume 2014
Navigation and Observation
International Journal of
Hindawi Publishing Corporationhttp://www.hindawi.com Volume 2014
DistributedSensor Networks
International Journal of