Embed Size (px)
DESCRIPTION
AX 2012 BI Capabilities and Tools
Citation preview

Microsoft Dynamics
®
AX
Business intelligence capabilities and tools in Microsoft Dynamics
AX 2012 R2
White Paper
This document provides information about BI tools and capabilities, and provides a scenario-based framework for choosing the right BI tool for the needs of different categories of
users in an organization.
Milinda Vitharana April 2013
http://www.microsoft.com/dynamics/ax

2 BUSINESS INTELLIGENCE CAPABILITIES AND TOOLS IN MICROSOFT DYNAMICS AX 2012 R2
Table of contents
Introduction ................................................................................................ 3
The most common pitfalls in BI and how to avoid them .............................. 4 Barriers to the adoption of BI ................................................................................................. 4 Catalysts to broad adoption of BI ............................................................................................ 5
Core concept: Role-based BI ....................................................................... 5 Operational personas (role or task focus) ................................................................................. 5 Tactical personas (process or team focus) ................................................................................ 6 Strategic personas (corporate focus) ....................................................................................... 7 Choosing BI tools and capabilities based on role ....................................................................... 7
Core concept: Use of familiar tools and capabilities .................................... 7
Core concept: BI is an integral part of the Microsoft Dynamics AX 2012 R2 experience .................................................................................................. 9
The Microsoft Dynamics AX home page is a BI-enabled dashboard – Role Centers ........................ 9 Interactive charts and visualizations – Embedded SQL Power View .............................................10 Building ad-hoc queries visually – Microsoft Dynamics AX cues ..................................................11 Contextual information in the corner of the eye – Microsoft Dynamics AX 2012 FactBoxes ............12 Exploring trends behind list pages – Embedded SQL Power View ................................................13
BI tools in Microsoft Dynamics AX 2012 .................................................... 14 Query tools .........................................................................................................................15 Reporting tools ....................................................................................................................15 Analysis tools ......................................................................................................................16
Choosing the right tool for the job ............................................................ 17
Microsoft Dynamics AX 2012 R2 BI in action ............................................. 17 Operational persona: Arnie drills into details ...........................................................................17 Tactical persona: Connie explores trends ................................................................................19 Strategic persona: Sara stays on top of corporate goals ...........................................................21
Conclusion ................................................................................................ 22

3
BUSINESS INTELLIGENCE CAPABILITIES AND TOOLS IN MICROSOFT DYNAMICS AX 2012 R2
Introduction
Microsoft Dynamics AX 2012 R2 ships with a powerful business intelligence (BI) solution. Along with Microsoft SQL Server 2012, Microsoft Dynamics AX 2012 R2 offers a comprehensive set of BI capabilities and tools. If you are a solution architect or systems implementer who is devising a solution that is based on Microsoft Dynamics AX 2012, how do you choose the right BI tool for the various personas in an organization? This paper introduces BI tools and capabilities, and provides a scenario-based framework for choosing the right BI tool for the needs of different categories of users in an organization.
Microsoft Dynamics AX 2012 R2 together with the powerful capabilities of Microsoft BI technology such as SQL Server 2012 and Microsoft Office 2013 can help users make smarter and better decisions
based on insights derived from data. BI capabilities enabled in Microsoft Dynamics AX 2012 R2 include;
45 Pre-built Role centers (Dashboards) targeted towards various roles within an organization that provide insights and operational details at a glance.
Pre-defined set of key performance indicators (KPIs) and business indicators that can easily the added to a Role center.
Ability to personalize (filter) corporate KPIs and business indicators on Role centers
Ability to define and add cues, which are operational indicators that monitor real-time status for example, customers past due
Data exploration and visualization with interactive user experience using SQL Power View in Role center pages
Ad-hoc analysis with managed and trusted data using SQL Power View1 from a Microsoft Dynamics AX list page
Ability to access data from Microsoft Dynamics AX in Microsoft Excel to query, analyze and report on data without compromising on Microsoft Dynamics AX security definitions.
Pre-defined Microsoft SQL Server Analysis Services reports
Create versatile financial statements using Management Reporter
The preceding list includes some of the built-in capabilities that ship with Microsoft Dynamics AX 2012
R2. In addition to these, a large ecosystem of independent software vendor (ISV) tools and partner solutions that leverage the Microsoft Business Intelligence framework can consume and operate on BI content from Microsoft Dynamics AX 2012 R2.
Although these capabilities are powerful and comprehensive, a solution architect or systems implementer faces serious questions when recommending a tool or capability:
Which capability or tools suit a particular organization?
Which capability or tools should I recommend for a given set of users?
Which capability or tools should be used in a given business scenario?
The intent of this paper is to provide our recommendations for leveraging the BI capabilities and tools that are available in Microsoft Dynamics AX 2012.
We also want to introduce a framework that will enable a solution architect or systems implementer to recommend and implement a successful BI solution that leverages the pre-built BI content.
1 Please refer to the Legal disclaimer on use of Microsoft SQL Server 2012 Power view for multidimensional models
Community Technology Preview (CTP) on page 23

4 BUSINESS INTELLIGENCE CAPABILITIES AND TOOLS IN MICROSOFT DYNAMICS AX 2012 R2
This paper is organized into four sections:
The first section focuses on the most common pitfalls associated with BI solutions, and provides possible solutions through insights into the BI vision of Microsoft Dynamics AX.
The second section provides an overview of the BI tools and capabilities of Microsoft Dynamics AX
2012 R2.
The third section describes a scenario-based framework for identifying suitable tools and capabilities.
The fourth section illustrates the concepts in action in several Role Centers in Microsoft Dynamics AX 2012 R2.
The most common pitfalls in BI and how to avoid them
Business intelligence is a technology that has the potential to empower everyone in an organization with relevant and timely information, thereby enabling them to make confident decisions that drive success.
To a solution architect who is proposing a BI solution or a systems implementer who is implementing the solution, this may be a primary design objective. So what are the most common pitfalls that have stymied efforts in the past?
Barriers to the adoption of BI
Research shows that BI capability penetrates only about 15 to 20 percent of the total employee base in a typical organization. To see how counterintuitive this figure is, consider the following questions:
Is critical business information less valuable to the other 80 percent of your organization?
Would a larger portion of users not benefit from BI?
Does this mean that 80 percent of your employees don’t make decisions that have an impact on your business?
The answer to all these questions is, “Of course not!”
Researchers at Microsoft have found several major barriers to broader adoption of BI. Of these, three are overwhelmingly cited as the main barriers to adoption:
Information overload – Employees are constantly bombarded with irrelevant and non-actionable information. As a result, they tend to “tune out,” and even relevant information gets lost among all the noise.
Technology fatigue introduced by too many disparate tools – With a few exceptions, most
employees are not natural technologists. Also, most tools nowadays are highly specialized and require moderate to advanced skills. Unfortunately, to take advantage of BI, you are asking your employees to learn to use yet another tool. This is in addition to doing their regular jobs. The result is that employees don’t have the time to master these tools and therefore don’t benefit from
BI.
Access to BI capability is limited – There is a widespread notion that BI capability should be limited to management or to a few business analysts. This argument is counterintuitive to current
management thinking, yet our research found that most organizations are hesitant to provide BI capabilities to the broader workforce.
Technology investments in BI cannot generate business value if employees don’t use the capabilities. As a solution architect or systems implementer, one of your primary goals might be to ensure broad adoption throughout your organization.

5
BUSINESS INTELLIGENCE CAPABILITIES AND TOOLS IN MICROSOFT DYNAMICS AX 2012 R2
Catalysts to broad adoption of BI
The Microsoft Dynamics AX BI solution embodies three core design concepts that promote broader adoption of BI within an organization:
Role-based BI – Microsoft Dynamics AX adopts a persona-based or role-based approach to BI. The objective is to filter out irrelevant information and present the user only with BI information that is relevant to that user’s specific role.
Use of familiar tools and capabilities – Excel is by far the most commonly used BI tool in the world. A large portion of users in most organizations know and use Excel every day. Instead of
building new tools and capabilities, the Microsoft Dynamics AX 2012 R2 BI solution leverages the capabilities of Excel and other familiar tools.
BI is an integral part of the Microsoft Dynamics AX 2012 R2 experience – User experience leverages BI capabilities from the first user interaction, such as the home page, all the way to task
and action forms. BI capabilities are tightly integrated into the Microsoft Dynamics AX 2012 R2 experience and business processes.
The following sections provide more information about these core concepts, along with example
scenarios.
Core concept: Role-based BI
This core concept is simple and straightforward: Provide BI that is relevant and timely for a specific group of people within an organization.
Organizations are diverse in their scope of operations and size. Whereas mid-market organizations employ hundreds, if not thousands, of employees, larger enterprises employ many more. Moreover, a government agency has a very different business model than a process manufacturing organization. How is it possible to provide individually tailored BI capabilities and tools to such a large number of
diverse people and organizations?
Microsoft surveyed hundreds of organizations over a period of several years to identify the roles that people have within organizations of different sizes, across various sectors and cultures. The result is the Microsoft Dynamics Customer Model2, a framework that has enabled us to document, capture, and visualize how people work within organizations.
Microsoft Dynamics AX is designed with a consistent, familiar UI that is tailored to people who work in these roles. Role-based BI is the natural extension of this concept.
It is essential that we clarify what relevant and timely mean to different people before any discussion about role-based BI. Let’s consider three broad groups of users, based on their work focus:
Operational personas (role or task focus)
Tactical personas (process or team focus)
Strategic personas (corporate focus)
Operational personas (role or task focus)
Operational personas need to remain productive throughout the workday as they focus on a task or role. They need detailed, specific information to accomplish a specific task or make a decision about a particular case. They may need to make similar decisions over and over again for different cases, and they may require several key pieces of information over and over again.
2 For more information about the Microsoft Dynamics Customer Model, go to
http://download.microsoft.com/download/1/5/e/15e9da3f-c3d2-4212-bc2a-
851b8fa25ed7/MS_Customer_0107_LoRes.pdf.

6 BUSINESS INTELLIGENCE CAPABILITIES AND TOOLS IN MICROSOFT DYNAMICS AX 2012 R2
Operational users need actionable data, often in the form of reports or dashboards that prescribe a solution. Having to manipulate information each time is inefficient and prone to error. Therefore, the reports and dashboards need to provide a lot of detailed, contextual information.
Operational users often work in business cycles. Invoices need to be followed up before the month-
end close of books. Keeping an eye on exceptional conditions early is a key characteristic of top-performing employees. Operational users need to be able to track exceptional conditions and make real-time decisions about where to divert their attention during the day.
Consider a couple of real-world scenarios from our hypothetical organization, Contoso Ltd:
Each morning, April, the accounts payable coordinator, wants to know about payments that need to be made during the day. She has categorized vendors and terms into several groups, and she keeps an eye on optimum payment terms. April needs to follow up on payments with the
appropriate approvers. She wants to know, at a glance, areas that need her attention during the day.
Nancy is a super sales representative. She wants to “pick up” any unattended opportunities and service calls whenever she gets a chance in between fulfilling orders. She wants to focus on high-value orders or orders from strategic accounts.
Arnie, the accounts receivable administrator, relies on the Customer aging report to keep track
of customers and invoices that are approaching the past-due category. Arnie can get the details of due invoices and payments by drilling down from the report to detailed records.
As the preceding examples show, April, Nancy, and Arnie need access to detailed information in a timely manner in each case. They need to proactively track exceptions (for example, delayed approvals and exceptional orders) before they turn into issues.
Tactical personas (process or team focus)
People don’t just work as individuals: they work together toward common goals. Managing a group of people requires focusing on tasks, goals, and insights at a group or department level. A manager who
is responsible for a team is an example: the focus shifts from personal productivity to team productivity or monitoring a business process.
A process manager may spend a considerable amount of time responding to issues and deviations
from normal conditions. Periodically as the day progresses, the manager may want to reflect on the overall health and trends. Although actionable information is important at this level, a people or process manager may focus on trends (that is, daily, weekly, and monthly patterns) to identify exceptions.
A people manager may want to slice and dice trends and issues across department, products, customers, or geographies to identify any potential patterns that need to be dealt with.
When people work as a team, there should be a common body of knowledge that enables the team to
collaborate in an environment where information can be accessed and analyzed collaboratively.
Consider following scenarios:
Kevin, a sales manager, tracks the weekly trend of opportunities and sales to make sure that he is on his way toward meeting his monthly and quarterly sales target. Kevin wants to know within days if he is not meeting his sales targets. He wants to know which channels, products, and regions are not meeting goals, so that he can take corrective action.
Ken, the controller, has noticed that the projected cash flow position is lower than expected. He explores cash flow data to understand why the cash flow position is unexpectedly low while planning for remedial actions.
Inga, the purchasing manager, reviews quality and delivery performance of key suppliers on a regular basis. She looks for trends and, where required, drills down to specific order or delivery details.

7
BUSINESS INTELLIGENCE CAPABILITIES AND TOOLS IN MICROSOFT DYNAMICS AX 2012 R2
Strategic personas (corporate focus)
Organizations work toward common goals and objectives, and everyone in the organization needs to be oriented toward these goals. At a corporate level, these goals need to be formally stated and monitored against achievement, often in the form or quarterly or monthly statements to shareholders and regulatory bodies.
Sara, the CFO of Contoso Ltd, tracks and monitors her goals and objectives across the entire organization, so that they can be reported to the board and shareholders. Sara adopts a formalized process for defining goals and objectives, and she ensures that these goals are well understood by her
managers. Corporate goals have a longer-term focus, and progress is measured by using monthly and quarterly trends and indicators across business divisions.
Although high-level goals and long-term trends are the focus, managers who are responsible for performance goals must be able to narrow down the problem to individual departments, business
processes, or products.
Choosing BI tools and capabilities based on role
The following table recaps what we have discussed in terms of BI (analysis) patterns and the focus of the various types of personas.
BI pattern Operational personas (Role or task focus)
Tactical personas (Process or team
focus)
Strategic personas (Corporate focus)
Detect exceptions. Track exceptional transactions.
Identify abnormal trends and outliers.
Identify goals that are not met and long-term trends that are not meeting expectations.
Identify clusters and trends.
Perform simple analysis (prioritizing and filtering).
Slice and dice aggregate data.
Use sample data and audits.
Drill down, and compare/benchmark with peers and previous results.
Take action. Seamlessly access detailed data.
Communicate and share patterns, and take proactive/corrective action.
Reorganize, and launch programs and action plans.
This table embodies the principal of role-based BI and can be applied in choosing tools and capabilities based on the needs of the role.
A closer examination of the Role Centers that ship with Microsoft Dynamics AX 2012 R2 will reveal the patterns identified for each persona. We will observe this core concept in action later in this paper.
Core concept: Use of familiar tools and capabilities
Excel is one of the most popular BI tools in the world today, and Excel 2013 introduces powerful capabilities for visualizing and mashing up data from many sources. Instead of building special-purpose tools, Microsoft Dynamics AX 2012 R2 leverages the power of Excel throughout the application.

8 BUSINESS INTELLIGENCE CAPABILITIES AND TOOLS IN MICROSOFT DYNAMICS AX 2012 R2
The information displayed on any list page can be exported to Excel with a single click. Users who are familiar with the capabilities of Excel can export data from Microsoft Dynamics AX 2012 R2 to Excel and continue their analysis.
It is possible to enrich the exported dataset by adding additional data fields from the underlying
dataset that was used to populate the form. This capability leverages the Microsoft Dynamics AX 2012 add-in for Microsoft Office, which exposes data to Excel, subject to the role-based security defined in Microsoft Dynamics AX 2012 R2.
By leveraging the capabilities of Excel 2013, a user can mash up Microsoft Dynamics AX data with external data sources from other systems, and also with publicly available data from the Microsoft
Azure Marketplace. After the required data is assembled, the user can explore the data and trends by using Power View, which is built into Excel 2013.
The Microsoft Dynamics AX add-in for Microsoft Word enables the creation of custom documents, such as collection letters and quotations, that use data from Microsoft Dynamics AX 2012 R2, thereby enabling the user to leverage the capabilities of Word.

9
BUSINESS INTELLIGENCE CAPABILITIES AND TOOLS IN MICROSOFT DYNAMICS AX 2012 R2
Core concept: BI is an integral part of the Microsoft Dynamics AX 2012 R2 experience
Microsoft Dynamics AX 2012 R2 leverages BI capabilities throughout the application to enhance the user experience. BI capabilities are tightly integrated into the Microsoft Dynamics AX experience in such a way that the user does not need to undergo specialist training.
Consider the following examples.
The Microsoft Dynamics AX home page is a BI-enabled dashboard –
Role Centers
The Microsoft Dynamics AX 2012 user interface provides an integrated “dashboard” for each user in the form of the home page. The home page is available for the user in either the Microsoft Dynamics
AX 2012 rich client for Windows or the Enterprise Portal for Microsoft Dynamics AX 2012 client for the web.
Microsoft Dynamics AX 2012 R2 provides 45 pre-built Role Centers that can be used as the template for the home page. Role Centers have been pre-built with content that is suitable for a broad range of personas in an organization. Instead of building dashboards for each user in an organization, customers can use and adapt the pre-built Role centers. The pre-built Role Centers are provided with the base license of Microsoft Dynamics AX 2012 R2, so that customers can jump start the BI
implementation along with the ERP implementation.
Although the pre-built Role Centers can be adopted as-is, think of Role Centers as a framework where the ERP experience can be tailored along with BI. Role Centers are built by using Microsoft Office SharePoint Server technologies, and they can be extended by adding custom content from partners and ISV solutions.

10 BUSINESS INTELLIGENCE CAPABILITIES AND TOOLS IN MICROSOFT DYNAMICS AX 2012 R2
Let’s briefly examine some of the unique ways in which insights are blended into the Microsoft Dynamics AX user experience.
Interactive charts and visualizations – Embedded SQL Power View
Interactive charting with SQL Power View enables a user to perform simple data explorations on his or her Role Center. Interactive charts may contain different views of data, and when the user clicks data – for example, a slice in a pie chart or a bar in a bar chart – the rest of the charts change in a fluid manner to reflect the impact of that slice or bar. This visual filtering and slicing capability is a powerful tool for exposing different views of data.

11
BUSINESS INTELLIGENCE CAPABILITIES AND TOOLS IN MICROSOFT DYNAMICS AX 2012 R2
Although the consumption experience is compelling and easy to use for casual users, a power user can open the full report in a separate window and make modifications. The edit mode exposes a rich and easy-to-understand view of the data contained in Microsoft Dynamics AX 2012 R2 cubes. As the user explores the data visually, summaries and slices are shown instantly in a fluid manner, thereby
creating an engaging experience.
After a report has been modified or a new report has been created, it can be exposed on a Role Center or shared with others in the organization, either by using Microsoft PowerPoint or by saving it to Microsoft SharePoint Server.
Building ad-hoc queries visually – Microsoft Dynamics AX cues
Cues are an intuitive means of creating and consuming ad-hoc queries. Cues are depicted as stacks of documents that are awaiting the user’s attention. A stack grows as the query results grow – a visual indicator of the relative size of the result set. Threshold conditions can be defined within cues, so that
the user can be alerted if predefined threshold conditions are reached.
Cues are linked to list pages in such a way that clicking a cue takes the user directly to a list page. The user can define new cues or modify existing cues from a Microsoft Dynamics AX 2012 list page. Cues can be defined for a user’s own personal use or shared within the organization.
The task of building and using cues has been built natively into the Microsoft Dynamics AX experience in such a way that users are not aware that they are building ad-hoc queries by using a query tool.

12 BUSINESS INTELLIGENCE CAPABILITIES AND TOOLS IN MICROSOFT DYNAMICS AX 2012 R2
Contextual information in the corner of the eye – Microsoft Dynamics
AX 2012 FactBoxes
Microsoft Dynamics AX 2012 enables the user to view the context associated with a detail record within the same user interface, without having to navigate to another page. This eliminates the need to have multiple screens side by side or to have multiple open windows.
As shown in the preceding figure, there are multiple FactBoxes within a specific form or on a specific
list page. The user can open or close the FactBoxes. FactBoxes show relevant information as the user selects various records.
The user can remove or resize FactBoxes, depending on personal preference or the need.

13
BUSINESS INTELLIGENCE CAPABILITIES AND TOOLS IN MICROSOFT DYNAMICS AX 2012 R2
Exploring trends behind list pages – Embedded SQL Power View
Although the contextual information presented on a list page is helpful for a user with a task at hand, sometimes it is necessary to understand hidden trends behind the data. On some list pages, when analysis of the data behind the page is required, the user can click the Analyze data option. This option opens a rich graphical environment backed by SQL Power View, where the user is presented with an extended set of tables and fields that are simplified for analysis.

14 BUSINESS INTELLIGENCE CAPABILITIES AND TOOLS IN MICROSOFT DYNAMICS AX 2012 R2
Analysis reports developed by the user can be saved to a folder in Enterprise Portal and exposed on a Role Center. The reports are rich and presentation-ready – they can be saved directly into a PowerPoint presentation or to a SharePoint site.
Although Microsoft Dynamics AX 2012 R2 ships with several list pages that contain the Analyze data
option out of the box, a partner or developer can add this option to any list page in the product. Because this option leverages the power of Microsoft Dynamics AX cubes, developers can extend this functionality to suit most scenarios.
BI tools in Microsoft Dynamics AX 2012
Now that we are familiar with the core concepts, let’s briefly review the capabilities of the BI tools that are available in Microsoft Dynamics AX 2012 R2.
Category Capability Tool or option
Query Predefined query
Operational queries
Lists of operational/financial data
Printed lists of operational/financial data
Cues
List pages
Auto-Report
Ad-hoc query
Analysis of operational/financial data
Excel add-in for Microsoft Dynamics AX 2012

15
BUSINESS INTELLIGENCE CAPABILITIES AND TOOLS IN MICROSOFT DYNAMICS AX 2012 R2
Category Capability Tool or option
Reporting Ad-hoc reporting
Statutory and financial reports
Charting and info-graphics
Production reports
Microsoft SQL Server Report Builder v3 or Excel
with Cubes
Management Reporter
Microsoft Dynamics AX 2012 R2 chart controls
Microsoft SQL Server Reporting Services reports (SSRS)
Analysis Key performance indicators
Scorecards
Ad-hoc summarization and exploration
Role Center/Business Overview Web Part
PerformancePoint Services in Microsoft SharePoint server
SQL Power View, a feature of SSRS
Data mash-up with Excel PowerPivot
Query tools
We have further grouped the query tools into two categories. Predefined queries are the most
frequently used queries. They are defined once and consumed frequently, often by a group of users. Ad-hoc queries, on the other hand, are mostly situational. They are purpose-built as and when they are needed.
Cues and list pages – A casual business user can define a query by using a list page with a few key strokes. These queries are known as cues, and they can be pinned to a Role Center for ease of access. Cues show results immediately as data changes. When selected, cues display detailed data on the same list page where they were defined. For more information, see the Manage cues topic
on TechNet.
Auto-Report – A casual business user can generate a report in one click from any form by using a wizard-driven approach. The data in the form is shown in a report format, and this report can be
sent as email or printed. Auto-Report is an easy way for a casual user to generate a printable report that uses the data shown in a form. For more information, see the Create a report by using the Microsoft Dynamics AX auto-report wizard topic on TechNet.
Excel add-in for Microsoft Dynamics AX 2012 – A business user can generate an ad-hoc
report in Excel that has secure access to data by using the Excel add-in for Microsoft Dynamics AX 2012.
The user can begin by exporting the data shown in a form or on a list page to Excel. Exported data can be enriched by adding additional fields. It is also possible to create a new report by starting in Excel.
In addition to ad-hoc reports, a business user can generate documents such as sales quotations
and collection letters by using the Word add-in for Microsoft Dynamics AX 2012. For more information, see the Using the Microsoft Dynamics AX Add-in for Excel topic on TechNet.
Reporting tools
Microsoft SQL Server Report Builder v3 with cubes – A business user can create robust, professional-quality reports with the data contained in Microsoft Dynamics AX 2012 cubes by using
Microsoft SQL Server Report Builder v3. Report Builder leverages the power of SQL Server Reporting Services server for report processing and distribution. In addition to providing the capability to author professional-looking reports, these reports enable parameters and conditional logic to be included in such a way that they can be consumed by a large population of users in the organization. For more information, see the Create a report by using SQL Server Report Builder to connect to a cube topic on TechNet.
Excel with cubes – A business user can explore Microsoft Dynamics AX cube data and also create ad-hoc reports by using built-in capabilities of Excel, such as pivot tables and Power View.

16 BUSINESS INTELLIGENCE CAPABILITIES AND TOOLS IN MICROSOFT DYNAMICS AX 2012 R2
Because cubes pre-aggregate data, this is a highly performant way to explore and report on aggregate data without impacting the load on the production database. For more information, see the Create a report by using the Excel data connection wizard to connect to a cube topic on TechNet.
Management Reporter – A business user can develop advanced financial statements that use Microsoft Dynamics AX data using Management Reporter for Microsoft Dynamics AX 2012. Management Reporter can consolidate data from Microsoft Dynamics AX 2012, Microsoft Dynamics AX 2009, and other Microsoft ERPs for financial reporting purposes. For more information, see the Management Reporter installation, migration, and configuration guides that can be downloaded from the Microsoft Download Center.
Microsoft Dynamics AX 2012 R2 charting controls – Charting controls are a capability that
was added in Microsoft Dynamics AX 2012 R2 to enable developers to build highly performant visualizations on Role Centers. If the primary need is to visualize data and summaries at a glance,
use of charting controls may eliminate the need to generate a report. These controls are developed by using the Enterprise Portal development framework – that is, by using concepts that are already familiar to developers. For more information, see the Chart Controls Overview topic on MSDN.
SQL Server Reporting Services (SSRS) reports – For production and operational reports that are crucial to the organization, a developer can use SSRS reports. Microsoft Dynamics AX 2012 and Microsoft Dynamics AX 2012 R2 add a layer of tooling and runtime components to integrate the SSRS server with metadata, business logic, and the runtime. To develop production reports, a developer uses Microsoft Visual Studio tools for Microsoft Dynamics AX. For more information, see the Developing Reports for Microsoft Dynamics AX in Visual Studio topic on TechNet.
Analysis tools
Business Overview Web Part– A business user can pin pre-built KPIs and indicators to Role Centers by using the Business Overview Web Part. Microsoft Dynamics AX 2012 R2 provides the
capability to add user-defined filters to existing KPI definitions in such a way that users can pin the same KPI to Role Centers by adding filters to reflect their area of interest. For more
information, see the Manage business overview information topic on TechNet.
Microsoft Office PerformancePoint Services (PPS) scorecards – A business user can define scorecards and strategy maps by using Microsoft Office PerformancePoint Services and tools which is a component of Microsoft SharePoint server. These dashboards can be exposed on Microsoft Dynamics AX 2012 Role Centers or in a corporate portal that is based on Microsoft SharePoint Server.
SQL Server Power View on list pages and Role Centers – Microsoft Dynamics AX 2012 R2
provides the capability to explore data on a list page by using SQL Server Power View. Reports created by using SQL Server Power View can be exposed on Role Centers or saved as PowerPoint slides. For more information, see the Create a report by using SQL Server Power View to connect to a cube topic on TechNet.
Data mash-up with Excel PowerPivot – Often, there is a need to integrate external sources of
data to make decisions. Excel PowerPivot is an add-in that is available with Excel 2010 and later
that enables mashing up different data sources for integrated reporting. The PowerPivot add-in leverages in-memory BI technology and data compression that enables Excel to scale to hundreds of millions of rows of data.
A power user can extract data from Microsoft Dynamics AX 2012 either by using cubes (if aggregate data is required) or via the Excel add-in. (if operational data is required). Microsoft Dynamics AX 2012 R2 provides another option for exposing data by using the OData protocol in such a way that operational data can be exposed to Excel users even if they don’t have the Excel
add-in installed on their desktop.
After the relevant data sources have been assembled in Excel, the data can be analyzed either with Excel pivot tables or, in case of Excel 2013, with built-in Power View.

17
BUSINESS INTELLIGENCE CAPABILITIES AND TOOLS IN MICROSOFT DYNAMICS AX 2012 R2
Choosing the right tool for the job
As you saw in the previous section, Microsoft Dynamics AX 2012 ships with a powerful set of tools and options for providing BI capabilities to users. Although these tools are powerful, not all users need these capabilities.
How do you choose the best tool for each role in an organization? Let’s examine how we can apply the role-based BI concept to limit the choice of tools for each role.
The following table indicates the BI patterns for each type of persona, along with a candidate list of BI tools that can be used.
BI pattern Operational personas (Role or task focus)
Tactical personas (Process or team focus)
Strategic personas (Corporate focus)
Detect exceptions. Track exceptional transactions.
Identify abnormal trends and outliers.
Identify goals that are not met and long-term trends that are not meeting
expectations.
Cues and list pages Cues and Business Overview Web Part (KPIs)
Business Overview Web Part (KPIs)
Identify clusters and trends.
Perform simple analysis (prioritizing and filtering).
Slice and dice aggregate data.
Use sample data and audits.
Drill down, and compare/benchmark with peers and previous results.
List pages, Auto-Report, charting controls, and SSRS reports
SQL Power View, Excel, and Auto-Report
SQL Power View, Excel, Business Overview Web Part, and PPS scorecards
Take action. Seamlessly access detailed data.
Communicate and share patterns, and take proactive/corrective action.
Reorganize, and launch programs and action plans.
List pages Excel, Report Builder, and Management Reporter
Microsoft Dynamics AX 2012 R2 BI in action
Let’s see the concepts we have learned in action within Microsoft Dynamics AX 2012 R2 by considering
typical scenarios within an organization.
Operational persona: Arnie drills into details
Arnie is the accounts receivable (AR) administrator of Contoso Ltd. He verifies shipments and creates invoices. He applies receipts to invoices and follows up on past-due accounts.
He is very busy during month ends – mostly talking on the phone with customers, following up on due payments. He wants to focus on large invoices or customers that are at risk of default.
Arnie wants latest data – in his own words, “It would be embarrassing to call customers for payments when they have already paid.”

18 BUSINESS INTELLIGENCE CAPABILITIES AND TOOLS IN MICROSOFT DYNAMICS AX 2012 R2
The accounts receivable administrator Role Center within Microsoft Dynamics AX 2012 is an example of BI in action for an operational role.
The AR administrator Role Center leverages cues to display operational indicators on past-due and open invoices. Cues provide the capability to navigate to list pages with a single click. List pages enable Arnie to take the necessary action for follow-up.
The AR administrator can define alerts (in addition to the alerts triggered by workflows). User attention is immediately drawn to alerts, and the user can act on alerts by selecting the action button
associated with each alert. Action buttons are context-sensitive and open the form that is relevant to the corresponding action.
The AR administrator Role Center leverages charting controls to display the Accounts receivable aging summary chart. The Top past due customers report is an SSRS production report that is pinned to the Role Center. Together, this chart and this report provide a summary of current status.
The AR administrator Role Center provides links to frequently used operational forms and report menu items. These links are customizable by the user for easy access.
Users can personalize their own Role Center by including any Microsoft SharePoint Server Web Part on the Role Center without the help from IT division. The administrator can customize the content of AR Role Center globally for all users by updating the “global” version of the AR Role Center.

19
BUSINESS INTELLIGENCE CAPABILITIES AND TOOLS IN MICROSOFT DYNAMICS AX 2012 R2
Tactical persona: Connie explores trends
Connie is the credit and collections manager of Contoso Ltd. Connie knows which customers are creditworthy and can have extended payment periods. She manages the collections process, often corresponding with past-due customers by email, telephone, and collection letters.
Connie is very knowledgeable about her industry and external sources of data, such as credit ratings. She is very familiar with tools, such as Excel, that she uses to analyze data, and to prepare lists and documents.
As Connie works with operational data such as invoices and payments, she is interested in knowing
trends and aggregates that summarize the past behavior.
Connie is an example of a tactical persona, and the following figure shows her Role Center in Microsoft Dynamics AX 2012 R2.
The credit and collections manager Role Center leverages cues to display operational indicators. However, Connie plays a crucial role in the business processes that govern the Average collections
period and the Days sales outstanding KPIs. Therefore, her Role Center contains both operational indicators (cues) and long-term, high-level indicators (KPIs).
Connie also uses several operational reports to monitor collections. These reports have been pinned to the Role Center for ease of access. At the lower right of her Role Center are links that Connie can use to open her most frequently used forms and reports. Connie can personalize these links by adding and
removing links herself.
Connie can personalize her own Role Center by including any SharePoint Web Part on her own, whereas the administrator can customize content globally for all users by updating the “global” version of the Role Center.
20 BUSINESS INTELLIGENCE CAPABILITIES AND TOOLS IN MICROSOFT DYNAMICS AX 2012 R2
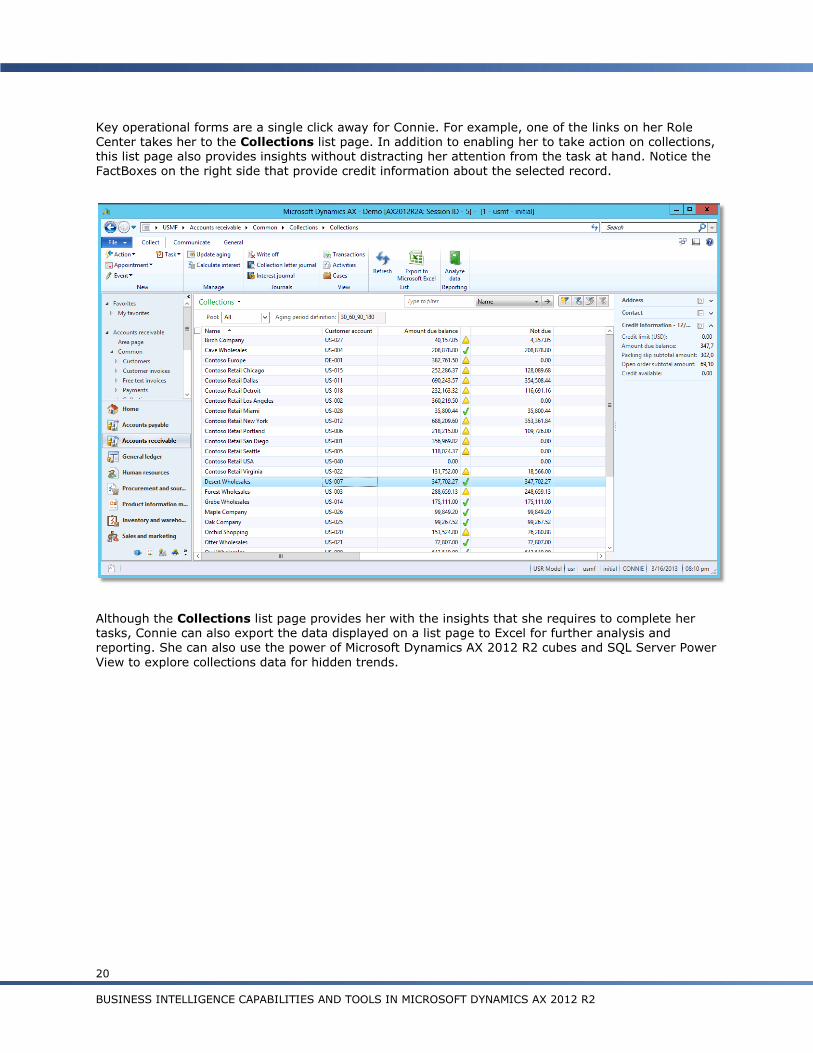
Key operational forms are a single click away for Connie. For example, one of the links on her Role Center takes her to the Collections list page. In addition to enabling her to take action on collections, this list page also provides insights without distracting her attention from the task at hand. Notice the FactBoxes on the right side that provide credit information about the selected record.
Although the Collections list page provides her with the insights that she requires to complete her tasks, Connie can also export the data displayed on a list page to Excel for further analysis and reporting. She can also use the power of Microsoft Dynamics AX 2012 R2 cubes and SQL Server Power
View to explore collections data for hidden trends.

21
BUSINESS INTELLIGENCE CAPABILITIES AND TOOLS IN MICROSOFT DYNAMICS AX 2012 R2
When she clicks the Analyze data option, SQL Server Power View starts in a separate window. Connie can then explore collections data with a rich collection of dimensions, including customer group and location information. SQL Server Power View provides the capability to explore data in a rich graphical environment, including Bing maps that show street-level data.
As the previous figure shows, Connie can create rich reports by using SQL Server Power View. The report can then be saved directly to a PowerPoint slide for a presentation or to a folder in Enterprise Portal for sharing with her team.
Strategic persona: Sara stays on top of corporate goals
As CFO of Contoso Ltd, Sara watches the financial health of the company. She gets regular updates from her team – weekly or bi-weekly at a minimum.
Her focus is on trends and exceptions – in her own words, “I am accountable to the president of the company for goals set by shareholders – I like to keep my focus on those all the time”.
As CFO, Sara has a team of people reporting to her with specific responsibilities. Her team has been given specific goals and responsibilities. She leaves out the details while ensuring that the goals and objectives are met.

22 BUSINESS INTELLIGENCE CAPABILITIES AND TOOLS IN MICROSOFT DYNAMICS AX 2012 R2
Sara is an example of a strategic persona, and the CFO Role Center in Microsoft Dynamics AX 2012 R2 showcases capabilities and tools that are suited for strategic Role Centers.
The CFO Role Center leverages KPIs to display high-level corporate indicators. As CFO, Sara focuses on financial indicators on such as Revenue, Expenses, Margin, and Net income.
Sara can include additional KPIs and trend indicators on her Role Center within the Business Overview Web Part. She can add any of the predefined KPIs and measures in Microsoft Dynamics AX 2012 R2 cubes to her dashboard without requiring IT assistance. She can also slice and filter the KPIs to
explore the source of adverse effects. If required, she can start a chat session or initiate a call with the owner of a KPI using Microsoft Lync.
Sara’s Role Center contains several SQL Server Power View reports that she monitors on a regular basis. She can interact with the categories on the report, and see the impact then and there. She can also open the report in full-screen mode and make any necessary changes that are required.
Conclusion
Microsoft Dynamics AX 2012 R2 includes a powerful BI solution, including 45 pre-built Role Centers. Together with SQL Server 2012 and other Microsoft BI technologies such as Excel 2013, Microsoft Dynamics AX 2012 R2 offers a comprehensive set of BI capabilities and tools that can be used to tailor
the pre-built content to the specific needs of an Organization.
Role-based BI is a concept that has been adopted in the design of the pre-built BI solution. The role-based BI concept can be used to provide BI to every user of Microsoft Dynamics AX 2012 R2.
If you are a solution architect or systems implementer who is devising a solution based on Microsoft Dynamics AX 2012 R2, you can leverage the pre-built BI solution as the basis for a BI solution catered to the specific needs of different personas in your organization.

23
BUSINESS INTELLIGENCE CAPABILITIES AND TOOLS IN MICROSOFT DYNAMICS AX 2012 R2
Power View is an ad-hoc data exploration and visualization experience in Microsoft SQL Server 2012 Reporting Services. To use
Power View reports with Microsoft Dynamics AX 2012 R2 data stored in Business Intelligence Semantic Model multidimensional
mode, you must have a generally available release of Microsoft SQL Server 2012 that supports Power View for multidimensional
models installed on your system. As of December 1, 2012, Microsoft SQL Server 2012 that supports Power View for
multidimensional models is not generally available. However, the Microsoft SQL Server 2012 that supports Power View for Multidimensional Models Community Technology Preview (CTP) release is available for download if you want to test the Power View
reporting capability. You should not test or use this CTP in a live operating environment unless Microsoft permits you to do so
under another agreement. Click here (http://www.microsoft.com/en-us/download/details.aspx?id=35822) for more information on
the CTP release. All features and dates are preliminary based on current expectations and are subject to change without notice.
The information herein is for informational purpose only and represents Microsoft’s current view as of the date of this release.
Because Microsoft must respond to changing market conditions, it should not be interpreted to be a commitment on the part of
Microsoft.
The information contained in this document represents the current view of Microsoft Corporation on the issues discussed as of the
date of publication. Because Microsoft must respond to changing market conditions, it should not be interpreted to be a
commitment on the part of Microsoft, and Microsoft cannot guarantee the accuracy of any information presented after the date of
publication.
This white paper is for informational purposes only. Microsoft makes no warranties, express or implied, in this document.
Complying with all applicable copyright laws is the responsibility of the user. Without limiting the rights under copyright, no part of
this document may be reproduced, stored in, or introduced into a retrieval system, or transmitted in any form or by any means
(electronic, mechanical, photocopying, recording, or otherwise), or for any purpose, without the express written permission of
Microsoft Corporation.
Microsoft may have patents, patent applications, trademarks, copyrights, or other intellectual property rights covering subject
matter in this document. Except as expressly provided in any written license agreement from Microsoft, the furnishing of this
document does not give you any license to these patents, trademarks, copyrights, or other intellectual property.
© 2013 Microsoft Corporation. All rights reserved.
The example companies, organizations, products, domain names, e-mail addresses, logos, people, places, and events depicted
herein are fictitious. No association with any real company, organization, product, domain name, e-mail address, logo, person,
place, or event is intended or should be inferred.
Microsoft, Microsoft Dynamics, Excel, Microsoft Office, PowerPoint, SharePoint, SQL Server, Visual Studio, Windows, and Word are
either registered trademarks or trademarks of Microsoft Corporation in the United States and/or other countries.
Microsoft Dynamics is a line of integrated, adaptable business management solutions that enables you and your people to make business decisions with greater confidence. Microsoft Dynamics works like and with familiar Microsoft software, automating and streamlining financial, customer relationship and supply chain processes in a way that helps you drive business success.
U.S. and Canada Toll Free 1-888-477-7989
Worldwide +1-701-281-6500
www.microsoft.com/dynamics