Embed Size (px)
Citation preview
www.SandV.com6 SOUND & VIBRATION/JUNE 2017
Automotive Speech Intelligibility Measurements
Speech communication from the front seat to the rear seat in a passenger vehicle can be difficult. This is particularly true in a vehicle with an acoustically absorptive interior. Speech trans-mission index (STI) measurements can quantify speech intel-ligibility, but they require specialized signal processing. The STI calculations can be simplified if it is assumed that reverberation and echoes play an insignificant role in an automobile. A simpli-fication of a STI measurement is described that uses a stationary reference speech signal from a talker mannequin in the driver’s seat to create a signal at rear passenger positions. On-road noise measurements are used for the noise level, and the calculated signal-to-noise ratio is used to calculate a simplified STI value that tracks closely to a full implementation of the STI method for sedans. In fact, this method is very similar to the techniques described in the articulation index (AI) and speech interference index (SII) standards. Those standards provide for the use of a talker mannequin, though that is rarely done. The use of all three measurement techniques is considered.
In an attempt to make vehicles quieter, it is tempting to add a great deal of acoustic absorption to the interior. However, this may cause speech intelligibility to become worse. For many years the ability to communicate easily in a vehicle has been considered a key attribute contributing to the perception of a comfortable acoustic environment and a high-quality vehicle. The ability to hear and understand speech is obviously important for all vehicle occupants but can be a particular issue when the driver communicates with passengers in the rear of the vehicle. Vehicles with acoustically absorptive interiors can be particularly problematic, and vehicles with third row seats provide even bigger challenges.
The three most common measurements to assess intelligibility are articulation index (AI), speech intelligibility index (SII), and speech transmission index (STI). Each of these measures provides a method for generating a signal at the talker’s position, measur-ing the response at the listener’s position, and judging the ability to understand speech based on the speech-to-noise level at the listener position.
However, this is not the way the articulation index is used in the automotive industry. The articulation index is generally not used to calculate an actual speech intelligibility rating but rather a “speech-weighted” noise level. The articulation index is calcu-lated by computing the speech-to-noise level, but an idealized speech spectrum in the articulation index standard is generally used in place of actually measuring the received speech level at the listener’s position. Though the speech intelligibility index is a more recent measure and contains updates and refinements to the articulation index standard, it has not been widely adopted. Both of these measures are considered in more detail below.
In recent years there has been quite a bit of interest in using the speech transmission index to gage speech intelligibility. This method cannot be implemented without simulating talker levels. STI accounts for the drop in level as the sound travels from the talker to the listener, the background noise level at the listener’s position, and reverberation and echoes in the environment. STI requires the measurement of a modulation transfer function be-tween the talker and listener, which accounts for the effects of reverberation, echoes, and background noise. While the AI and SII computations are relatively simple, the STI method is somewhat more complicated. It will be shown that the STI method yields
results that are similar to simpler AI/SII style measurements in a vehicle where echoes and reverberation are not significant.
All of these measures, AI, SII, and STI, assume a single receiving microphone. For automotive measurements, however, there can be large differences between measurements at the inboard and outboard ears of a rear passenger. In general, the intelligibility will be much higher for the inboard ear. This is because the received talker level is higher at the inboard ear, and the vehicle noise is somewhat lower at this location. Though there have been studies of binaural STI in larger architectural spaces, no work has been done to investigate binaural effects in automobiles. That will be considered.
Articulation Index and Speech Intelligibility IndexProcedures to quantify an articulation index have existed since
at least 1929,1 when the term was used to describe a juried method with talkers, listeners, and lists of words. This method was primar-ily intended for communication systems (telephone and radio), but its use for other applications was also considered.
An objective measurement technique was standardized in ANSI S3.5-1969, American National Standard Methods for the Calcula-tion of the Articulation Index.2 That standardized measurement technique is based on an assessment of the ratio of measured or “idealized” speech and the background noise level at the listener’s position. The 1969 standard has been superseded by ANSI S3.5-1997, American National Standard Methods for the Calculation of the Speech Intelligibility Index.3 The 1997 standard provides a method that is similar in principle to the earlier standard but contains enough differences that the authors choose a new name for the measured quantity. Some of the many differences include the use of different standardized talker levels, an expanded frequency range, and updated band importance factors. Note that the original 1969 standard had a single-talker level. The updated standard has four talker levels: normal, raised, loud, and shouting.
Both the 1969 and 1997 standards rely on a computation of the speech-to-background noise difference at the listener’s position. This ratio is computed in bands: octave, 1/3-octave, or bands that contribute equally to the intelligibility of speech. (The 1997 stan-dard also includes critical bands.) The speech-to-noise difference in these bands is multiplied by a band importance factor, and the results are summed over all the frequency bands. A speech-to-noise difference of 30 dB at all bands results in an articulation index of 1, while a speech-to-noise difference of 0 at each band resuls in an articulation index of 0. To keep the articulation index from exceeding 1 or becoming less than 0, speech-to-noise differences
Gordon L. Ebbitt and Todd M. Remtema, Toyota Technical Center, Ann Arbor, Michigan
Based on a paper presented at the 2015 SAE Noise and Vibration Conference and Exhibition, Grand Rapids, MI, June 2015.
Nomenclaturef Modulation frequency index (0.63 - 12.5 Hz)k Octave-band signal frequency index (125 Hz - 8k Hz)m(Ff,k) Modulation transfer functionmi Source modulation levelmo Receiver modulation levelMTI Modulation transfer indexSNRk,f Signal-to-noise ratio, dBTI Transmission indexT Reverberation time, secαη Octave weighting factor for STIβη Adjacent-band correction factor for STI
www.SandV.com SOUND & VIBRATION/JUNE 2017 7
values are, therefore, a “speech-intelligibility-weighted” noise level rather than an actual assessment of the speech-to-noise ratio at the listener’s position.
Speech Transmission IndexThe speech transmission index was developed by Steeneken
and Houtgast in the late 1960s to measure speech intelligibility in VHF radio systems and is now standardized by the International Electrotechnical Commission (IEC).5 Speech transmission index measurements are similar to AI and SII measurements in that they require the generation of a signal at the talker’s position and a measurement of that signal at the listener’s position. As with AI and SII, STI measurements use a test signal with a frequency spectrum equal to the long-term frequency spectrum of speech. STI measurements differ in that they use a modulated noise source. For a male speaker, octave-band noise from 125 Hz to 8000 Hz (seven bands) is used, and each octave band is modulated with a periodic signal in such a way that the intensity envelope is a modulated sinusoidal. For a female speaker, the 125-Hz octave-band is not used. The modulation frequencies range from 0.63 Hz to 12.5 Hz in 1/3-octave steps (14 frequencies). This is a total of 98 measure-ments for a male speaker.
The measured signal is influenced by its travel through the acous-tic environment (including a drop in level as well as reverberation and echoes) and by the background noise at the listener’s position. The STI technique is fundamentally different as compared to the AI or SII methods in that it assesses the temporal degradation of the speech signal as well as the speech-to-background noise ratio.
The change in the modulation is the modulation transfer func-tion, m(Fk,f), where:
and mo is the modulation of the signal at the listener’s position, mi is the modulation of the signal at the talker’s position, k indicates one of the seven octave bands (125 Hz to 8 kHz) and f designates one of the 14 modulation frequencies (0.63 Hz to 12.5 Hz). This is determined for all 98 cells as shown in Figure 2. Note that Equation 1 and all the following equations related to STI measurements can be found in the STI standard.5
Though STI could be determined by measuring all 98 modu-lated sounds, STI measurements are generally implemented by measuring the frequency response function from the talker to lis-tener position and calculating the impulse response function. The modulated sound at the speaker’s position can then be determined from the impulse response.
The modulation transfer function can be interpreted as an appar-ent signal-to-noise ratio (SNR). This ratio includes factors related not only to the difference between the speech and background noise levels, but also the effects of reverberation and echoes:
Note that the apparent SNR in the STI calculations is a little dif-ferent as compared to the signal-to-noise ratio as it is used in the AI and SII calculations. For the AI and SII calculations, it is just the difference between the speech level at the listener’s position and the background noise. For AI and SII calculations, a signal-to-noise ratio of 30 dB would indicate 100% intelligibility, and a signal-to-noise ratio of 0 dB would lead to 0% intelligibility. The apparent SNR in the STI calculations is similar to the signal-to-noise ratio in AI and SII calculations in that there is a linear relationship between the SNR and intelligibility. The apparent SNR in the STI calculation spans a range from –• to +• with a SNR of 0 dB corresponding to a modulation of 0.5. The apparent SNR is truncated outside the range of –15 to +15, which corresponds to intelligibility scores from 0 to 1. Differences in the way the SNR is calculated are accounted for by the transmission index, which is described below.
This apparent SNR is calculated for each of the 98 cells in Figure 2. The SNR is converted to a transmission index, TIk,f:
are capped at a maximum of 30 dB and a minimum of 0 dB. This range defines the limits from perfect speech intelligibility to no intelligibility at all.
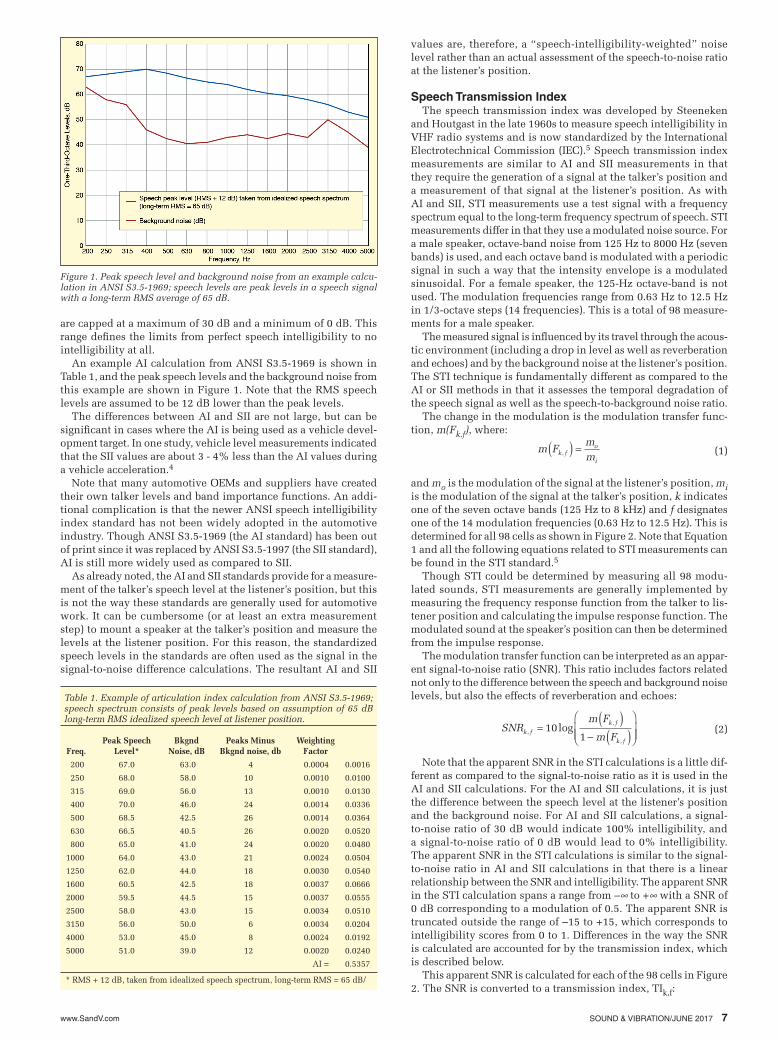
An example AI calculation from ANSI S3.5-1969 is shown in Table 1, and the peak speech levels and the background noise from this example are shown in Figure 1. Note that the RMS speech levels are assumed to be 12 dB lower than the peak levels.
The differences between AI and SII are not large, but can be significant in cases where the AI is being used as a vehicle devel-opment target. In one study, vehicle level measurements indicated that the SII values are about 3 - 4% less than the AI values during a vehicle acceleration.4
Note that many automotive OEMs and suppliers have created their own talker levels and band importance functions. An addi-tional complication is that the newer ANSI speech intelligibility index standard has not been widely adopted in the automotive industry. Though ANSI S3.5-1969 (the AI standard) has been out of print since it was replaced by ANSI S3.5-1997 (the SII standard), AI is still more widely used as compared to SII.
As already noted, the AI and SII standards provide for a measure-ment of the talker’s speech level at the listener’s position, but this is not the way these standards are generally used for automotive work. It can be cumbersome (or at least an extra measurement step) to mount a speaker at the talker’s position and measure the levels at the listener position. For this reason, the standardized speech levels in the standards are often used as the signal in the signal-to-noise difference calculations. The resultant AI and SII
(1)m Fmmk f
o
i,( ) =
(2)SNRm F
m Fk f
k f
k f
,
,
,
log=( )
- ( )Ê
ËÁÁ
ˆ
¯˜̃10
1
Figure 1. Peak speech level and background noise from an example calcu-lation in ANSI S3.5-1969; speech levels are peak levels in a speech signal with a long-term RMS average of 65 dB.
Table 1. Example of articulation index calculation from ANSI S3.5-1969; speech spectrum consists of peak levels based on assumption of 65 dB long-term RMS idealized speech level at listener position.
Peak Speech Bkgnd Peaks Minus Weighting Freq. Level* Noise, dB Bkgnd noise, db Factor
200 67.0 63.0 4 0.0004 0.0016
250 68.0 58.0 10 0.0010 0.0100
315 69.0 56.0 13 0.0010 0.0130
400 70.0 46.0 24 0.0014 0.0336
500 68.5 42.5 26 0.0014 0.0364
630 66.5 40.5 26 0.0020 0.0520
800 65.0 41.0 24 0.0020 0.0480
1000 64.0 43.0 21 0.0024 0.0504
1250 62.0 44.0 18 0.0030 0.0540
1600 60.5 42.5 18 0.0037 0.0666
2000 59.5 44.5 15 0.0037 0.0555
2500 58.0 43.0 15 0.0034 0.0510
3150 56.0 50.0 6 0.0034 0.0204
4000 53.0 45.0 8 0.0024 0.0192
5000 51.0 39.0 12 0.0020 0.0240
AI = 0.5357
* RMS + 12 dB, taken from idealized speech spectrum, long-term RMS = 65 dB/

www.SandV.com8 SOUND & VIBRATION/JUNE 2017
tion time was relatively constant as a function of frequency and was found to range from 40 to 80 msec.
Assuming that the background noise and echoes are negligible, the modulation transfer function is:
where F is the modulation frequency and T is the reverberation time in seconds.
Assuming the worst-case reverberation times from the earlier sedan study leads to the modulation reduction factors shown in Figure 4. Since a modulation reduction factor of 1 indicates no degradation in the modulation as the signal travels from source to receiver, there appears to be very little degradation for the higher signal frequencies (above 250 Hz) and at the lower modulation frequencies (below 2 Hz). The apparent signal-to-noise ratio is calculated from the modulation reduction factor by using Equation 2, and the results are shown in Figure 5.
Next the modulation transfer index is calculated using Equation 4. This index is nearly 1 for all values except those at the lowest
where the shift is 15 dB and range is 30 dB. The modulation transfer index, MTIk, is the average of all transmission indices for a given octave band frequency:
Finally, the overall STI value is obtained by multiplying the modulation transfer matrix indices by a frequency-dependent weighting factor:
where µn is the octave weighting factor and bn is a correction term related to the contribution from adjacent frequency bands.
Though this method is more complicated than AI or SII, it in-cludes the talker-to-listener path, the acoustic environment, and the background noise. It has, therefore, been proposed as a better way to measure speech intelligibility for automotive applications.6,7,8,9
For automotive applications, the STI can be measured while the vehicle is in motion (see Figure 3). This includes the total effects of the transmission of sound from the talker to listener. In some cases, however, this is not practical (for instance, if it is desired to have the speaker in the driver’s position). In those cases, it is possible to measure the STI while the vehicle is stationary and in a quiet environment. This measurement will include all the transmission effects except the background noise. The background noise can be measured separately and combined with the stationary STI measurement to calculate the overall STI for the moving vehicle.
Influence of Decay Time on Automotive STIThe reverberation time in vehicles is extremely short.10 An
earlier study compared methods of measuring the reverberation time in a mid-sized sedan. Depending on the analysis method, the reverberation time in the 125 Hz octave band was determined to be between 140 and 260 msec. The reverberation time at 250 Hz was found to range from 80 to 140 msec. Above 250 Hz, the reverbera-
Figure 2. Schematic of STI measurement process; octave-band sound from 125 Hz to 8 kHz is modulated at 14 frequencies, from 0.63 Hz to 12 Hz, and the modulation transfer function is measured from source to receiver positions.5
Figure 3. Measuring STI in vehicle consists of placing talker and listener mannequins in vehicle, generating modulated sound at talker position and measuring response at listener position. This includes effects of acoustic environment, drop in level from source to receiver positions, and back-ground noise.
Figure 4. Modulation reduction factor, m, as a function of modulation frequency for octave-band noise at 125 Hz, 250 Hz, and the octaves above 250 Hz.
Figure 5. Apparent signal-to-noise ratio for mid-size sedan, assuming reverberation only.
(3)MTlSNR
fk f=
+ÊËÁ
ˆ¯̃
1015
30log ,
(5)STl MTl MTl MTlf f f f f f f= µ == = -Â Â17
16
1b *
(4)MTl Tlk f k f= =Â114 1
14,
(6)M FF T
kk( ) = +1
213 8p
.
www.SandV.com SOUND & VIBRATION/JUNE 2017 9
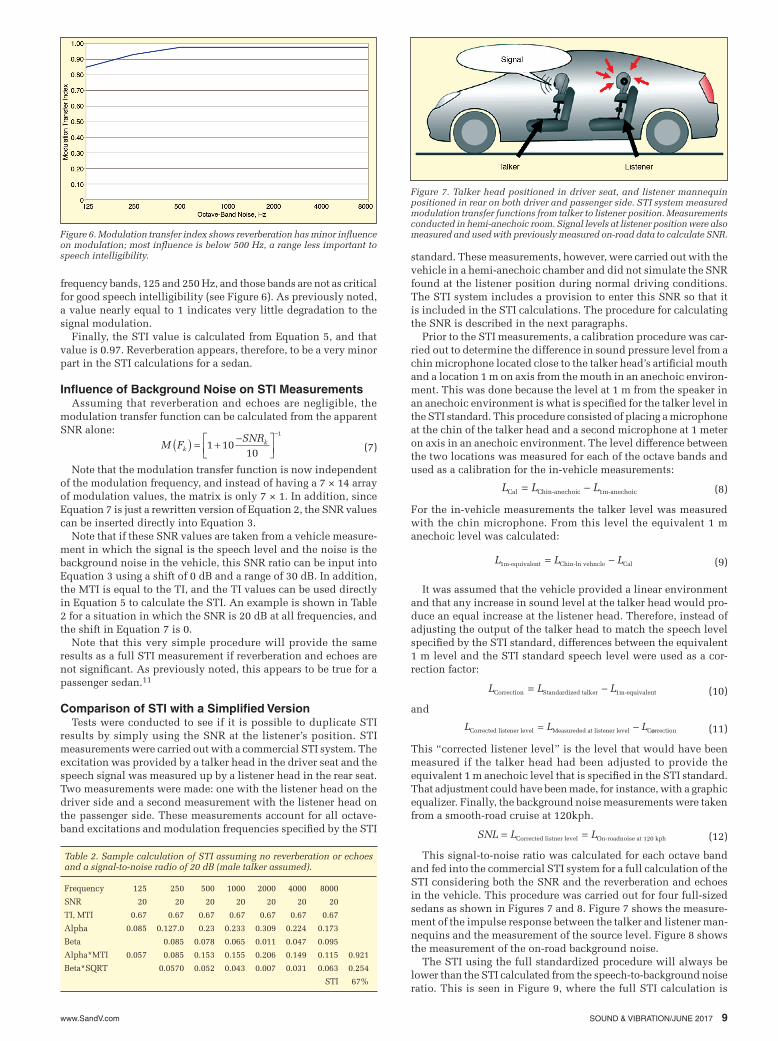
frequency bands, 125 and 250 Hz, and those bands are not as critical for good speech intelligibility (see Figure 6). As previously noted, a value nearly equal to 1 indicates very little degradation to the signal modulation.
Finally, the STI value is calculated from Equation 5, and that value is 0.97. Reverberation appears, therefore, to be a very minor part in the STI calculations for a sedan.
Influence of Background Noise on STI MeasurementsAssuming that reverberation and echoes are negligible, the
modulation transfer function can be calculated from the apparent SNR alone:
Note that the modulation transfer function is now independent of the modulation frequency, and instead of having a 7 × 14 array of modulation values, the matrix is only 7 × 1. In addition, since Equation 7 is just a rewritten version of Equation 2, the SNR values can be inserted directly into Equation 3.
Note that if these SNR values are taken from a vehicle measure-ment in which the signal is the speech level and the noise is the background noise in the vehicle, this SNR ratio can be input into Equation 3 using a shift of 0 dB and a range of 30 dB. In addition, the MTI is equal to the TI, and the TI values can be used directly in Equation 5 to calculate the STI. An example is shown in Table 2 for a situation in which the SNR is 20 dB at all frequencies, and the shift in Equation 7 is 0.
Note that this very simple procedure will provide the same results as a full STI measurement if reverberation and echoes are not significant. As previously noted, this appears to be true for a passenger sedan.11
Comparison of STI with a Simplified VersionTests were conducted to see if it is possible to duplicate STI
results by simply using the SNR at the listener’s position. STI measurements were carried out with a commercial STI system. The excitation was provided by a talker head in the driver seat and the speech signal was measured up by a listener head in the rear seat. Two measurements were made: one with the listener head on the driver side and a second measurement with the listener head on the passenger side. These measurements account for all octave-band excitations and modulation frequencies specified by the STI
standard. These measurements, however, were carried out with the vehicle in a hemi-anechoic chamber and did not simulate the SNR found at the listener position during normal driving conditions. The STI system includes a provision to enter this SNR so that it is included in the STI calculations. The procedure for calculating the SNR is described in the next paragraphs.
Prior to the STI measurements, a calibration procedure was car-ried out to determine the difference in sound pressure level from a chin microphone located close to the talker head’s artificial mouth and a location 1 m on axis from the mouth in an anechoic environ-ment. This was done because the level at 1 m from the speaker in an anechoic environment is what is specified for the talker level in the STI standard. This procedure consisted of placing a microphone at the chin of the talker head and a second microphone at 1 meter on axis in an anechoic environment. The level difference between the two locations was measured for each of the octave bands and used as a calibration for the in-vehicle measurements:
For the in-vehicle measurements the talker level was measured with the chin microphone. From this level the equivalent 1 m anechoic level was calculated:
It was assumed that the vehicle provided a linear environment and that any increase in sound level at the talker head would pro-duce an equal increase at the listener head. Therefore, instead of adjusting the output of the talker head to match the speech level specified by the STI standard, differences between the equivalent 1 m level and the STI standard speech level were used as a cor-rection factor:
and
This “corrected listener level” is the level that would have been measured if the talker head had been adjusted to provide the equivalent 1 m anechoic level that is specified in the STI standard. That adjustment could have been made, for instance, with a graphic equalizer. Finally, the background noise measurements were taken from a smooth-road cruise at 120kph.
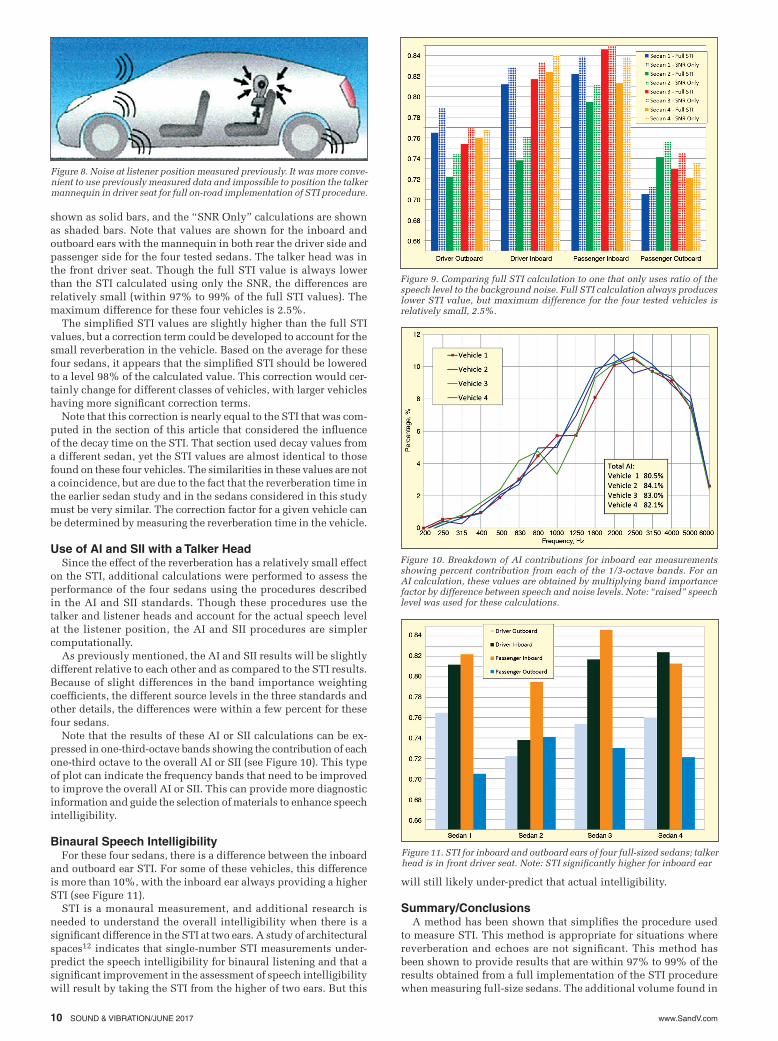
This signal-to-noise ratio was calculated for each octave band and fed into the commercial STI system for a full calculation of the STI considering both the SNR and the reverberation and echoes in the vehicle. This procedure was carried out for four full-sized sedans as shown in Figures 7 and 8. Figure 7 shows the measure-ment of the impulse response between the talker and listener man-nequins and the measurement of the source level. Figure 8 shows the measurement of the on-road background noise.
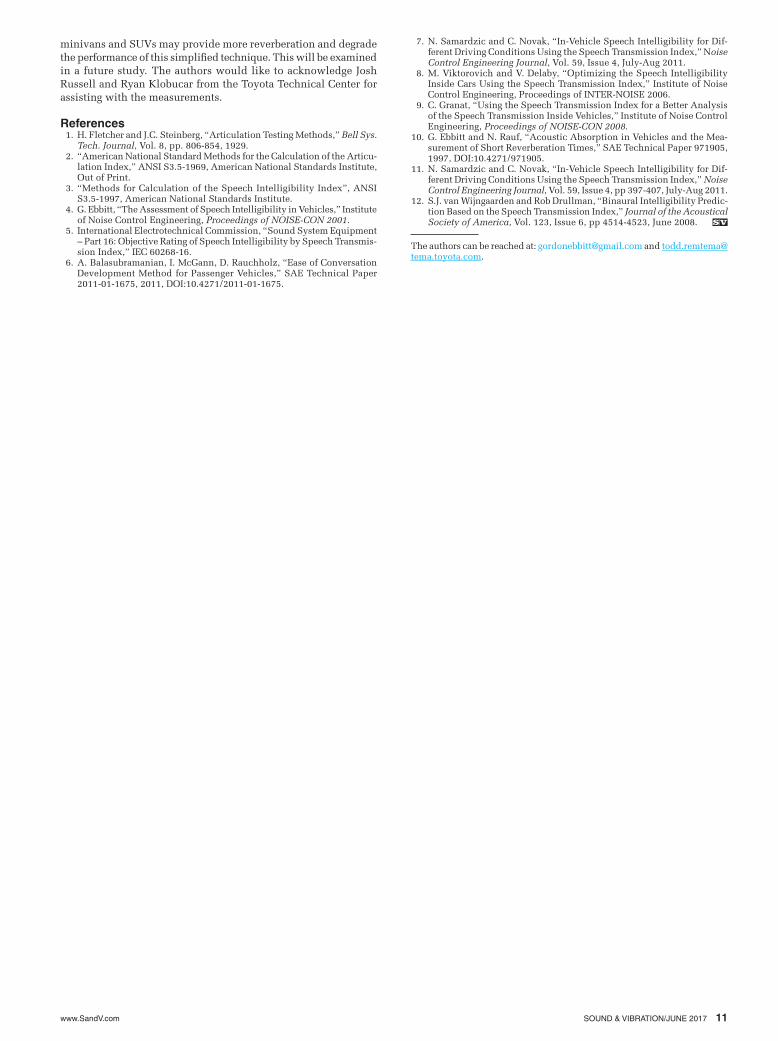
The STI using the full standardized procedure will always be lower than the STI calculated from the speech-to-background noise ratio. This is seen in Figure 9, where the full STI calculation is
Figure 6. Modulation transfer index shows reverberation has minor influence on modulation; most influence is below 500 Hz, a range less important to speech intelligibility.
Table 2. Sample calculation of STI assuming no reverberation or echoes and a signal-to-noise radio of 20 dB (male talker assumed).
Frequency 125 250 500 1000 2000 4000 8000
SNR 20 20 20 20 20 20 20
TI, MTI 0.67 0.67 0.67 0.67 0.67 0.67 0.67
Alpha 0.085 0.127.0 0.23 0.233 0.309 0.224 0.173
Beta 0.085 0.078 0.065 0.011 0.047 0.095
Alpha*MTI 0.057 0.085 0.153 0.155 0.206 0.149 0.115 0.921
Beta*SQRT 0.0570 0.052 0.043 0.007 0.031 0.063 0.254
STI 67%
Figure 7. Talker head positioned in driver seat, and listener mannequin positioned in rear on both driver and passenger side. STI system measured modulation transfer functions from talker to listener position. Measurements conducted in hemi-anechoic room. Signal levels at listener position were also measured and used with previously measured on-road data to calculate SNR.
(7)M FSNR
kk( ) = + -È
Î͢˚̇
-
1 1010
1
(8)L L LCal Chin-anechoic 1m-anechoic= -
(9)
(10)
(11)L L LCorrected listener level Measureded at listener level C= - oorrection
(12)SNL L L= =Corrected listner level On-roadnoise at 120 kph
L L L1m-equivalent Chin-ln vehncle Cal= -
L L LCorrection Standardized talker 1m-equivalent= -
www.SandV.com10 SOUND & VIBRATION/JUNE 2017
Figure 9. Comparing full STI calculation to one that only uses ratio of the speech level to the background noise. Full STI calculation always produces lower STI value, but maximum difference for the four tested vehicles is relatively small, 2.5%.
Figure 10. Breakdown of AI contributions for inboard ear measurements showing percent contribution from each of the 1/3-octave bands. For an AI calculation, these values are obtained by multiplying band importance factor by difference between speech and noise levels. Note: “raised” speech level was used for these calculations.
Figure 11. STI for inboard and outboard ears of four full-sized sedans; talker head is in front driver seat. Note: STI significantly higher for inboard ear
Figure 8. Noise at listener position measured previously. It was more conve-nient to use previously measured data and impossible to position the talker mannequin in driver seat for full on-road implementation of STI procedure.
shown as solid bars, and the “SNR Only” calculations are shown as shaded bars. Note that values are shown for the inboard and outboard ears with the mannequin in both rear the driver side and passenger side for the four tested sedans. The talker head was in the front driver seat. Though the full STI value is always lower than the STI calculated using only the SNR, the differences are relatively small (within 97% to 99% of the full STI values). The maximum difference for these four vehicles is 2.5%.
The simplified STI values are slightly higher than the full STI values, but a correction term could be developed to account for the small reverberation in the vehicle. Based on the average for these four sedans, it appears that the simplified STI should be lowered to a level 98% of the calculated value. This correction would cer-tainly change for different classes of vehicles, with larger vehicles having more significant correction terms.
Note that this correction is nearly equal to the STI that was com-puted in the section of this article that considered the influence of the decay time on the STI. That section used decay values from a different sedan, yet the STI values are almost identical to those found on these four vehicles. The similarities in these values are not a coincidence, but are due to the fact that the reverberation time in the earlier sedan study and in the sedans considered in this study must be very similar. The correction factor for a given vehicle can be determined by measuring the reverberation time in the vehicle.
Use of AI and SII with a Talker HeadSince the effect of the reverberation has a relatively small effect
on the STI, additional calculations were performed to assess the performance of the four sedans using the procedures described in the AI and SII standards. Though these procedures use the talker and listener heads and account for the actual speech level at the listener position, the AI and SII procedures are simpler computationally.
As previously mentioned, the AI and SII results will be slightly different relative to each other and as compared to the STI results. Because of slight differences in the band importance weighting coefficients, the different source levels in the three standards and other details, the differences were within a few percent for these four sedans.
Note that the results of these AI or SII calculations can be ex-pressed in one-third-octave bands showing the contribution of each one-third octave to the overall AI or SII (see Figure 10). This type of plot can indicate the frequency bands that need to be improved to improve the overall AI or SII. This can provide more diagnostic information and guide the selection of materials to enhance speech intelligibility.
Binaural Speech IntelligibilityFor these four sedans, there is a difference between the inboard
and outboard ear STI. For some of these vehicles, this difference is more than 10%, with the inboard ear always providing a higher STI (see Figure 11).
STI is a monaural measurement, and additional research is needed to understand the overall intelligibility when there is a significant difference in the STI at two ears. A study of architectural spaces12 indicates that single-number STI measurements under-predict the speech intelligibility for binaural listening and that a significant improvement in the assessment of speech intelligibility will result by taking the STI from the higher of two ears. But this
will still likely under-predict that actual intelligibility.
Summary/ConclusionsA method has been shown that simplifies the procedure used
to measure STI. This method is appropriate for situations where reverberation and echoes are not significant. This method has been shown to provide results that are within 97% to 99% of the results obtained from a full implementation of the STI procedure when measuring full-size sedans. The additional volume found in
www.SandV.com SOUND & VIBRATION/JUNE 2017 11
minivans and SUVs may provide more reverberation and degrade the performance of this simplified technique. This will be examined in a future study. The authors would like to acknowledge Josh Russell and Ryan Klobucar from the Toyota Technical Center for assisting with the measurements.
References 1. H. Fletcher and J.C. Steinberg, “Articulation Testing Methods,” Bell Sys.
Tech. Journal, Vol. 8, pp. 806-854, 1929. 2. “American National Standard Methods for the Calculation of the Articu-
lation Index,” ANSI S3.5-1969, American National Standards Institute, Out of Print.
3. “Methods for Calculation of the Speech Intelligibility Index”, ANSI S3.5-1997, American National Standards Institute.
4. G. Ebbitt, “The Assessment of Speech Intelligibility in Vehicles,” Institute of Noise Control Engineering, Proceedings of NOISE-CON 2001.
5. International Electrotechnical Commission, “Sound System Equipment – Part 16: Objective Rating of Speech Intelligibility by Speech Transmis-sion Index,” IEC 60268-16.
6. A. Balasubramanian, I. McGann, D. Rauchholz, “Ease of Conversation Development Method for Passenger Vehicles,” SAE Technical Paper 2011-01-1675, 2011, DOI:10.4271/2011-01-1675.
The authors can be reached at: [email protected] and [email protected].
7. N. Samardzic and C. Novak, “In-Vehicle Speech Intelligibility for Dif-ferent Driving Conditions Using the Speech Transmission Index,” Noise Control Engineering Journal, Vol. 59, Issue 4, July-Aug 2011.
8. M. Viktorovich and V. Delaby, “Optimizing the Speech Intelligibility Inside Cars Using the Speech Transmission Index,” Institute of Noise Control Engineering, Proceedings of INTER-NOISE 2006.
9. C. Granat, “Using the Speech Transmission Index for a Better Analysis of the Speech Transmission Inside Vehicles,” Institute of Noise Control Engineering, Proceedings of NOISE-CON 2008.
10. G. Ebbitt and N. Rauf, “Acoustic Absorption in Vehicles and the Mea-surement of Short Reverberation Times,” SAE Technical Paper 971905, 1997, DOI:10.4271/971905.
11. N. Samardzic and C. Novak, “In-Vehicle Speech Intelligibility for Dif-ferent Driving Conditions Using the Speech Transmission Index,” Noise Control Engineering Journal, Vol. 59, Issue 4, pp 397-407, July-Aug 2011.
12. S.J. van Wijngaarden and Rob Drullman, “Binaural Intelligibility Predic-tion Based on the Speech Transmission Index,” Journal of the Acoustical Society of America, Vol. 123, Issue 6, pp 4514-4523, June 2008.