Embed Size (px)
Citation preview
Abstract Automatic linesman system (ALS) in badminton games may help improving the efficiency of judgment. In this project, one retrospective approach using motion detection, and one non-retrospective approach with the SVM are implemented and tested with a broadcast video of a badminton game. According to our results, the retrospective method performs better with a higher accuracy of ~85%. The advantages and disadvantages of these two methods are also compared in this report.
1. Introduction Badminton is a popular sport all around the world.
Similar to other ball games, line judgment remain a crucial part for badminton games. Automatic linesman system (ALS) based on computer vision can provide independent line judgment and assist referee to make correct decision, hence an ALS in badminton games is highly needed. However, up to now, there is no implementation of ALSin any badminton games. The basic reason is that building such a system based on computer vision is very hard and therefore remains as an active research area.
The first task in this project is to identify the court boundaries. After this, in order to determine whether the shuttlecock is out of bound during badminton game, the localization of the shuttlecock is the second task.
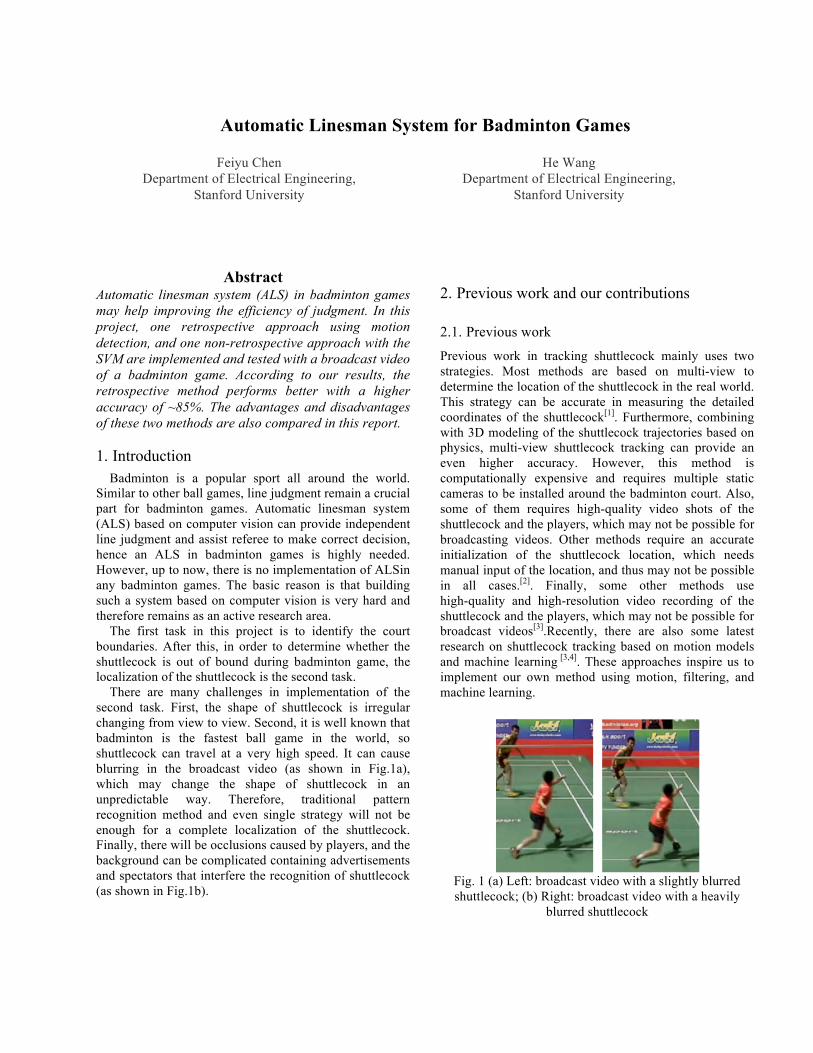
There are many challenges in implementation of the second task. First, the shape of shuttlecock is irregular changing from view to view. Second, it is well known that badminton is the fastest ball game in the world, so shuttlecock can travel at a very high speed. It can cause blurring in the broadcast video (as shown in Fig.1a), which may change the shape of shuttlecock in an unpredictable way. Therefore, traditional pattern recognition method and even single strategy will not be enough for a complete localization of the shuttlecock. Finally, there will be occlusions caused by players, and the background can be complicated containing advertisements and spectators that interfere the recognition of shuttlecock (as shown in Fig.1b).
2. Previous work and our contributions
2.1. Previous work
Previous work in tracking shuttlecock mainly uses two strategies. Most methods are based on multi-view to determine the location of the shuttlecock in the real world. This strategy can be accurate in measuring the detailed coordinates of the shuttlecock[1]. Furthermore, combining with 3D modeling of the shuttlecock trajectories based on physics, multi-view shuttlecock tracking can provide an even higher accuracy. However, this method is computationally expensive and requires multiple static cameras to be installed around the badminton court. Also, some of them requires high-quality video shots of the shuttlecock and the players, which may not be possible for broadcasting videos. Other methods require an accurate initialization of the shuttlecock location, which needs manual input of the location, and thus may not be possible in all cases.[2]. Finally, some other methods use high-quality and high-resolution video recording of the shuttlecock and the players, which may not be possible for broadcast videos[3].Recently, there are also some latest research on shuttlecock tracking based on motion models and machine learning [3,4]. These approaches inspire us to implement our own method using motion, filtering, and machine learning.
Fig. 1 (a) Left: broadcast video with a slightly blurred shuttlecock; (b) Right: broadcast video with a heavily
blurred shuttlecock
Automatic Linesman System for Badminton Games
Feiyu Chen
Department of Electrical Engineering, Stanford University
He Wang Department of Electrical Engineering,
Stanford University
2.2. Our contributions
In this project, we use a combination of different information in a broadcast badminton game to predict the location and trajectory of the shuttlecock. With a strong interest in finding out the best method, we proposed and implemented one retrospective approach based on motion-detection and filtering, and another non-retrospective approach based on training with a support vector machine (SVM).
We in particular emphasized on finding the touching-ground period of the shuttlecock, and therefore proposed a multi-scale tracking procedure with first whole-court and finally zoomed-in views. In order to improve the accuracy of our tracking, we used a confidence-based approach to determine the probability of correctly identification of the shuttlecock.
3. Technical description
3.1. Summary of our approaches In our approach, we use multiple features to determine
the trajectory of the shuttlecock, including the location of players, the region of the badminton court, the direction and speed of motion, and the intensity of first and second difference maps. Spatial and temporal filtering based on convolution are used to reduce noise in the difference maps.
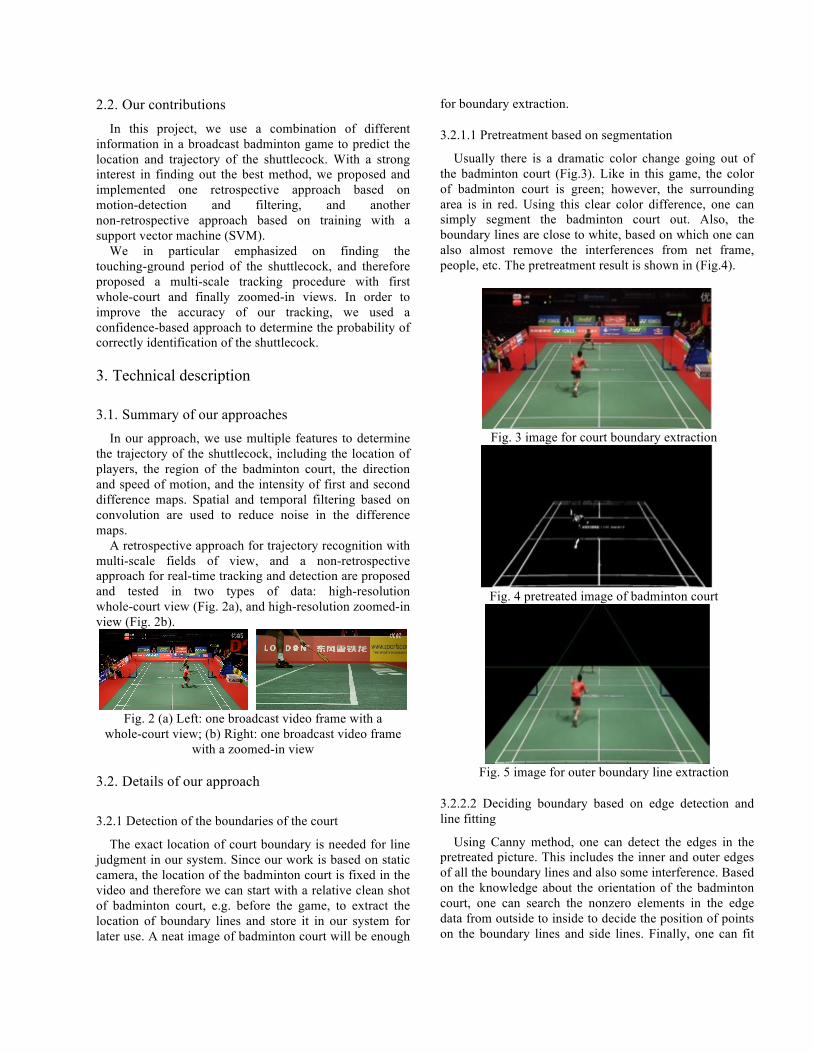
A retrospective approach for trajectory recognition with multi-scale fields of view, and a non-retrospective approach for real-time tracking and detection are proposed and tested in two types of data: high-resolution whole-court view (Fig. 2a), and high-resolution zoomed-in view (Fig. 2b).
Fig. 2 (a) Left: one broadcast video frame with a
whole-court view; (b) Right: one broadcast video frame with a zoomed-in view
3.2. Details of our approach
3.2.1 Detection of the boundaries of the court
The exact location of court boundary is needed for line judgment in our system. Since our work is based on static camera, the location of the badminton court is fixed in the video and therefore we can start with a relative clean shot of badminton court, e.g. before the game, to extract the location of boundary lines and store it in our system for later use. A neat image of badminton court will be enough
for boundary extraction.
3.2.1.1 Pretreatment based on segmentation
Usually there is a dramatic color change going out of the badminton court (Fig.3). Like in this game, the color of badminton court is green; however, the surrounding area is in red. Using this clear color difference, one can simply segment the badminton court out. Also, the boundary lines are close to white, based on which one can also almost remove the interferences from net frame, people, etc. The pretreatment result is shown in (Fig.4).
Fig. 3 image for court boundary extraction
Fig. 4 pretreated image of badminton court
Fig. 5 image for outer boundary line extraction
3.2.2.2 Deciding boundary based on edge detection and line fitting
Using Canny method, one can detect the edges in the pretreated picture. This includes the inner and outer edges of all the boundary lines and also some interference. Based on the knowledge about the orientation of the badminton court, one can search the nonzero elements in the edge data from outside to inside to decide the position of points on the boundary lines and side lines. Finally, one can fit
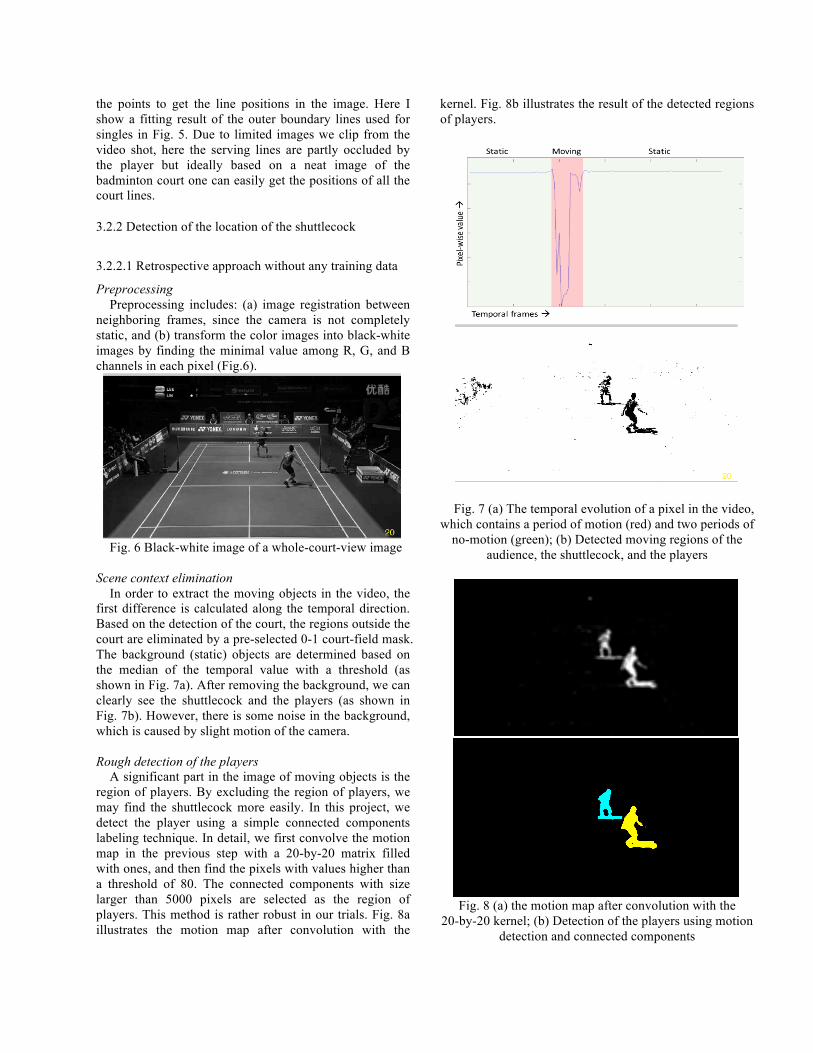
the points to get the line positions in the image. Here I show a fitting result of the outer boundary lines used for singles in Fig. 5. Due to limited images we clip from the video shot, here the serving lines are partly occluded by the player but ideally based on a neat image of the badminton court one can easily get the positions of all the court lines.
3.2.2 Detection of the location of the shuttlecock
3.2.2.1 Retrospective approach without any training data
Preprocessing Preprocessing includes: (a) image registration between
neighboring frames, since the camera is not completely static, and (b) transform the color images into black-white images by finding the minimal value among R, G, and B channels in each pixel (Fig.6).
Fig. 6 Black-white image of a whole-court-view image
Scene context elimination In order to extract the moving objects in the video, the
first difference is calculated along the temporal direction. Based on the detection of the court, the regions outside the court are eliminated by a pre-selected 0-1 court-field mask. The background (static) objects are determined based on the median of the temporal value with a threshold (as shown in Fig. 7a). After removing the background, we can clearly see the shuttlecock and the players (as shown in Fig. 7b). However, there is some noise in the background, which is caused by slight motion of the camera.
Rough detection of the players
A significant part in the image of moving objects is the region of players. By excluding the region of players, we may find the shuttlecock more easily. In this project, we detect the player using a simple connected components labeling technique. In detail, we first convolve the motion map in the previous step with a 20-by-20 matrix filled with ones, and then find the pixels with values higher than a threshold of 80. The connected components with size larger than 5000 pixels are selected as the region of players. This method is rather robust in our trials. Fig. 8a illustrates the motion map after convolution with the
kernel. Fig. 8b illustrates the result of the detected regions of players.
Fig. 7 (a) The temporal evolution of a pixel in the video, which contains a period of motion (red) and two periods of
no-motion (green); (b) Detected moving regions of the audience, the shuttlecock, and the players
Fig. 8 (a) the motion map after convolution with the
20-by-20 kernel; (b) Detection of the players using motion detection and connected components
Motion detection based on temporal variation By choosing a sliding window of ~50 frames in the
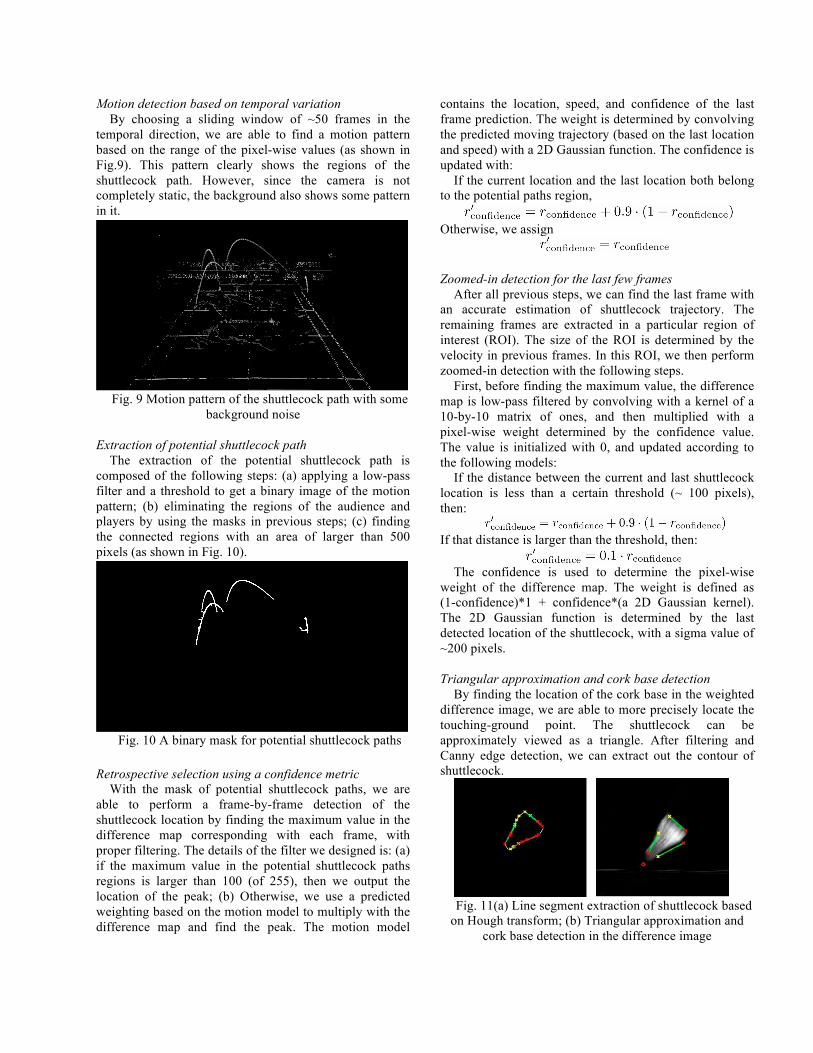
temporal direction, we are able to find a motion pattern based on the range of the pixel-wise values (as shown in Fig.9). This pattern clearly shows the regions of the shuttlecock path. However, since the camera is not completely static, the background also shows some pattern in it.
Fig. 9 Motion pattern of the shuttlecock path with some
background noise Extraction of potential shuttlecock path
The extraction of the potential shuttlecock path is composed of the following steps: (a) applying a low-pass filter and a threshold to get a binary image of the motion pattern; (b) eliminating the regions of the audience and players by using the masks in previous steps; (c) finding the connected regions with an area of larger than 500 pixels (as shown in Fig. 10).
Fig. 10 A binary mask for potential shuttlecock paths
Retrospective selection using a confidence metric
With the mask of potential shuttlecock paths, we are able to perform a frame-by-frame detection of the shuttlecock location by finding the maximum value in the difference map corresponding with each frame, with proper filtering. The details of the filter we designed is: (a) if the maximum value in the potential shuttlecock paths regions is larger than 100 (of 255), then we output the location of the peak; (b) Otherwise, we use a predicted weighting based on the motion model to multiply with the difference map and find the peak. The motion model
contains the location, speed, and confidence of the last frame prediction. The weight is determined by convolving the predicted moving trajectory (based on the last location and speed) with a 2D Gaussian function. The confidence is updated with:
If the current location and the last location both belong to the potential paths region,
Otherwise, we assign
Zoomed-in detection for the last few frames
After all previous steps, we can find the last frame with an accurate estimation of shuttlecock trajectory. The remaining frames are extracted in a particular region of interest (ROI). The size of the ROI is determined by the velocity in previous frames. In this ROI, we then perform zoomed-in detection with the following steps.
First, before finding the maximum value, the difference map is low-pass filtered by convolving with a kernel of a 10-by-10 matrix of ones, and then multiplied with a pixel-wise weight determined by the confidence value. The value is initialized with 0, and updated according to the following models:
If the distance between the current and last shuttlecock location is less than a certain threshold (~ 100 pixels), then:
If that distance is larger than the threshold, then:
The confidence is used to determine the pixel-wise
weight of the difference map. The weight is defined as (1-confidence)*1 + confidence*(a 2D Gaussian kernel). The 2D Gaussian function is determined by the last detected location of the shuttlecock, with a sigma value of ~200 pixels. Triangular approximation and cork base detection
By finding the location of the cork base in the weighted difference image, we are able to more precisely locate the touching-ground point. The shuttlecock can be approximately viewed as a triangle. After filtering and Canny edge detection, we can extract out the contour of shuttlecock.
Fig. 11(a) Line segment extraction of shuttlecock based
on Hough transform; (b) Triangular approximation and cork base detection in the difference image
Using Hough transform, we can get a series of line segment on the contour of shuttlecock as Fig. 11a. By picking up the longest three line segments with large angle difference, we can get the three approximate sides of the shuttlecock and further determine the position of the cork base as Fig.11b shows.
3.2.2.2 Non-retrospective approach with SVM
Preprocessing and scene context elimination We used the same steps as the retrospective one in this
part to get a rough region of the trajectory of the shuttlecock and the players. Feature extraction
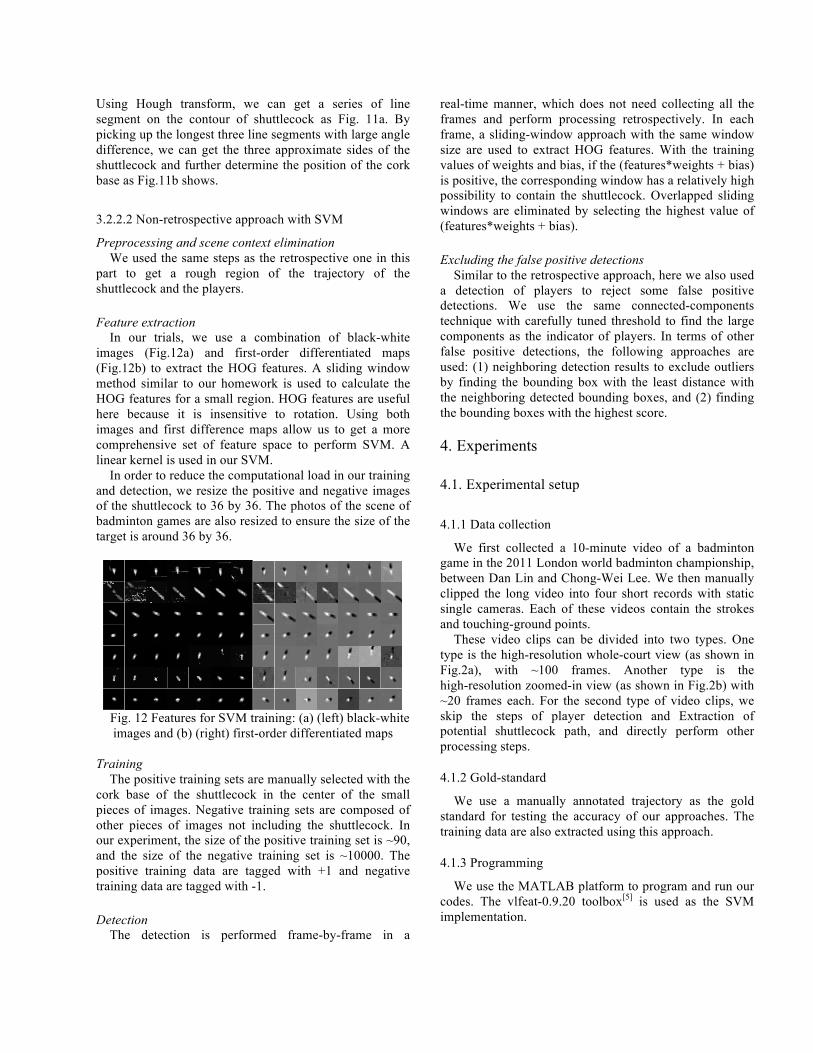
In our trials, we use a combination of black-white images (Fig.12a) and first-order differentiated maps (Fig.12b) to extract the HOG features. A sliding window method similar to our homework is used to calculate the HOG features for a small region. HOG features are useful here because it is insensitive to rotation. Using both images and first difference maps allow us to get a more comprehensive set of feature space to perform SVM. A linear kernel is used in our SVM.
In order to reduce the computational load in our training and detection, we resize the positive and negative images of the shuttlecock to 36 by 36. The photos of the scene of badminton games are also resized to ensure the size of the target is around 36 by 36.
Fig. 12 Features for SVM training: (a) (left) black-white images and (b) (right) first-order differentiated maps
Training
The positive training sets are manually selected with the cork base of the shuttlecock in the center of the small pieces of images. Negative training sets are composed of other pieces of images not including the shuttlecock. In our experiment, the size of the positive training set is ~90, and the size of the negative training set is ~10000. The positive training data are tagged with +1 and negative training data are tagged with -1. Detection
The detection is performed frame-by-frame in a
real-time manner, which does not need collecting all the frames and perform processing retrospectively. In each frame, a sliding-window approach with the same window size are used to extract HOG features. With the training values of weights and bias, if the (features*weights + bias) is positive, the corresponding window has a relatively high possibility to contain the shuttlecock. Overlapped sliding windows are eliminated by selecting the highest value of (features*weights + bias). Excluding the false positive detections
Similar to the retrospective approach, here we also used a detection of players to reject some false positive detections. We use the same connected-components technique with carefully tuned threshold to find the large components as the indicator of players. In terms of other false positive detections, the following approaches are used: (1) neighboring detection results to exclude outliers by finding the bounding box with the least distance with the neighboring detected bounding boxes, and (2) finding the bounding boxes with the highest score.
4. Experiments
4.1. Experimental setup
4.1.1 Data collection
We first collected a 10-minute video of a badminton game in the 2011 London world badminton championship, between Dan Lin and Chong-Wei Lee. We then manually clipped the long video into four short records with static single cameras. Each of these videos contain the strokes and touching-ground points.
These video clips can be divided into two types. One type is the high-resolution whole-court view (as shown in Fig.2a), with ~100 frames. Another type is the high-resolution zoomed-in view (as shown in Fig.2b) with ~20 frames each. For the second type of video clips, we skip the steps of player detection and Extraction of potential shuttlecock path, and directly perform other processing steps.
4.1.2 Gold-standard
We use a manually annotated trajectory as the gold standard for testing the accuracy of our approaches. The training data are also extracted using this approach.
4.1.3 Programming
We use the MATLAB platform to program and run our codes. The vlfeat-0.9.20 toolbox[5] is used as the SVM implementation.
4.2. Accuracy analysis
In terms of the retrospective approach, we analyzed the accuracy based on two metrics. First, the trajectory of the shuttlecock is compared with the gold standard and a root-mean-squared error (RMSE) is calculated. Second, a threshold is set to the RMSE. If the RMSE is lower than the threshold, we mark the detection as ‘accurate’, while in other cases, it is marked as ‘inaccurate’.
In terms of the SVM, cross-validation with a ratio of 4:1 between the size of training and test set is used to estimate the accuracy of this approach.
4.3. Results
4.3.1 Whole-court view
4.3.1.1 Retrospective approach without any training data
The result of trajectory detection is shown in Fig.13. In this figure, points with low confidence less than 0.5 are denoted with red x’s. The blue, pink, and green stars denote the first, second, and third stroke, respectively. The accuracy of the detection is 83.6%, while the RMSE for the trajectory detection is 36.2 pixel (in a 1456-by-796 image). The major error is caused by image blurring in the first several frames right after a stroke.
Fig. 13 The estimated trajectory of the shuttlecock using
a retrospective approach
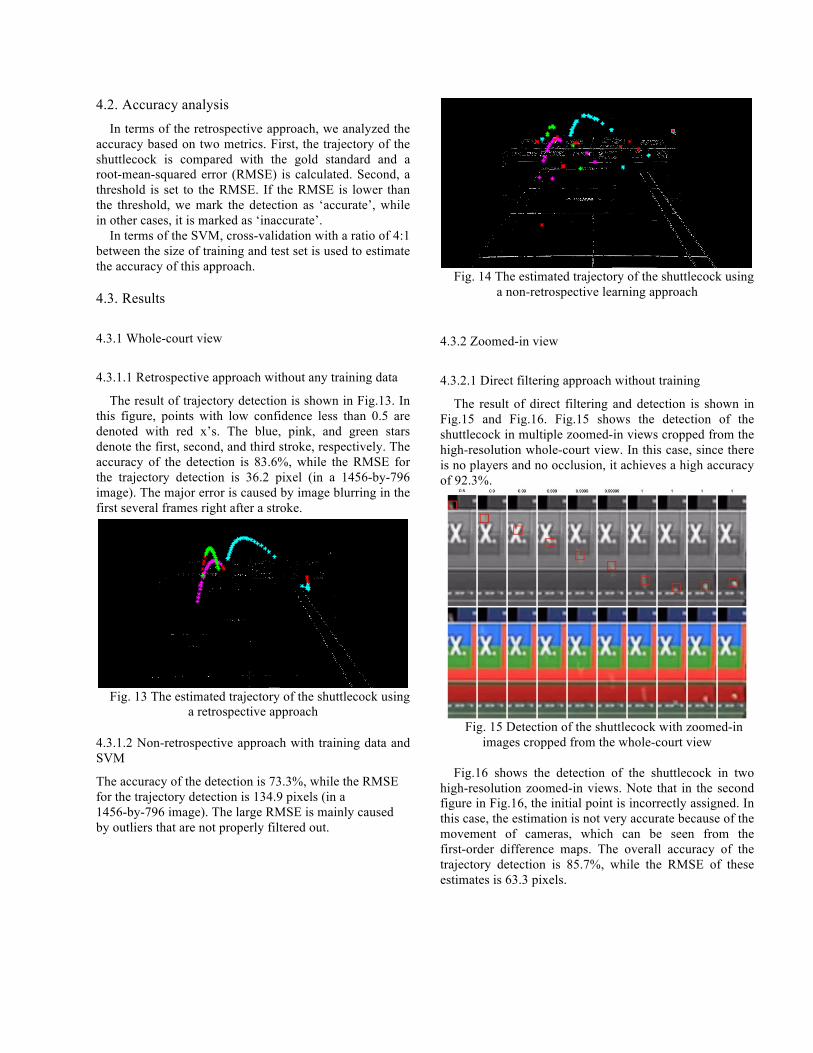
4.3.1.2 Non-retrospective approach with training data and SVM
The accuracy of the detection is 73.3%, while the RMSE for the trajectory detection is 134.9 pixels (in a 1456-by-796 image). The large RMSE is mainly caused by outliers that are not properly filtered out.
Fig. 14 The estimated trajectory of the shuttlecock using
a non-retrospective learning approach
4.3.2 Zoomed-in view
4.3.2.1 Direct filtering approach without training
The result of direct filtering and detection is shown in Fig.15 and Fig.16. Fig.15 shows the detection of the shuttlecock in multiple zoomed-in views cropped from the high-resolution whole-court view. In this case, since there is no players and no occlusion, it achieves a high accuracy of 92.3%.
Fig. 15 Detection of the shuttlecock with zoomed-in
images cropped from the whole-court view
Fig.16 shows the detection of the shuttlecock in two high-resolution zoomed-in views. Note that in the second figure in Fig.16, the initial point is incorrectly assigned. In this case, the estimation is not very accurate because of the movement of cameras, which can be seen from the first-order difference maps. The overall accuracy of the trajectory detection is 85.7%, while the RMSE of these estimates is 63.3 pixels.
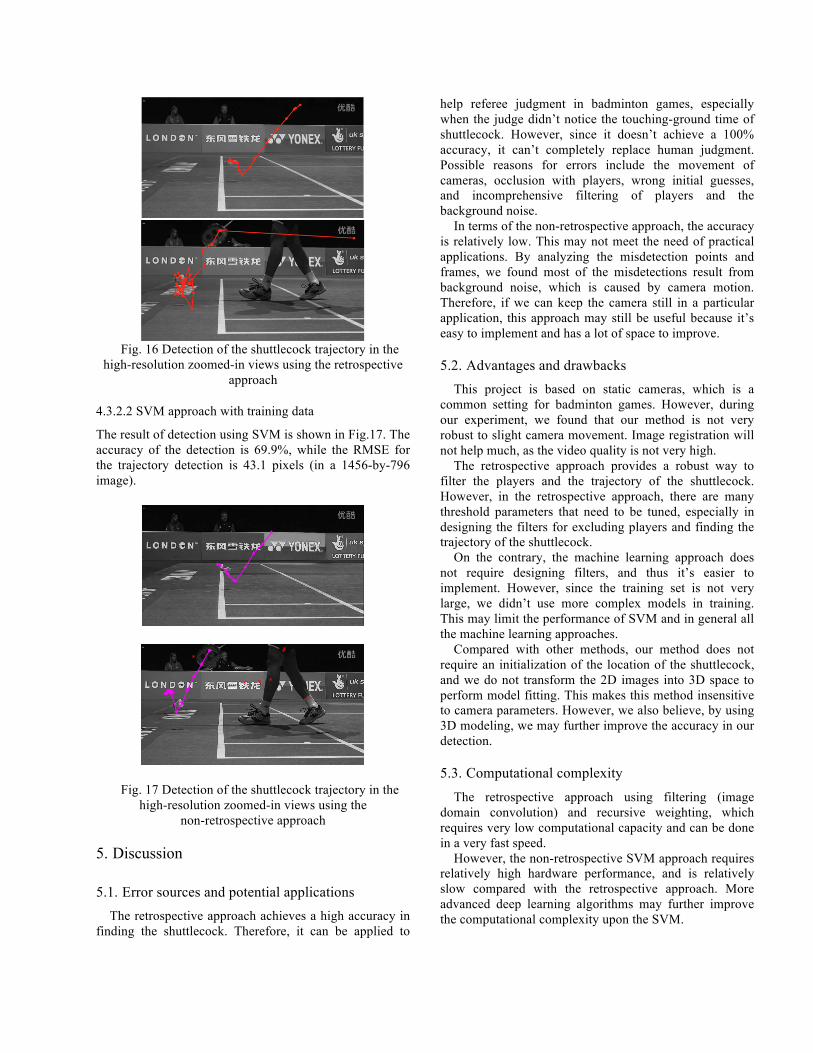
Fig. 16 Detection of the shuttlecock trajectory in the
high-resolution zoomed-in views using the retrospective approach
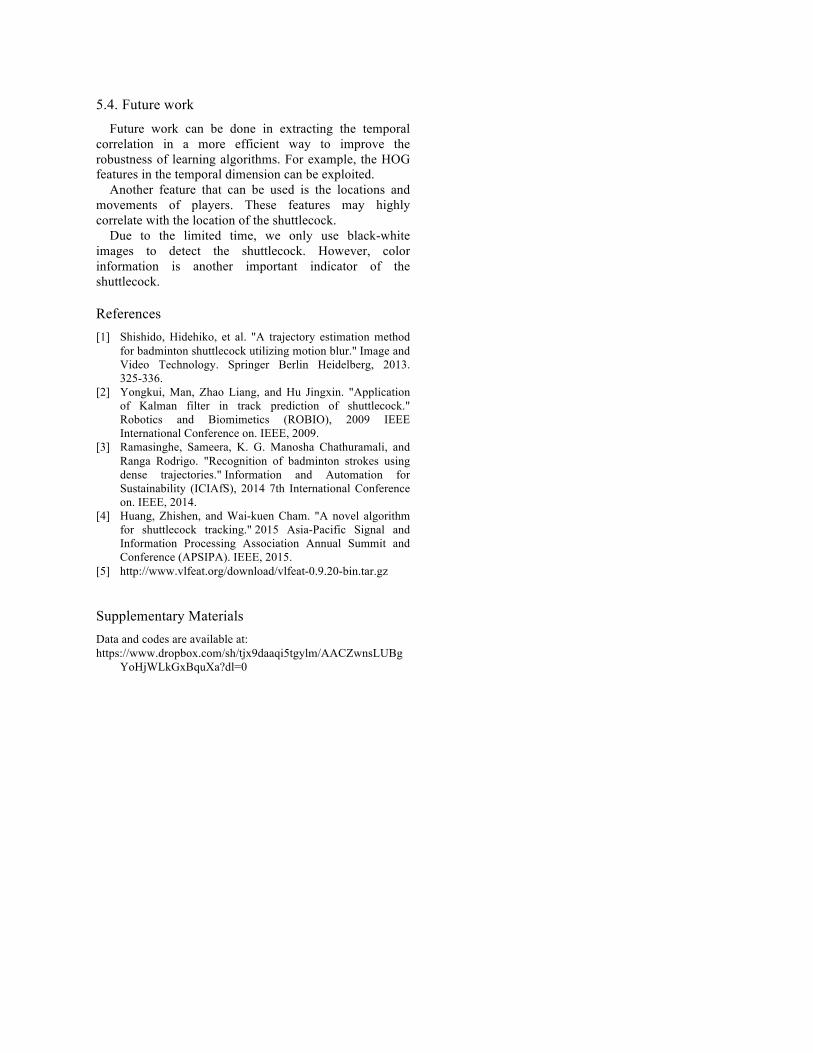
4.3.2.2 SVM approach with training data
The result of detection using SVM is shown in Fig.17. The accuracy of the detection is 69.9%, while the RMSE for the trajectory detection is 43.1 pixels (in a 1456-by-796 image).
Fig. 17 Detection of the shuttlecock trajectory in the high-resolution zoomed-in views using the
non-retrospective approach
5. Discussion
5.1. Error sources and potential applications The retrospective approach achieves a high accuracy in
finding the shuttlecock. Therefore, it can be applied to
help referee judgment in badminton games, especially when the judge didn’t notice the touching-ground time of shuttlecock. However, since it doesn’t achieve a 100% accuracy, it can’t completely replace human judgment. Possible reasons for errors include the movement of cameras, occlusion with players, wrong initial guesses, and incomprehensive filtering of players and the background noise.
In terms of the non-retrospective approach, the accuracy is relatively low. This may not meet the need of practical applications. By analyzing the misdetection points and frames, we found most of the misdetections result from background noise, which is caused by camera motion. Therefore, if we can keep the camera still in a particular application, this approach may still be useful because it’s easy to implement and has a lot of space to improve.
5.2. Advantages and drawbacks This project is based on static cameras, which is a
common setting for badminton games. However, during our experiment, we found that our method is not very robust to slight camera movement. Image registration will not help much, as the video quality is not very high.
The retrospective approach provides a robust way to filter the players and the trajectory of the shuttlecock. However, in the retrospective approach, there are many threshold parameters that need to be tuned, especially in designing the filters for excluding players and finding the trajectory of the shuttlecock.
On the contrary, the machine learning approach does not require designing filters, and thus it’s easier to implement. However, since the training set is not very large, we didn’t use more complex models in training. This may limit the performance of SVM and in general all the machine learning approaches.
Compared with other methods, our method does not require an initialization of the location of the shuttlecock, and we do not transform the 2D images into 3D space to perform model fitting. This makes this method insensitive to camera parameters. However, we also believe, by using 3D modeling, we may further improve the accuracy in our detection.
5.3. Computational complexity
The retrospective approach using filtering (image domain convolution) and recursive weighting, which requires very low computational capacity and can be done in a very fast speed.
However, the non-retrospective SVM approach requires relatively high hardware performance, and is relatively slow compared with the retrospective approach. More advanced deep learning algorithms may further improve the computational complexity upon the SVM.
5.4. Future work
Future work can be done in extracting the temporal correlation in a more efficient way to improve the robustness of learning algorithms. For example, the HOG features in the temporal dimension can be exploited.
Another feature that can be used is the locations and movements of players. These features may highly correlate with the location of the shuttlecock.
Due to the limited time, we only use black-white images to detect the shuttlecock. However, color information is another important indicator of the shuttlecock.
References [1] Shishido, Hidehiko, et al. "A trajectory estimation method
for badminton shuttlecock utilizing motion blur." Image and Video Technology. Springer Berlin Heidelberg, 2013. 325-336.
[2] Yongkui, Man, Zhao Liang, and Hu Jingxin. "Application of Kalman filter in track prediction of shuttlecock." Robotics and Biomimetics (ROBIO), 2009 IEEE International Conference on. IEEE, 2009.
[3] Ramasinghe, Sameera, K. G. Manosha Chathuramali, and Ranga Rodrigo. "Recognition of badminton strokes using dense trajectories." Information and Automation for Sustainability (ICIAfS), 2014 7th International Conference on. IEEE, 2014.
[4] Huang, Zhishen, and Wai-kuen Cham. "A novel algorithm for shuttlecock tracking." 2015 Asia-Pacific Signal and Information Processing Association Annual Summit and Conference (APSIPA). IEEE, 2015.
[5] http://www.vlfeat.org/download/vlfeat-0.9.20-bin.tar.gz
Supplementary Materials Data and codes are available at: https://www.dropbox.com/sh/tjx9daaqi5tgylm/AACZwnsLUBg
YoHjWLkGxBquXa?dl=0