Embed Size (px)
Citation preview

MonicaRamakrishnan,SuryaRajasekaran,BarsaNayak,AkshayBhagdikar
SANTACLARAUNIVERSITY
AUTOMATEDLUNGCANCERNODULEDETECTION

2|P a g e
1 PRE-INTRODUCTION1.1 PREFAFACEThe purpose of this project is to develop a model that utilizes various concepts from imageprocessing, datamining, andmachine learning to detect lung cancer nodules amongst high riskpatients.Variousconceptsof imageprocessingwerealsoutilized.This reporthasbeenmade infulfillmentoftherequirementforthesubject:PatternRecognition&DataMininginJune2017underthesupervisionofDr.Ming-HwaWang1.2 ACKNOWLEDGEMENTSWewouldliketoexpressourheartfeltgratitudetoDr.Ming-HwaWangforprovidinguswithanopportunity to explore our interests in data mining as well as image processing. Without histremendous support, encouragement as well as valuable inputs, this project couldn't havematerialized.Theguidanceandsupportreceivedfromallthememberswhocontributedandwhoarecontributingtothisprojectwasvitalforoursuccess.
3|P a g e
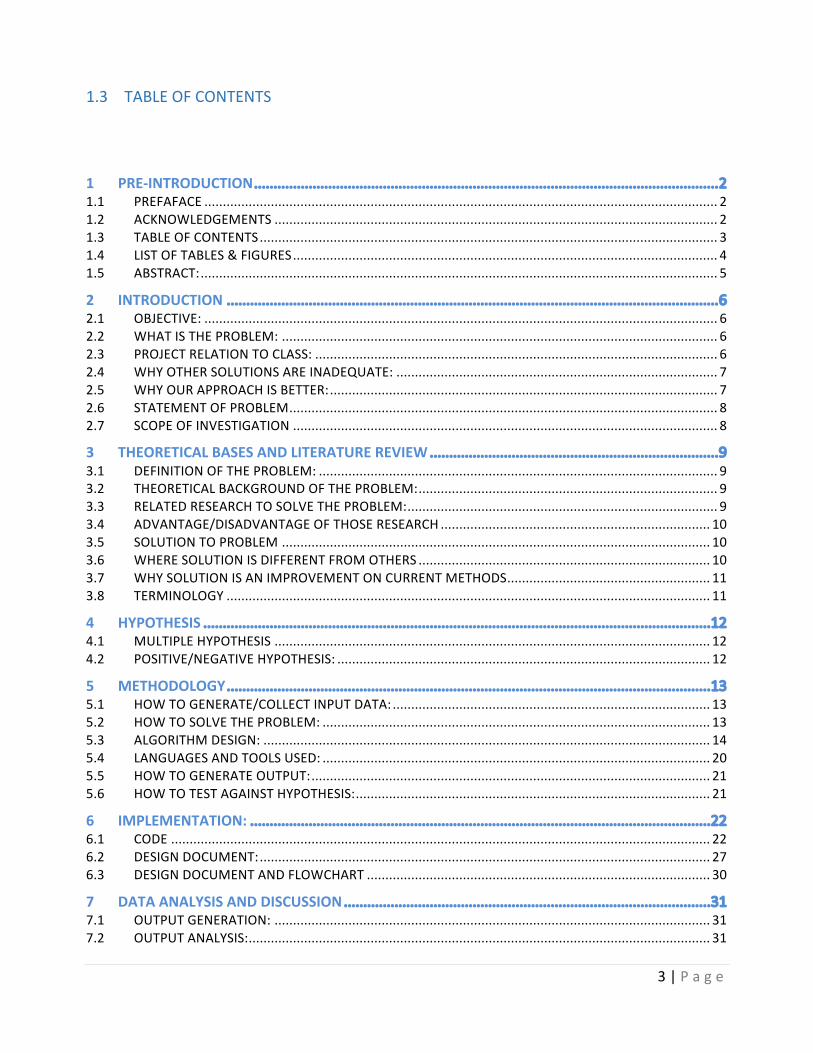
1.3 TABLEOFCONTENTS
1 PRE-INTRODUCTION.......................................................................................................................21.1 PREFAFACE...........................................................................................................................................21.2 ACKNOWLEDGEMENTS........................................................................................................................21.3 TABLEOFCONTENTS............................................................................................................................31.4 LISTOFTABLES&FIGURES...................................................................................................................41.5 ABSTRACT:............................................................................................................................................5
2 INTRODUCTION..............................................................................................................................62.1 OBJECTIVE:...........................................................................................................................................62.2 WHATISTHEPROBLEM:......................................................................................................................62.3 PROJECTRELATIONTOCLASS:.............................................................................................................62.4 WHYOTHERSOLUTIONSAREINADEQUATE:.......................................................................................72.5 WHYOURAPPROACHISBETTER:.........................................................................................................72.6 STATEMENTOFPROBLEM....................................................................................................................82.7 SCOPEOFINVESTIGATION...................................................................................................................8
3 THEORETICALBASESANDLITERATUREREVIEW..........................................................................93.1 DEFINITIONOFTHEPROBLEM:............................................................................................................93.2 THEORETICALBACKGROUNDOFTHEPROBLEM:.................................................................................93.3 RELATEDRESEARCHTOSOLVETHEPROBLEM:....................................................................................93.4 ADVANTAGE/DISADVANTAGEOFTHOSERESEARCH.........................................................................103.5 SOLUTIONTOPROBLEM....................................................................................................................103.6 WHERESOLUTIONISDIFFERENTFROMOTHERS...............................................................................103.7 WHYSOLUTIONISANIMPROVEMENTONCURRENTMETHODS.......................................................113.8 TERMINOLOGY...................................................................................................................................11
4 HYPOTHESIS..................................................................................................................................124.1 MULTIPLEHYPOTHESIS......................................................................................................................124.2 POSITIVE/NEGATIVEHYPOTHESIS:.....................................................................................................12
5 METHODOLOGY............................................................................................................................135.1 HOWTOGENERATE/COLLECTINPUTDATA:......................................................................................135.2 HOWTOSOLVETHEPROBLEM:.........................................................................................................135.3 ALGORITHMDESIGN:.........................................................................................................................145.4 LANGUAGESANDTOOLSUSED:.........................................................................................................205.5 HOWTOGENERATEOUTPUT:............................................................................................................215.6 HOWTOTESTAGAINSTHYPOTHESIS:................................................................................................21
6 IMPLEMENTATION:......................................................................................................................226.1 CODE..................................................................................................................................................226.2 DESIGNDOCUMENT:..........................................................................................................................276.3 DESIGNDOCUMENTANDFLOWCHART.............................................................................................30
7 DATAANALYSISANDDISCUSSION..............................................................................................317.1 OUTPUTGENERATION:......................................................................................................................317.2 OUTPUTANALYSIS:.............................................................................................................................31
4|P a g e
7.3 COMPAREOUTPUTAGAINSTHYPOTHESIS........................................................................................337.4 ABNORMALCASEEXPLANATION........................................................................................................337.5 DISCUSSION:.......................................................................................................................................33
8 CONCLUSIONANDRECOMMENDATIONS.....................................................................................348.1 SUMMARYANDCONCLUSIONS:........................................................................................................348.2 RECOMMENDATIONSFORFUTURESTUDIES:....................................................................................348.3 BIBLIOGRAPHY....................................................................................................................................358.4 PROGRAMFLOWCHART.....................................................................................................................378.5 PROGRAMSOURCECODEWITHDOCUMENTATION..........................................................................378.6 INPUT/OUTPUTLISTING.....................................................................................................................37
1.4 LISTOFTABLES&FIGURES FIGURE1:SAMPLESLICESOFDICOMIMAGE..............................................................................................14
FIGURE2:HOUNDSFIELDUNITSFORVARIOUSSUBSTANCES............................................................................15
FIGURE3:CTSCANSLICECOLORED...........................................................................................................15
FIGURE4:AFTERTHRESHOLDING...............................................................................................................16
FIGURE5:AFTEREROSIONANDDILATION....................................................................................................16
FIGURE6:VGG16ARCHITECTURE............................................................................................................18
FIGURE7:MLPPROCESS........................................................................................................................19
FIGURE8:SAMPLEEPOCHOUTPUT...........................................................................................................32
5|P a g e
1.5 ABSTRACT:Lungcancerisadiseaseofuncontrolledcellgrowthintissuesofthelung.Sincelungcancerisoneoftheleadingcausesofdeath,earlydetectionofmalignanttumorsisimperativeforasuccessfulrecovery.Ingeneral,earlystagelungcancerdiagnosistechniquesmainlyutilizeX-raychestfilms,CT,MRI,etc.Computedtomography(CT)producesaseriesofcross-sectionalimagescoveringapartofthehumanbody.Forourcasespecifically,wewillfocusonthethoracicregion.Visuallyidentifyingandexaminingtheseimagesforpotentialabnormalitiesisachallengingandtimeconsumingtaskduetothelargeamountofinformationthatneedstobeprocessed,andtheshortamountoftimegiven.Thesubjectofmedicalimageminingiscurrentlyanupandcomingtopicandshowsalotofresearchpotentialintheareaofcomputationalintelligence.Byauto-analyzingapatient’srecordsand images throughdataminingand imageprocessing techniques,wewould reduce the riskofhumanerrorinnoduledetection.Byapplyingacombinationoftechniquesindatapreprocessing,featureextraction,andclassification,weultimately seek to increase theaccuracy rateofcancerdetection, while simultaneously reducing the false positive diagnosis rate. In this project, weproposetouseadeepartificialneuralnetworkarchitecture,whichisacombinationofCNNalongwithRNNforthefully-automateddetectionofpulmonarynodulesinCTscans.ThearchitectureoftheVGG16convolutionalneuralnetworkistrainedtodistinguishpixelsacrossimages,andcanbeutilizedinourcasetoextractnoduleinformation.Ourprojectwilldemonstratethatbyleveragingthesetechniques,wesubstantially increasethesensitivitytodetectpulmonarynodules,withoutinflatingthefalsepositiverate.Thus,fromtheavailableLIDC/IDRIdatasetconsistingofaround1500CTscans,wehaveprovidedaninnovativeapproachofimplementingCNNusingthepretrainedVGGmodel for feature extraction and RNN for feature classification for identification of pulmonarynodulesinlungcancerdetection.

6|P a g e
2 INTRODUCTION2.1 OBJECTIVE:Theobjectiveofthisprojectistoimprovethecurrentcancerdetectionratebyreducingthefalsepositives while maintaining a low false negative rate. The false positive detection of cancer isdangerous,asanerroneousdiagnosisutilizespreciousresources,causesunnecessaryapprehensionforthepatient,andfinally,posesavarietyoflegalthreatstothedoctors.Thus,topreventthis,ourobjectiveistodevelopanalgorithmthatefficientlyreducesthefalsepositiverate,whilemaintainingtheoverallcancerdetectionaccuracy.2.2 WHATISTHEPROBLEM:Lungcarcinoma,alsoknownaslungcancer,ischaracterizedbymalignanttumorsfromwhengenechanges intheDNAofthecellsmutateandpromoteunnaturalgrowth.Lungcancer is themostcommontypeofcancerwithapproximately225Knewcasesin2016alone,whichledto$12billioninannualhealthcarecosts.Themostcommonageatdiagnosisis70years.Overall,thelungcancersurvival rate in theUnitedStates isextremely low–only17.4%ofpatientsdiagnosedwith lungcancersurvivefiveyearspostdiagnosis.Further,uncontrolledcellgrowthcanspreadtosurroundingareasormetastasizetootherorgans if itnotdetectedearly.DoctorscurrentlyuseLow-DoseCTscanstohelpassessifapersonisatriskoflungcancer,orevenotherpulmonarydiseases.Using a data set of thousands of high-resolution lung scans provided by the National CancerInstitute,wewilldevelopamodelthataccuratelydetermineswhetherlesionsinthelungsofhighriskpatientsarecancerous.Currentmodelshaveextremelyhighfalsepositiverates,whichdoesnotallowoncologistsandradiologiststofocusonpatientsthathaveanimminentcancerthreat.Further,thehighfalsepositiveratesleadtounnecessarypatientanxiety,additionalfollowupimaging,andinterventionaltreatments.Thus,bybuildingaclassificationmodelthatreducesthenumberofbothfalsepositivesandfalsenegatives,patientscanhaveearlieraccesstolife-savinginterventions,aswellasgivedoctorsanopportunitytoprioritizepatientcare.2.3 PROJECTRELATIONTOCLASS:Theapproachwewilltaketomodelanaccuratepredictionsystemoflungcancerwillutilizemultipletechniques indataminingandpatternrecognition.Classificationproblemsarerooted in featureprocessing,clusteringfeatureextraction,featureengineering,andmachinelearningmodels.First,byminingalargedatasetofCTscans,weutilizetechniquesindataminingandimageprocessingthatarecrucialforaccuratefeatureextraction.Wealsoplantoutilizebothunsupervised(clustering)andsupervised(classification)modelsinordertoextractcharacteristicsofpatients’lungsandfinallyclassifypatientsascancerousornotcancerous.Byusingthesevarioustechniques,wearecombiningwidelyusedtechniquesindataminingandpatternrecognition.

7|P a g e
2.4 WHYOTHERSOLUTIONSAREINADEQUATE:MostofthestandardmechanismsforclassificationgoforeitherPCAorSVMorRandomForestandXboostClassifiertoclassifythedata.Otherclassifiersfailiftheyhaven'ttakenthebelowscenariosintoaccount:
1. Detecting the location of Pulmonary Nodule(s): The current approaches for detectingpulmonarynodulesgenerallyincludemanualintervention.Whenthelocationofthenodulesisnotprovidedinthedataset,itbecomesanextremelytedioustasktomanuallyparsetheimages to findpotentiallymalignantnodules. Thisproves itself evenmoredifficult if theimagesarerotatedortwisted,leadingtofurthererroneousprocessing.
2. FeatureExtraction:Thegenerationofasmallnumberoffeaturesleadstoalossofdata.Oncethenodulepositionisdetermined,thenoduleisthenextractedfromtheentireimage.Then,the features such as total area, average area, maximum area and average eccentricity,averageequivalentdiameter,standardequivalentdiameter,weightedX,weightedY,numberofnodes,andnumberofnodesperslicewerecalculated.Withthisapproach,thereisalotofinformationlost.
2.5 WHYOURAPPROACHISBETTER:Ourproposedapproachhasthefollowingtwosteps:
1. FeatureExtractionPhase:Unlikemanualintervention,wemakeuseoftheimageprocessingtechniquestofirsthighlightthelungregionandthenapplyourstateoftheartpretrainedConvolutionalNeuralNetworkmodelforfeatureextractionfromtheimages.Thisreducesthehumaneffortofthenodulepositiondetection,andsinceourmodelisnotrestrictedtothepositionofthenodule,itdoesnotgetaffectediftheimageisrotatedortwisted.
2. ClassificationPhase:RecurrentNeuralNetworkswithmultilevelperceptronwillbeusedtoclassifytheCTscans.Althoughrandomforestclassificationmodelstypicallyrequiremoredataforasimilaraccuracy,theytypicallygeneratearobustmodel.Thus,wewilluserandomforesttosetabaselineaccuracyforouranalysis.Ontheotherhand,deeplearningismorefavorableascomplexproblemssuchasimageclassificationcanbehandledbetter,andthisisthebaseofpulmonarynoduledetection.
tThebenefitsofusingdeeplearning(RecurrentNeuralNetworks)are:
1. Automaticfeatureextractionwithouthavingtoextractthenodulepositioninformationandotherfeatures.
2. Incaseofdatasetswhicharecomplex3Dimages,deeplearninggivesbetterclassificationresultsascomparedtoothermethods.
3. Treebasedmodels(theonethatXGBoostisgoodat)solvetabulardataverywellbutadeepnetworkcancapturethingslikeimage,audioandpossiblytextquitewellbymodelingthespatialtemporallocality.
4. Neuralnetworkbaseddeeplearningisanaccuracy-focusedmethodwhereasXgboostisaninterpretation-focusedmethod.
8|P a g e
2.6 STATEMENTOFPROBLEMAlthoughCTscansareestablishedmeansfordetectingpulmonarynodules,thesmalllesionsinthelungstillremaindifficulttoidentify–especiallywhenusingasingledetectorCTscan.Thisposesitselfasachallengewhenattemptingearlydetectionoflungcancer.Sinceearlydetectionisthekeyfor a successful remission and recovery, the inability tomanually see the small lesions furtherhindersthepossibilityofearlydetection.CurrentCTscannersproduceupto300cross-sectional2Dimages,eachofwhichmustbeindividuallyevaluatedunderatimeconstraint.DespitethediagnosticbenefitsprovidedbytheCTimaging,theincreasedmanualworkloadthatisrequiredtoread200-300slicesperexamleadstotheincreasingerrorrateofcancerdetection.Giventhatnodulescanappear in different positions, and depending on the patient, the process to detect lung cancerbecomes extremely labor-intensive and manual. This manual process further increases theprobabilityofhumanerror–eitherthedoctordetectscancerinapatientwhoiscancerfree,orthedoctor fails todetect themalignantnodule.Currentstudieshavedemonstrated that therateoferroneousCTinterpretationandanalysisrangesfrom7%-15%whenaradiologistperformsmorethan20CTexaminationsperday(Bechtold,1997).Inordertoaddresstheseissues,therehasbeenasuddenincreaseofresearchanddevelopmentofCAD(computer-aided-diagnosis)systemsforhighaccuracypulmonarynoduledetection.UsingtheCTscans,theadoptionoftheCADsystemsledtoan improvement on the sensitivity of current detection algorithms – present day systems aresuccessfully able to detect nodules with a 3mm diameter. Thus, several approaches are beingproposed to overcome the challenges to detect the pulmonary nodules and thusmaximize thechancesofthesurvivalofthepatients.2.7 SCOPEOFINVESTIGATION Forthepurposesofthisproject,wewillspecificallyfocusonlesionsinthelungsofhighriskpatients.The general approach can potentially be applied to different organs and in patients of variousdemographics,butforthisinvestigation,wewilllimitthescopeofourinvestigation.

9|P a g e
3 THEORETICALBASESANDLITERATUREREVIEW3.1 DEFINITIONOFTHEPROBLEM:Since lungcancer isoneofthe leadingcausesofdeath intheUnitedStatesandgiventhatearlydetection increases the probability of a successful remission, our problem statement revolvesaroundcreatinganautomated,highaccuracymodelfornoduledetection.Currentmethodologiesplace a heavy focus on reducing false negative rates, but at the expense of significantly overpredicting the cancerous class. Further, our research has suggested that current approaches tonoduledetectionallrequiresomelevelofmanualimageprocessing.Thatis,theimagesareparsedbyhandforthecoordinatesofthenodule.Thus,thesolutionwillfocuson1)automatingnoduledetection,and2)reducingthefalsepositiverateofcancerdetectionwhilemaintainingagoodfalsenegativerate.Theavailabilityof largedatagivenbytheNationalCancerAssociationprovidesanopportunityforfurtherresearchindatamining.Theimportantprobleminthisareaistomakeanefficientdetectionalgorithmtoaidwithearlydetection.3.2 THEORETICALBACKGROUNDOFTHEPROBLEM: With the advancement of Technology and Computer Aided Diagnosis (CAD), scientists haveencouraged a lot of automated systems to address the issue of reducing false positive whileestimatingthepresenceofpulmonarynodulesintheCTscansofthepatients.Thus,todaywehaveasurplusofdatapertainingtotheCTscanpatients.Fromhere,wehavetheopportunitytousecurrenttopicsinimageprocessing,datamining,andmachinelearningtoidentifyhiddenpatternsin nodule size, location, structure, etc. and construct a model to increase the probability ofmalignanttumordetection.Withtheadventof thepatternrecognitionandmachine learning,datascientistshaveproposedmanyapproacheswhichwererobustinfindingthehiddenpatternsandreducingthefalsepositives.Withthis,asthedataforthepatientsdetectedwithlungcancerincreased,theCTscanstendtodiffermoresignificantlyfromeachother,acrosspatients.Consequently,thedeeplearninghascomeintopictureforthecompleximageclassificationinordertoensurethatoutliersandanomaliesareproperlyhandledinthemodelandthus,reducingthefalsepositiverateformalignantpulmonarynoduledetection.3.3 RELATEDRESEARCHTOSOLVETHEPROBLEM: Therehasbeenalotofresearchinrecenttimesonthedevelopmentofcomputer-aideddiagnosis(CAD)systemsforpulmonarynoduledetectionusingCTimaging.Advancementsinimageprocessingfield has increased the accuracy in the prediction of cancer fromCT scans. There are plenty ofresearchpaperswhichdiscussthevariousmethodsandoutputs.Afewexamplesinclude:‘RecurrentConvolutionalNetworksforPulmonaryNoduleDetectioninCTImaging’, ‘Combiningdeepneuralnetwork and traditional image features to improve survival prediction accuracy for lung cancerpatientsfromdiagnosticCT’,‘ComputerizedDetectionofLungTumorsinPET/CTImages’,and‘LungcancerclassificationusingneuralnetworksforCTimages’.
10|P a g e
3.4 ADVANTAGE/DISADVANTAGEOFTHOSERESEARCHAdvantages The current research is extremely helpful to many students who would like to implement thefindingsintotheirprojectsandaswellastodofurtherresearch.Theadvantageoftheseresearchfindingsisthatitalsohelpsinimprovingthedetectionofcanceratanearlystageandtoreducethedetectionerror.Disadvantages Thedisadvantagesarethatusuallythedatatrainingsetisveryhugewhichincreasesthetimetakentotrain.Inordertoobtainabeyond-averageaccuracy,wearerequirdtouseanextremelylargedatasetinordertotrainthemodel.Althoughitistimeconsumingforthecodetotrainthenetwork,itisaone-timeprocessthatcanberedoneiftherearenewtypesofcancersthatneedtobetrained.3.5 SOLUTIONTOPROBLEM Inorder todetectcancerous tissue in the lungswitha relativelyhighaccuracy,oursolutionwillincludethefollowingsteps:
1. ImageProcessing2. FeatureExtraction&Engineering3. Clustering4. ClassificationModel
Thishybridapproachallowsustocombinethemostefficientindividualmethodologiesintoanendtoendmodel.Webelievethatthiscombinationwillextracttheadvantagesfromeachapproach,andultimatelyprovidemoreconclusiveresults.Ourgoalistobuildanautomatednoduledetectionmodelwithhighaccuracyinordertoaidthedetectionoflungcancerinpatients.3.6 WHERESOLUTIONISDIFFERENTFROMOTHERS Oursolutionwillutilizeacombinationofmachinelearningtechniquesandplaceauniquefocusonminimizingthefalsepositiverate.Whilemostmodelsplacetheprimaryfocusontotalcancerouslungspredicted,wewillplaceourfocusonreducingthefalsepositiverate,inordertomakeourresultsmorereliable.Further,mostof the techniquesbeingused for lungcancerdetectionpre-processtheCTscanmanually,whichisthemostcriticalstepforhighaccuracydetection.Currentsolutionsrequiremanualfeatureextraction,whichincreasestheprobabilityofhumanerror.Onthecontrary,ourmethodwillinputtheentireCTscanasDICOMimageintotheclassificationsystemandthus,weeliminatetheneedforamanualpreprocess.
11|P a g e
3.7 WHYSOLUTIONISANIMPROVEMENTONCURRENTMETHODS Oursolutionisaimedatreducingthenumberoffalsepositivesintheclassificationmodel.Thiscanbeachievedbyacombinationoffeatureengineering(i.e.selectingfeaturesandcharacteristicsthatarehighlycorrelatedwithlungcancer)aswellastrainingaclassificationmodelusingbootstrappingandvariousotherresamplingtechniquesgivenourunbalanceddataset.Bydoingso,ourdatasetwillevenoutthedistributionbetweentheclassesofpatients.Creatingaweightingfunctionforrareclass(cancerousscans)forcesthemodeltonotoverfittothedata,whichultimatelyresults inaminimalnumberoffalsepositives.Further,aspreviouslymentioned,foranyjobwhich isdoneinapattern,machineshaveamuchlargercapacityandincreasedefficiencyforimageprocessing.Byeliminatingtheneedforhumaninteraction, we have proposed an automated tool which will input raw CT scans, perform therequiredamountofimageprocessing,modeltraining,andfinalclassification.3.8 TERMINOLOGYThissectionhighlightsthecommonterminologyusedinlungcancerandimageprocessing.
Terminology Definition
CT ComputerizedTopologyusescomputer-processedcombinationofX-Rayimagestakenatdifferentanglestoproducethescan
PulmonaryNodule Massinthelungthatusuallyrepresentscancerouslesions
DICOM DigitalImagingandCommunicationsinMedicine
InstanceNumber IdentifiesthesequenceofimagesinaDICOM
SliceThickness ThicknessofslicedependsonthicknessofCTdetectionmachine
HoundsfieldUnits QuantitativeScaleusedtomeasuredensityofsubstancesfoundinbody
ROI RegionofInterest
12|P a g e
4 HYPOTHESIS4.1 MULTIPLEHYPOTHESISHypothesis: By using the solution outlined above, our model will reduce the number of falsepositives,whilemaintainingagoodaccuracyrate.4.2 POSITIVE/NEGATIVEHYPOTHESIS:PositiveHypothesis:WhenextractingandquantifyingfeatureforROI,thefeaturestructuredesignisirrational,hence3Dfeaturesaretakenintoaccountbyrecombiningthesliceswhileextractingthefeaturestogetmoreaccuracy.Negative:Thepulmonarynodulecanbeofanyshapeandcouldmergewiththebloodvessel,whichcouldcause issueswhendetecting thenoduleaccurately. Since theaccuracy isnot100%, thereleavesroomforerror.However,thisisstillbetterthanamanualdetectiondonebyhumans.
13|P a g e
5 METHODOLOGY5.1 HOWTOGENERATE/COLLECTINPUTDATA:OurinputdataistakenfromKaggle,whichhasthedataof1,000highriskpatients.Thedatasetisapproximately130GB–whichrequiredasignificantamountofcomputingpowertoprocess.Inthisdataset,wearegivenoverathousandlow-doseCTimagesfromhigh-riskpatientsinDICOMformat.EachDICOMimagecontainsaseriesof2Dgray-scaleimagesthatcontainmultipleaxialslicesofthechestcavity–thatis,thereareapproximately300imagesperpatient.Eachimagehasavariablenumberof2Dslices,whichcanvarybasedonthetypeofmachineusedinthescan.TheDICOMfileshaveaheaderthatcontainsthenecessaryinformationaboutthepatientid,aswellasotherscanparameterssuchastheslicethickness.Thedatasetalsoincludedacsvcontainingtheclassificationinformationascancerousornon-cancerousperpatientid.Theimagesinourdatasetvaryinquality,depending on when the scan was taken. For example, older scans were imaged with lesssophisticated equipment and thus, have a lower resolution than more recent scans. Thus tosummarizeithasthefollowinginfo–around300imageswhichrepresenttheslicesofthethoracicregionCTscaninslicesinaDICOMformat:
1. PatientID,name,dateofbirthandothermetadataofthepatientandimageinformation2. CSVfilemappingtoeachpatientidmentioningofthepersonhascancerornot
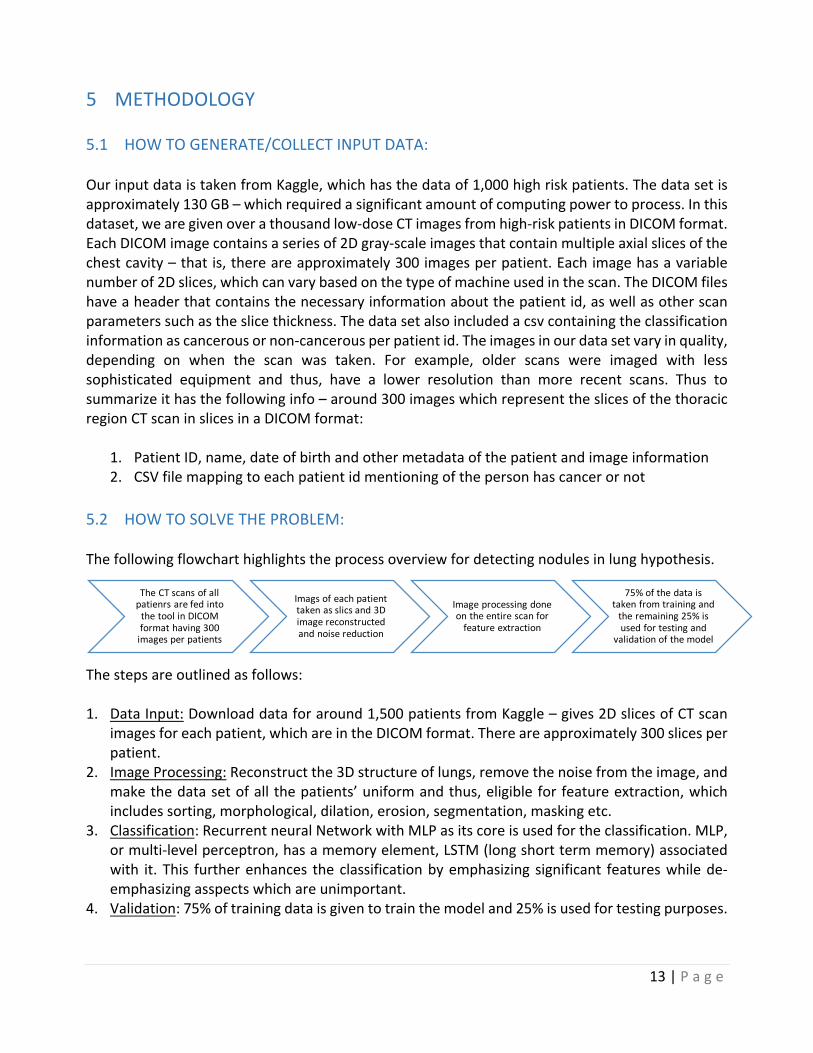
5.2 HOWTOSOLVETHEPROBLEM:Thefollowingflowcharthighlightstheprocessoverviewfordetectingnodulesinlunghypothesis.
Thestepsareoutlinedasfollows:1. DataInput:Downloaddataforaround1,500patientsfromKaggle–gives2DslicesofCTscan
imagesforeachpatient,whichareintheDICOMformat.Thereareapproximately300slicesperpatient.
2. ImageProcessing:Reconstructthe3Dstructureoflungs,removethenoisefromtheimage,andmakethedatasetofallthepatients’uniformandthus,eligibleforfeatureextraction,whichincludessorting,morphological,dilation,erosion,segmentation,maskingetc.
3. Classification:RecurrentneuralNetworkwithMLPasitscoreisusedfortheclassification.MLP,ormulti-levelperceptron,hasamemoryelement,LSTM(longshorttermmemory)associatedwith it. This furtherenhances theclassificationbyemphasizing significant featureswhilede-emphasizingasspectswhichareunimportant.
4. Validation:75%oftrainingdataisgiventotrainthemodeland25%isusedfortestingpurposes.
TheCTscansofallpatienrsarefedintothetoolinDICOMformathaving300imagesperpatients
Imagsofeachpatienttakenasslicsand3Dimagereconstructedandnoisereduction
Imageprocessingdoneontheentirescanforfeatureextraction
75%ofthedataistakenfromtrainingandtheremaining25%isusedfortesting and
validationofthemodel
14|P a g e
5.3 ALGORITHMDESIGN:Asapartofouralgorithmdesign,wewillimplementtwodifferentapproachesinordertodeterminethemodelwith thehighestpredictionaccuracy fordetecting lungcancer.Our imageprocessingstepswill remainconstant throughout theapproaches.Thedifferencewill liewithin the featureextractionandclassificationtechniques.Asourcursoryanalysis,wewilldesignarelativelysimplemethodoffeatureextractionandclassification.1. ImageProcessing:–giventhesetsofCTscans,ouralgorithmwillconstructthe3Dlungscan,and
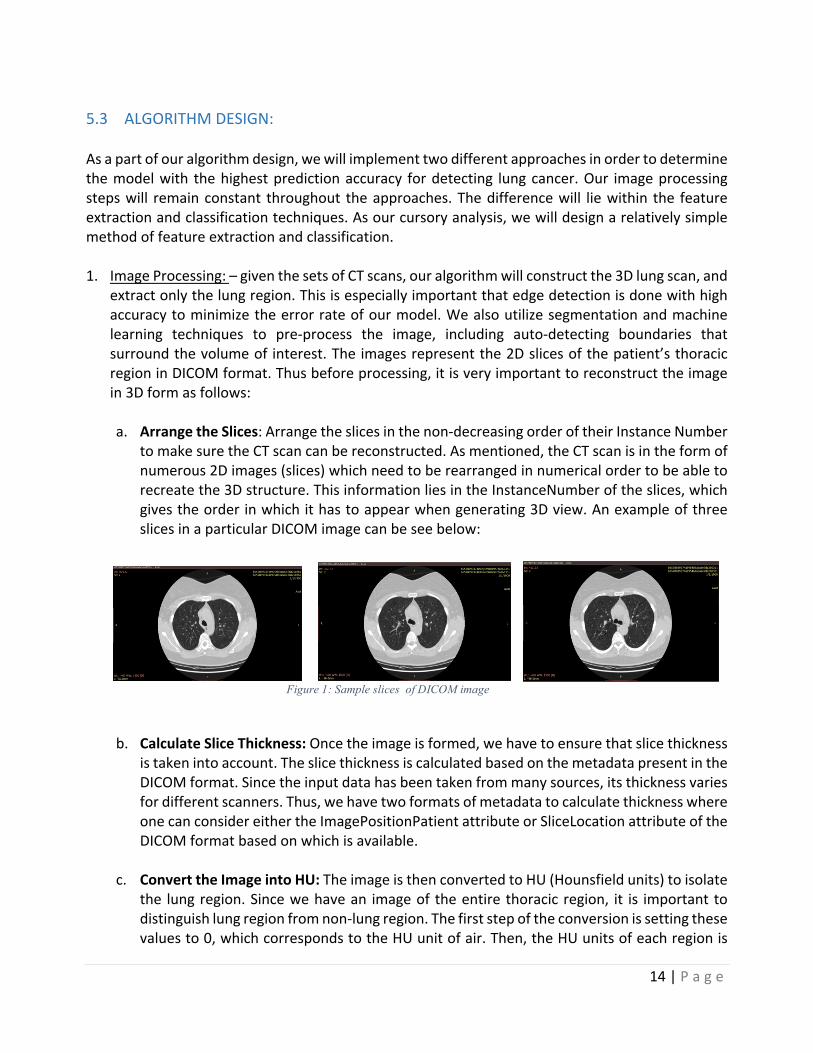
extractonlythelungregion.Thisisespeciallyimportantthatedgedetectionisdonewithhighaccuracytominimizetheerrorrateofourmodel.Wealsoutilizesegmentationandmachinelearning techniques to pre-process the image, including auto-detecting boundaries thatsurroundthevolumeof interest.Theimagesrepresentthe2Dslicesofthepatient’sthoracicregioninDICOMformat.Thusbeforeprocessing,itisveryimportanttoreconstructtheimagein3Dformasfollows:a. ArrangetheSlices:Arrangetheslicesinthenon-decreasingorderoftheirInstanceNumber
tomakesuretheCTscancanbereconstructed.Asmentioned,theCTscanisintheformofnumerous2Dimages(slices)whichneedtoberearrangedinnumericalordertobeabletorecreatethe3Dstructure.ThisinformationliesintheInstanceNumberoftheslices,whichgivestheorderinwhichithastoappearwhengenerating3Dview.AnexampleofthreeslicesinaparticularDICOMimagecanbeseebelow:
b. CalculateSliceThickness:Oncetheimageisformed,wehavetoensurethatslicethickness
istakenintoaccount.TheslicethicknessiscalculatedbasedonthemetadatapresentintheDICOMformat.Sincetheinputdatahasbeentakenfrommanysources,itsthicknessvariesfordifferentscanners.Thus,wehavetwoformatsofmetadatatocalculatethicknesswhereonecanconsidereithertheImagePositionPatientattributeorSliceLocationattributeoftheDICOMformatbasedonwhichisavailable.
c. ConverttheImageintoHU:TheimageisthenconvertedtoHU(Hounsfieldunits)toisolate
the lungregion.Sincewehavean imageof theentirethoracicregion, it is importanttodistinguishlungregionfromnon-lungregion.Thefirststepoftheconversionissettingthesevaluesto0,whichcorrespondstotheHUunitofair.Then,theHUunitsofeachregionis
Figure 1: Sample slices of DICOM image
15|P a g e
obtainedbymultiplyingtherescaleslopeandaddingtheintercept(whichareconvenientlystoredinthemetadataofthescans).Forreference,thetablebelowcontainstheaveragerangeHUspersubstance:
Substance HUAir -1000Lung -500Fat -100to-50Blood +30to+45Water 0Muscle +10to+40
Figure 2: Houndsfield Units for Various Substances
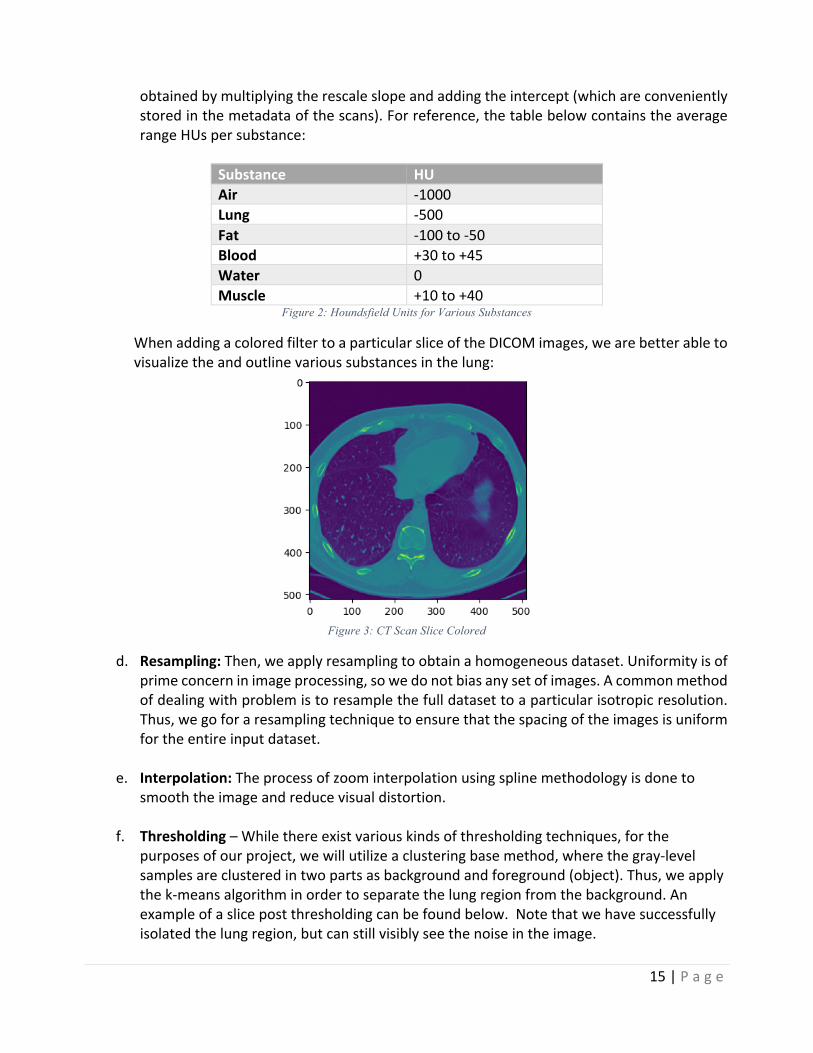
WhenaddingacoloredfiltertoaparticularsliceoftheDICOMimages,wearebetterabletovisualizetheandoutlinevarioussubstancesinthelung:
Figure 3: CT Scan Slice Colored
d. Resampling:Then,weapplyresamplingtoobtainahomogeneousdataset.Uniformityisofprimeconcerninimageprocessing,sowedonotbiasanysetofimages.Acommonmethodofdealingwithproblemistoresamplethefulldatasettoaparticularisotropicresolution.Thus,wegoforaresamplingtechniquetoensurethatthespacingoftheimagesisuniformfortheentireinputdataset.
e. Interpolation:Theprocessofzoominterpolationusingsplinemethodologyisdoneto
smooththeimageandreducevisualdistortion.
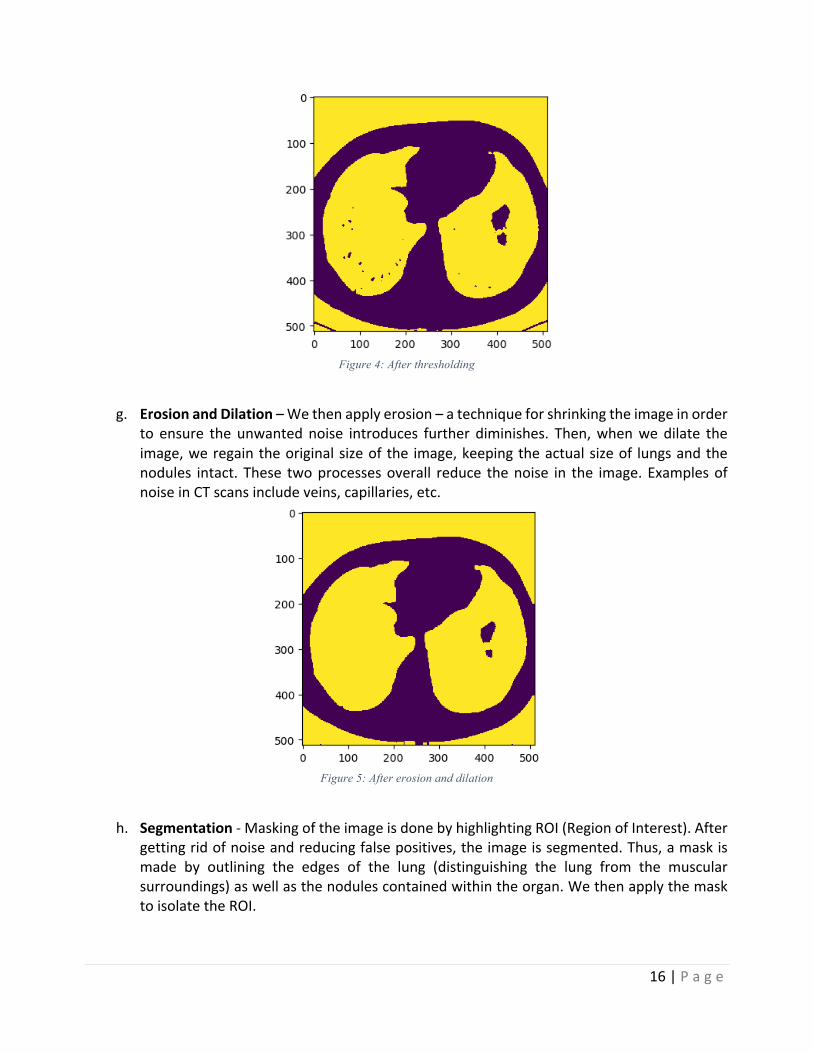
f. Thresholding–Whilethereexistvariouskindsofthresholdingtechniques,forthepurposesofourproject,wewillutilizeaclusteringbasemethod,wherethegray-levelsamplesareclusteredintwopartsasbackgroundandforeground(object).Thus,weapplythek-meansalgorithminordertoseparatethelungregionfromthebackground.Anexampleofaslicepostthresholdingcanbefoundbelow.Notethatwehavesuccessfullyisolatedthelungregion,butcanstillvisiblyseethenoiseintheimage.
16|P a g e
Figure 4: After thresholding
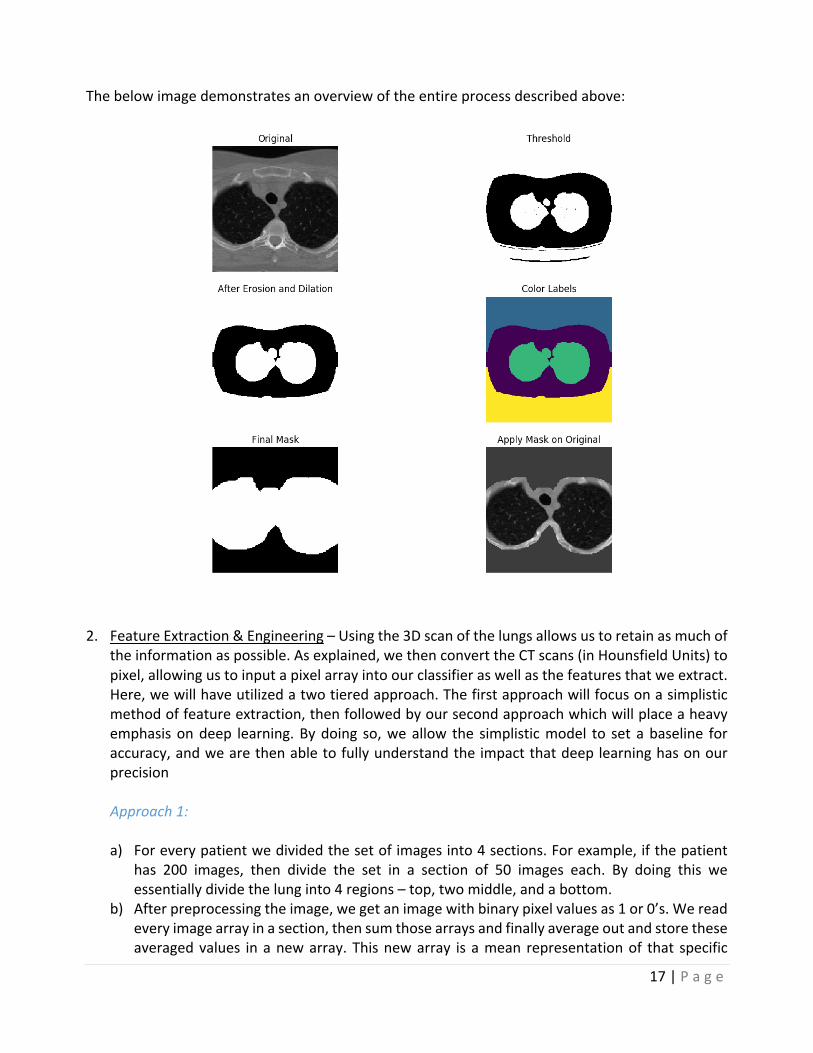
g. ErosionandDilation–Wethenapplyerosion–atechniqueforshrinkingtheimageinorder
to ensure the unwantednoise introduces further diminishes. Then,whenwedilate theimage,weregaintheoriginalsizeofthe image,keepingtheactualsizeof lungsandthenodules intact. These twoprocessesoverall reduce thenoise in the image.ExamplesofnoiseinCTscansincludeveins,capillaries,etc.
Figure 5: After erosion and dilation
h. Segmentation-MaskingoftheimageisdonebyhighlightingROI(RegionofInterest).After
gettingridofnoiseandreducingfalsepositives,theimageissegmented.Thus,amaskismade by outlining the edges of the lung (distinguishing the lung from the muscularsurroundings)aswellasthenodulescontainedwithintheorgan.WethenapplythemasktoisolatetheROI.
17|P a g e
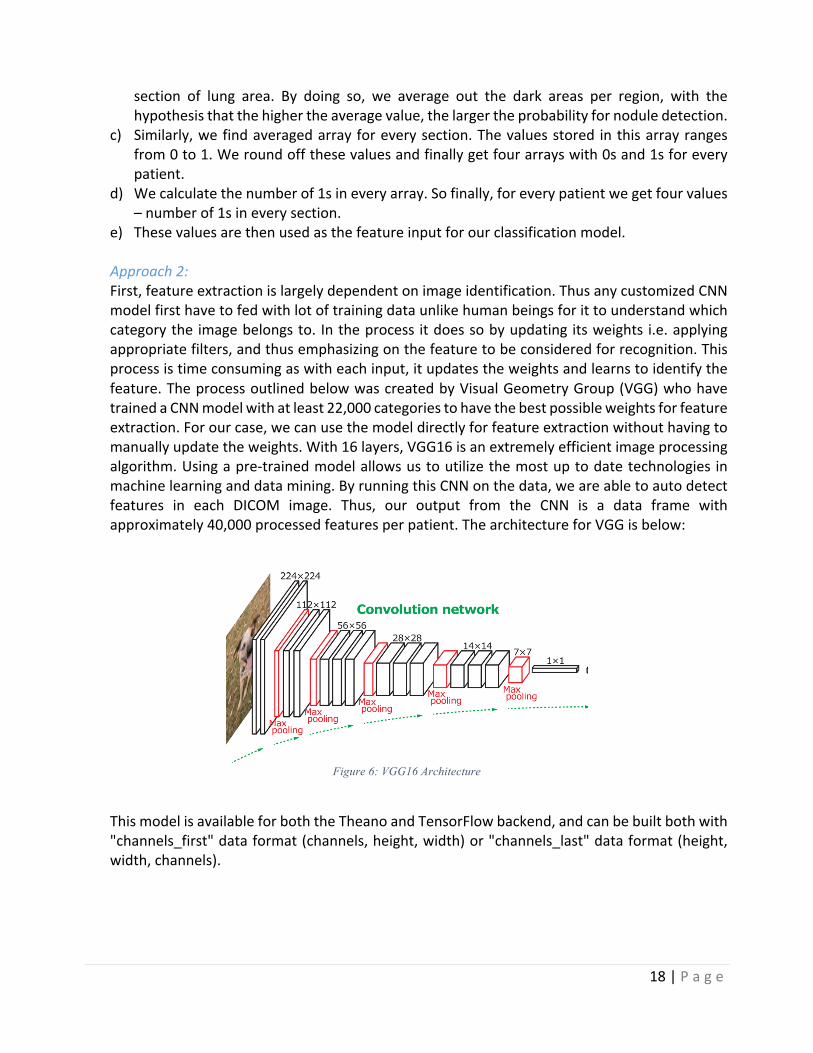
Thebelowimagedemonstratesanoverviewoftheentireprocessdescribedabove:
2. FeatureExtraction&Engineering–Usingthe3Dscanofthelungsallowsustoretainasmuchof
theinformationaspossible.Asexplained,wethenconverttheCTscans(inHounsfieldUnits)topixel,allowingustoinputapixelarrayintoourclassifieraswellasthefeaturesthatweextract.Here,wewillhaveutilizedatwotieredapproach.Thefirstapproachwillfocusonasimplisticmethodoffeatureextraction,thenfollowedbyoursecondapproachwhichwillplaceaheavyemphasisondeep learning.Bydoing so,weallow the simplisticmodel to set abaseline foraccuracy,andwearethenabletofullyunderstandtheimpactthatdeeplearninghasonourprecisionApproach1:a) Foreverypatientwedividedthesetofimagesinto4sections.Forexample,ifthepatient
has 200 images, then divide the set in a section of 50 images each. By doing this weessentiallydividethelunginto4regions–top,twomiddle,andabottom.
b) Afterpreprocessingtheimage,wegetanimagewithbinarypixelvaluesas1or0’s.Wereadeveryimagearrayinasection,thensumthosearraysandfinallyaverageoutandstoretheseaveragedvalues inanewarray.Thisnewarray isamean representationof that specific
18|P a g e
section of lung area. By doing so, we average out the dark areas per region, with thehypothesisthatthehighertheaveragevalue,thelargertheprobabilityfornoduledetection.
c) Similarly,wefindaveragedarrayforeverysection.Thevaluesstored inthisarrayrangesfrom0to1.Weroundoffthesevaluesandfinallygetfourarrayswith0sand1sforeverypatient.
d) Wecalculatethenumberof1sineveryarray.Sofinally,foreverypatientwegetfourvalues–numberof1sineverysection.
e) Thesevaluesarethenusedasthefeatureinputforourclassificationmodel.
Approach2:First,featureextractionislargelydependentonimageidentification.ThusanycustomizedCNNmodelfirsthavetofedwithlotoftrainingdataunlikehumanbeingsforittounderstandwhichcategorythe imagebelongsto. Intheprocess itdoessobyupdating itsweights i.e.applyingappropriatefilters,andthusemphasizingonthefeaturetobeconsideredforrecognition.Thisprocessistimeconsumingaswitheachinput,itupdatestheweightsandlearnstoidentifythefeature.TheprocessoutlinedbelowwascreatedbyVisualGeometryGroup(VGG)whohavetrainedaCNNmodelwithatleast22,000categoriestohavethebestpossibleweightsforfeatureextraction.Forourcase,wecanusethemodeldirectlyforfeatureextractionwithouthavingtomanuallyupdatetheweights.With16layers,VGG16isanextremelyefficientimageprocessingalgorithm.Usingapre-trainedmodelallowsustoutilizethemostuptodatetechnologies inmachinelearninganddatamining.ByrunningthisCNNonthedata,weareabletoautodetectfeatures in each DICOM image. Thus, our output from the CNN is a data frame withapproximately40,000processedfeaturesperpatient.ThearchitectureforVGGisbelow:
Figure 6: VGG16 Architecture
ThismodelisavailableforboththeTheanoandTensorFlowbackend,andcanbebuiltbothwith"channels_first"dataformat(channels,height,width)or"channels_last"dataformat(height,width,channels).

19|P a g e
3. Classification–Finally,wecan inputourdata intoaclassificationmodel.Thedataframewillhaveeachindividualpatientasarow,andthedifferentfeaturesasacolumn.Thefinalcolumninthedataframewillbeabinaryvalue:1ifthepatienthascancer,and0ifthepatientdoesnothavecancer.Forvalidationpurposes,wewilluse75%percentofouroriginaldatafortrainingtheclassifier,and25%forvalidation.Frompreviousdiscussion,wementionedwearetakingtwodifferenttracksinordertofurtheranalyzetheaccuracydifferencesbetweenusingasimplevscomplexmodel.Thus,ourclassificationstepsforbothapproachesareasfollows:Approach1:OnceourimagesareprocessedandthepixelarrayisextractedfromeachCTscanfromapproach1mentionedabove,wecan feedthedata frame intoaclusteringalgorithmtogroupsimilarpatientstogether.Assuch,usingthefourfeaturespreviouslygenerated,weutilizedtheK-Meansclustering algorithm in order to partition the ~1,500 patients into k=2 clusters – positive ornegativeforcancer–whereeachpatientwillbelongtotheclusterwiththenearestmean.Bypartitioning the data space as such,we are able to gain a preliminary understanding of thedistinguishingcharacteristicsbetweenthetwogroups.TheK-Meansalgorithmpartitionedthedataintothetwogroupswithrelativelyhighaccuracy.WewerethenabletoaddtheK-Meansclusteringclassificationasaninputparametertoournextclassificationmethod:RandomForest.SinceRandomForestsareknowntoperformwellonvarious tasks, including unscaled data and variable selection, we decided to employ thisapproachinordertounderstandtheeffectivenessofourfeatureextractionmethodology.IfourRandom Forest returns a low accuracy, we can conclude that our feature extraction is notadequate,settingabasisforourdeeplearningapproach.
Approach2:Theclassificationof thedatasetproducedbyoursecondapproachusingconvolutionneuralnetworks isdonebyamultilevelperceptron (MLP)which follows the structure in the imagebelow.
Figure 7: MLP Process

20|P a g e
Using amultilevel perceptron has various advantages, including the capability to learn bothlinearandnon-linearmodels,andmostimportantly,thecapabilitytolearnmodelsinreal-time(on-linelearning)usingpartialfit.TheMLPthenfollowsthestepshighlightedbelow:
• Checksifthereapretrainedmodeltoloaditbeforetraining.• Sequentialmodelusedfortrainingthemodel.• Modelusesreluactivationwithvariousactivationlayers• Dropoutaftereverystagetopreventoverfitting• Model is compiled with ‘binary_crossentropy’ - loss which is the best for binary
classification,optimizer–RMSPROPbeingused• Checkpointer-usedtosavethebestmodelbasedonaccuracymetrics• Aftertraining,evaluationisdonetoshowtheefficiencyofthetrainedmodel.
5.4 LANGUAGESANDTOOLSUSED:Ourprojectwillutilize libraries frombothRandpython.Wewillprimarilyusepythontodothemajorityofourdataextractionandimageprocessing,whiletheclassificationmodelswillbebuiltandanalyzedusingbothRandpython.

21|P a g e
5.5 HOWTOGENERATEOUTPUT:
Theprogramreadstheinputimage(inDICOM)andappliestheimageprocessingfunctions,followedbythepredictionalgorithminordertogeneratebinaryclassificationoflungcancerdetection.
The flow chart below describes the process taken to generate the prediction for lung cancerdetection:
5.6 HOWTOTESTAGAINSTHYPOTHESIS:Onceweacquireadataset,weintendtodivideitintotwosubsets: Training:Here,wehavetaken75%oftheentiredatasettotrainthepredictivemodel
Test:Here,wetaketheremaining25%ofthedatatoassessthelikelyfutureperformanceofthemodel.Ifourmodelfitbasedonthetrainingdatasetisamuchbetterfitthanthetestset,wewilllikelyhaveanoverfittingproblem.
Sinceourfocusisonthereductionoffalsepositives,andwewishtopreventoverfitting,wehaveaccountedforboththesecasesbyusingadropoutlayerintheneuralnetwork.Thepurposeofsuchalayeristopreventregularization–whichmayhavefalselyproducedasmoothlosecurve,butoverfitthedata,ultimatelyleadingtolowconvergence.
CollectinputdataApplyImagespreprocessingtechniques
FeatureextractionisdoneusingVFF-16CNNmodelwhich
automaticallygeneratesthelistoffeatures
FeedtheprocesseddatatotheMLPbinaryclassifierintermsof
ofbatcheswithinputdataincreasinggradually

22|P a g e
6 IMPLEMENTATION:6.1 CODE ImageProcessing&Extraction:ThefollowingpythonscriptshavebeencreatedinordertoprocesstheDICOMimagesaswellasperformthefeatureextraction:
1. settings.py2. common.py3. preprocess_step_1.py4. preprocess_step_2.py
ClassificationThefollowingpythonscriptshavebeencreated inordertoapplytheclassificationmodeltoourprocesseddataset:
1. mlp_binary_classifcation.py
Snippetsofcode:Giventhatthecodeoftheprojectistoovast,asitcontainsvariousaspectsofimageprocessingaswellasfeatureextractionandclassification,wehaveprovidedtheimportantfunctionsbelow.Thedescriptionsforthesefunctionscanbefoundinsection6.2:thedesigndocument.
preprocess_step_1.py def load_scan(src_dir): slices = [dicom.read_file(src_dir + '/' + s) for s in os.listdir(src_dir)] slices.sort(key=lambda x: int(x.InstanceNumber)) try: slice_thickness = np.abs(slices[0].ImagePositionPatient[2] - slices[1].ImagePositionPatient[2]) except: slice_thickness = np.abs(slices[0].SliceLocation - slices[1].SliceLocation) for s in slices: s.SliceThickness = slice_thickness return slices

23|P a g e
def resample(image, scan, new_spacing=[1, 1, 1]): # Determine current pixel spacing spacing = map(float, ([scan[0].SliceThickness] + scan[0].PixelSpacing)) #print spacing spacing = np.array(list(spacing)) resize_factor = spacing / new_spacing new_real_shape = image.shape * resize_factor new_shape = np.round(new_real_shape)
real_resize_factor = new_shape / image.shape new_spacing = spacing / real_resize_factor image = scipy.ndimage.interpolation.zoom(image, real_resize_factor) return image, new_spacing
def make_lungmask(img, display=False): row_size = img.shape[0] col_size = img.shape[1] mean = np.mean(img) std = np.std(img) img = img - mean if std > 0: img = img / std # Find the average pixel value near the lungs to renormalize washed out images middle = img[int(col_size / 5):int(col_size / 5*4),
int(row_size / 5):int(row_size / 5 * 4)] mean = np.mean(middle) max = np.max(img) min = np.min(img) #To improve threshold finding,move underflow and overflow to pixel spectrum img[img == max] = mean img[img == min] = mean # Use Kmeans to separate foreground(soft tissue/bone) and background(lung/air) kmeans = KMeans(n_clusters=2).fit(np.reshape(middle,
[np.prod(middle.shape), 1])) centers = sorted(kmeans.cluster_centers_.flatten()) threshold = np.mean(centers) thresh_img = np.where(img < threshold, 1.0, 0.0) # threshold the image # First erode away the finer elements, then dilate to include some of the pixels surrounding the lung as we don't want to accidentally clip the lung. eroded = morphology.erosion(thresh_img, np.ones([3, 3])) dilation = morphology.dilation(eroded, np.ones([8, 8])) labels = measure.label(dilation) # Different labels are displayed in different colors label_vals = np.unique(labels) regions = measure.regionprops(labels) good_labels = [] for prop in regions: B = prop.bbox if B[2] - B[0] < row_size / 10 * 9 and B[3] - B[1] < col_size / 10 * 9 and B[0] > row_size / 5 and B[ 2] < col_size / 5 * 4: good_labels.append(prop.label) mask = np.ndarray([row_size, col_size], dtype=np.int8) mask[:] = 0

24|P a g e
# After just the lungs are left, we do another large dilation # in order to fill in and out the lung mask for N in good_labels: mask = mask + np.where(labels == N, 1, 0) mask = morphology.dilation(mask, np.ones([10, 10])) # one last dilation mask = mask[int(col_size / 5):int(col_size / 5 * 4), int(row_size / 5):int(row_size / 5 * 4)] img = img[int(col_size / 5):int(col_size / 5 * 4), int(row_size / 5):int(row_size / 5 * 4)] masked_lung = mask * img if (display): fig, ax = plt.subplots(3, 2, figsize=[12, 12]) ax[0, 0].set_title("Original") ax[0, 0].imshow(img, cmap='gray') ax[0, 0].axis('off') ax[0, 1].set_title("Threshold") ax[0, 1].imshow(thresh_img, cmap='gray') ax[0, 1].axis('off') ax[1, 0].set_title("After Erosion and Dilation") ax[1, 0].imshow(dilation, cmap='gray') ax[1, 0].axis('off') ax[1, 1].set_title("Color Labels") ax[1, 1].imshow(labels) ax[1, 1].axis('off') ax[2, 0].set_title("Final Mask") ax[2, 0].imshow(mask, cmap='gray') ax[2, 0].axis('off') ax[2, 1].set_title("Apply Mask on Original") ax[2, 1].imshow(mask * img, cmap='gray') ax[2, 1].axis('off') plt.show() masked_lung = mask * img return masked_lung
25|P a g e
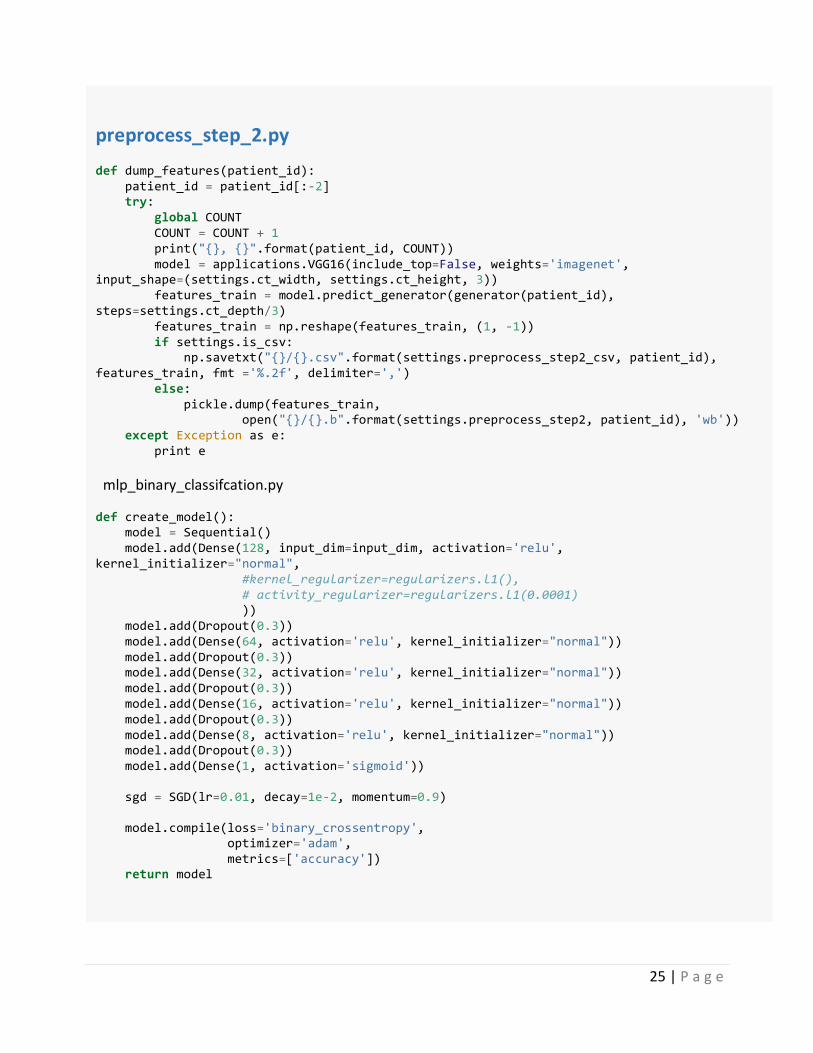
preprocess_step_2.py def dump_features(patient_id): patient_id = patient_id[:-2] try: global COUNT COUNT = COUNT + 1 print("{}, {}".format(patient_id, COUNT)) model = applications.VGG16(include_top=False, weights='imagenet', input_shape=(settings.ct_width, settings.ct_height, 3)) features_train = model.predict_generator(generator(patient_id), steps=settings.ct_depth/3) features_train = np.reshape(features_train, (1, -1)) if settings.is_csv: np.savetxt("{}/{}.csv".format(settings.preprocess_step2_csv, patient_id), features_train, fmt ='%.2f', delimiter=',') else: pickle.dump(features_train, open("{}/{}.b".format(settings.preprocess_step2, patient_id), 'wb')) except Exception as e: print e mlp_binary_classifcation.py def create_model(): model = Sequential() model.add(Dense(128, input_dim=input_dim, activation='relu', kernel_initializer="normal", #kernel_regularizer=regularizers.l1(), # activity_regularizer=regularizers.l1(0.0001) )) model.add(Dropout(0.3)) model.add(Dense(64, activation='relu', kernel_initializer="normal")) model.add(Dropout(0.3)) model.add(Dense(32, activation='relu', kernel_initializer="normal")) model.add(Dropout(0.3)) model.add(Dense(16, activation='relu', kernel_initializer="normal")) model.add(Dropout(0.3)) model.add(Dense(8, activation='relu', kernel_initializer="normal")) model.add(Dropout(0.3)) model.add(Dense(1, activation='sigmoid')) sgd = SGD(lr=0.01, decay=1e-2, momentum=0.9) model.compile(loss='binary_crossentropy', optimizer='adam', metrics=['accuracy']) return model
26|P a g e
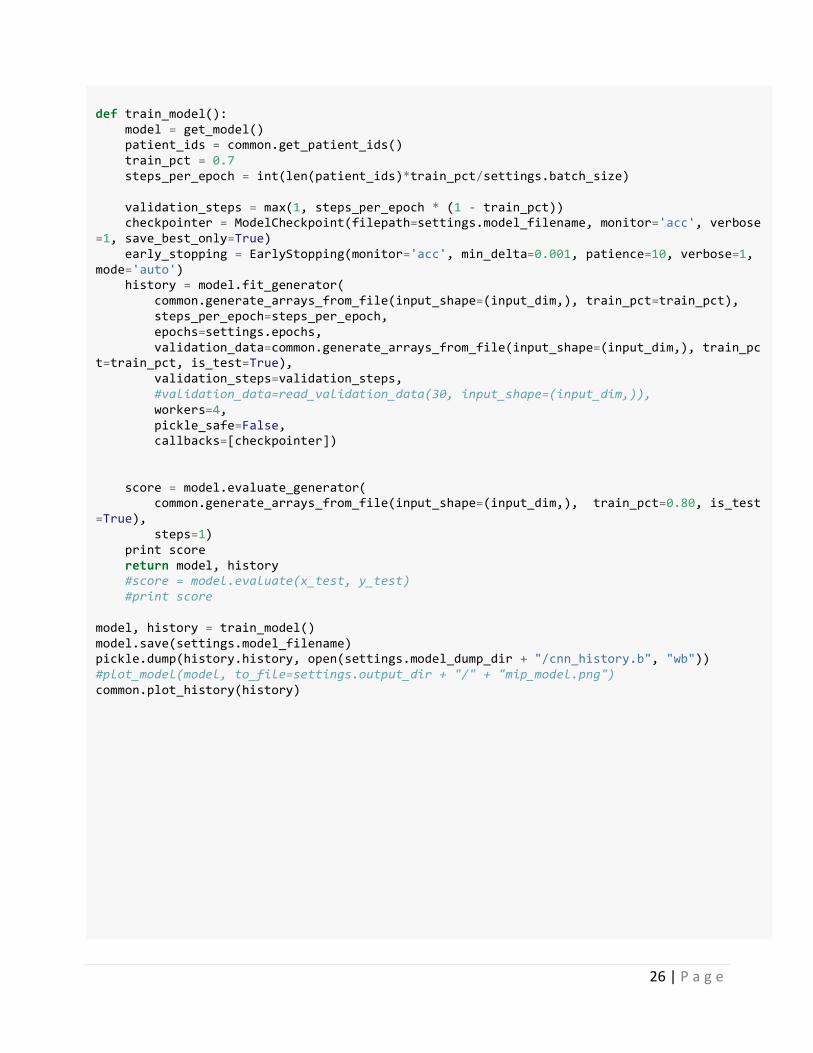
def train_model(): model = get_model() patient_ids = common.get_patient_ids() train_pct = 0.7 steps_per_epoch = int(len(patient_ids)*train_pct/settings.batch_size) validation_steps = max(1, steps_per_epoch * (1 - train_pct)) checkpointer = ModelCheckpoint(filepath=settings.model_filename, monitor='acc', verbose=1, save_best_only=True) early_stopping = EarlyStopping(monitor='acc', min_delta=0.001, patience=10, verbose=1, mode='auto') history = model.fit_generator( common.generate_arrays_from_file(input_shape=(input_dim,), train_pct=train_pct), steps_per_epoch=steps_per_epoch, epochs=settings.epochs, validation_data=common.generate_arrays_from_file(input_shape=(input_dim,), train_pct=train_pct, is_test=True), validation_steps=validation_steps, #validation_data=read_validation_data(30, input_shape=(input_dim,)), workers=4, pickle_safe=False, callbacks=[checkpointer]) score = model.evaluate_generator( common.generate_arrays_from_file(input_shape=(input_dim,), train_pct=0.80, is_test=True), steps=1) print score return model, history #score = model.evaluate(x_test, y_test) #print score model, history = train_model() model.save(settings.model_filename) pickle.dump(history.history, open(settings.model_dump_dir + "/cnn_history.b", "wb")) #plot_model(model, to_file=settings.output_dir + "/" + "mip_model.png") common.plot_history(history)
27|P a g e
6.2 DESIGNDOCUMENT:
DocumentationofFunctionsUsed:
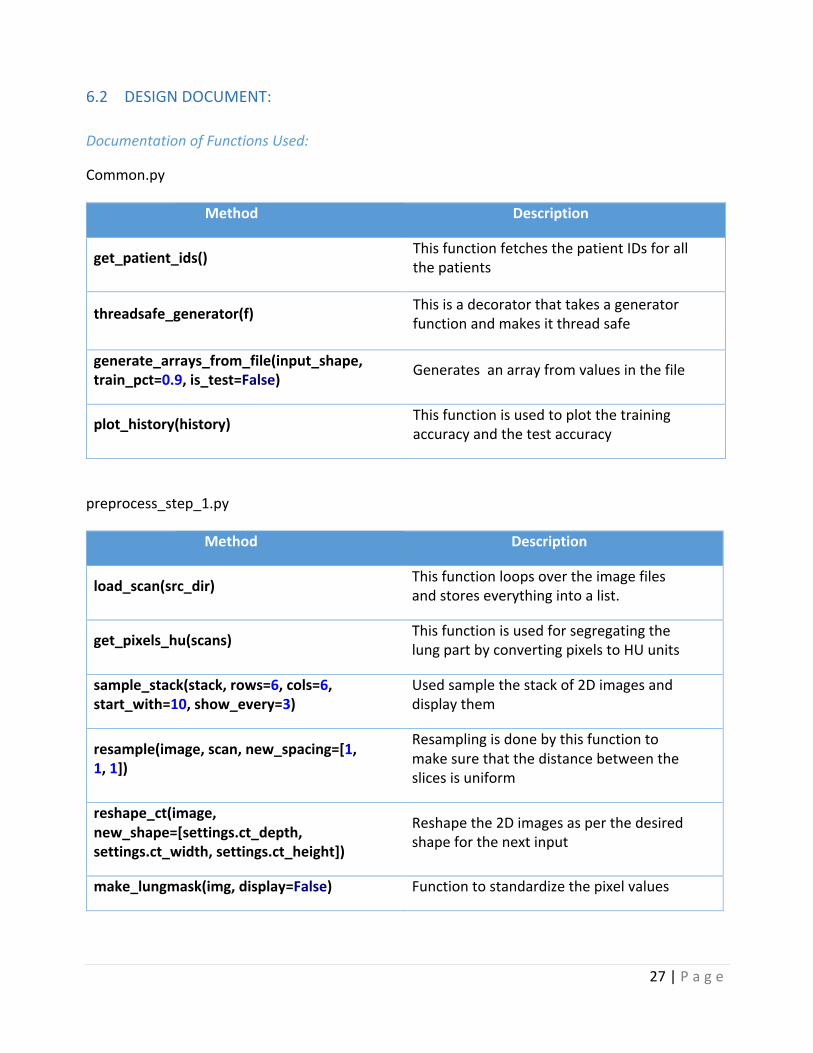
Common.py
Method Description
get_patient_ids() ThisfunctionfetchesthepatientIDsforallthepatients
threadsafe_generator(f) Thisisadecoratorthattakesageneratorfunctionandmakesitthreadsafe
generate_arrays_from_file(input_shape,train_pct=0.9,is_test=False) Generatesanarrayfromvaluesinthefile
plot_history(history) Thisfunctionisusedtoplotthetrainingaccuracyandthetestaccuracy
preprocess_step_1.py
Method Description
load_scan(src_dir) Thisfunctionloopsovertheimagefilesandstoreseverythingintoalist.
get_pixels_hu(scans) ThisfunctionisusedforsegregatingthelungpartbyconvertingpixelstoHUunits
sample_stack(stack,rows=6,cols=6,start_with=10,show_every=3)
Usedsamplethestackof2Dimagesanddisplaythem
resample(image,scan,new_spacing=[1,1,1])
Resamplingisdonebythisfunctiontomakesurethatthedistancebetweentheslicesisuniform
reshape_ct(image,new_shape=[settings.ct_depth,settings.ct_width,settings.ct_height])
Reshapethe2Dimagesasperthedesiredshapeforthenextinput
make_lungmask(img,display=False) Functiontostandardizethepixelvalues
28|P a g e
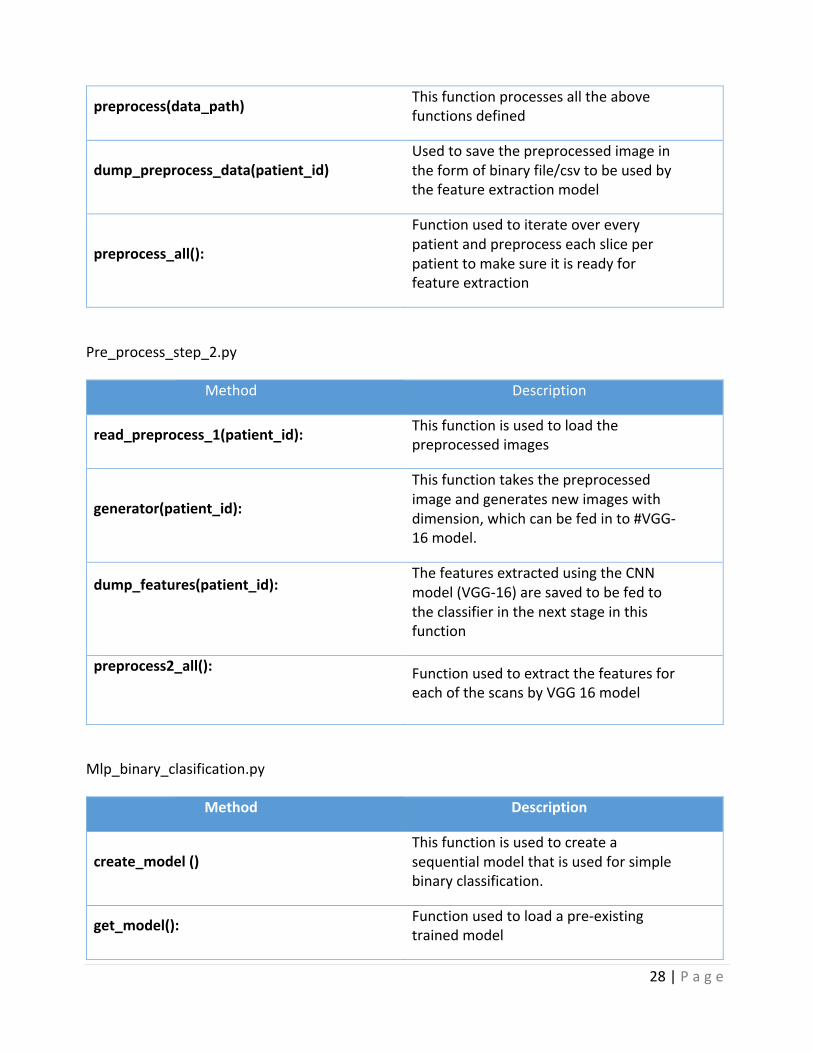
preprocess(data_path) Thisfunctionprocessesalltheabovefunctionsdefined
dump_preprocess_data(patient_id)Usedtosavethepreprocessedimageintheformofbinaryfile/csvtobeusedbythefeatureextractionmodel
preprocess_all():
Functionusedtoiterateovereverypatientandpreprocesseachsliceperpatienttomakesureitisreadyforfeatureextraction
Pre_process_step_2.py
Method Description
read_preprocess_1(patient_id): Thisfunctionisusedtoloadthepreprocessedimages
generator(patient_id):
Thisfunctiontakesthepreprocessedimageandgeneratesnewimageswithdimension,whichcanbefedinto#VGG-16model.
dump_features(patient_id):
ThefeaturesextractedusingtheCNNmodel(VGG-16)aresavedtobefedtotheclassifierinthenextstageinthisfunction
preprocess2_all():
FunctionusedtoextractthefeaturesforeachofthescansbyVGG16model
Mlp_binary_clasification.py
Method Description
create_model()Thisfunctionisusedtocreateasequentialmodelthatisusedforsimplebinaryclassification.
get_model(): Functionusedtoloadapre-existingtrainedmodel

29|P a g e
train_model():
Thisfunctiongetapretrainedmodelifpresentorcreatesatrainingmodelandthentrainsitinepochs(asperthenumberofepochsmentioned)
evaluate_model(): Oncethemodelistrained,thisfunctionisusedtoevaluatethetestdata
30|P a g e
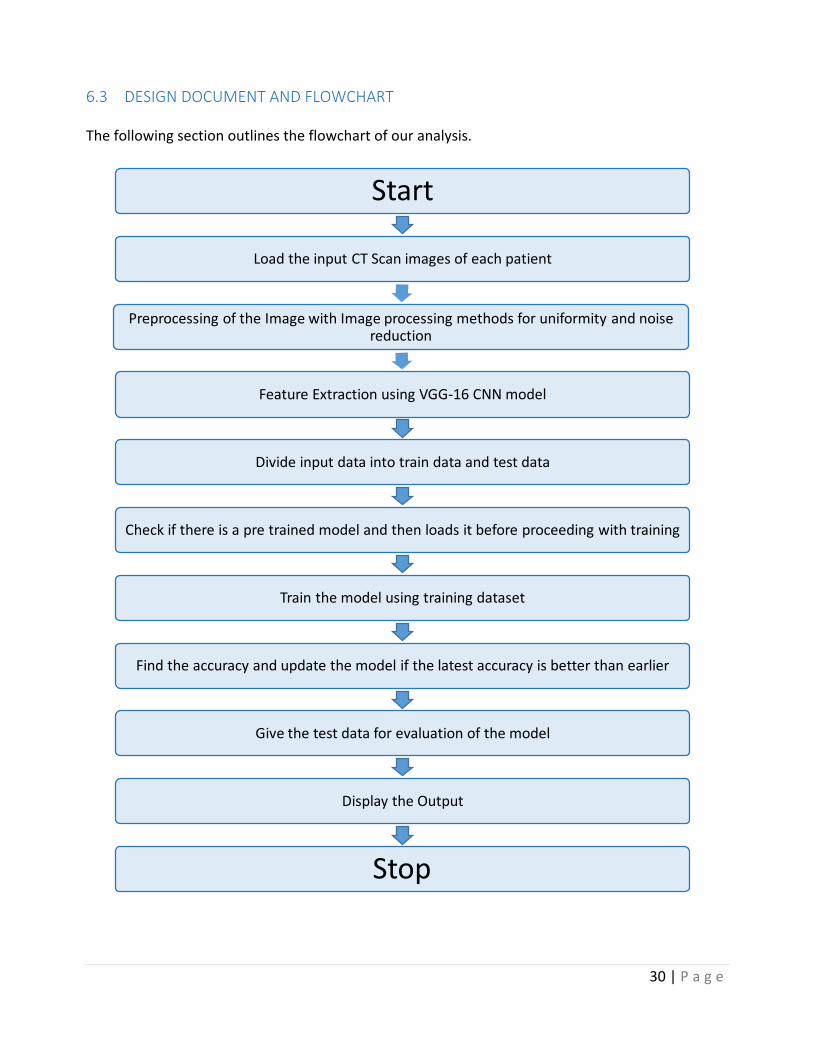
6.3 DESIGNDOCUMENTANDFLOWCHART Thefollowingsectionoutlinestheflowchartofouranalysis.
Start
Loadtheinput CTScanimagesofeachpatient
PreprocessingoftheImagewithImageprocessingmethods foruniformityandnoisereduction
FeatureExtractionusingVGG-16CNNmodel
Divideinputdataintotraindataandtestdata
Checkifthereisapretrainedmodelandthenloadsitbeforeproceedingwithtraining
Trainthemodelusingtrainingdataset
Findtheaccuracyandupdatethemodelifthelatestaccuracyisbetterthanearlier
Givethetestdataforevaluationofthemodel
DisplaytheOutput
Stop
31|P a g e
7 DATAANALYSISANDDISCUSSION7.1 OUTPUTGENERATION:TheprogramreadstheinputofaCTscanintheformofaDICOMimageperpatient,andappliesthepredictionalgorithmtoittogeneratetheoutput.Theimagesare2DslicesoftheCTscan.Wethentrainthemodelandanalyzetheaccuracyagainsttheactualresultforeachpatient(i.e.cancerousornon-cancerous).Wethenfindthedifferenceoftheoutputsandupdatetheweightsby-30%toavoidoverfitting.Thefinaloutputofouralgorithmisaclassificationofeachpatientaseitherpositiveornegativeforcancer.Thisoutputisgeneratedforallselectedpatients.7.2 OUTPUTANALYSIS: Approach 1:Aspreviouslymentioned,ourfirstapproachutilizestheRandomForestclassifieronthesimplisticfeatureextractionmodel.Assuch,theconfusionmatrixisasfollows:
PREDICTED:NOCANCER PREDICTED:YESCANCERACTUAL:NOCANCER 301 383ACTUAL:YESCANCER 117 128
Here,confusionmatrixdisplaysthetotalnumberofcorrectandincorrectpredictionsmadebytheclassificationmodelincomparisontotheactualoutcomes.Forourpurposes,theperformanceofourmodelswillbeevaluatedusingthedatainthematrix.Fromtheaboveoutput,wecanseethatoutof684patientswhodidnothavecancer,383werepredictedincorrectly, indicatingthatourfalse positive rate is 56%. Similarly, out of the 245 patients who have cancer, only 128 werepredictedcorrectly,indicatingthatourfalsenegativerateis47%.Aswecansee,theaboveinputindicatesthatourfeatureextractionprocessisclearlyinadequatefordetectinglungcancernodules.Ouraccuracyrateisaround50%forboththefalsepositivesandfalsenegatives,andthus,wecanconcludethatthesimplisticmodelbasedonhigh-levelfeatureextractionandbasicclassificationisnotabletopredictlungcancernodulesatadesirableaccuracy.However,thesimplisticapproachprovidesuswithabaselineforfurtheranalysis.Asweproceedtoanalyzeourmorecomplexmodelinvolvingapre-trainedfeatureextractionconvolutionalneuralnetwork,wecanjudgeouraccuracynotonlybyarawpercentage,butalsoasarelativeincreasecomparedtooursimplisticmodel.Approach 2:Now,aswemoveforwardwiththedeeplearningapproachaspreviouslymentioned,weusedaconvolutionalneuralnetworktoclassifypatientsaseithercancerousornon-cancerous.Throughtheprocessoftrainingtheclassifier,welookattheepochoutputasfollowed:Ateachstep,theCNNcalculatestheEstimateTimeofArrival,loss,accuracyineachstage,totaltime,totallossandtotalaccuracyforentirestep.Sampleoutputisfoundbelow:
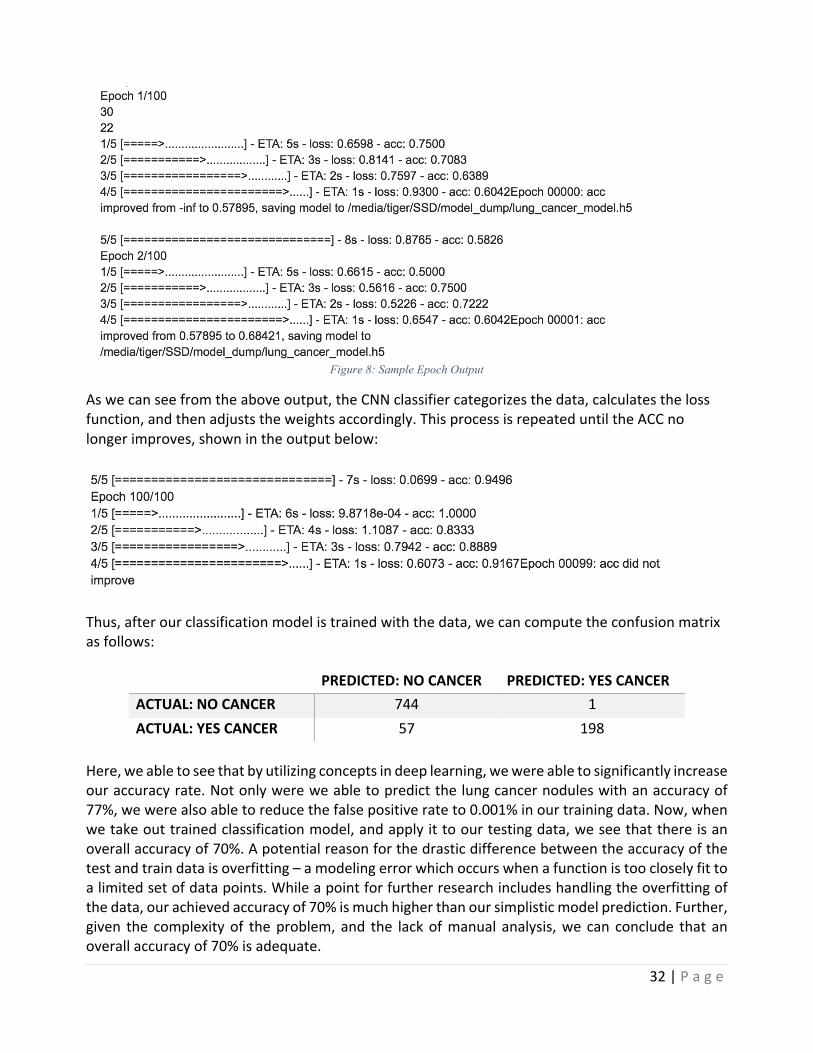
32|P a g e
Figure 8: Sample Epoch Output
Aswecanseefromtheaboveoutput,theCNNclassifiercategorizesthedata,calculatesthelossfunction,andthenadjuststheweightsaccordingly.ThisprocessisrepeateduntiltheACCnolongerimproves,shownintheoutputbelow:
Thus,afterourclassificationmodelistrainedwiththedata,wecancomputetheconfusionmatrixasfollows:
PREDICTED:NOCANCER PREDICTED:YESCANCERACTUAL:NOCANCER 744 1ACTUAL:YESCANCER 57 198
Here,weabletoseethatbyutilizingconceptsindeeplearning,wewereabletosignificantlyincreaseouraccuracyrate.Notonlywereweabletopredictthelungcancernoduleswithanaccuracyof77%,wewerealsoabletoreducethefalsepositiverateto0.001%inourtrainingdata.Now,whenwetakeouttrainedclassificationmodel,andapplyittoourtestingdata,weseethatthereisanoverallaccuracyof70%.Apotentialreasonforthedrasticdifferencebetweentheaccuracyofthetestandtraindataisoverfitting–amodelingerrorwhichoccurswhenafunctionistoocloselyfittoalimitedsetofdatapoints.Whileapointforfurtherresearchincludeshandlingtheoverfittingofthedata,ourachievedaccuracyof70%ismuchhigherthanoursimplisticmodelprediction.Further,given the complexityof theproblem, and the lackofmanual analysis,we can conclude that anoverallaccuracyof70%isadequate.
33|P a g e
7.3 COMPAREOUTPUTAGAINSTHYPOTHESIS The efficiency of the model depends on the preprocessing, the feature extraction and theclassificationmodel.Italsolargelydependsonthedatasetused,thequalityofCTscanimagesandalsothevolumeofdataorthenumberofpatients.Withincreasingrateoflungcancerwithtime,moredatawillbeavailableandthusitcanimprovetheefficiencyofthemodelaccordingly.Withthedatasetofaround1,500patientswithlowdoseCTscanimages(thathasaround300imagesperpatient)where75%ofdataistakenasinputand25%asoutput,wemanagedtogeta90%accuracywith our training data and a 70% accuracy rate with our test data with complete automatedpulmonarynoduledetection.7.4 ABNORMALCASEEXPLANATIONSince thedata availablewasof lowdoseCT scan, the imagequality could alsohavepotentiallyaffected the efficiency. With the advancement of technology, better CT scanners have beendevelopedwhichcouldtakeCTscanswithultimateprecisionandimagequality,hencebeingabetterinputforthemodel.7.5 DISCUSSION:We selected 1,000 patients to train our CNN classificationmodel, and used the remaining 200patientstotestthealgorithm.Manyiterationsortestingvariousparameterswereattemptedbeforeconcludingwiththeabovemodel.Asseen,wemayhaveapotentialproblemwithoverfitting,butfornow,wewillconcludethatourmodelisadequateforpredictingthedetectionoflungcancernodules.
34|P a g e
8 CONCLUSIONANDRECOMMENDATIONS8.1 SUMMARYANDCONCLUSIONS:Inthispaper,westudytheuseofimageprocessing,datamining,andmachinelearningtechniquestopredictlungcancernodulesinhighriskpatients.Basedontheresearchandanalysisconductedfor this project using a publicly available data set of lung CT scans,wewere able to develop asuccessful model for lung cancer nodule detection. By using a hybrid of approaches in imageprocessing and classification,wewere able todevelop anend to endprocess that detects lungcancernoduleswithhighaccuracy.Further,byplacingaheavyemphasisonautomationofimageprocessingaswellasareductionoffalsepositives,wewereabletodevelopafullmodelthatrunswith 70% accuracy on test data. Given the difficult nature of the problem, we faced variouschallengesthroughouttheprocess.First,thesegmentationoflungsisaverychallengingproblemduetoinhomogeneityinthelungregion,pulmonarystructuresofsimilardensitiessuchasarteries,veins,bronchi,andbronchioles,anddifferentscannersandscanningprotocolsanddifference inqualityoftheCTscans,theimageshadtobemadeuniformbeforeprocessing.TheCTscansbeinginhundredsofimagesperpatienthadamemoryconstraintwhileprocessingandalsowasatimeconsumingprocesssincedataperpatientwasrelativelyhigh(around300imagesperpatientwitharound1,500patients).8.2 RECOMMENDATIONSFORFUTURESTUDIES: Forfeatureextraction,wehaveuseVGG16thesimplicityofthemodelmakesiteasytoimplement.However, there are other pre-trained CNN models available too for feature extraction. Forcomplicatedprocesslikeimageclassification,manyotherdeeplearningtechnologiesareproposed.Ateachstage,onecoulduseanovelapproachtoretainthemaximumfeatures,whichwouldoveralllead toabettermodel.Otherpre-trainedmodelscouldbeused likeResnet,Googlenet,etc. forfeature extraction and othermodules for deep learning could be combined with deferent lossfunction, layers and optimization techniques for better results. As previously mentioned, ourclassificationmodelispotentiallyoverfittingthedata,andthus,thereexistsaclearopportunitytoresearchdifferentmethodologies to combat thisproblem.Finally, the imageclassificationbeingused is MLP classifier with sequential model, however, other regularization techniques andfunctionscouldbeexploredtoupdateweightsinordertoincreasetheaccuracyofthemodel.

35|P a g e
8.3 BIBLIOGRAPHY
"1.17.NeuralNetworkModels(supervised)"1.17.NeuralNetworkModels(supervised)—Scikit-learn0.18.1Documentation.Google,n.d.Web.12June2017.
AmericanCancerSociety.Cancerfactsandfigures,2015.URLhttp://www.
cancer.org/research/cancerfactsstatistics/index.Bechtold,RobertE.,MichaelY.M.Chen,DavidJ.Ott,RonaldJ.Zagoria,EricS.Scharling,NeilT.
Wolfman,andDavidJ.Vining."InterpretationofAbdominalCT:AnalysisofErrorsandTheirCauses."JournalofComputerAssistedTomography21.5(1997):681-85.Web.
Chauhan,Divya,andVarunJaiswal."AnEfficientDataMiningClassificationApproachforDetecting
LungCancerDisease."2016InternationalConferenceonCommunicationandElectronicsSystems(ICCES)(2016):n.pag.Web.
"GettingStartedwiththeKerasSequentialModel."GuidetotheSequentialModel-Keras
Documentation.N.p.,n.d.Web.12June2017.Golan,Rotem,ChristianJacob,andJorgDenzinger."LungNoduleDetectioninCTImagesUsing
DeepConvolutionalNeuralNetworks."2016InternationalJointConferenceonNeuralNetworks(IJCNN)(2016):n.pag.Web.
Hawkins,SamuelH.,JohnN.Korecki,YoganandBalagurunathan,YuhuaGu,VirendraKumar,
SatrajitBasu,LawrenceO.Hall,DmitryB.Goldgof,RobertA.Gatenby,andRobertJ.Gillies."PredictingOutcomesofNonsmallCellLungCancerUsingCTImageFeatures."IEEEAccess2(2014):1418-426.Web.
Jafar,Iyad,HaoYing,AnthonyF.Shields,andOttoMuzik."ComputerizedDetectionofLung
TumorsinPET/CTImages."2006InternationalConferenceoftheIEEEEngineeringinMedicineandBiologySociety(2006):n.pag.Web.
Juma,Kassimu,MaHe,andYueZhaoc."LungCancerDetectionandAnalysisUsingDataMining
Techniques,PrincipalComponentAnalysisandArtificialNeuralNetwork."AmericanScientificResearchJournalforEngineering,Technology,andSciences(n.d.):n.pag.Web.
Kuruvilla,Jinsa,andK.Gunavathi."LungCancerClassificationUsingNeuralNetworksforCT
Images."ComputerMethodsandProgramsinBiomedicine113.1(2014):202-09.Web.Paul,Rahul,SamuelH.Hawkins,LawrenceO.Hall,DmitryB.Goldgof,andRobertJ.Gillies.
"CombiningDeepNeuralNetworkandTraditionalImageFeaturestoImproveSurvivalPredictionAccuracyforLungCancerPatientsfromDiagnosticCT."2016IEEEInternationalConferenceonSystems,Man,andCybernetics(SMC)(2016):n.pag.Web.

36|P a g e
Rao,R.Bharat,JinboBi,GlennFung,MarcosSalganicoff,NancyObuchowski,andDavidNaidich."LungCAD."Proceedingsofthe13thACMSIGKDDInternationalConferenceonKnowledgeDiscoveryandDataMining-KDD'07(2007):n.pag.Web.
Raschka,Sebastian."KDnuggets."KDnuggetsAnalyticsBigDataDataMiningandDataScience.
N.p.,n.d.Web.12June2017.Rosebrock,Adrian."ImageNet:VGGNet,ResNet,Inception,andXceptionwith
Keras."PyImageSearch.Pyimagesearch,03May2017.Web.12June2017.Srivastava,Nitish,GeoffreyHinton,AlexKrizhevsky,IlyaSutskever,andRuslanSalakhutdinov.
"Dropout:ASimpleWaytoPreventNeuralNetworksfromOverfitting."JournalofMachineLearningResearch(2014):n.pag.Web.
Ypsilantis,Petros-Pavlos,andGiovanniMontana."RecurrentConvolutionalNetworksfor
PulmonaryNoduleDetectioninCTImaging."(2016):1-36.Https://arxiv.org/pdf/1609.09143.pdf.Web.May2017.
Zisserman,Andrew,andKarenSimonyan."VeryDeepConvolutionalNetworksforLarge-Scale
VisualRecognition."VisualGeometryGroupHomePage.VisualGeometryGroupDepartmentofEngineeringScience,UniversityofOxford,n.d.Web.12June2017.
37|P a g e
8.4 PROGRAMFLOWCHART Theprogramflowchartcanbefoundinsection6.3anddetailedinstructionsforrunningthecodecanbefoundinthesubmittedREADMEfile.
8.5 PROGRAMSOURCECODEWITHDOCUMENTATION Thecodecanbefoundinthesubmittedfiles,alongwithaREADMEfilecontainingthefulldocumentation.
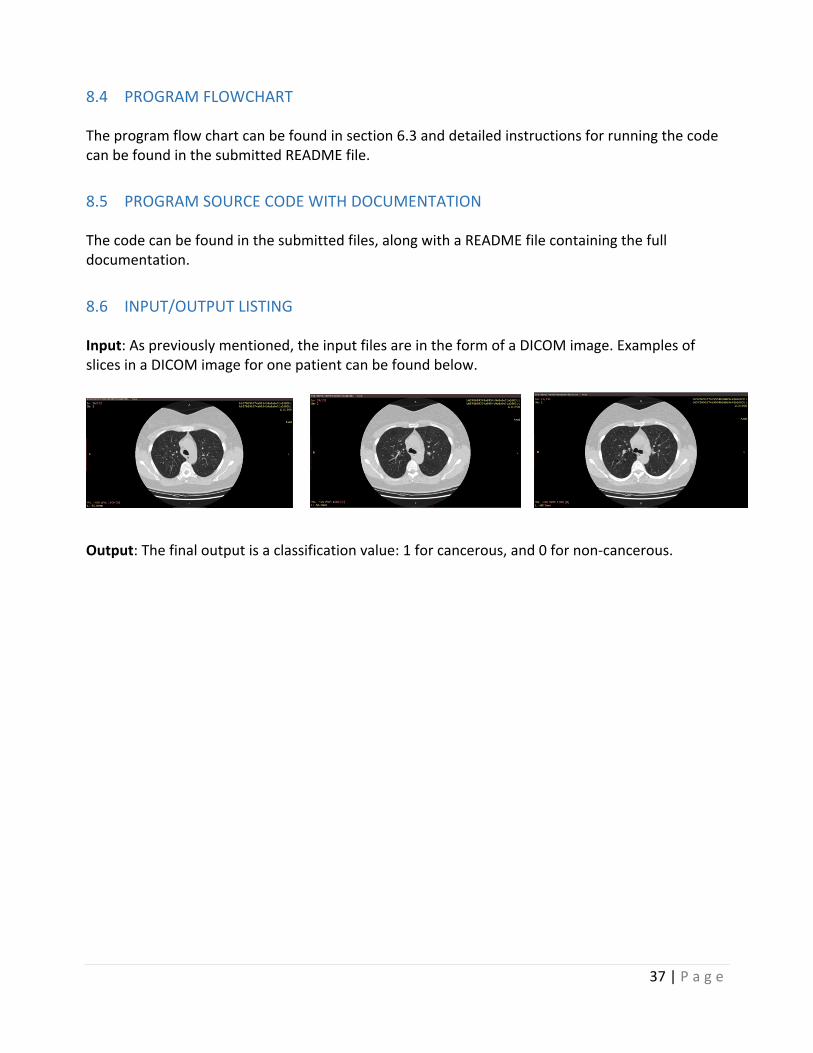
8.6 INPUT/OUTPUTLISTING Input:Aspreviouslymentioned,theinputfilesareintheformofaDICOMimage.ExamplesofslicesinaDICOMimageforonepatientcanbefoundbelow.
Output:Thefinaloutputisaclassificationvalue:1forcancerous,and0fornon-cancerous.