Embed Size (px)
Citation preview
Applied Geography (1987), 7, 289-301
Automated flash flood warning systems
Rutherford H. Platt
Department of Geology and Geography, University of Massachusetts, Amherst, MA 01003, USA
and Scott A. Cahail
Region XII Council of Governments, Carroll, IA 51401, USA
Abstract
The hazard of flash flooding, affecting both remote upland stream valleys and urbanizing metropolitan watersheds, poses a need for rapid identification and analysis of sudden changes in stream flow to allow timely public warning. Since 1976, the US National Weather Service (NWS), in cooperation with various regional authorities, has developed a new, low-cost system in response to this need. This system, known as ALERT (Automated Local Evaluation in Real Time) employs stream and rain gauges equipped with self-activating radio transmitters which communicate with a central microcomputer. Using software calibrated to the watershed in question, predictions of downstream flood levels may be rapidly generated. This paper reviews the origins and technology of ALERT systems and reports on the experiences to date of 32 system users. The survey found a high level of satisfaction with ALERT, but uncertainty concerning the reliability of the systems, since few have yet been tested in actual flash floods.
Introduction
Automated flash flood warning systems comprise an important new tool in flood loss mitigation in the United States. Over 40 such systems are now established in juris- dictions as diverse as Maricopa County, Arizona and Westchester County, New York. While system design and software are individual to specific user needs, the National Weather Service (NWS) has developed and promoted a basic methodology and software package known as ‘Automated Local Evaluation in Real Time’ (ALERT). This has become the most prevalent form of automated warning system now in use. This paper reviews the evolution of the ALERT concept, describes its various components, and then discusses the results of a survey of user experiences.
Origins of the ALERT concept
Federal assumption of responsibility for flood forecasting and warning services is long standing in the US. A River and Flood Warning Service was established in 1873 (Hughes 1970) and incorporated into the Weather Bureau of the US Department of Agriculture in 1890. Gradually, the function of river forecasting was decentralized to regional and district offices responsible for specific river basins. In 1940, the Weather Bureau was transferred to the Department of Commerce, where it remains today as the National Weather Service. Thirteen River Forecast Centers located throughout the country coordinate the hydrological forecasting efforts of the Weather Service Forecast Offices and the Weather Service Offices.
0143-6228/87/040289-12 $03.00 0 1987 Butterworth & Co (Publishers) Ltd
290 Automated flash flood warning systems
To supplement its normal river and flood forecasting services, the NWS in the 1970s developed the Local Flash Flood Warning System (LFFWS). When a community enters the programme, it establishes with the guidance of the local River District Office a network of rainfall and river observing stations. A community ‘warning representative’ is appointed to collect the data and to prepare a simplified forecast based on a procedure developed by the River Forecast Center for each participating community. The warning representative conveys the forecast to appropriate authorities for dissemination to the public in the form of flash flood warnings.
An alternative to the human-based LFFWS is an instrument-orientated Flash Flood Alarm System (FFAS). This system basically involves one or more stream flow sensors installed upstream from the community at risk. The sensor is connected to an alarm in the community via the telephone line. By 1979, the NWS had assisted 65 communities in establishing FFASs.
Some 3000 communities are currently served by NWS flood forecasting and warning services. In most cases, however, the NWS cannot ensure advance warning of a flash flood. In 1982, a NWS report stated that:
. . . more than 70 per cent of flash flood warnings have less than one-hour lead time; while more than 50 per cent of flash flood warnings have no lead time-flooding has already occurred (National Weather Service 1982).
The several local flood warning systems already in use have experienced uneven levels of effectiveness in attempting to mitigate the flash flood problem. A flash flood warning system must provide reliable, accurate, and timely forecasts to save lives and movable property. The systems described above lack these character- istics.
California in particular has served as a laboratory for the development of automated flash flood warning systems. Extreme flash flooding problems are experienced due to a combination of climatic, physical, and settlement charac- teristics. When a weather system comes ashore on the California coast, orographic uplifting caused by the Coastal Range induces precipitation in watersheds draining to the Pacific. Serious local flooding may develop quickly, as occurred during the storms of March 1986. The normally dry gulches in desert areas of southeastern California are also subject to flash flooding, this time from intense cloudbursts.
Because of the great potential for flash flooding in California, during the 1970s NWS forecasters in Sacramento sought to improve the timeliness of their warnings. For this purpose, they identified three components needed for an integrated flash flood warning system. First, improved models were required to facilitate rapid analysis of developing flash flood conditions. Secondly, real-time precipitation and stream-level sensors were needed to indicate changes in stream flow. Thirdly, a central computer was needed to collect and analyse the data and to run the model from which a forecast could be generated.
In 1976 the Sacramento River Forecast Center established the first experimental automated system (Burnash 1982). It consisted of ten gauges located above Folsom Dam in the upper American River Basin. This was followed by a second system in Monterey County after the Big Sur forest fire of 1977. A third system was developed for Ventura County in 1979 in response to severe flooding in March 1978. The area covered by the latter system was tripled in as many years (Burnash et al. 1983: 11). In 1981 NWS named its new flash flood detection system ‘Automated Local Evaluation in Real Time’ (ALERT).
Rutherford H. Piatt and Scott A. Cahail 291
Elements of the system
ALERT systems are intended to be locally owned and operated under technical guidance from NWS. To be accepted locally, the systems must be economical to install and maintain, and simple to operate. The following section summarizes the principal elements of the ALERT system.
Automated sensors
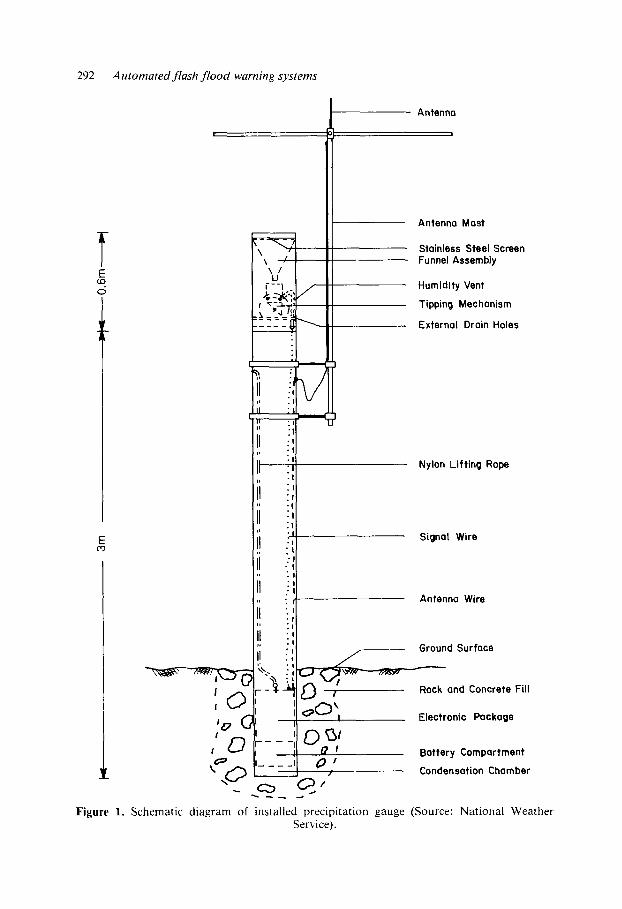
ALERT rain and streamflow sensors constitute a major improvement over previous sensors in that they do not require interrogation and no manpower is needed to collect the data because the gauges are self-actuating. Changes in precipitation or streamflow are automatically transmitted to a central computer facility. An ALERT precipitation gauge is about 4m in height with 1 m buried in the ground (Fig. 1). The buried portion provides a solid base and protects the electronics package from weather extremes. The height of the gauge discourages vandals, reduces the effects of surrounding vegetation, and supports the antenna.
An opening near the top of the gauge allows precipitation to enter. A 30-cm opening compensates for the pressure jump effect which is common with smaller openings (Burnash and Twedt 1978). Precipitation is caught in an aluminium funnel which is protected by a stainless steel screen. The precipitation passes through the funnel into a tipping-bucket mechanism. When the bucket receives 1 mm of precipita- tion, it tips, causing the radio transmitter to transmit a two-digit gauge identification number and a two-digit rainfall accumulation value. If the gauge is not receiving any rainfall, it has a clock that sends regular check signals to indicate proper system operation.
Several types of water-level sensors may be utilized. The most common river gauge used in ALERT systems is the bubbler type, which is especially well suited to the rough terrain of headwater areas where a stilling well is impracticable. The sensor itself can be located a short distance from the stream upon stable ground.
The bubbler-type river gauge consists of four major parts: the gas-purge system, the manometer assembly, the liquid level, and the radio transmitter. A length of plastic tubing leads from the gas bubbler and is anchored into the stream bed. Air from a dry nitrogen supply is metered through the bubbler and tube. The changing head (water level) above the bubbler orifice causes a pressure change which alters the manometer fluid level. When pre-selected incremental changes in stream level occur, the transmitter is activated and data are sent (NWS 1983:13).
If a stilling well is present or can be built, the cheaper float-type water-level sensor can be used. As the float rises or falls in a stilling well, a set of magnetic switches senses each incremental change. Each change causes the automatic transmission of data and of a station identification number.
Sensor communications
Reliable radio communication links are crucial to the effectiveness of the ALERT system. Very brief radio signals from remote sensors are utilized to allow a large number of sensors to operate on the same frequencies with little chance of radio interference from simultaneous transmissions. Also, step sizes (increments in sensor readings) must be small enough to provide an adequate record of changing conditions and yet sufficiently large that rapid changes at a sensor do not generate too much radio traffic (Burnash 1982).
292 Automated flash flood warning systems
1~ Antenna
-___ w ii :!
pi
I
il
#i
ii ii ii ii
Antenna Mast
Stainless Steel Screen Funnel Assembly
Humidity Vent
Tipping Mechanism
External Drain Hales
Nylon Lifting Rape
: 1
:’ .I
:’ .I
Signal Wire
Antenna Wire
Ground Surface
II II U’ Battery Compartment - _. . Conaensatlon CnamDer
Figure 1. Schematic diagram of installed precipitation gauge (Source: National Weather Service).
Rutherford H. Platt and Scott A. Cahail 293
Curtis (1983) has described the probability of data interference for a hypothetical ALERT network consisting of ten precipitation gauges receiving rain at the rate of one inch (25 *4mm) per hour. A transmission of data, which takes 0.133 seconds, is generated for each millimetre of rainfall received, so each gauge reports at an average rate of 25.4 times per hour. Thus the entire ten-gauge network is reporting at an average rate of 254 times per hour. At that rate, the probability of zero transmission collisions occurring is greater than 98 per cent. Doubling the rainfall rate to two inches (50*8mm) per hour provides a probability of greater than 96 per cent that no interference will occur, while four inches (101*6mm) per hour provides a probability of almost 93 per cent.
Another benefit of short transmissions is a low level of power drain on the battery. The remote sensors are designed to require minimal maintenance. Batteries are expected to last more than one year, but annual replacement is recommended to ensure a reliable power supply.
Radio transmissions from the remote sensors to the base station are ‘line-of-sight’ and thus need a direct path from antenna to antenna. Since that is not always possible, radio repeaters may be needed, especially in mountainous terrain. A single repeater can receive signals from many sensors and retransmit the data to the central station.
Base station
An ALERT system is intended to provide flash flood warning capabilities on a small scale where it is most useful. A locally operated microcomputer is therefore a vital component. The microcomputer is connected to a radio receiver and collects the data sent by the remote sensors or repeater stations. Once received, the data are auto- matically formatted and filed, and are then ready for display and/or analysis. The occurrence of an event and its display on the computer screen is practically instan- taneous.
The typical computer system used has storage capacity to service 100 sensors with 500 data reports per sensor. Data appear as a single station display or as precipitation group summaries. The system has audio and visual alarm capacities that can be set for specific criteria to ensure notification if the computer is unattended.
The forecast model
An effective model for predicting flood events based on reported data is essential for timely flash flood forecasting. After extensive testing, NWS selected the Sacramento Rainfall/Runoff Model for its ALERT system. The Sacramento model is a deter- ministic, generalized hydrologic model based upon a parametric conceptualization of percolation, soil-moisture storage, drainage, and evapotranspiration characteristics. Each variable used in the model is intended to represent a discrete and recognizable characteristic required for effective real-time hydrologic analysis (Burnash and Ferral, n.d.:3).
Just as the other components of the ALERT system were improved over time, so was the hydrologic model. The form that is now utilized with the ALERT software is the Sacramento Soil Moisture Accounting (SSMA) model. It is part of a computer program that scans the precipitation data files every 12 minutes and generates a new runoff forecast. In addition, a contingency table is computed that provides river forecasts based on possible future precipitation levels.
Calibration of the SSMA model to a particular basin requires a high-quality data
294 Automated flash flood warning systems
base including both precipitation and streamflow records. Where such records exist, calibration can begin immediately. Where satisfactory hydrological records do not exist, calibration is delayed until data from several storms have been collected by the new system (Sierra-Misco 1984:31).
Communications from the sensors to the base stations are also improving. Solar panels are supplementing the battery power and the use of satellites as relay stations may also make sensor placement easier and reduce the need for ground-based repeater stations. The Meteor Burst Communication System which utilizes meteor trails to reflect or re-radiate radio signals from remote stations to base stations has been used for snowpack monitoring programmes (NWS 1976).
Experience with ALERT systems
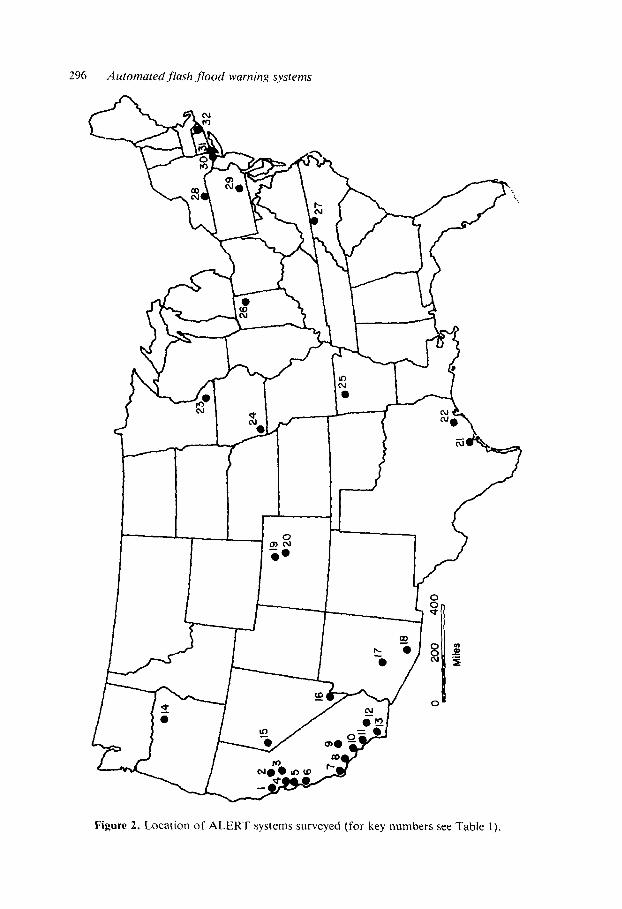
Data on experience with automated flood warning systems were sought in a survey conducted in 1984 and 1985. Responses were obtained from a total of 32 system managers in 1.5 states (Fig. 2 and Table 1) and included 89 per cent of the 36 automated flash flood warning systems operating in the United States in early 1985. (A list of ALERT and ALERT-type systems was obtained from NWS.)
Location and system operating entities
Existing ALERT systems are heavily concentrated in the southwest, and especially in southern California (Fig. 2). This reflects the origins of the ALERT concept in California and its particular suitability to the flash flood problem in that state. But systems are also found scattered widely across the rest of the nation except for the southeast. This indicates potential applicability of the ALERT-type system to many hydrologic and land use contexts.
Only four federal and one state-operated ALERT systems were identified, but the establishment of a statewide network of ALERT systems is planned for Connecticut in the near future. Eighteen of the 32 respondents are county governments or county flood control districts (a legal surrogate coterminous with a county established for fiscal reasons) (Table 2) and are operated by a variety of administrative agencies (environmental management, water resources, and public works) (see Table 1). The remaining systems investigated are run by cities or river authorities, by far the largest (in terms of number of sensors and cost) being that sponsored by the US Army Corps of Engineers in Heppner, Oregon.
Status of ALER T systems
Of the 32 systems surveyed, 14 were fully operational and 14 partially operational. The remaining four systems were under development or in the planning stage. By July 1985 only 17 systems had been in operation longer than one year. Those with the longest operating experience (see Table 1) were in Monterey County, California, Boulder County, Colorado, and Santa Barbara County, California.
In most instances the automated system did not replace a previous system. If there were some ‘staff gauges’ or recording gauges in place, they were usually left as additional data sources. Only two flash flood alarms were replaced by automated systems.
Instrumentation
Table 3 combines precipitation and streamflow gauges. Typically, precipitation
Rutherford H. Platt and Scott A. Cahail 29.5
gauges outnumber streamflow gauges by about 4 to 1. Both types of gauges may be combined at one sensor station.
Maricopa County, Arizona operates the largest system, with a network of 100 precipitation gauges, 20 river gauges, and five repeater stations. The next six largest systems in decreasing order by number of sensors are: Harris County, Texas, Boulder County, Colorado, and four California counties: Orange, Ventura, San Diego, and Santa Barbara. At the other end of the spectrum is the system at Whitewater State Park, Minnesota, with only three precipitation gauges and two river gauges, and the City of Harrisburg, Pennsylvania, which has only one of each.
Costs and funding sources
Table 4 indicates the approximate costs of establishing the 32 systems surveyed. Even the more expensive systems are still orders of magnitude less costly than multi-million dollar flood control projects. Most systems involved some form of cost-sharing between federal, state, and local sponsors, although operating costs are normally assumed by the operating agency. Ratios of participation vary between projects.
Extraterritorial sensors and system expansion
The remote stream and precipitation gauges used in ALERT systems are sufficiently compact that they can be sited in headwater locations without the need for land acquisition. They may simply be installed with the permission of the property owner. Frequently, suitable sites are available within publicly owned facilities such as parks or school sites, so that private owners need not be asked for consent. The absence of a need for site acquisition thus allows gauges to be sited according to hydrologic criteria, regardless of the boundaries of the operating governmental unit. Also, political units which share a given watershed may act cooperatively in the installation and operation of an ALERT system.
Twelve of the responding systems reported that they operate gauges outside their areas of jurisdiction. Those systems that are intended to provide protection for a particular city must often locate gauges in upstream areas which are not under their control. The City of Warwick, Rhode Island, for example, has had to locate all its gauges outside the city limits.
Similarly, county systems that are concentrating their efforts on a certain basin may find it necessary to cross county boundaries in order to cover adequately the basin headwaters. For example, Orange County in California maintains sensors in portions of Riverside and San Bernardino counties to monitor the Santa Ana river basin.
Three systems mentioned a ‘sharing’ of gauges through system tie-ins: Riverside County shares data with Orange County to its west; Wesrchester County in New York and the City of Stamford, Connecticut, currently share data and anticipate a larger network when the State of Connecticut initiates its statewide system.
Twenty-three of the 32 systems reported having plans for system expansion. Of those 23, ten said that expansion would be area1 in nature while six indicated it would be to improve sensor density in the area already covered. Seven more proposed growth both in geographical terms and in density of coverage.
Reliability
Twelve of the systems have been tested by at least minor flooding since becoming
296 Automated flush flood warning system
Figure 2. Location of ALERT systems surveyed (for key numbers see Table 1).
Rutherford H. Platt and Scott A. Cahail 297
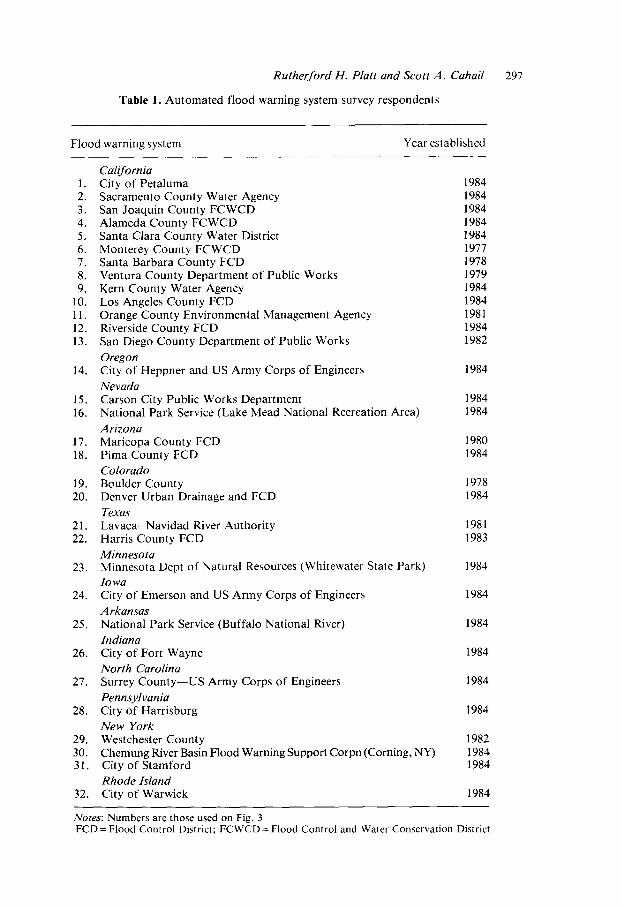
Table 1. Automated flood warning system survey respondents
Flood warning system Year established
1.
2. 3. 4. 5. 6. I. 8. 9.
10. 11. 12. 13.
14.
15. 16.
17. 18.
19. 20.
21. 22.
23.
24.
25.
26.
27.
28.
29. 30. 31.
32.
California City of Petaluma Sacramento County Water Agency San Joaquin County FCWCD Alameda County FCWCD Santa Clara County Water District Monterey County FCWCD Santa Barbara County FCD Ventura County Department of Public Works Kern County Water Agency Los Angeles County FCD Orange County Environmental Management Agency Riverside County FCD San Diego County Department of Public Works
Oregon City of Heppner and US Army Corps of Engineers
Nevada Carson City Public Works Department National Park Service (Lake Mead National Recreation Area)
Arizona Maricopa County FCD Pima County FCD
Colorado Boulder County Denver Urban Drainage and FCD
Texas Lavaca-Navidad River Authority Harris County FCD
Minnesota Minnesota Dept of Natural Resources (Whitewater State Park)
Iowa City of Emerson and US Army Corps of Engineers
Arkansas National Park Service (Buffalo National River)
Indiana City of Fort Wayne
North Carolina Surrey County-US Army Corps of Engineers
Pennsylvania City of Harrisburg
New York Westchester County Chemung River Basin Flood Warning Support Corpn (Corning, NY) City of Stamford
Rhode Island City of Warwick
1984 1984 1984 1984 1984 1977 1978 1979 1984 1984 1981 1984 1982
1984
1984 1984
1980 1984
1978 1984
1981 1983
1984
1984
1984
1984
1984
1984
1982 1984 1984
1984
Notes: Numbers are those used on Fig. 3 FCD = Flood Control District; FCWCD = Flood Control and Water Conservation District
298 Automated flash flood warning systems
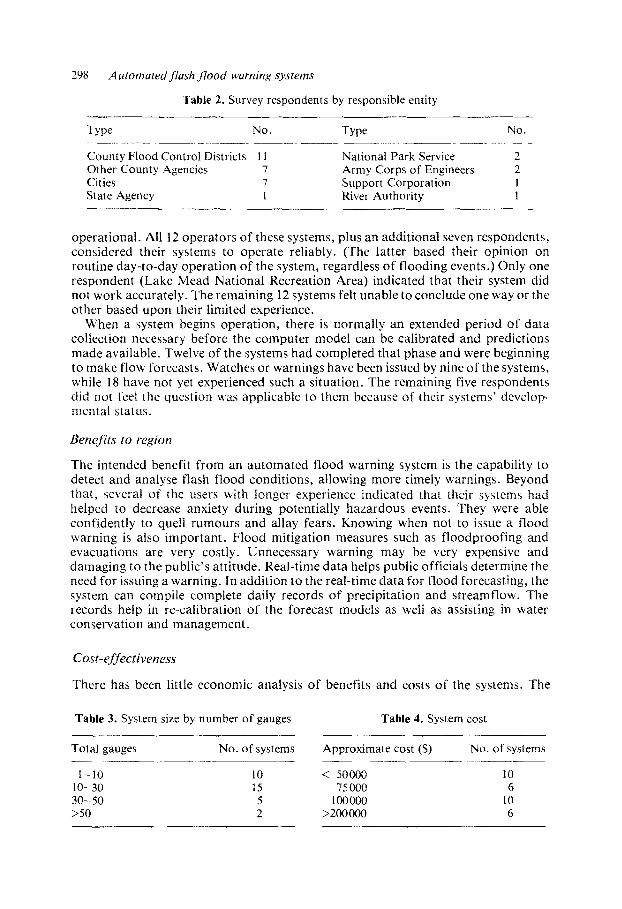
Table 2. Survey respondents by responsible entity
Type No. Type No. _.~_ ______~
County Flood Control Districts 11 National Park Service 2 Other County Agencies 7 Army Corps of Engineers 2 Cities 7 Support Corporation 1 State Agency 1 River Authority 1
operational. All 12 operators of these systems, plus an additional seven respondents, considered their systems to operate reliably. (The latter based their opinion on routine day-to-day operation of the system, regardless of flooding events.) Only one respondent (Lake Mead National Recreation Area) indicated that their system did not work accurately. The remaining 12 systems felt unable to conclude one way or the other based upon their limited experience.
When a system begins operation, there is normally an extended period of data collection necessary before the computer model can be calibrated and predictions made available. Twelve of the systems had completed that phase and were beginning to make flow forecasts. Watches or warnings have been issued by nine of the systems, while 18 have not yet experienced such a situation. The remaining five respondents did not feel the question was applicable to them because of their systems’ develop- mental status.
Benefits to region
The intended benefit from an automated flood warning system is the capability to detect and analyse flash flood conditions, allowing more timely warnings. Beyond that, several of the users with longer experience indicated that their systems had helped to decrease anxiety during potentially hazardous events. They were able confidently to quell rumours and allay fears. Knowing when not to issue a flood warning is also important. Flood mitigation measures such as floodproofing and evacuations are very costly. Unnecessary warning may be very expensive and damaging to the public’s attitude. Real-time data helps public officials determine the need for issuing a warning. In addition to the real-time data for flood forecasting, the system can compile complete daily records of precipitation and streamflow. The records help in re-calibration of the forecast models as well as assisting in water conservation and management.
Cost-effectiveness
There has been little economic analysis of benefits and costs of the systems. The
Table 3. System size by number of gauges Table 4. System cost
Total gauges --_____-
l-10 10-30 30-50 >50
No. of systems Approximate cost ($) No. of systems -..__ _________~
10 < 50~ IO 15 75 000 6 5 100000 10 2 >200000 6
Rutherford H. Platt and Scott A. Cahail 299
Santa Clara Valley Water District approached the cost-effectiveness issue from the standpoint of data collection costs only. According to their system proposal:
It is reasonably certain that rainfall, streamflow, and reservoir level data collection can all be done more reliably and less expensively with the proposed system than with present equipment and methods . . . Having a continuous, fully automated flow forecasting capability tied to a microcomputer model dedicated to this task would not only be less expensive than present methods but would also be a significant advance in effectiveness and would certainly have some effect on reducing the cost of our present flood emergency activities as well (Smith and Wolfe 1983).
Santa Barbara County offers some impressive benefit/cost evidence concerning water conservation savings as a side-benefit from their automated flood warning system. They have been able to supply forecasts of flows into reservoirs, thereby improving their water management. In 1983 they conserved 50000 acre/feet of water at an estimated value of $600 per acre/foot. They consider a 50: 1 benefit/cost ratio to be feasible over the long term.
After a portion of Whitewater State Park was closed due to flash floods in 1978, the Minnesota Department of Natural Resources weighed two alternatives for ensuring the safety of park visitors. The first was to relocate several overnight cabins from a potentially hazardous area at an estimated cost of $500000. The other was to provide early-warning capability for the area by installing an automated warning system consisting of three precipitation gauges and two stream gauges at a cost of $35000. They chose the latter option.
Maricopa County, Arizona, which has invested $500000 in its system to date, stated that they were not concerned about the cost-effectiveness of their system. This attitude reflects confidence in the capabilities of the system. Overall, of the 32 systems, nine respondents considered their systems to be cost effective, while the remaining 23 withheld judgement.
All but one of the respondents reported they had been assisted by the National Weather Service. The exception was the Denver Urban Drainage and Flood Control System, which independently developed a system for the Lena Gulch Watershed using the Colorado Urban Hydrograph Model. Despite some complaints regarding ALERT software, the NWS seems to be doing a commendable job of introducing the ALERT concept into new areas and providing technical assistance in the develop- ment of those systems.
Nearly all of the systems share data with NWS. The notable exception is the Alameda County Flood Control and Water Conservation District in California, which does not use the real-time data for flood forecasting purposes. The information they receive is used only for water resource management.
Conclusion
The consensus of the respondents is that automated flood warning systems comprise a useful form of response to the risk of flash floods. Overall, there was a sense of satisfaction, and even excitement, about the potential applications of this tech- nology. Special districts and counties are the most prevalent users of ALERT systems. Such units are best suited to operating systems on a watershed scale. However, because of the nature and adaptability of the systems, they can easily be used by municipalities and other localities with special flood protection needs. Since the sensor instruments are compact, they may be located in headwater areas beyond the system manager’s legal jurisdiction through cooperative agreements with private
300 Automated flash flood warning systems
and public landowners, so that the system may be established according to hydrologic criteria without the need for extraterritorial land acquisition.
Twenty-three of the 32 respondents intend to expand their systems. By placing more sensors in the field, additional basins can be monitored and/or sensor density can be improved. This widespread intention to expand existing systems attests a high level of user satisfaction.
Ultimately, the effectiveness of the ALERT concept must depend upon its ability to save lives and prevent property damage in flash floods. As of mid-1986, most ALERT systems have not been tested under actual emergency conditions. While the survey indicates that system users are generally pleased with their systems, it has yet to be established whether they will perform adequately when a flash flood occurs.
Acknowledgements
The authors acknowledge with gratitude the funding support provided by the National Science Foundation under Grant No. CEE-8209526 and thank Dr William Anderson, who administered the grant at NSF. Thanks are also expressed to Curtis Barrett of the National Weather Service and to David Curtis, President of Inter- national Hydrological Services, who were each very helpful in providing insights and data useful to the study. The conclusions of the study however are strictly those of the authors. The paper is based on an unpublished MS thesis by S. A. Cahail, ‘An examination of the development and utilization of automated flood warning systems’, prepared under R. H. Platt’s direction in the University of Massachusetts.
References
Burnash, R. J. C. (1982) Real-time hydrologic data collection. Sacramento: National Weather Service California-Nevada River Forecast Center (unpublished report).
Burnash, R. J. C. and Ferral, L. (n.d.) A systems approach to real-time runoff analysis with a deterministic rainfall-runoff model. Sacramento: National Weather Service California- Nevada River Forecast Center (unpublished report).
Burnash, R. J. C. and Twedt, T. (1978) Event-reporting instrumentation for real-time flash flood warnings. Preprints of the Conference on Flash Floods, 2-5 May, Los Angeles, California, American Meteorological Society.
Burnash, R. J. C., Bartfeld, I. and Leader, D. C. (1983) Real-time prediction of flood conditions. Sacramento: National Weather Service California-Nevada River Forecast Center (unpublished report).
Curtis, D. C. (1983) ALERT radio communications analysis. Bloomfield, Conn.: National Weather Service Northeast River Forecast Center (unpublished report).
Hughes, P. (1970) A century of weather service. New York: Gordon and Breach. National Weather Service (1976) Meteor burst communication systems: Alaska winterfield test
program. Silver Spring, Md.: NWS Office of Hydrology, Technical Memorandum NWS Hydro-30.
National Weather Service (1982) Program developmentplan for improving hydrologicservices. Silver Spring, Md.: NWS.
National Weather Service (1983) Automated local evaluation in real time: a cooperative flood warning system for your community. Salt Lake City: NWS Hydrologic Service Division.
Sierra-Misco, Inc. (1984) Telemetry instruments: real-time event reporting systems, Catalog No. 884. Berkeley, Calif.: Sierra-Misco, Inc.
Smith, S. and Wolfe, R. (1983) A storm data system for the Coyote Creek Watershed. Santa Clara, Calif.: Santa Clara Valley Water District.
(Revised manuscript received 31 March 1987)