Embed Size (px)
Citation preview
Auto Communities in Recession and Transition
Howard Wial
Automotive Communities and Workforce AdjustmentDetroit, MI - October 8, 2009
The Brookings Institution

What has happened to U.S. auto communities?
Where are these communities?•
What structural changes have occurred in their economies since the previous recession began?
•
How have they fared during the current recession?•
Which communities have experienced long-term losses of total employment and transportation equipment employment?
•
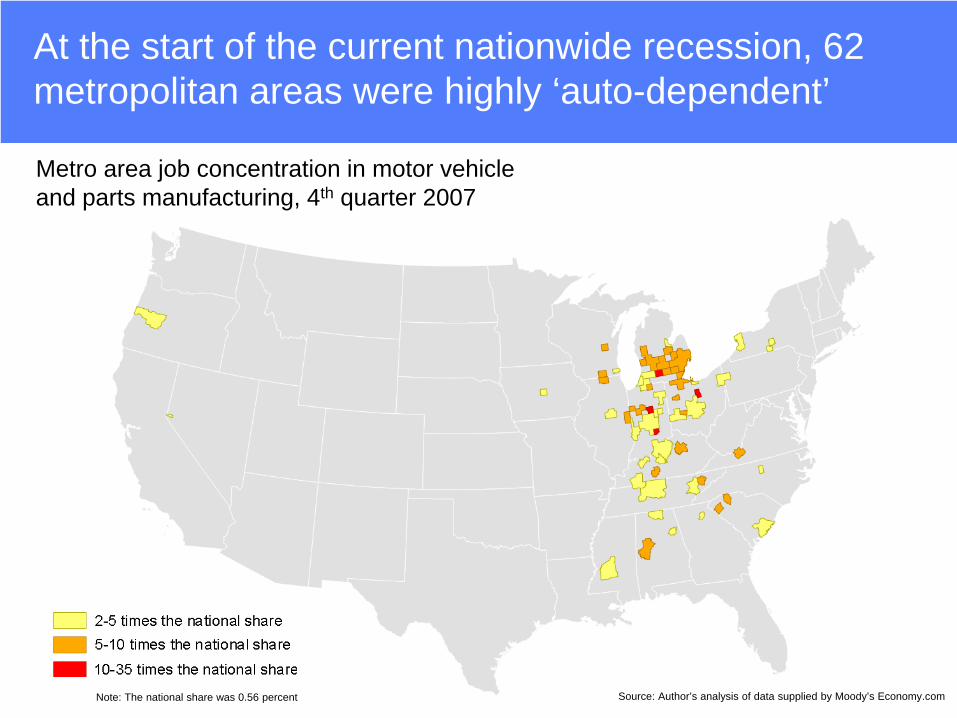
At the start of the current nationwide recession, 62 metropolitan areas were highly ‘auto-dependent’
Metro area job concentration in motor vehicle and parts manufacturing, 4th quarter 2007
Source: Author’s analysis of data supplied by Moody’s Economy.comNote: The national share was 0.56 percent

Many small metro areas have very high concentrations of jobs in motor vehicle and parts manufacturing
Source: Author’s analysis of data supplied by Moody’s Economy.com
Metropolitan area
Share of jobs in motor vehicle and parts manufacturing, 4th quarter 2007 Metropolitan area
Share of jobs in motor vehicle and parts manufacturing, 4th quarter 2007
Kokomo, IN 19.6% Elizabethtown, KY 2.4%Columbus, IN 8.1% South Bend-Mishawaka, IN-MI 2.3%Battle Creek, MI 7.0% Fort Wayne, IN 2.2%Mansfield, OH 6.6% Anderson, IN 2.2%Morristown, TN 5.5% Dayton, OH 2.1%Detroit-Warren-Livonia, MI 5.3% Terre Haute, IN 2.0%Lafayette, IN 5.2% Sandusky, OH 2.0%Flint, MI 4.9% Kalamazoo-Portage, MI 1.9%Spartanburg, SC 4.8% Owensboro, KY 1.9%Oshkosh-Neenah, WI 4.5% Nashville-Davidson--Murfreesboro--Franklin, TN 1.8%Blacksburg-Christiansburg-Radford, VA 4.3% Bloomington-Normal, IL 1.8%Saginaw-Saginaw Township North, MI 4.2% Knoxville, TN 1.8%Janesville, WI 4.1% Bay City, MI 1.7%Holland-Grand Haven, MI 4.0% Anniston-Oxford, AL 1.6%Elkhart-Goshen, IN 4.0% Niles-Benton Harbor, MI 1.6%Jackson, MI 4.0% Clarksville, TN-KY 1.6%Anderson, SC 3.9% Ames, IA 1.5%Bowling Green, KY 3.6% Jackson, MS 1.5%Monroe, MI 3.6% Louisville-Jefferson County, KY-IN 1.4%Springfield, OH 3.5% Ithaca, NY 1.4%Danville, IL 3.4% Carson City, NV 1.4%Ann Arbor, MI 3.3% Burlington, NC 1.4%Tuscaloosa, AL 3.2% Youngstown-Warren-Boardman, OH-PA 1.4%Grand Rapids-Wyoming, MI 3.2% Columbus, OH 1.3%Lansing-East Lansing, MI 3.0% Gainesville, GA 1.2%Toledo, OH 3.0% Elmira, NY 1.2%Rockford, IL 2.9% Indianapolis-Carmel, IN 1.2%Lima, OH 2.9% Charleston-North Charleston-Summerville, SC 1.2%Lexington-Fayette, KY 2.9% Racine, WI 1.2%Huntsville, AL 2.7% Eugene-Springfield, OR 1.1%Muncie, IN 2.6% Buffalo-Niagara Falls, NY 1.1%
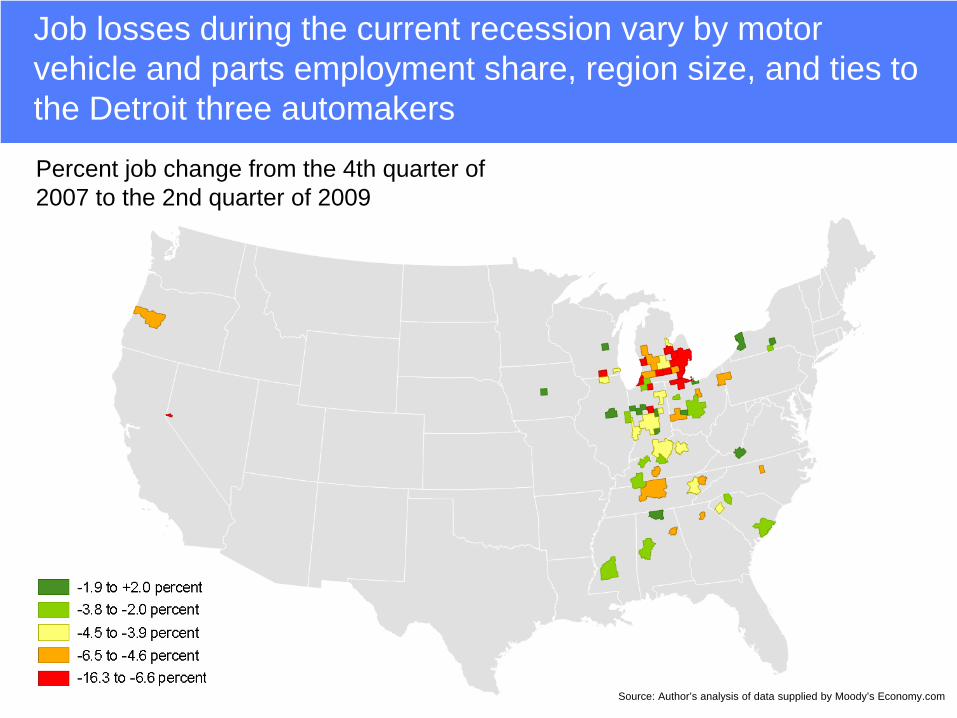
Job losses during the current recession vary by motor vehicle and parts employment share, region size, and ties to the Detroit three automakers
Percent job change from the 4th quarter of 2007 to the 2nd quarter of 2009
Source: Author’s analysis of data supplied by Moody’s Economy.com

Job losses from the 4th quarter of 2007 to the 2nd quarter of 2009 range from -16.3 percent in Elkhart, IN to +2.0 percent in Sandusky, OH
Source: Author’s analysis of data supplied by Moody’s Economy.com
Metropolitan area
Percent change in total employment, 4th quarter 2007 to 2nd quarter 2009 Metropolitan area
Percent change in total employment, 4th quarter 2007 to 2nd quarter 2009
Sandusky, OH 2.0% Indianapolis-Carmel, IN -4.2%Lafayette, IN 1.4% Racine, WI -4.3%Ames, IA 1.0% Bay City, MI -4.3%Bloomington-Normal, IL 0.9% Anderson, SC -4.5%Ithaca, NY 0.0% Lansing-East Lansing, MI -4.5%Anderson, IN -0.5% Dayton, OH -4.6%Blacksburg-Christiansburg-Radford, VA -0.7% Gainesville, GA -4.7%Oshkosh-Neenah, WI -1.1% Nashville-Davidson--Murfreesboro--Franklin, TN -4.7%Columbus, IN -1.2% Anniston-Oxford, AL -4.8%Huntsville, AL -1.3% Morristown, TN -5.1%Springfield, OH -1.8% Kalamazoo-Portage, MI -5.3%Buffalo-Niagara Falls, NY -1.9% Ann Arbor, MI -5.3%Columbus, OH -2.0% Mansfield, OH -5.6%Charleston-North Charleston-Summerville, SC -2.1% Bowling Green, KY -5.7%Jackson, MS -2.2% Burlington, NC -5.8%Elmira, NY -2.3% Youngstown-Warren-Boardman, OH-PA -6.1%Owensboro, KY -2.4% Grand Rapids-Wyoming, MI -6.2%Clarksville, TN-KY -2.7% Eugene-Springfield, OR -6.3%South Bend-Mishawaka, IN-MI -3.0% Jackson, MI -6.6%Spartanburg, SC -3.0% Niles-Benton Harbor, MI -6.6%Danville, IL -3.2% Carson City, NV -6.8%Tuscaloosa, AL -3.5% Battle Creek, MI -7.1%Lima, OH -3.5% Saginaw-Saginaw Township North, MI -7.2%Elizabethtown, KY -3.6% Toledo, OH -7.3%Knoxville, TN -3.9% Janesville, WI -7.4%Lexington-Fayette, KY -3.9% Holland-Grand Haven, MI -8.6%Louisville-Jefferson County, KY-IN -4.0% Monroe, MI -9.1%Fort Wayne, IN -4.0% Detroit-Warren-Livonia, MI -10.0%Terre Haute, IN -4.1% Flint, MI -10.1%Rockford, IL -4.1% Kokomo, IN -13.5%Muncie, IN -4.2% Elkhart-Goshen, IN -16.3%
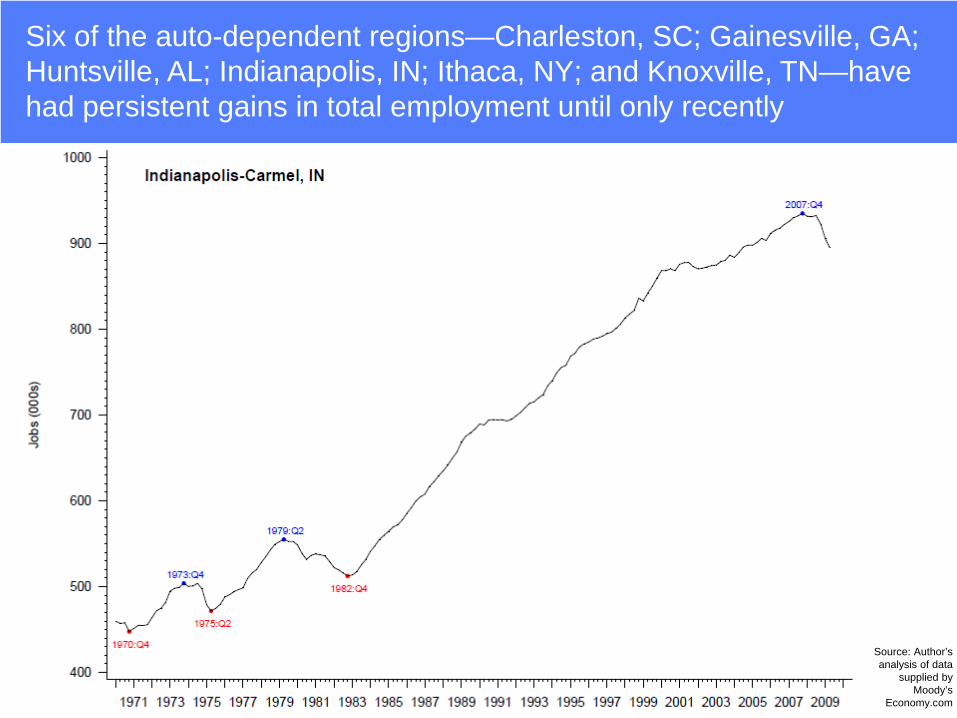
Six of the auto-dependent regions—Charleston, SC; Gainesville, GA; Huntsville, AL; Indianapolis, IN; Ithaca, NY; and Knoxville, TN—have had persistent gains in total employment until only recently
Source: Author’s analysis of data
supplied by Moody’s
Economy.com

And of the these 56 metros, 25 have experienced structural declines in transportation equipment manufacturing
If employment in transportation equipment manufacturing declined during the current and previous cyclical downturns in total employment and the intervening upturn in the metropolitan area
•
Or, if there was no upturn in the metropolitan area, employment in transportation equipment manufacturing declined from the 1st quarter of 2001 to the 2nd quarter of 2009.
•
Structural Decline:
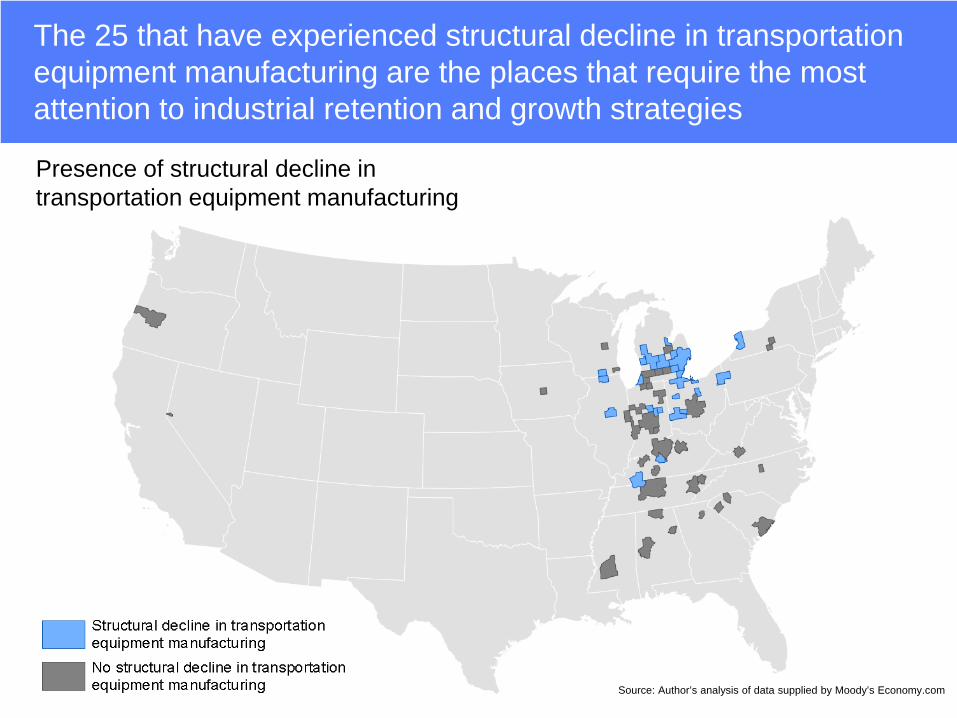
The 25 that have experienced structural decline in transportation equipment manufacturing are the places that require the most attention to industrial retention and growth strategies
Presence of structural decline in transportation equipment manufacturing
Source: Author’s analysis of data supplied by Moody’s Economy.com
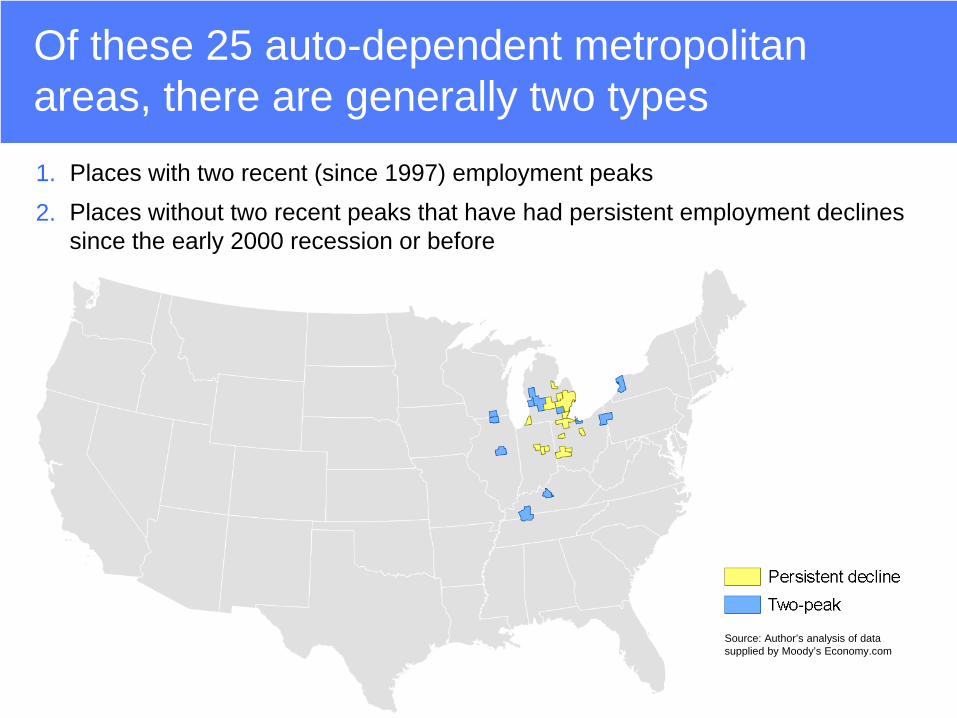
Of these 25 auto-dependent metropolitan areas, there are generally two types
Places with two recent (since 1997) employment peaks Places without two recent peaks that have had persistent employment declines since the early 2000 recession or before
2.1.
Source: Author’s analysis of data supplied by Moody’s Economy.com
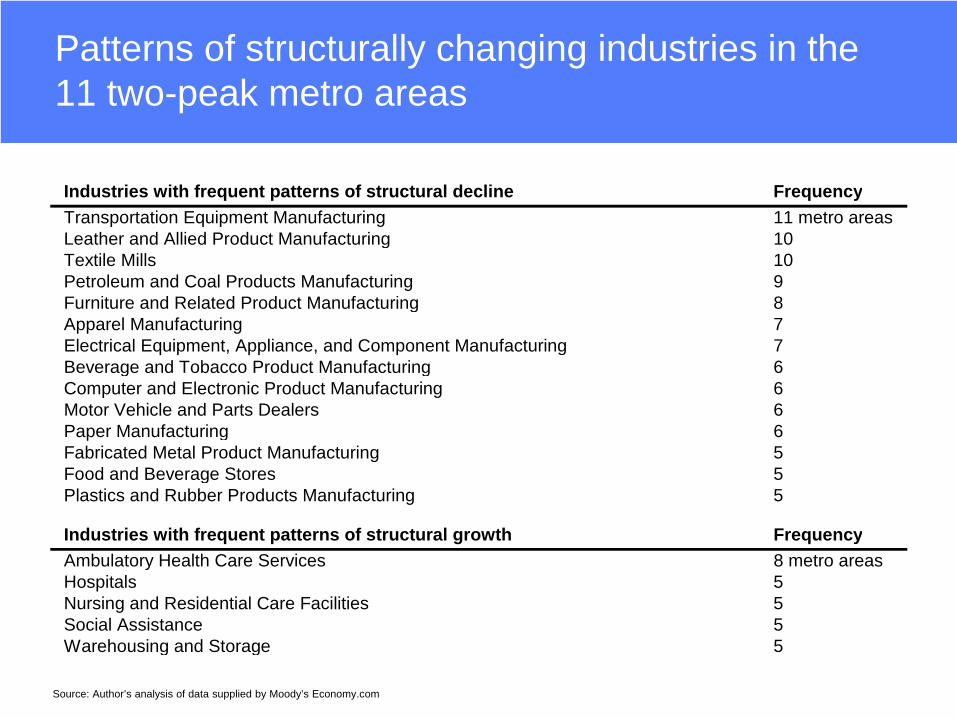
Patterns of structurally changing industries in the 11 two-peak metro areas
Industries with frequent patterns of structural decline FrequencyTransportation Equipment Manufacturing 11 metro areasLeather and Allied Product Manufacturing 10Textile Mills 10Petroleum and Coal Products Manufacturing 9Furniture and Related Product Manufacturing 8Apparel Manufacturing 7Electrical Equipment, Appliance, and Component Manufacturing 7Beverage and Tobacco Product Manufacturing 6Computer and Electronic Product Manufacturing 6Motor Vehicle and Parts Dealers 6Paper Manufacturing 6Fabricated Metal Product Manufacturing 5Food and Beverage Stores 5Plastics and Rubber Products Manufacturing 5
Industries with frequent patterns of structural growth FrequencyAmbulatory Health Care Services 8 metro areasHospitals 5Nursing and Residential Care Facilities 5Social Assistance 5Warehousing and Storage 5
Source: Author’s analysis of data supplied by Moody’s Economy.com
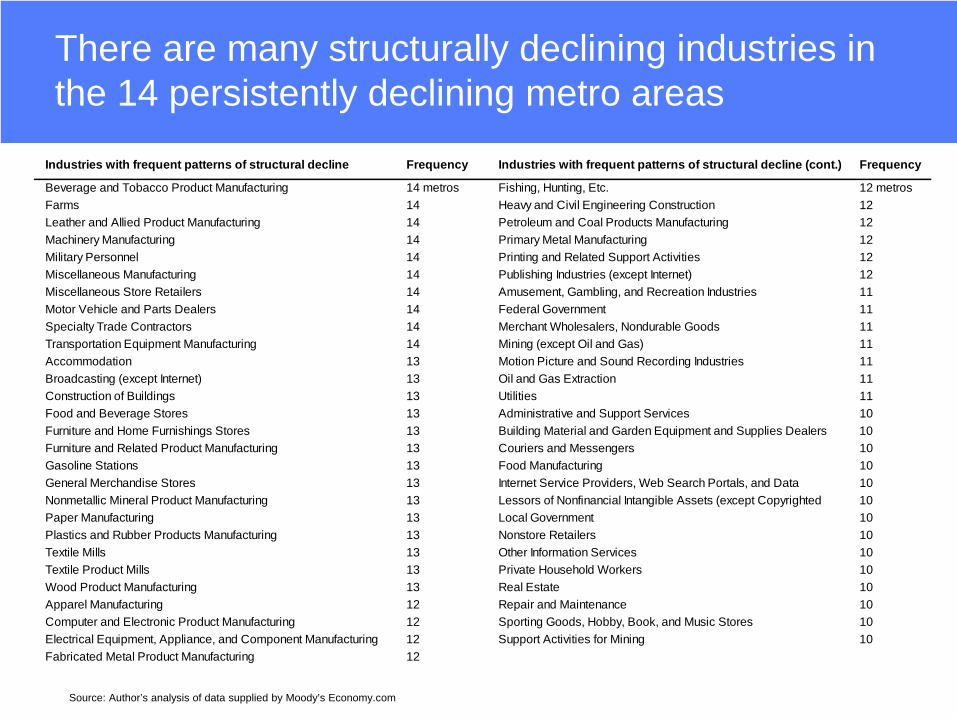
There are many structurally declining industries in the 14 persistently declining metro areas
Source: Author’s analysis of data supplied by Moody’s Economy.com
Industries with frequent patterns of structural decline Frequency Industries with frequent patterns of structural decline (cont.) Frequency
Beverage and Tobacco Product Manufacturing 14 metros Fishing, Hunting, Etc. 12 metrosFarms 14 Heavy and Civil Engineering Construction 12Leather and Allied Product Manufacturing 14 Petroleum and Coal Products Manufacturing 12Machinery Manufacturing 14 Primary Metal Manufacturing 12Military Personnel 14 Printing and Related Support Activities 12Miscellaneous Manufacturing 14 Publishing Industries (except Internet) 12Miscellaneous Store Retailers 14 Amusement, Gambling, and Recreation Industries 11Motor Vehicle and Parts Dealers 14 Federal Government 11Specialty Trade Contractors 14 Merchant Wholesalers, Nondurable Goods 11Transportation Equipment Manufacturing 14 Mining (except Oil and Gas) 11Accommodation 13 Motion Picture and Sound Recording Industries 11Broadcasting (except Internet) 13 Oil and Gas Extraction 11Construction of Buildings 13 Utilities 11Food and Beverage Stores 13 Administrative and Support Services 10Furniture and Home Furnishings Stores 13 Building Material and Garden Equipment and Supplies Dealers 10Furniture and Related Product Manufacturing 13 Couriers and Messengers 10Gasoline Stations 13 Food Manufacturing 10General Merchandise Stores 13 Internet Service Providers, Web Search Portals, and Data 10Nonmetallic Mineral Product Manufacturing 13 Lessors of Nonfinancial Intangible Assets (except Copyrighted 10Paper Manufacturing 13 Local Government 10Plastics and Rubber Products Manufacturing 13 Nonstore Retailers 10Textile Mills 13 Other Information Services 10Textile Product Mills 13 Private Household Workers 10Wood Product Manufacturing 13 Real Estate 10Apparel Manufacturing 12 Repair and Maintenance 10Computer and Electronic Product Manufacturing 12 Sporting Goods, Hobby, Book, and Music Stores 10Electrical Equipment, Appliance, and Component Manufacturing 12 Support Activities for Mining 10Fabricated Metal Product Manufacturing 12
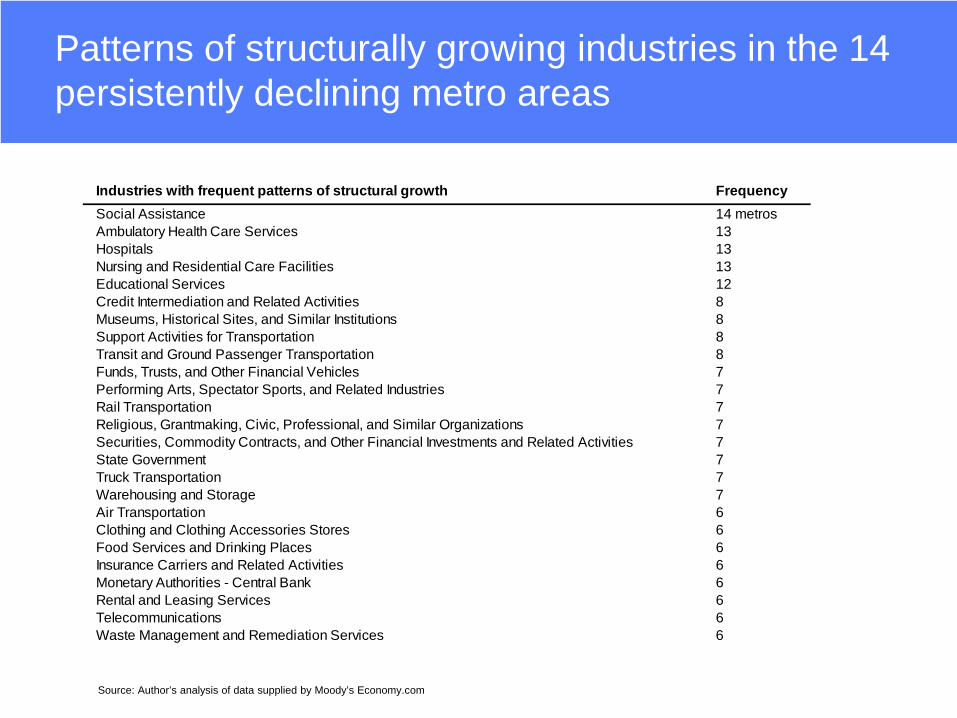
Patterns of structurally growing industries in the 14 persistently declining metro areas
Industries with frequent patterns of structural growth FrequencySocial Assistance 14 metrosAmbulatory Health Care Services 13Hospitals 13Nursing and Residential Care Facilities 13Educational Services 12Credit Intermediation and Related Activities 8Museums, Historical Sites, and Similar Institutions 8Support Activities for Transportation 8Transit and Ground Passenger Transportation 8Funds, Trusts, and Other Financial Vehicles 7Performing Arts, Spectator Sports, and Related Industries 7Rail Transportation 7Religious, Grantmaking, Civic, Professional, and Similar Organizations 7Securities, Commodity Contracts, and Other Financial Investments and Related Activities 7State Government 7Truck Transportation 7Warehousing and Storage 7Air Transportation 6Clothing and Clothing Accessories Stores 6Food Services and Drinking Places 6Insurance Carriers and Related Activities 6Monetary Authorities - Central Bank 6Rental and Leasing Services 6Telecommunications 6Waste Management and Remediation Services 6
Source: Author’s analysis of data supplied by Moody’s Economy.com
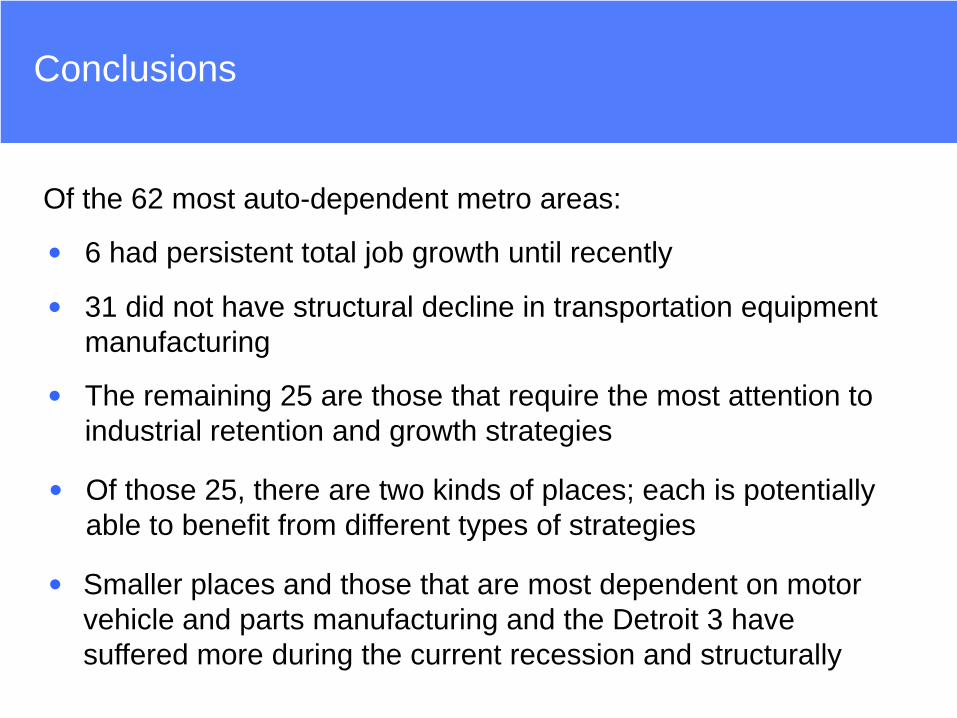
Conclusions
6 had persistent total job growth until recently•31 did not have structural decline in transportation equipment manufacturing
•
Smaller places and those that are most dependent on motor vehicle and parts manufacturing and the Detroit 3 have suffered more during the current recession and structurally
Of the 62 most auto-dependent metro areas:
The remaining 25 are those that require the most attention to industrial retention and growth strategies
•
Of those 25, there are two kinds of places; each is potentially able to benefit from different types of strategies
•
•