Embed Size (px)
Citation preview
1
Page 1 of 29
Detection of antibiotics in urine samples
Author and analyst: Iliana Karasa
Date: 20160831
2
Page 2 of 29
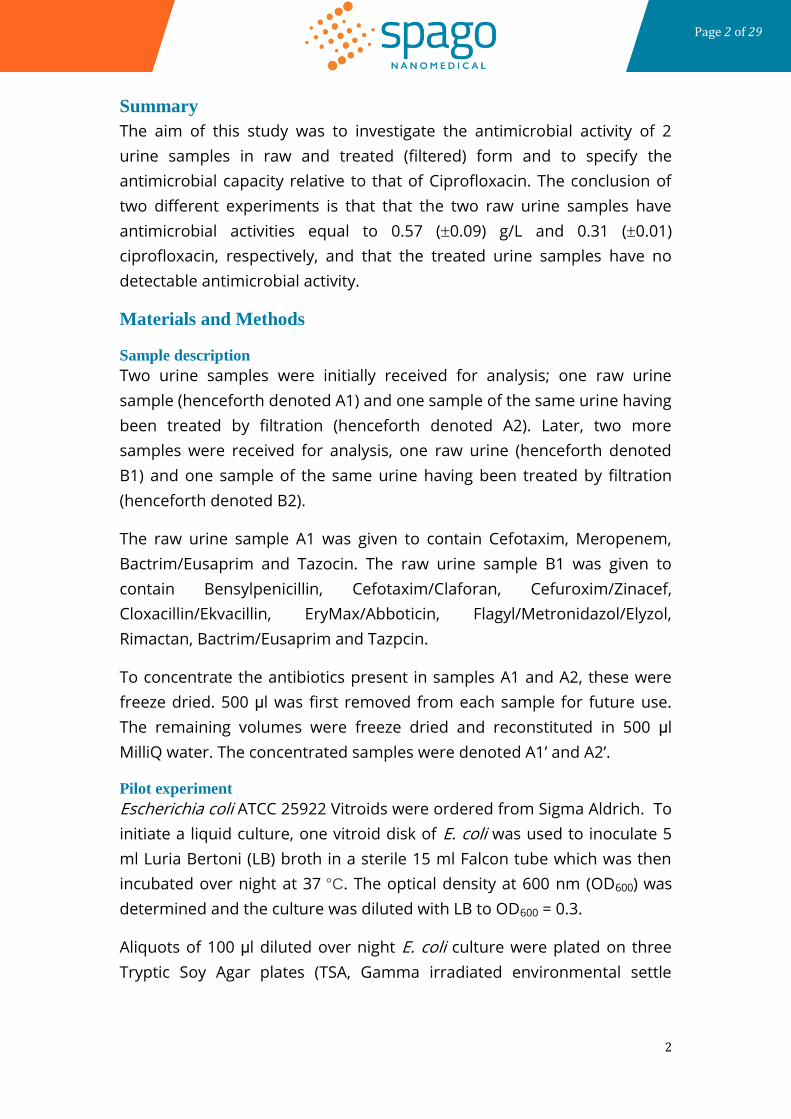
Summary
The aim of this study was to investigate the antimicrobial activity of 2
urine samples in raw and treated (filtered) form and to specify the
antimicrobial capacity relative to that of Ciprofloxacin. The conclusion of
two different experiments is that that the two raw urine samples have
antimicrobial activities equal to 0.57 (0.09) g/L and 0.31 (0.01)
ciprofloxacin, respectively, and that the treated urine samples have no
detectable antimicrobial activity.
Materials and Methods
Sample description
Two urine samples were initially received for analysis; one raw urine
sample (henceforth denoted A1) and one sample of the same urine having
been treated by filtration (henceforth denoted A2). Later, two more
samples were received for analysis, one raw urine (henceforth denoted
B1) and one sample of the same urine having been treated by filtration
(henceforth denoted B2).
The raw urine sample A1 was given to contain Cefotaxim, Meropenem,
Bactrim/Eusaprim and Tazocin. The raw urine sample B1 was given to
contain Bensylpenicillin, Cefotaxim/Claforan, Cefuroxim/Zinacef,
Cloxacillin/Ekvacillin, EryMax/Abboticin, Flagyl/Metronidazol/Elyzol,
Rimactan, Bactrim/Eusaprim and Tazpcin.
To concentrate the antibiotics present in samples A1 and A2, these were
freeze dried. 500 µl was first removed from each sample for future use.
The remaining volumes were freeze dried and reconstituted in 500 µl
MilliQ water. The concentrated samples were denoted A1’ and A2’.
Pilot experiment
Escherichia coli ATCC 25922 Vitroids were ordered from Sigma Aldrich. To
initiate a liquid culture, one vitroid disk of E. coli was used to inoculate 5
ml Luria Bertoni (LB) broth in a sterile 15 ml Falcon tube which was then
incubated over night at 37 °C. The optical density at 600 nm (OD600) was
determined and the culture was diluted with LB to OD600 = 0.3.
Aliquots of 100 µl diluted over night E. coli culture were plated on three
Tryptic Soy Agar plates (TSA, Gamma irradiated environmental settle

3
Page 3 of 29
plates, 90 mm, from Merk) using a glass spreader. The plates were
incubated up side down for 1 h at room temperature.
1 Mast disk containing 5 µg ciprofloxacin (Disk 1) and 4 blank Mast disks
(12 x 6.6 mm, Disks 2-5) were placed on the triplicate E. coli loaded TSA
plates. Prior to being placed on the plates, the blank Mast disks were
prepared with; Disk 2) 15 µl sample A1, Disk 3) 15 µl sample A2, Disk 4) 15
µl sample A1’ and Disk 5) 15 µl sample A2’. The plates were then incubated
at room temperature for 1 h right side up followed by overnight
incubation at 37 °C. The diameter of any observed growth inhibition
zones around the disks was measured with a caliper. The growth
inhibition zone diameter was calculated as the average of five separate
measurements of the same inhibition zone.
Final experiment
E. coli cultures were initiated and maintained as described above with the
differences being that Tryptic Soy Broth (TSB) was used instead of LB and
that in-house prepared Luria Agar plates were used instead of purchased
TSA plates. Ciprofloxacin standard solutions were prepared by diluting a
stock solution of 0.5 g/L ciprofloxacin in 100 mM sodium acetate buffer
(pH = 5) in steps of x2 in the same buffer, yielding a final standard series
of 0.5, 0.25, 0.125, 0.0625 and 0.03 g/L ciprofloxacin. Higher antibiotic
concentrations were not possible to prepare due to solubility issues. Urine
samples A1 and B1 were first diluted 5x in MilliQ-water and then in steps
of x2 so that the following dilutions were available for analysis; 5x (sample
A1/B1-5, 10x (sample A1/B1-7), 20x (sample A1/B1-9), 40x sample A1/B1-
11), 80x (sample A1/B1-13) and 160x (sample A1/B1-15). Urine sample B1
was also used in a 3x dilution with MilliQ-water (B1-3). Urine samples A2
and B2 were used undiluted. 15 µl of all sample- and standard series
dilutions were applied to blank Mast disks which were then placed on LA
plates on which 100 µl of an over night culture of E. coli diluted to
OD600=0.4 over night culture had been plated. The layout of the disks on
the plates is illustrated in Figures 1 and 2 below. Note that all plates were
done in triplicate. The plates were incubated at 37 °C over night after
which the diameter of any observed growth inhibition zones around the
disks was measured with a caliper. The growth inhibition zone diameter
was calculated as the average of five separate measurements of the same
inhibition zone.

4
Page 4 of 29
Figure 1. Layout of the plates containing ciprofloxacin reference samples and the
undiluted A2 and B2 urine samples.
Figure 2. Layout of the plates containing diluted urine samples A1 and B1.
Results
Pilot experiment
Images of the plates can be found in Appendix 1. No growth inhibition
zone was identified for samples A2 or A2’ which indicates that the

5
Page 5 of 29
filtration treated urine sample does not contain any detectable levels of
antimicrobial agents. The raw urine sample A1 and its’ freeze dried
counterpart A1’ yielded clear growth inhibition zones that were larger
than than of the 5 µg ciprofloxacin reference disk. This indicates that the
potency of the antimicrobial agents in the A1 sample exceeds the that of a
corresponding ciprofloxacin solution at 0.333 g/L. Interestingly, the
growth inhibition zone of the freeze dried sample, A1’, was smaller than
that of the original sample.
Final experiment
Images of the plates can be found in Appendix 2. The results of this
extended experiment supports those of the pilot experiment that the
filtration treated samples A2 and B2 have no antibiotic activity.
The inhibition zone diameters for reference disks loaded with 15 µl
solutions of 0.5, 0.250 and 0.125 g/L ciprofloxacin were determined to be
34.23mm, 31.37mm and 28.52 mm, respectively. The two lower
concentrations did not yield detectable growth inhibition zones.
The diameters of A1-5, A1-7, A1-9, A1-11, A1-13 and A1-15 were measured
to be 28.65, 25.8, 23.37, 21.17, 18.44 and 16,21 mm, respectively. The
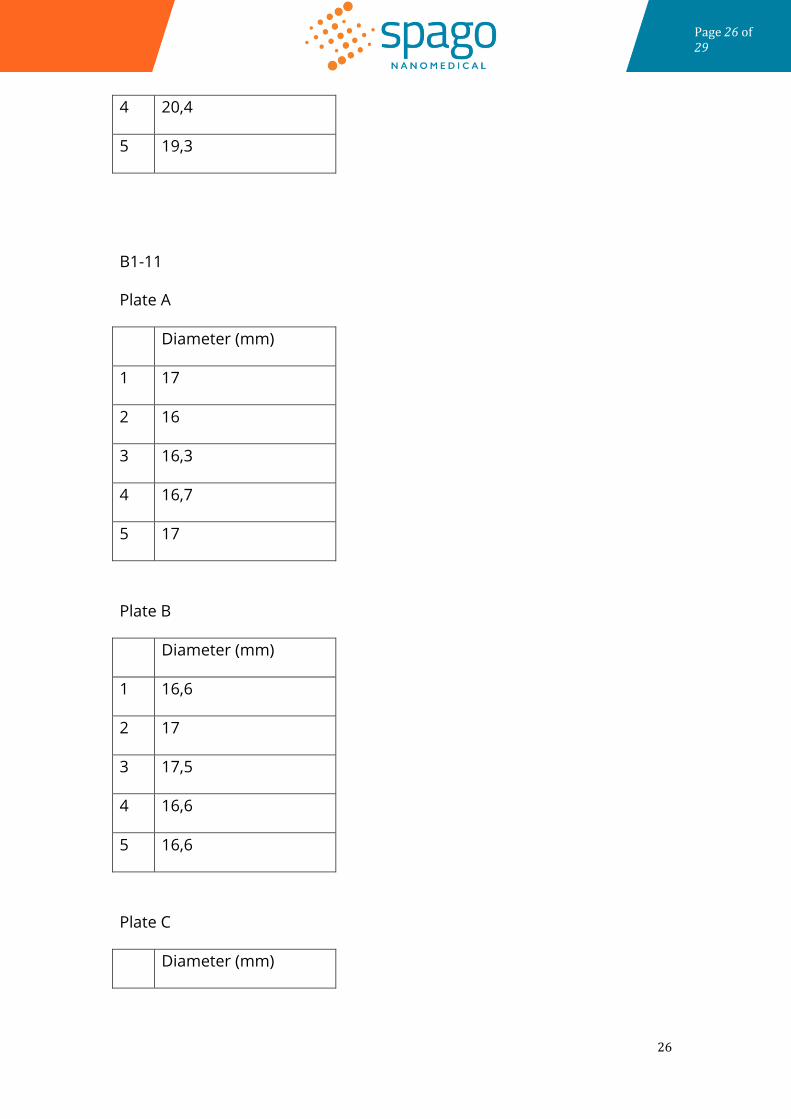
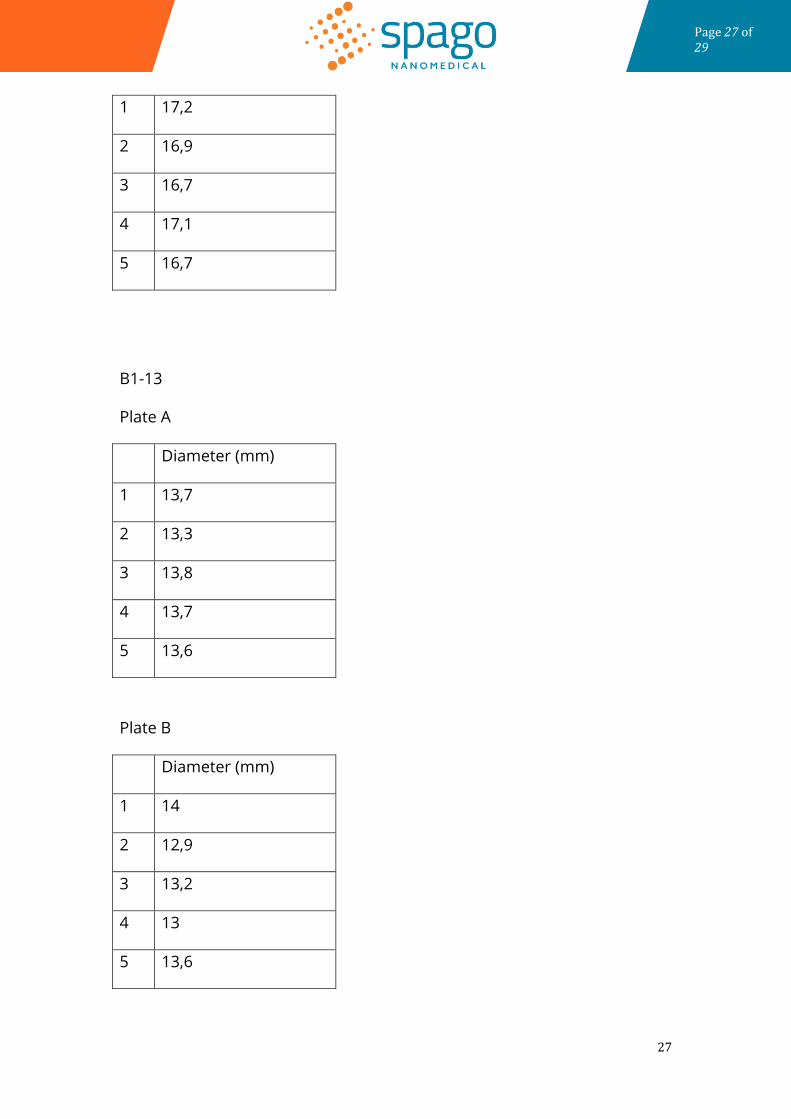
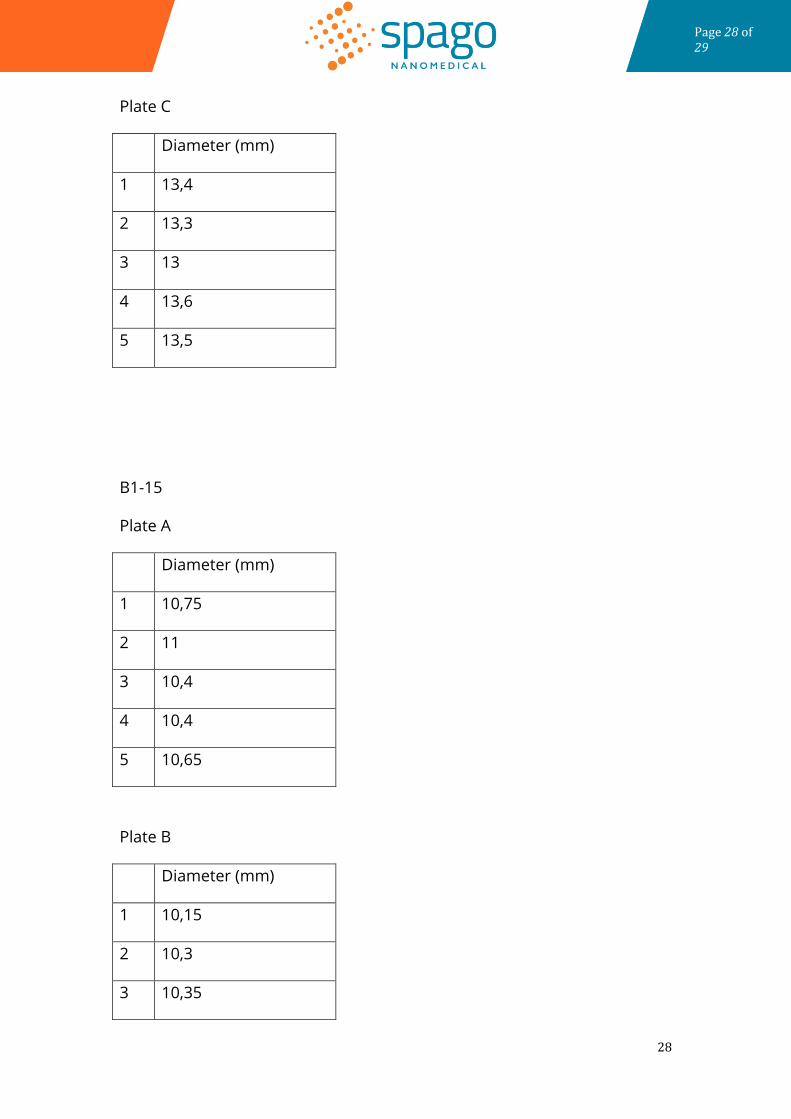
diameters for B1-3, B1-5, B1-7, B1-11, B1-13 and B1-15 were measured to
28.46, 22.85, 20.95, 19.73, 16.79, 13.44 and 10.13 mm, respectively.
Extensive result tables can be found in Appendix 3.
The growth zone diameters of the ciprofloxacin reference samples were
plotted against ciprofloxacin concentration (Figure 3) and the equation of
the trend line was used to calculate the equivalent potency of the A1 and
B1 urine samples. Unfortunately, only the 5x dilution of sample A1 and
the 3x dilution of sample B1 had growth inhibition zones with diameters
that were within the range of the standard series. Thus, only these
dilutions were used to calculate the corresponding antimicrobial activity
of the samples. Compensating for sample dilution, sample A1 has a
antimicrobial potency equivalent to a ciprofloxacin solution of 0.57 (0.09)
g/L. The corresponding potency equivalency of sample B1 is 0.31 (0.01).

6
Page 6 of 29
Figure 3. Plot of the growth inhibition zone diameters agains ciprofloxacin concentration
of the three reference samples that had antimicrobial activity. Note that n=3 for each
concentration.
Conclusion
The experiments done in this study shows that the raw urine samples
have antimicrobial activity equivalent to that of a ciprofloxacin solution of
0.3 – 0.6 g/l. The results further show that the filtration treated samples
do not exhibit any detectable antimicrobial activity.
7
Page 7 of 29
Appendix 1
Pilot experiment
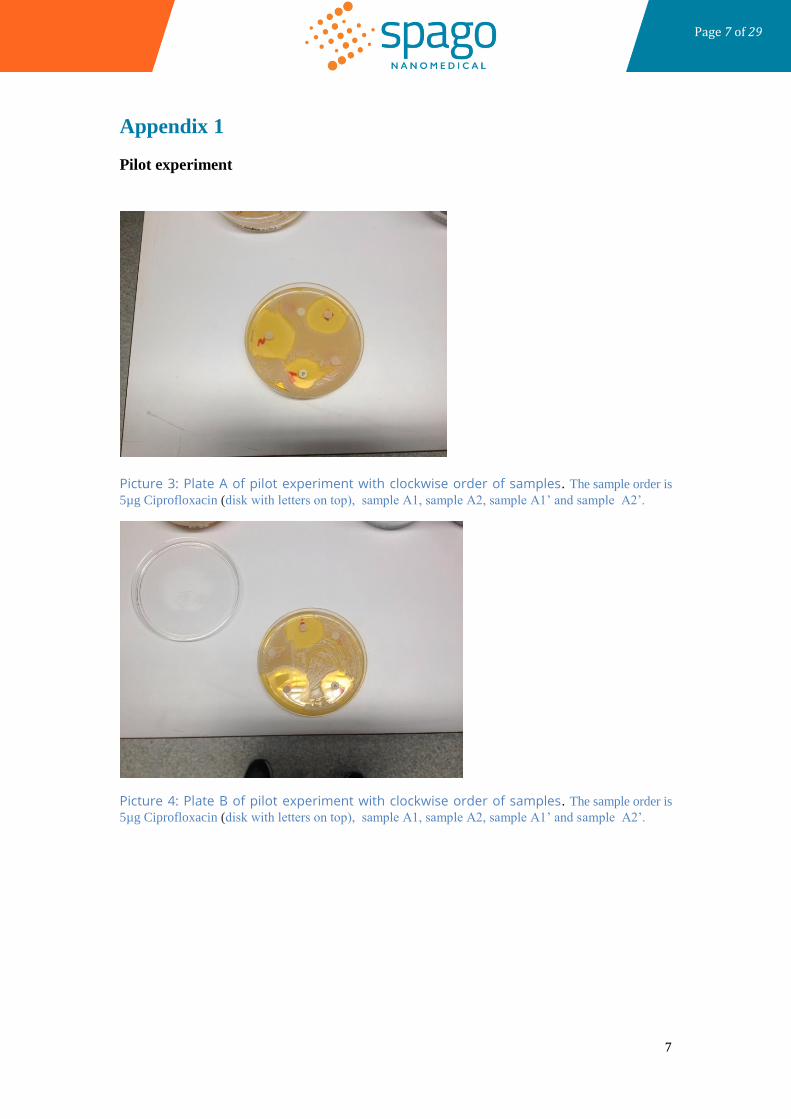
Picture 3: Plate A of pilot experiment with clockwise order of samples. The sample order is
5µg Ciprofloxacin (disk with letters on top), sample A1, sample A2, sample A1’ and sample A2’.
Picture 4: Plate B of pilot experiment with clockwise order of samples. The sample order is
5µg Ciprofloxacin (disk with letters on top), sample A1, sample A2, sample A1’ and sample A2’.
8
Page 8 of 29
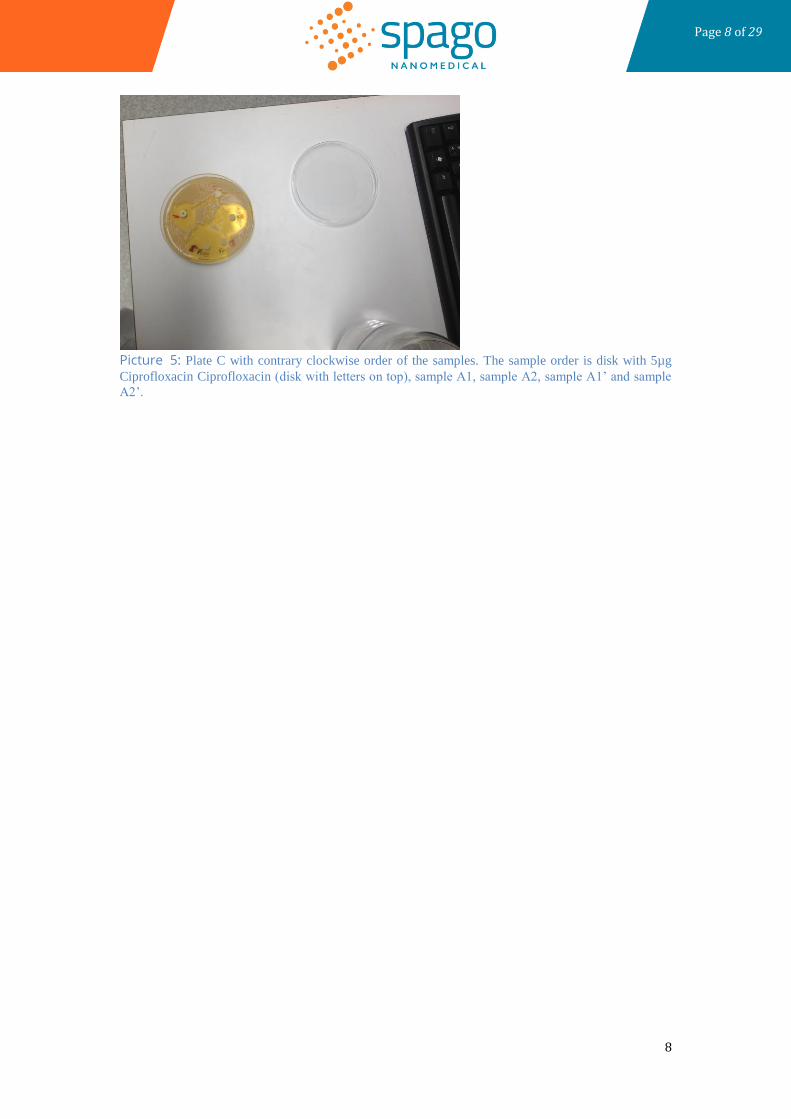
Picture 5: Plate C with contrary clockwise order of the samples. The sample order is disk with 5µg
Ciprofloxacin Ciprofloxacin (disk with letters on top), sample A1, sample A2, sample A1’ and sample
A2’.

9
Page 9 of 29
Appendix 2
Final experiment
Sample plates
Picture 6: Plate A that contains 3 disks with A1-5, A1-9 and A1-11
Picture 7: Plate B that contains 3 disks with A1-5, A1-9 and A1-11

10
Page 10 of 29
Picture 8: Plate C that contains 3 disks with A1-5, A1-9 and A1-11
Picture 9: Plate A that contains 3 disks with A1-7, A1-13 and A1-15
Picture 10: Plate B that contains 3 disks with A1-7, A1-13 and A1-15.
11
Page 11 of 29
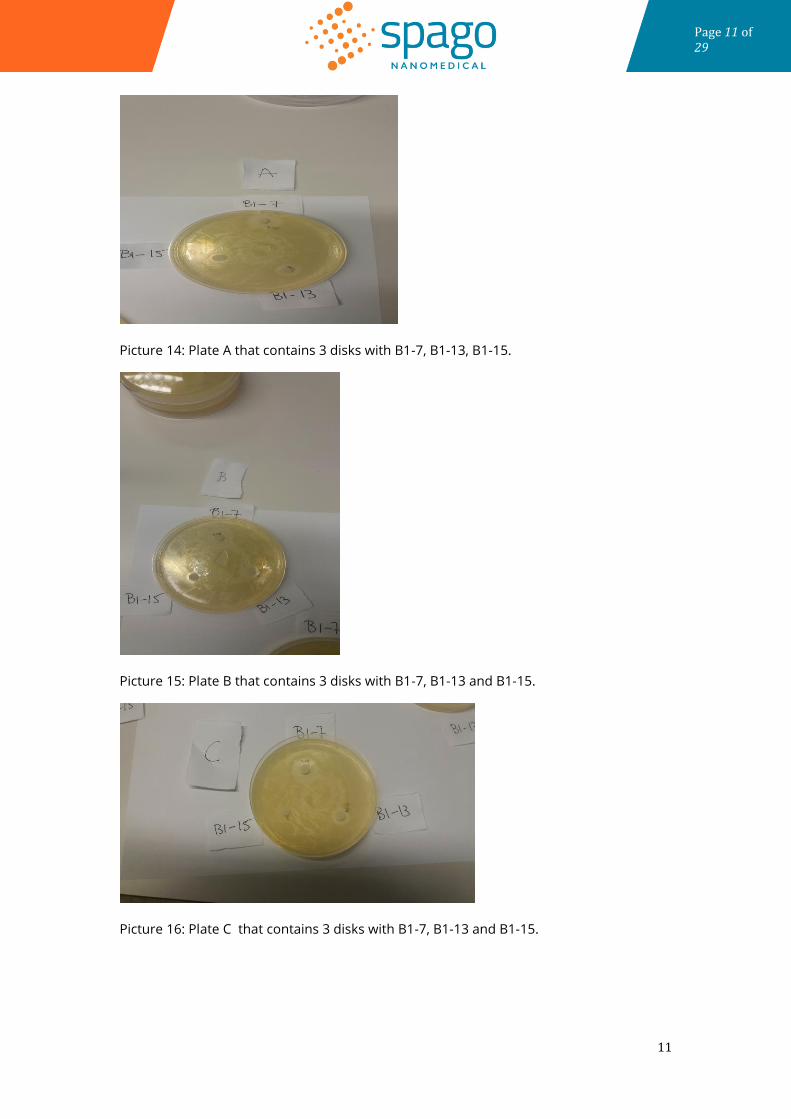
Picture 14: Plate A that contains 3 disks with B1-7, B1-13, B1-15.
Picture 15: Plate B that contains 3 disks with B1-7, B1-13 and B1-15.
Picture 16: Plate C that contains 3 disks with B1-7, B1-13 and B1-15.
12
Page 12 of 29
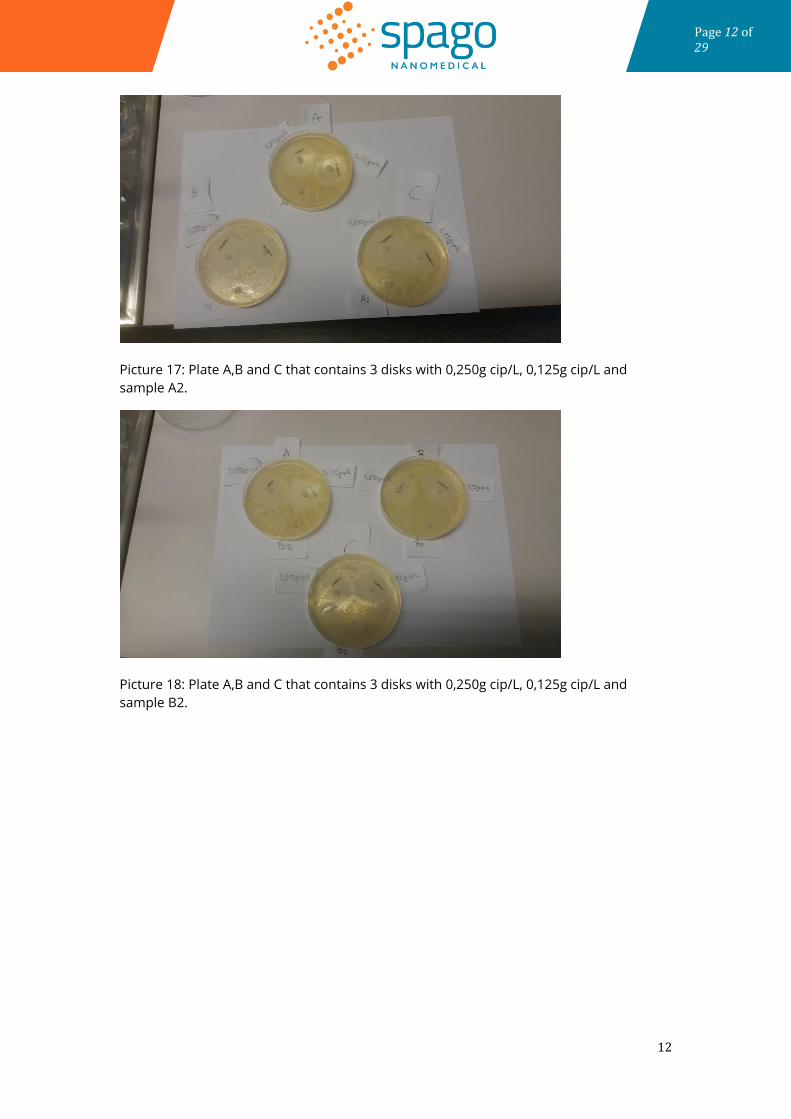
Picture 17: Plate A,B and C that contains 3 disks with 0,250g cip/L, 0,125g cip/L and
sample A2.
Picture 18: Plate A,B and C that contains 3 disks with 0,250g cip/L, 0,125g cip/L and
sample B2.

13
Page 13 of 29
Reference plates
Picture 19: Reference plates A,B and C that contain disk with Ciprofloxacin concentration
0,5g/L.
Picture 20: Reference plates A,B and C that contain disk with Ciprofloxacin concentration
0,250g/L.
14
Page 14 of 29
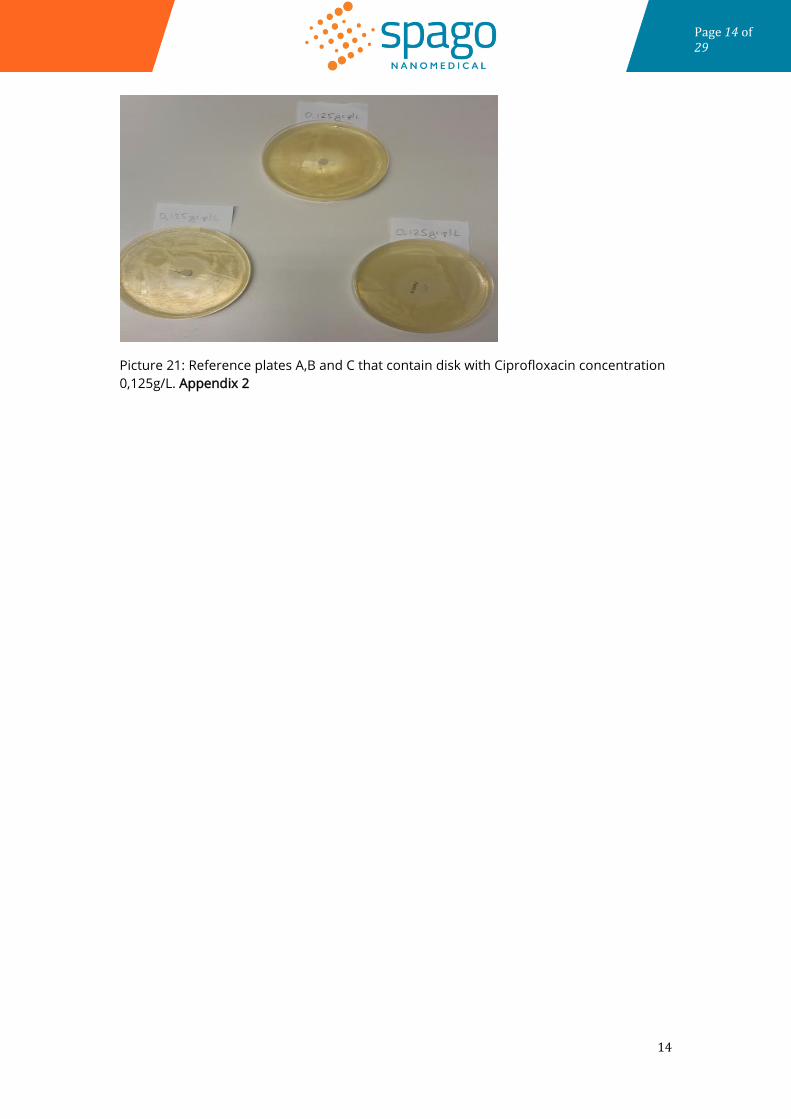
Picture 21: Reference plates A,B and C that contain disk with Ciprofloxacin concentration
0,125g/L. Appendix 2
15
Page 15 of 29
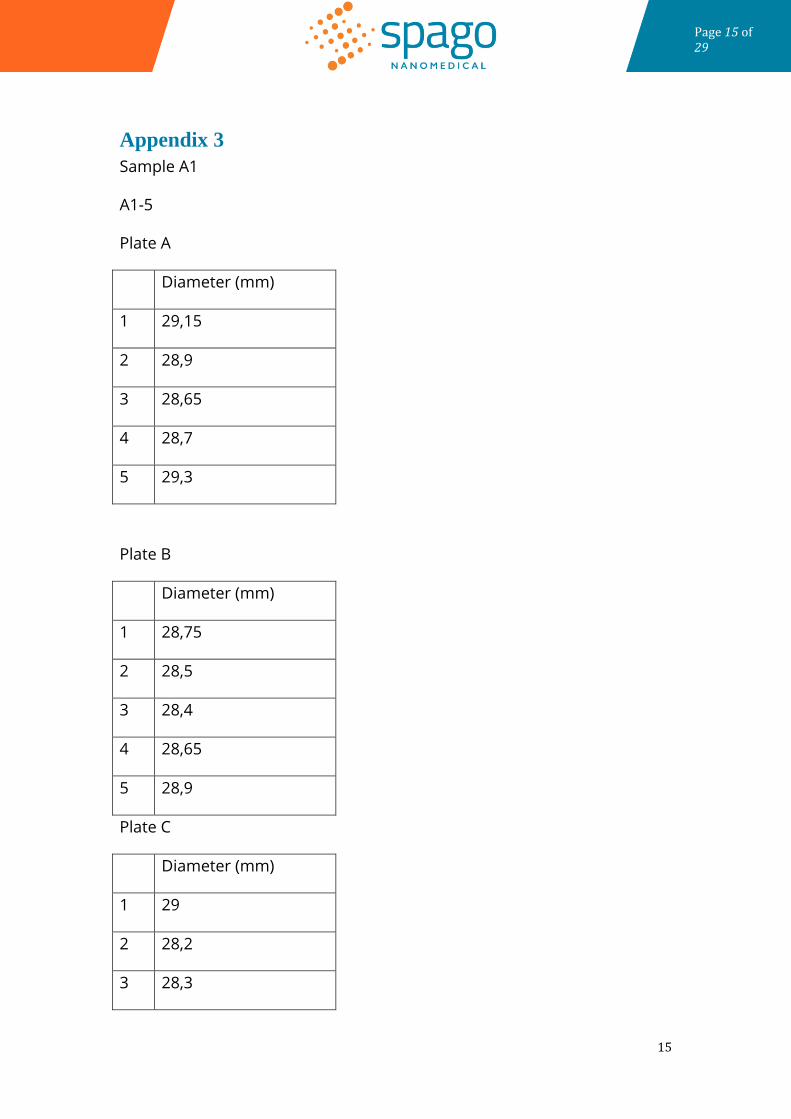
Appendix 3
Sample A1
A1-5
Plate A
Diameter (mm)
1 29,15
2 28,9
3 28,65
4 28,7
5 29,3
Plate B
Diameter (mm)
1 28,75
2 28,5
3 28,4
4 28,65
5 28,9
Plate C
Diameter (mm)
1 29
2 28,2
3 28,3

16
Page 16 of 29
4 28,4
5 28,38
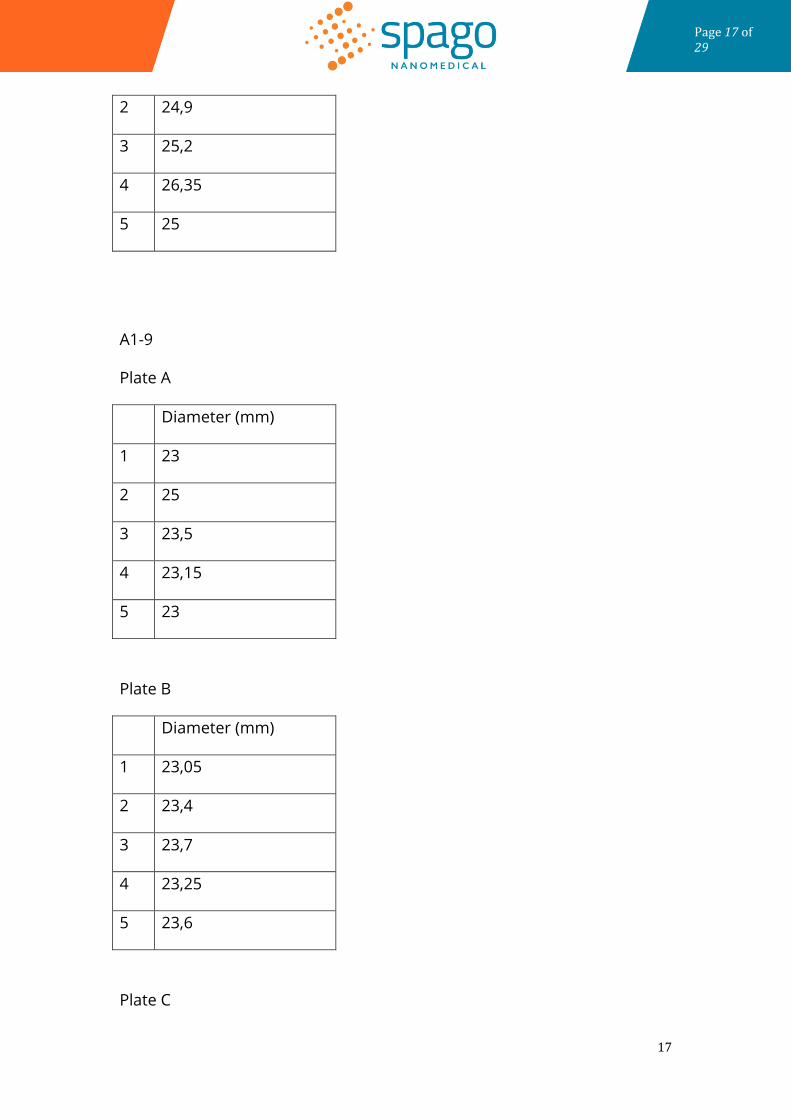
A1-7
Plate A
Diameter (mm)
1 23
2 25,55
3 25,6
4 25,65
5 26,2
Plate B
Diameter (mm)
1 -
2 -
3 -
4 -
5 -
Plate C
Diameter (mm)
1 26,6
17
Page 17 of 29
2 24,9
3 25,2
4 26,35
5 25
A1-9
Plate A
Diameter (mm)
1 23
2 25
3 23,5
4 23,15
5 23
Plate B
Diameter (mm)
1 23,05
2 23,4
3 23,7
4 23,25
5 23,6
Plate C

18
Page 18 of 29
Diameter (mm)
1 23
2 23,65
3 23,85
4 24,15
5 23
A1-11
Plate A
Diameter (mm)
1 20,7
2 21,2
3 20,55
4 21,1
5 21,35
Plate B
Diameter (mm)
1 21,2
2 20,85
3 21,3
4 21,25
19
Page 19 of 29
5 21,3
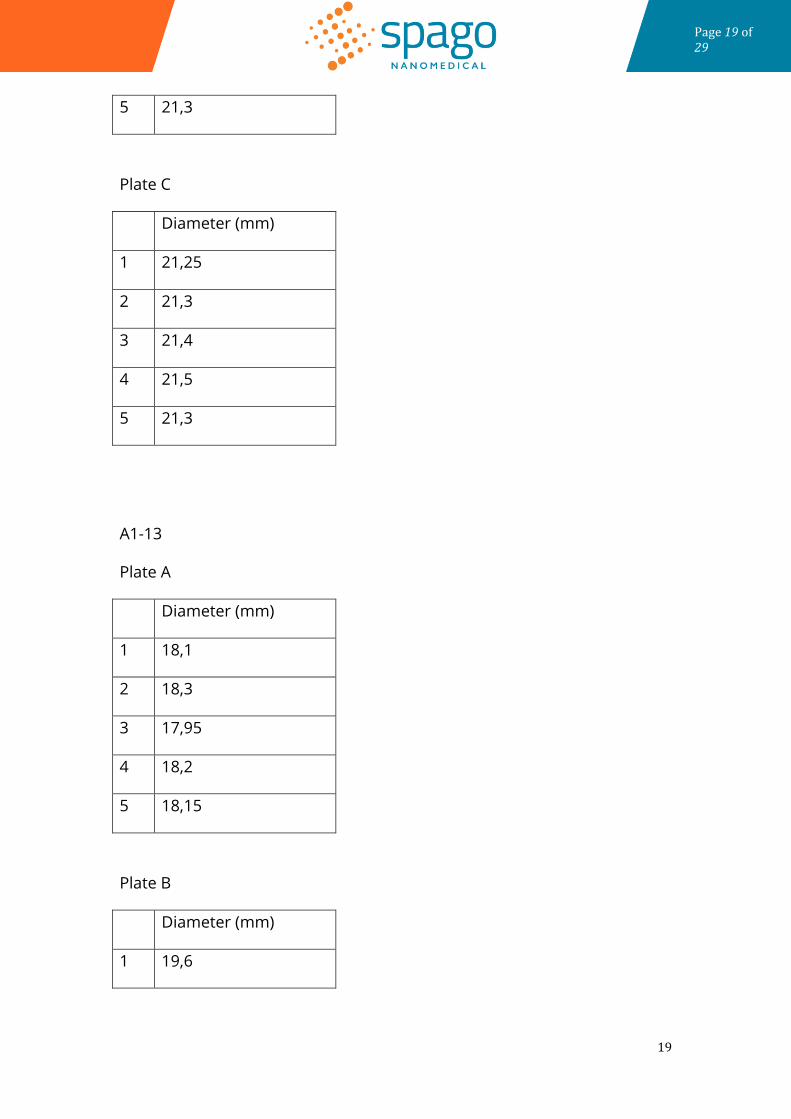
Plate C
Diameter (mm)
1 21,25
2 21,3
3 21,4
4 21,5
5 21,3
A1-13
Plate A
Diameter (mm)
1 18,1
2 18,3
3 17,95
4 18,2
5 18,15
Plate B
Diameter (mm)
1 19,6

20
Page 20 of 29
2 18,1
3 19,3
4 18,5
5 18,7
Plate C
Diameter (mm)
1 18,7
2 17,9
3 18,2
4 18,6
5 18,4
A1-15
Plate A
Diameter (mm)
1 16,5
2 15,85
3 16
4 16,35
5 15,9

21
Page 21 of 29
Plate B
Diameter (mm)
1 16,1
2 16,2
3 16,25
4 16,2
5 16,3
Plate C
Diameter (mm)
1 16,4
2 16,1
3 16,35
4 16,35
5 16,3
Sample B1
B1-3
Plate A
Diameter (mm)
1 28,3
2 28,7

22
Page 22 of 29
3 28,4
4 28,5
5 28,6
Plate B
Diameter (mm)
1 28
2 28,65
3 28,7
4 28,4
5 28,55
Plate C
Diameter (mm)
1 28,4
2 28,3
3 28,3
4 28,45
5 28,7
B1-5
Plate A
Diameter (mm)

23
Page 23 of 29
1 22,7
2 23,3
3 23
4 23,4
5 23,45
Plate B
Diameter (mm)
1 23,1
2 22,7
3 22,5
4 22,8
5 23
Plate C
Diameter (mm)
1 22,45
2 22,6
3 22,4
4 23,4
5 23
B1-7

24
Page 24 of 29
Plate A
Diameter (mm)
1 21
2 21,3
3 21,5
4 20,5
5 20,45
Plate B
Diameter (mm)
1 20,75
2 19,8
3 20,5
4 20
5 20,5
Plate C
Diameter (mm)
1 19,8
2 20,5
3 20,5
4 20,7
5 20,65

25
Page 25 of 29
B1-9
Plate A
Diameter (mm)
1 20,1
2 19,75
3 20
4 19,45
5 19,8
Plate B
Diameter (mm)
1 20,75
2 19
3 20,35
4 20
5 19,6
Plate C
Diameter (mm)
1 20,5
2 20
3 19,6
26
Page 26 of 29
4 20,4
5 19,3
B1-11
Plate A
Diameter (mm)
1 17
2 16
3 16,3
4 16,7
5 17
Plate B
Diameter (mm)
1 16,6
2 17
3 17,5
4 16,6
5 16,6
Plate C
Diameter (mm)
27
Page 27 of 29
1 17,2
2 16,9
3 16,7
4 17,1
5 16,7
B1-13
Plate A
Diameter (mm)
1 13,7
2 13,3
3 13,8
4 13,7
5 13,6
Plate B
Diameter (mm)
1 14
2 12,9
3 13,2
4 13
5 13,6
28
Page 28 of 29
Plate C
Diameter (mm)
1 13,4
2 13,3
3 13
4 13,6
5 13,5
B1-15
Plate A
Diameter (mm)
1 10,75
2 11
3 10,4
4 10,4
5 10,65
Plate B
Diameter (mm)
1 10,15
2 10,3
3 10,35

29
Page 29 of 29
4 10,4
5 10,25
Plate C
Diameter (mm)
1 9,7
2 8,9
3 9,5
4 10
5 9,5