Embed Size (px)
Citation preview
Australian Trachoma Surveillance Report
2010
Edited by National Trachoma Surveillance and Reporting Unit
Australian Trachoma Surveillance Report 2010
ISSN 1839-2210
Suggested citation:The Kirby Institute for infection and immunity in society. Australian Trachoma Surveillance Report 2010. The Kirby Institute for infection and immunity in society, The University of New South Wales, NSW.
© Commonwealth of Australia 2011
This report has been produced by the National Trachoma Surveillance Unit of The Kirby Institute for infection and immunity in society, Unversity of New South Wales for the Australian Government Department of Health and Ageing.
This work is copyright. You may reproduce the whole or part of this work in unaltered form for your own personal use or, if you are part of an organisation, for internal use within your organisation, but only if you or your organisation do not use the reproduction for any commercial purpose and retain this copyright notice and all disclaimer notices as part of that reproduction. Apart from rights to use as permitted by the Copyright Act 1968 or allowed by this copyright notice, all other rights are reserved and you are not allowed to reproduce the whole or any part of this work in any way (electronic or otherwise) without first being given the specific written permission from the Commonwealth to do so. Requests and inquiries concerning reproduction and rights are to be sent to the Communications Branch, Department of Health and Ageing, GPO Box 9848, Canberra ACT 2601, or via e-mail to [email protected].
This publication is available at Internet address http://www.kirby.unsw.edu.au/trachoma
The Kirby Institute for infection and immunity in society. Centre for Immunology Building, Cnr Boundary and West Streets, Darlinghurst NSW 2010 Australia
Telephone: 02 9385 0900 Facsimile: 02 9385 0920 International prefix: 61 2 Email: [email protected] Design: il Razzo Telephone: 02 48 211136 E-mail: [email protected]
Australian Trachoma Surveillance Report 2010
Kirby Institute, University of New South Wales June 2011
This report was prepared by the National Trachoma Surveillance and Reporting Unit, The Kirby Institute, University of New South Wales.
List of Tables 3
List of Figures 4
Acknowledgements 6
Guide to technical terms/definitions 8
Abbreviations 9
Australian trachoma surveillance 2010: 10
Executive summary 10
Main messages 12
Background 13
Methodology 14
Results 16
National results 2010 16
Northern Territory results 2010 27
South Australia results 2010 38
Western Australia results 2010 42
Antibiotic resistance 54
Discussion 56
Appendix 1: World Health Organization Trachoma Grading Card 61
Appendix 2: Data Collection Forms 63
Appendix 3: Methods for estimating number of people requiring treatment 67
Reference List 68
Contents
National Trachoma Surveillance Report 2010 3
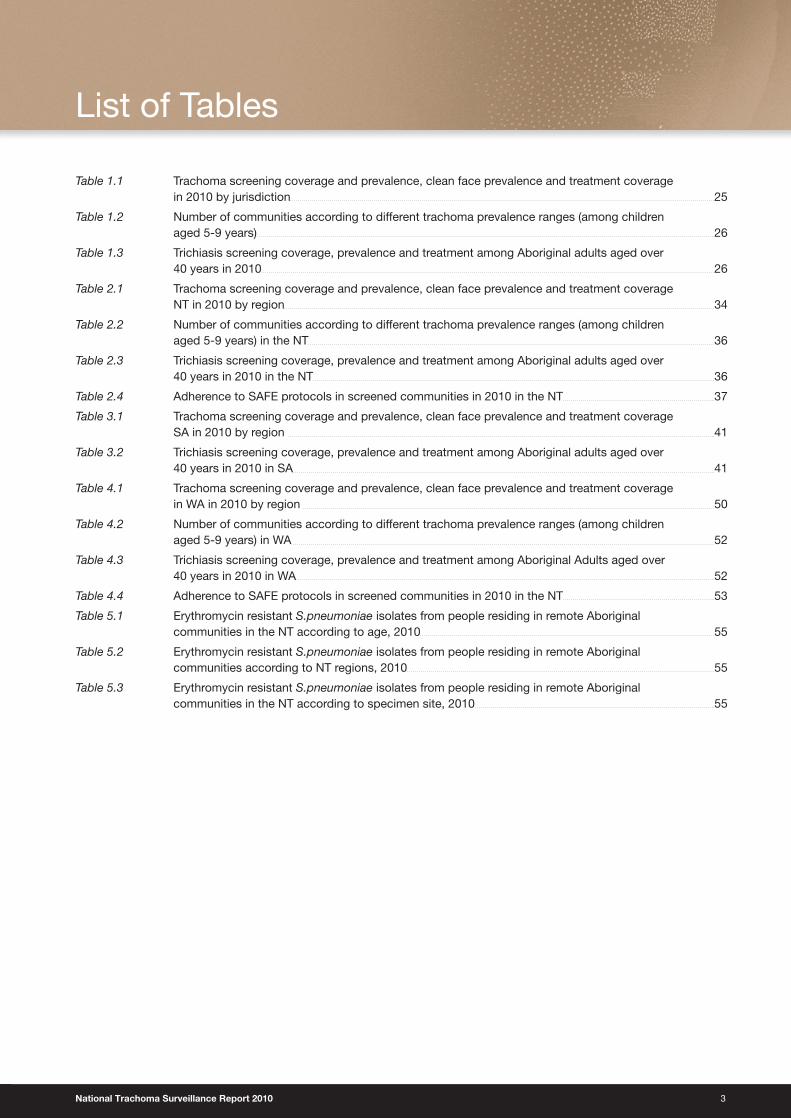
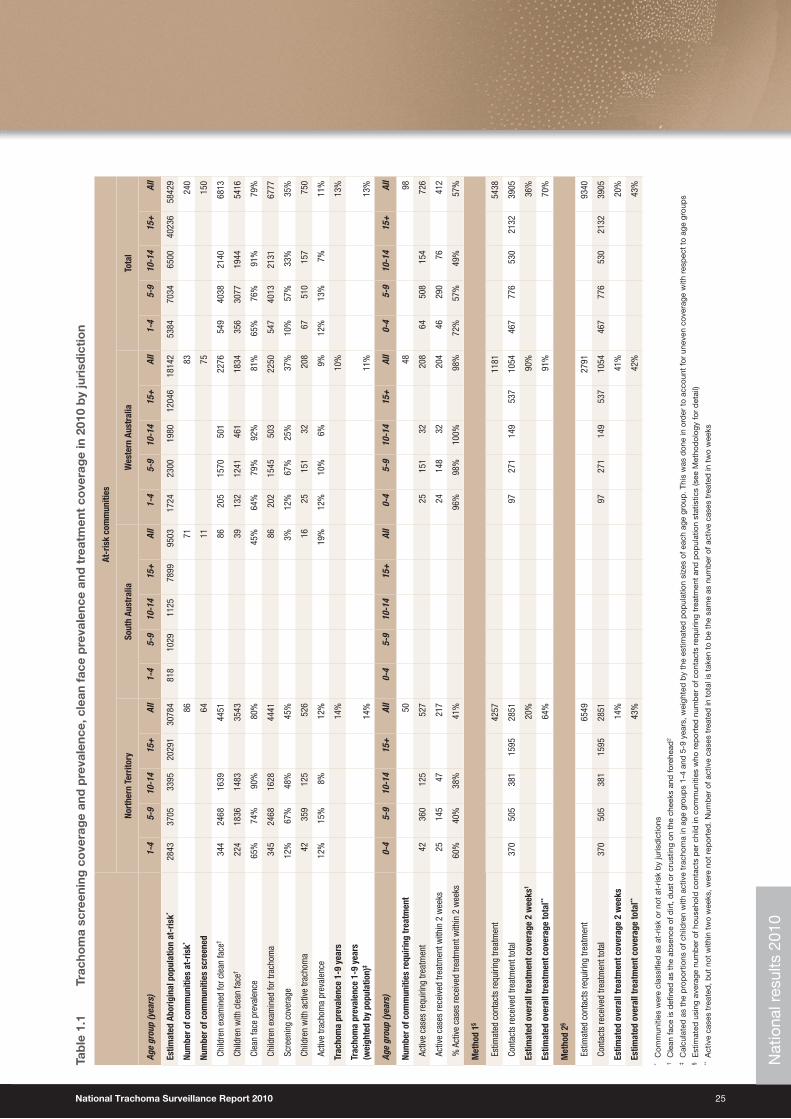
Table 1.1 Trachoma screening coverage and prevalence, clean face prevalence and treatment coverage in 2010 by jurisdiction 25
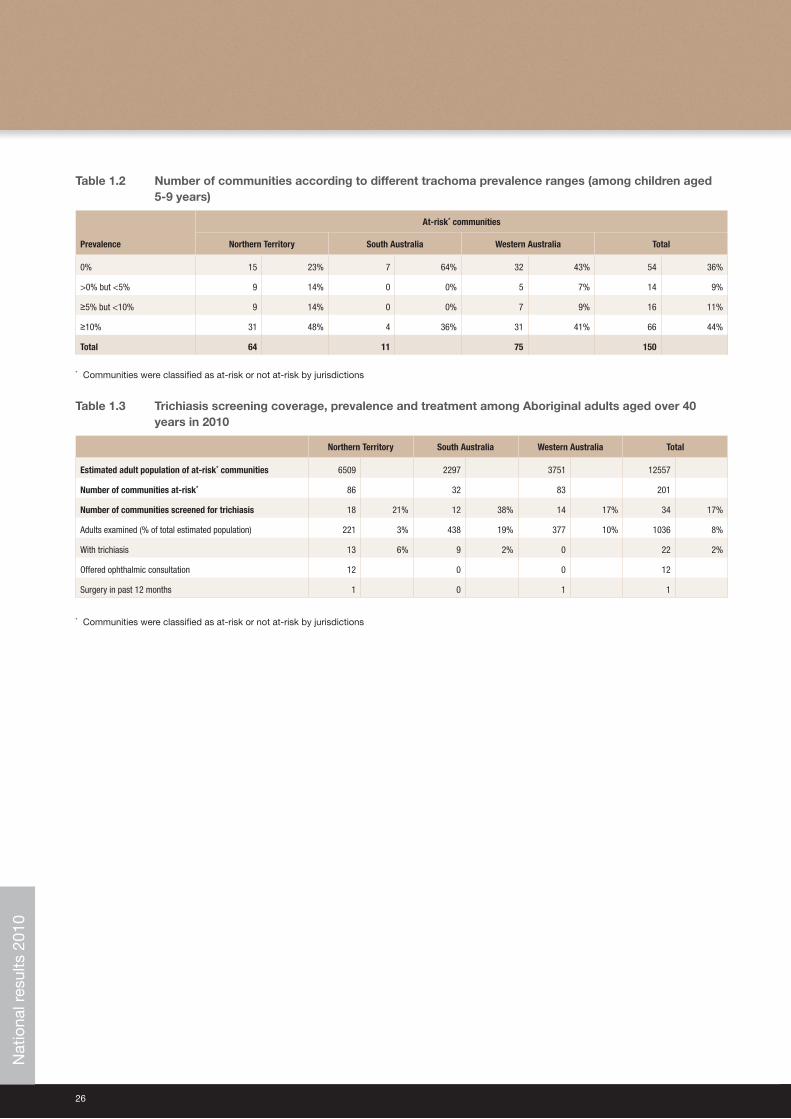
Table 1.2 Number of communities according to different trachoma prevalence ranges (among children aged 5-9 years) 26
Table 1.3 Trichiasis screening coverage, prevalence and treatment among Aboriginal adults aged over 40 years in 2010 26
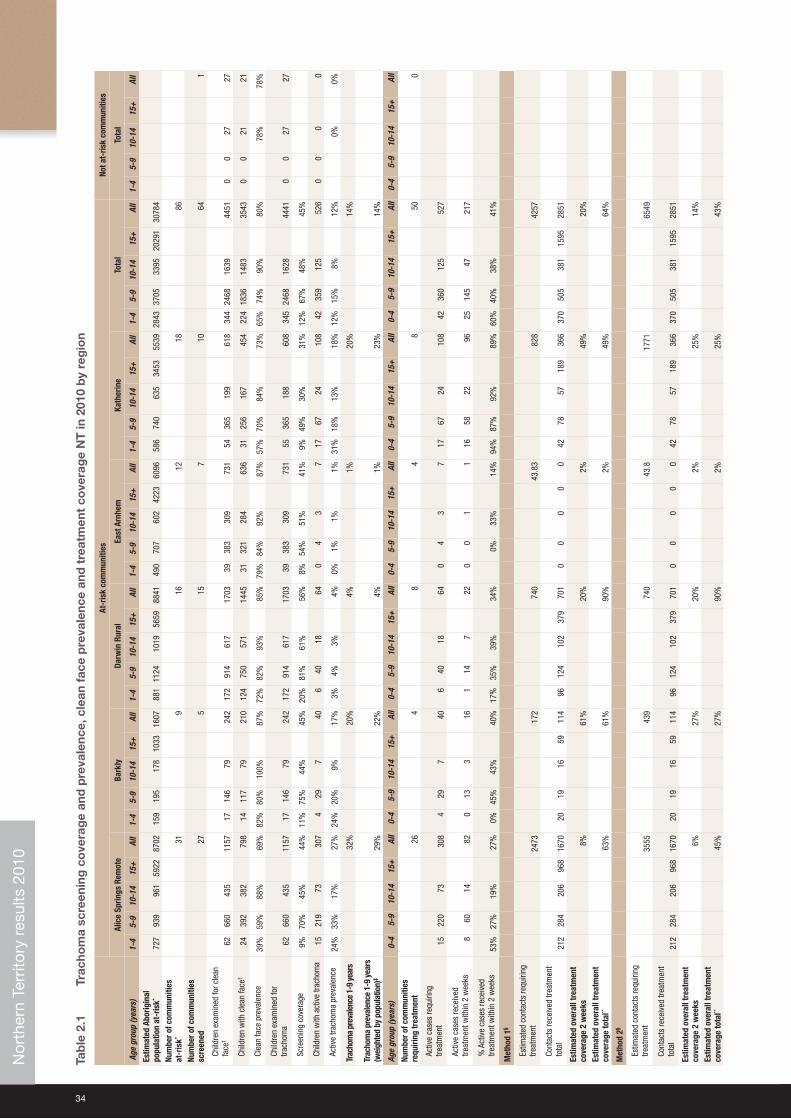
Table 2.1 Trachoma screening coverage and prevalence, clean face prevalence and treatment coverage NT in 2010 by region 34
Table 2.2 Number of communities according to different trachoma prevalence ranges (among children aged 5-9 years) in the NT 36
Table 2.3 Trichiasis screening coverage, prevalence and treatment among Aboriginal adults aged over 40 years in 2010 in the NT 36
Table 2.4 Adherence to SAFE protocols in screened communities in 2010 in the NT 37
Table 3.1 Trachoma screening coverage and prevalence, clean face prevalence and treatment coverage SA in 2010 by region 41
Table 3.2 Trichiasis screening coverage, prevalence and treatment among Aboriginal adults aged over 40 years in 2010 in SA 41
Table 4.1 Trachoma screening coverage and prevalence, clean face prevalence and treatment coverage in WA in 2010 by region 50
Table 4.2 Number of communities according to different trachoma prevalence ranges (among children aged 5-9 years) in WA 52
Table 4.3 Trichiasis screening coverage, prevalence and treatment among Aboriginal Adults aged over 40 years in 2010 in WA 52
Table 4.4 Adherence to SAFE protocols in screened communities in 2010 in the NT 53
Table 5.1 Erythromycin resistant S.pneumoniae isolates from people residing in remote Aboriginal communities in the NT according to age, 2010 55
Table 5.2 Erythromycin resistant S.pneumoniae isolates from people residing in remote Aboriginal communities according to NT regions, 2010 55
Table 5.3 Erythromycin resistant S.pneumoniae isolates from people residing in remote Aboriginal communities in the NT according to specimen site, 2010 55
List of Tables
4
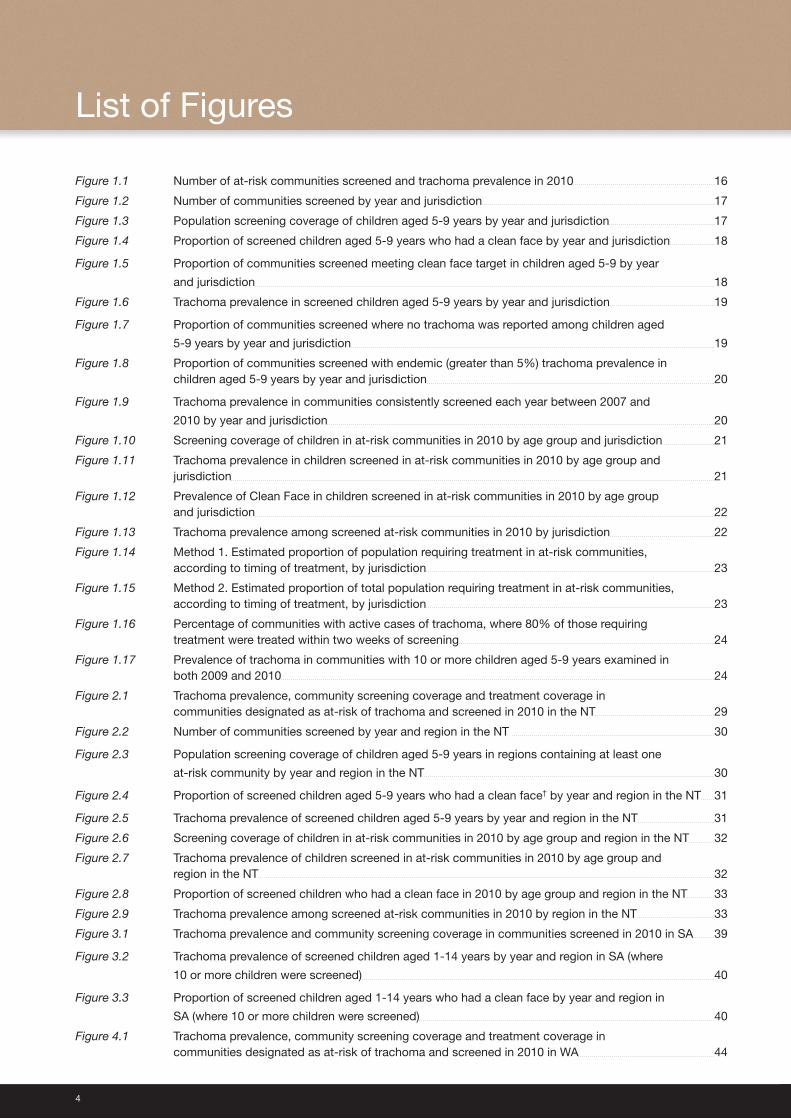
Figure 1.1 Number of at-risk communities screened and trachoma prevalence in 2010 16
Figure 1.2 Number of communities screened by year and jurisdiction 17
Figure 1.3 Population screening coverage of children aged 5-9 years by year and jurisdiction 17
Figure 1.4 Proportion of screened children aged 5-9 years who had a clean face by year and jurisdiction 18
Figure 1.5 Proportion of communities screened meeting clean face target in children aged 5-9 by year
and jurisdiction 18
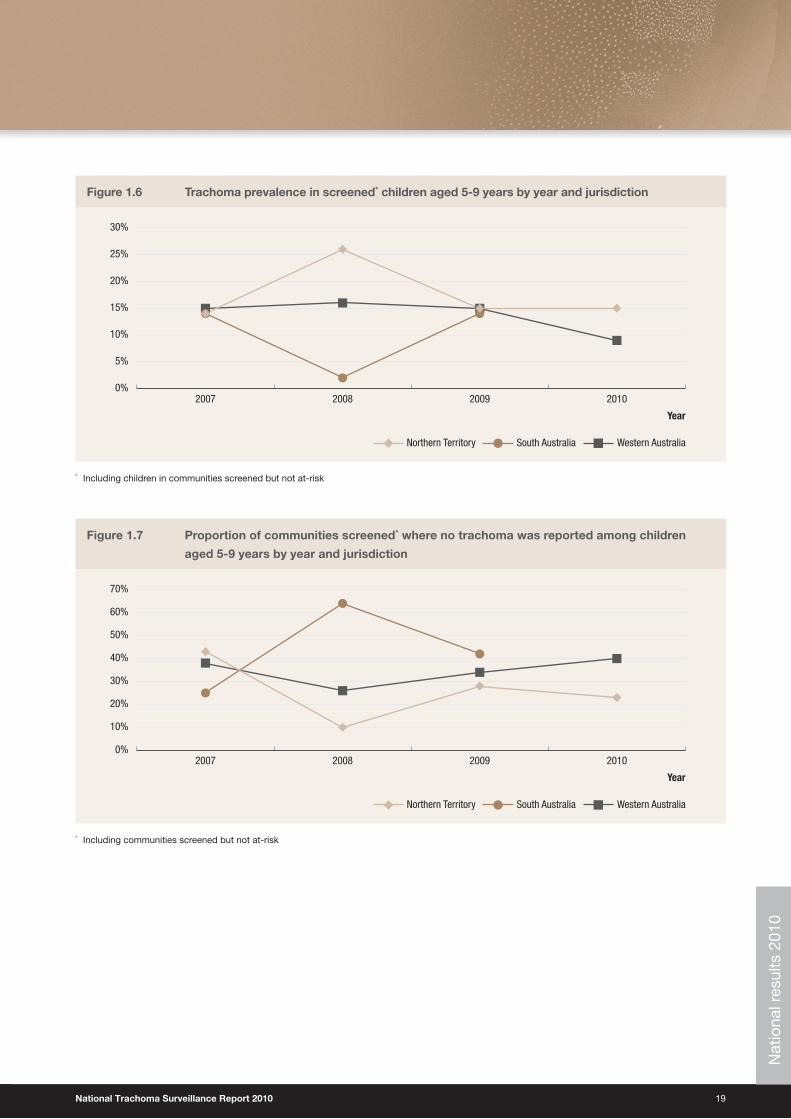
Figure 1.6 Trachoma prevalence in screened children aged 5-9 years by year and jurisdiction 19
Figure 1.7 Proportion of communities screened where no trachoma was reported among children aged
5-9 years by year and jurisdiction 19
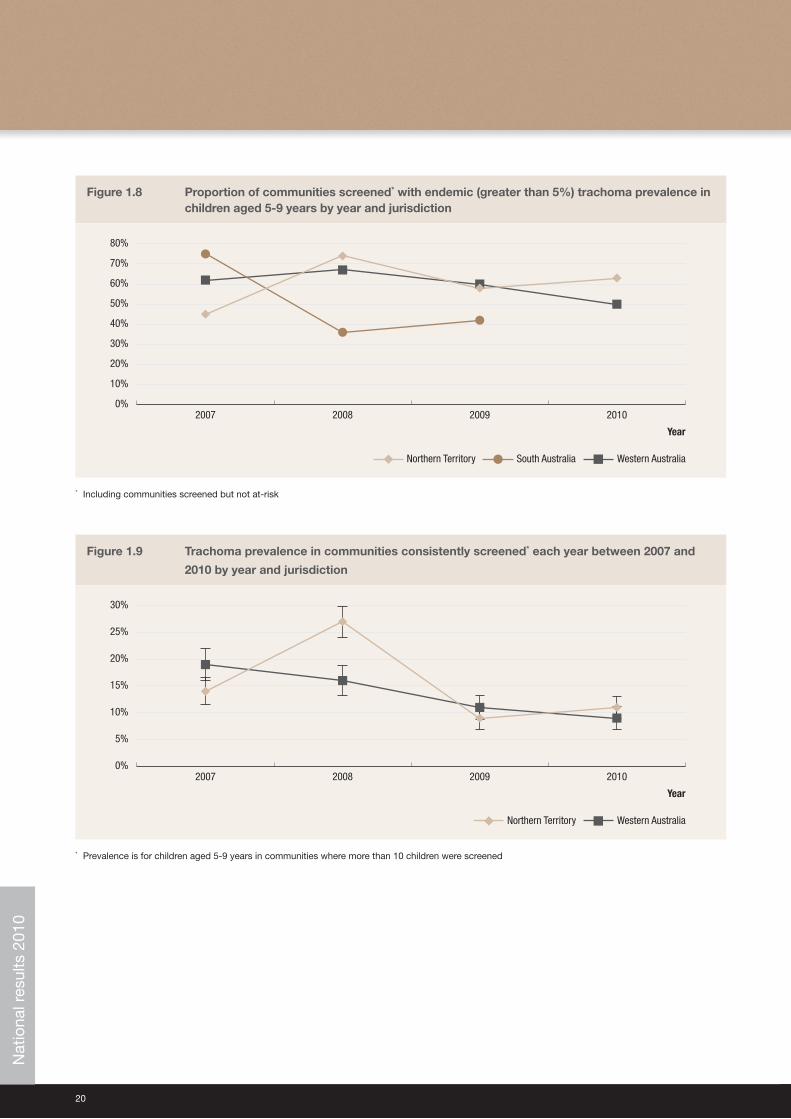
Figure 1.8 Proportion of communities screened with endemic (greater than 5%) trachoma prevalence in children aged 5-9 years by year and jurisdiction 20
Figure 1.9 Trachoma prevalence in communities consistently screened each year between 2007 and
2010 by year and jurisdiction 20
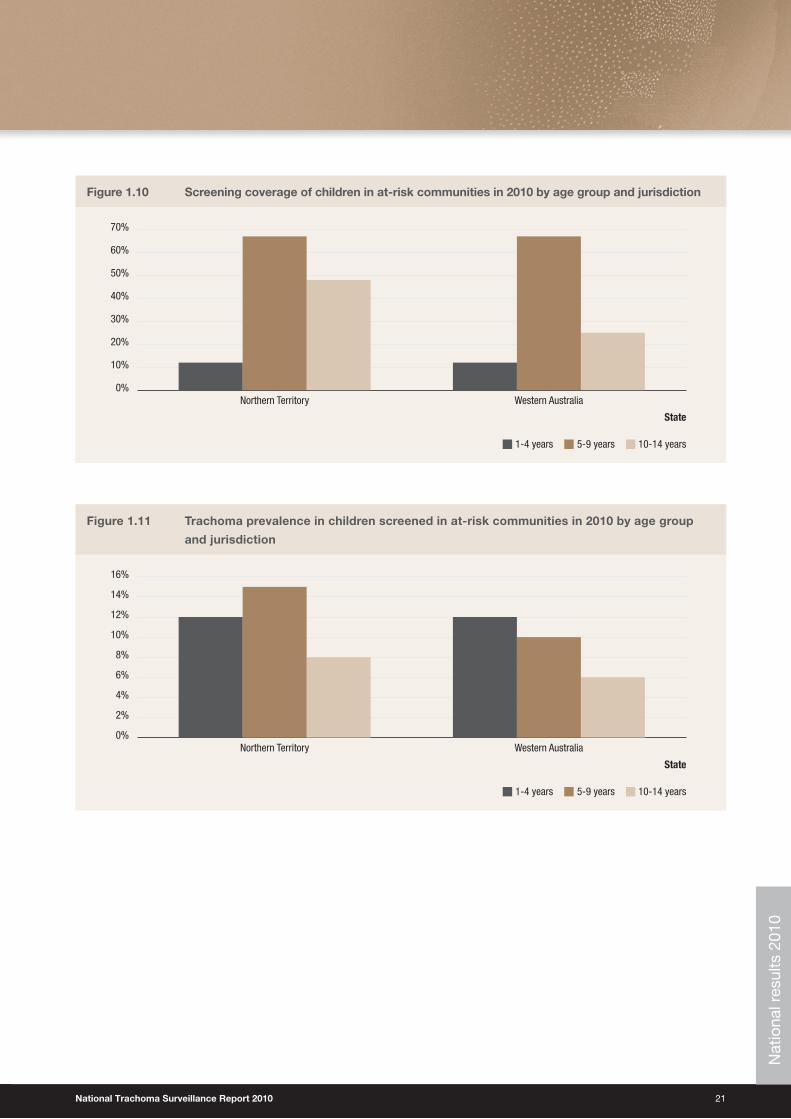
Figure 1.10 Screening coverage of children in at-risk communities in 2010 by age group and jurisdiction 21
Figure 1.11 Trachoma prevalence in children screened in at-risk communities in 2010 by age group and jurisdiction 21
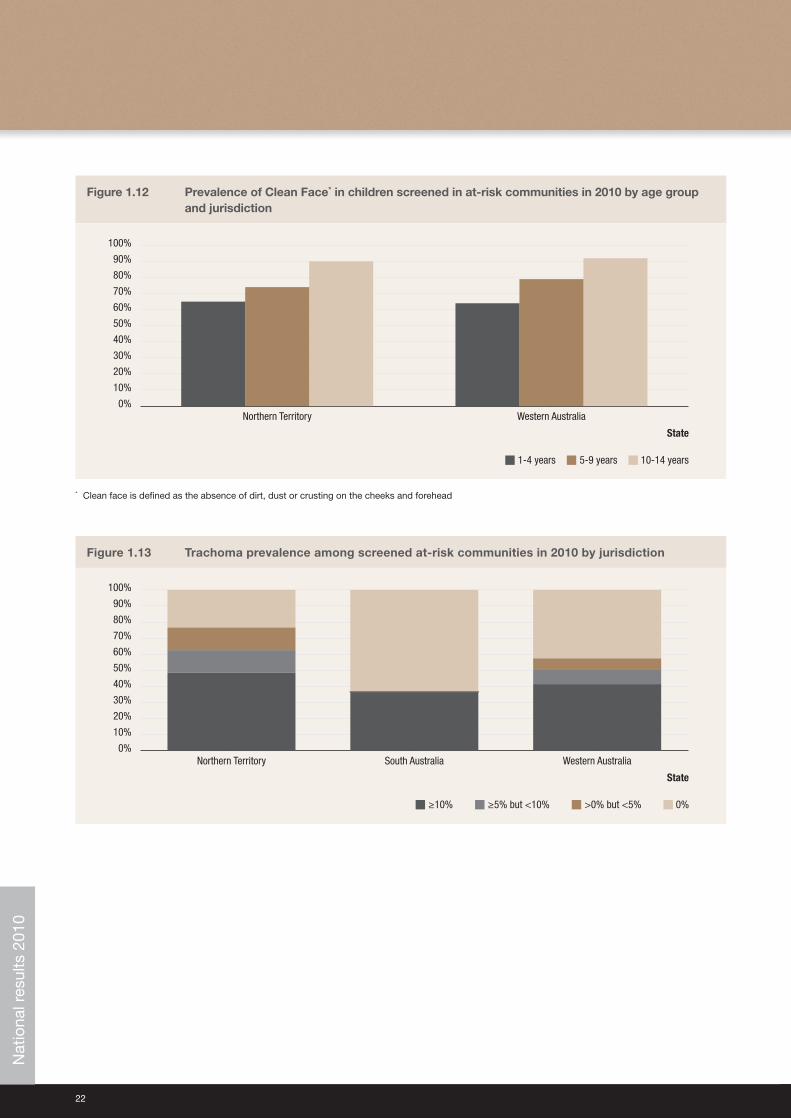
Figure 1.12 Prevalence of Clean Face in children screened in at-risk communities in 2010 by age group and jurisdiction 22
Figure 1.13 Trachoma prevalence among screened at-risk communities in 2010 by jurisdiction 22
Figure 1.14 Method 1. Estimated proportion of population requiring treatment in at-risk communities, according to timing of treatment, by jurisdiction 23
Figure 1.15 Method 2. Estimated proportion of total population requiring treatment in at-risk communities, according to timing of treatment, by jurisdiction 23
Figure 1.16 Percentage of communities with active cases of trachoma, where 80% of those requiring treatment were treated within two weeks of screening 24
Figure 1.17 Prevalence of trachoma in communities with 10 or more children aged 5-9 years examined in both 2009 and 2010 24
Figure 2.1 Trachoma prevalence, community screening coverage and treatment coverage in communities designated as at-risk of trachoma and screened in 2010 in the NT 29
Figure 2.2 Number of communities screened by year and region in the NT 30
Figure 2.3 Population screening coverage of children aged 5-9 years in regions containing at least one
at-risk community by year and region in the NT 30
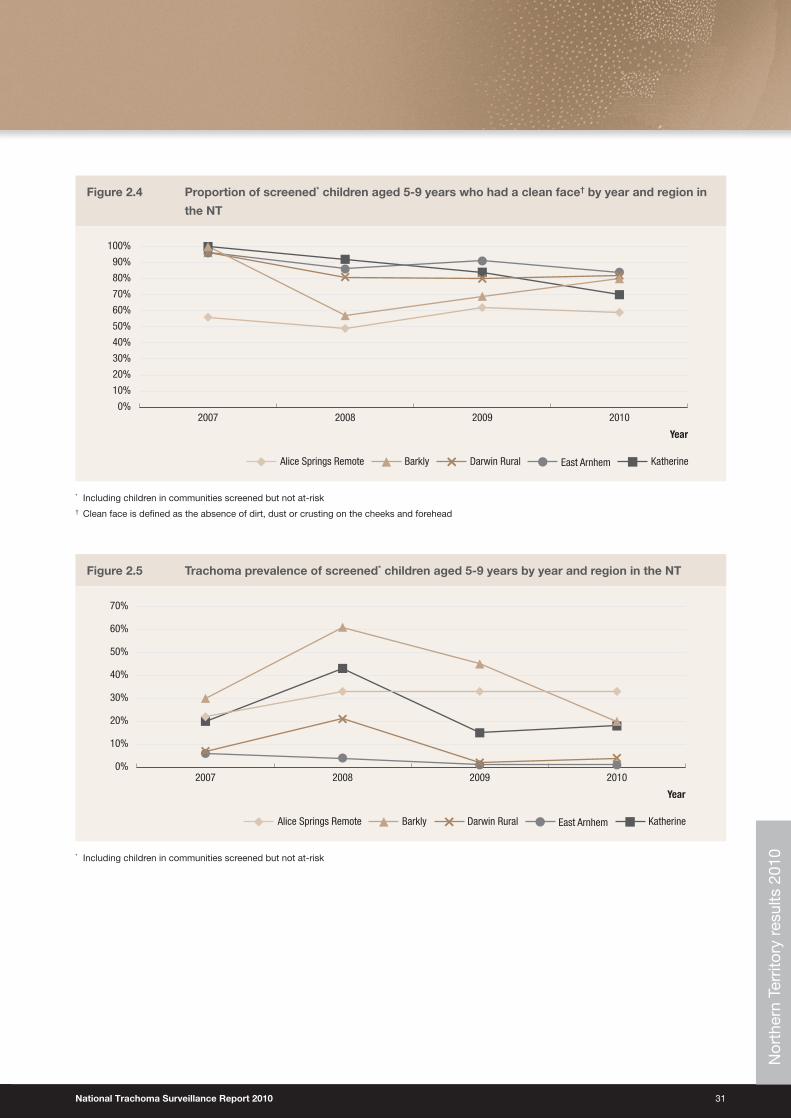
Figure 2.4 Proportion of screened children aged 5-9 years who had a clean face† by year and region in the NT 31
Figure 2.5 Trachoma prevalence of screened children aged 5-9 years by year and region in the NT 31
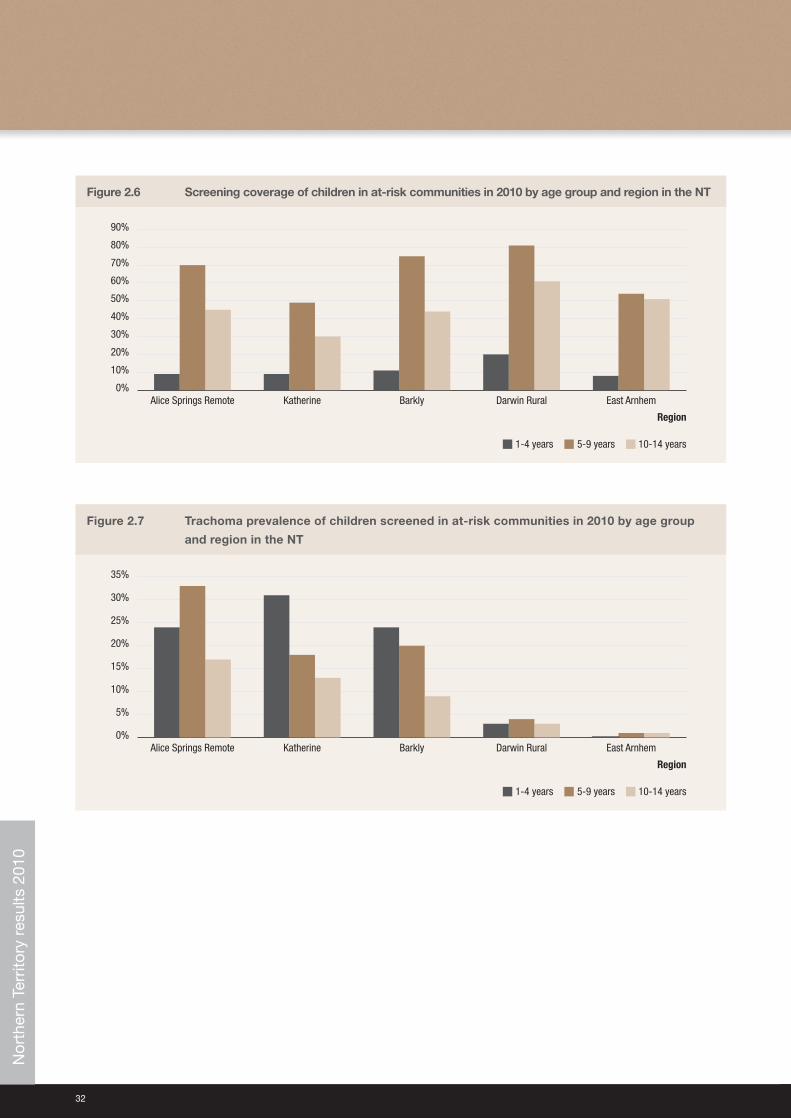
Figure 2.6 Screening coverage of children in at-risk communities in 2010 by age group and region in the NT 32
Figure 2.7 Trachoma prevalence of children screened in at-risk communities in 2010 by age group and region in the NT 32
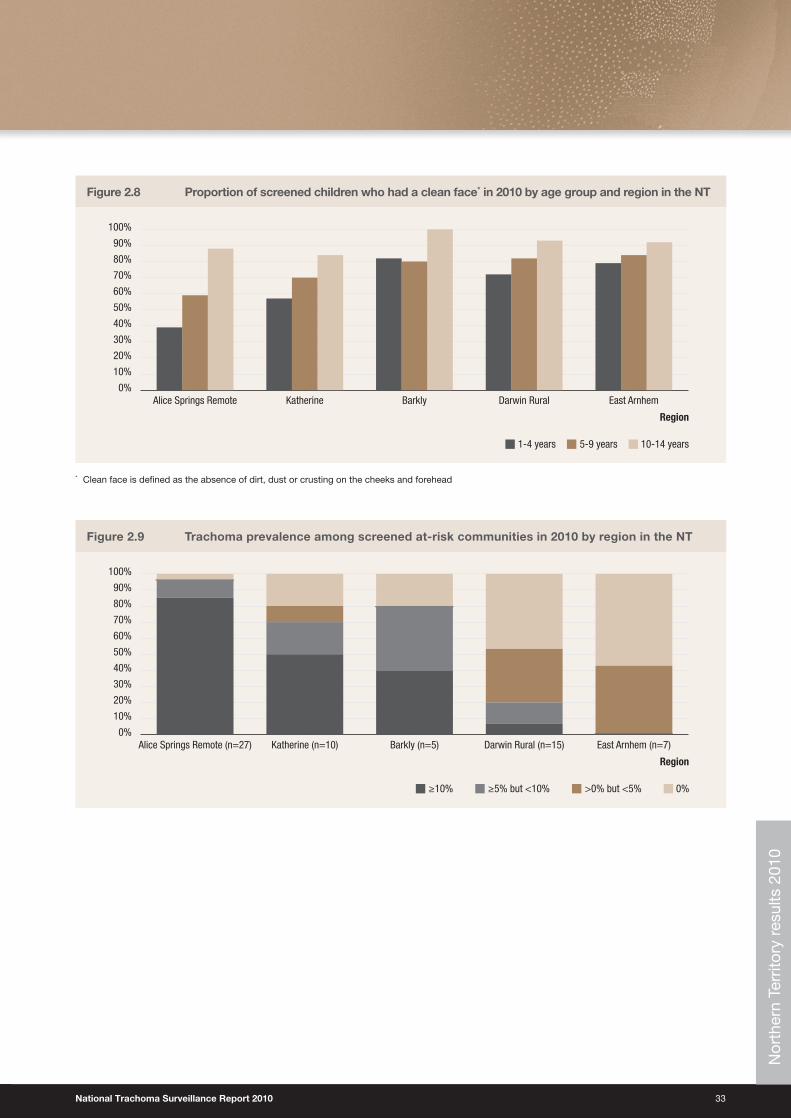
Figure 2.8 Proportion of screened children who had a clean face in 2010 by age group and region in the NT 33
Figure 2.9 Trachoma prevalence among screened at-risk communities in 2010 by region in the NT 33
Figure 3.1 Trachoma prevalence and community screening coverage in communities screened in 2010 in SA 39
Figure 3.2 Trachoma prevalence of screened children aged 1-14 years by year and region in SA (where
10 or more children were screened) 40
Figure 3.3 Proportion of screened children aged 1-14 years who had a clean face by year and region in
SA (where 10 or more children were screened) 40
Figure 4.1 Trachoma prevalence, community screening coverage and treatment coverage in communities designated as at-risk of trachoma and screened in 2010 in WA 44
List of Figures
National Trachoma Surveillance Report 2010 5
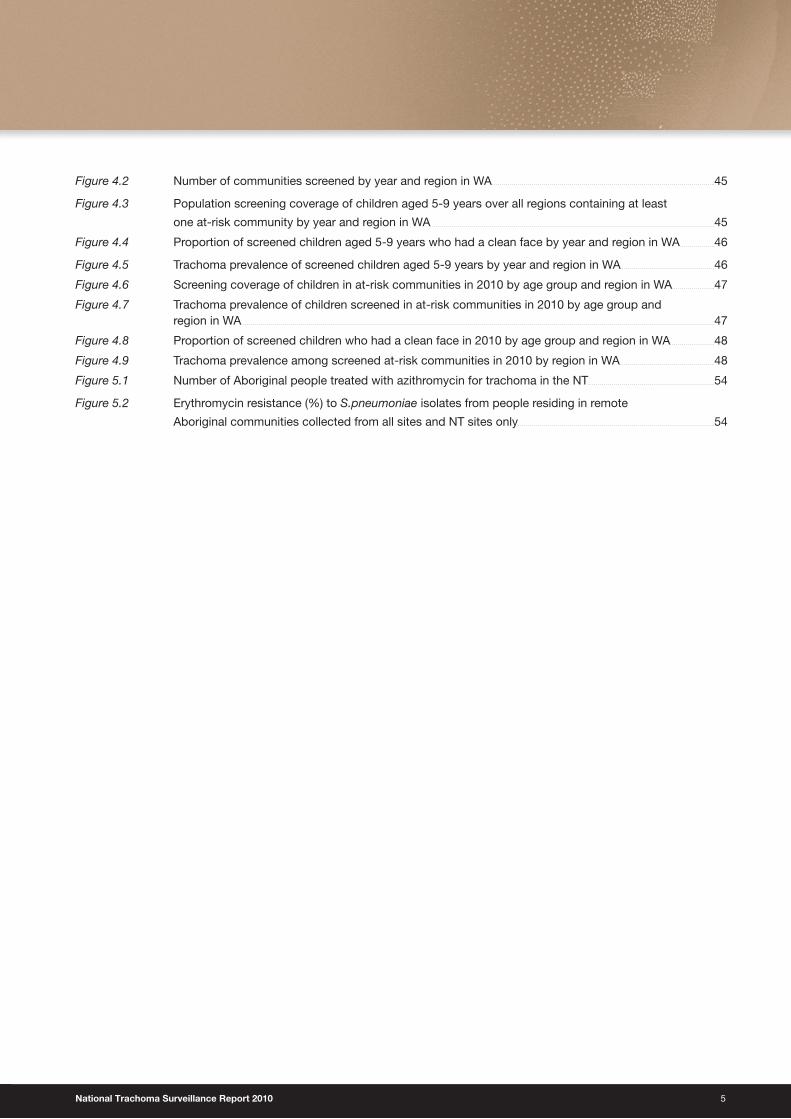
Figure 4.2 Number of communities screened by year and region in WA 45
Figure 4.3 Population screening coverage of children aged 5-9 years over all regions containing at least
one at-risk community by year and region in WA 45
Figure 4.4 Proportion of screened children aged 5-9 years who had a clean face by year and region in WA 46
Figure 4.5 Trachoma prevalence of screened children aged 5-9 years by year and region in WA 46
Figure 4.6 Screening coverage of children in at-risk communities in 2010 by age group and region in WA 47
Figure 4.7 Trachoma prevalence of children screened in at-risk communities in 2010 by age group and region in WA 47
Figure 4.8 Proportion of screened children who had a clean face in 2010 by age group and region in WA 48
Figure 4.9 Trachoma prevalence among screened at-risk communities in 2010 by region in WA 48
Figure 5.1 Number of Aboriginal people treated with azithromycin for trachoma in the NT 54
Figure 5.2 Erythromycin resistance (%) to S.pneumoniae isolates from people residing in remote
Aboriginal communities collected from all sites and NT sites only 54
6
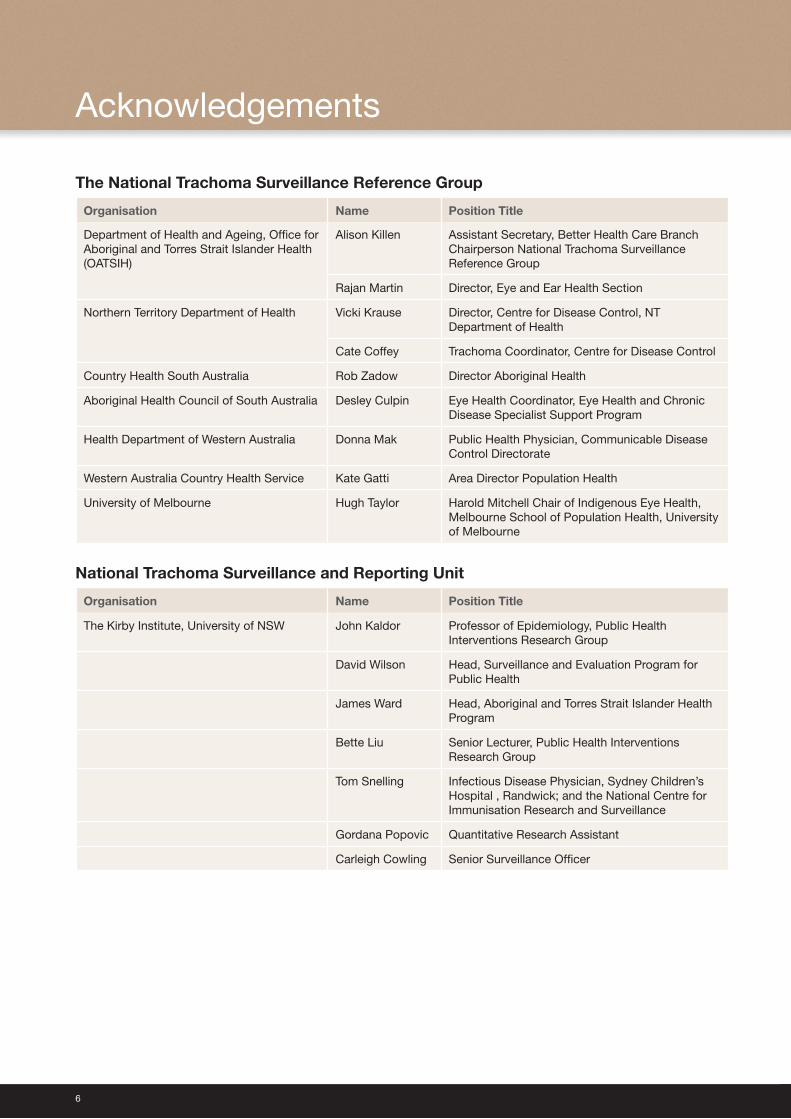
The National Trachoma Surveillance Reference Group
Organisation Name Position Title
Department of Health and Ageing, Office for Aboriginal and Torres Strait Islander Health (OATSIH)
Alison Killen Assistant Secretary, Better Health Care BranchChairperson National Trachoma Surveillance Reference Group
Rajan Martin Director, Eye and Ear Health Section
Northern Territory Department of Health Vicki Krause Director, Centre for Disease Control, NT Department of Health
Cate Coffey Trachoma Coordinator, Centre for Disease Control
Country Health South Australia Rob Zadow Director Aboriginal Health
Aboriginal Health Council of South Australia Desley Culpin Eye Health Coordinator, Eye Health and Chronic Disease Specialist Support Program
Health Department of Western Australia Donna Mak Public Health Physician, Communicable Disease Control Directorate
Western Australia Country Health Service Kate Gatti Area Director Population Health
University of Melbourne Hugh Taylor Harold Mitchell Chair of Indigenous Eye Health, Melbourne School of Population Health, University of Melbourne
National Trachoma Surveillance and Reporting Unit
Organisation Name Position Title
The Kirby Institute, University of NSW John Kaldor Professor of Epidemiology, Public Health Interventions Research Group
David Wilson Head, Surveillance and Evaluation Program for Public Health
James Ward Head, Aboriginal and Torres Strait Islander Health Program
Bette Liu Senior Lecturer, Public Health Interventions Research Group
Tom Snelling Infectious Disease Physician, Sydney Children’s Hospital , Randwick; and the National Centre for Immunisation Research and Surveillance
Gordana Popovic Quantitative Research Assistant
Carleigh Cowling Senior Surveillance Officer
Acknowledgements
National Trachoma Surveillance Report 2010 7
Other jurisdictional contributors
Northern Territory• Aboriginal Community Controlled Health Services
• Aboriginal Medical Services Alliance of the Northern Territory
• Centre for Disease Control, Northern Territory Department of Health, Northern Territory
• Healthy School Age Kids Program: Top End and Central Australia
South Australia• Aboriginal Community Controlled Health Services
• Aboriginal Health Council of South Australia
• Country Health South Australia
Western Australia• Aboriginal Community Controlled Health Services in the Goldfields, Kimberley, Midwest and Pilbara regions
• Communicable Diseases Control Directorate, Health Department of Western Australia
• Goldfields Population Health Unit
• Kimberley Population Health Unit
• Midwest Population Health Unit
• Pilbara Population Health Unit
Pathology provider• Western Diagnostic Pathology
Previous National Trachoma Surveillance and Reporting Units• Centre for Eye Research Australia, The University of Melbourne (NTSRU 2006, 2007, 2008)
• Centre for Molecular, Environmental, Genetic and Analytic Epidemiology, School of Public Health, The University of Melbourne (NTSRU 2009)
8
Active trachoma:� The presence of chronic inflammation of the conjunctiva caused by infection with Chlamydia trachomatis; includes World Health Organization grades Trachomatous inflammation follicular (TF) and/or Trachomatous inflammation intense (TI).
At-risk communities:� Communities classified as being at higher risk of trachoma.
Clean face:� Absence of dirt, dust and crusting on cheeks and forehead.
Community coverage:� Calculated using the number of communities that were screened for trachoma as a proportion of those communities that were designated by each jurisdiction to be at-risk of trachoma in 2010.
Endemic trachoma:� A prevalence of active trachoma of 5% or more in children aged one to nine years or a prevalence of trichiasis of at least 0.1% in the adult population. ‘Endemic trachoma’ is also referred to as blinding endemic trachoma.
Hyper-endemic trachoma:� A prevalence of active trachoma of 20% or more in children within a community.
Prevalence of active trachoma:� Includes active trachoma detected by trachoma screening programs and, in some circumstances, cases detected in clinics.
Screening coverage:� Calculated using the number of children or adults who were examined for Trachoma or trichiasis as a proportion of those who were projected from the ABS 2006 Census of Population and Housing to be resident in Communities at-risk in 2010.
Trachomatous inflammation follicular (TF):� Presence of five or more follicles in the upper tarsal conjunctiva, each at least 0.5 mm in diameter, as observed through a loupe.
Trachomatous inflammation intense (TI):� Pronounced inflammatory thickening of the tarsal conjunctiva that obscures more than half of the normal deep tarsal vessels.
Trachomatous scarring (TS):� Presence of scarring in the tarsal conjunctiva.
Trachomatous trichiasis (TT):� Evidence of the recent removal of in-turned eyelashes or at least one eyelash rubbing on the eyeball.
Treatment coverage:� Calculated using the number of children and adults who received treatment for trachoma as a proportion of those who were calculated according to appropriate treatment strategy to receive treatment for trachoma.
Guide to technical terms/definitions
National Trachoma Surveillance Report 2010 9
ABS Australian Bureau of Statistics
ACCHS Aboriginal Community Controlled Health Service(s)
AGEI Australian Government Emergency Intervention
AHCSA Aboriginal Health Council of South Australia
AMS Aboriginal Medical Service
CDNA Communicable Diseases Network Australia
EH&CDSSP Eye Health and Chronic Disease Specialist Support Program
HSAK Healthy School Age Kids program
NACCHO National Aboriginal Community Controlled Health Organisation
NT Northern Territory
NTSRU National Trachoma Surveillance and Reporting Unit
OATSIH Office for Aboriginal and Torres Strait Islander Health
SA South Australia
SAFE Surgery, Antibiotics, Facial Cleanliness, and Environmental improvement
TF Trachomatous inflammation – follicular
TI Trachomatous inflammation – intense
TS Trachomatous scarring
TT Trachomatous trichiasis
UNSW University of New South Wales
WA Western Australia
WHO World Health Organization
Abbreviations
10
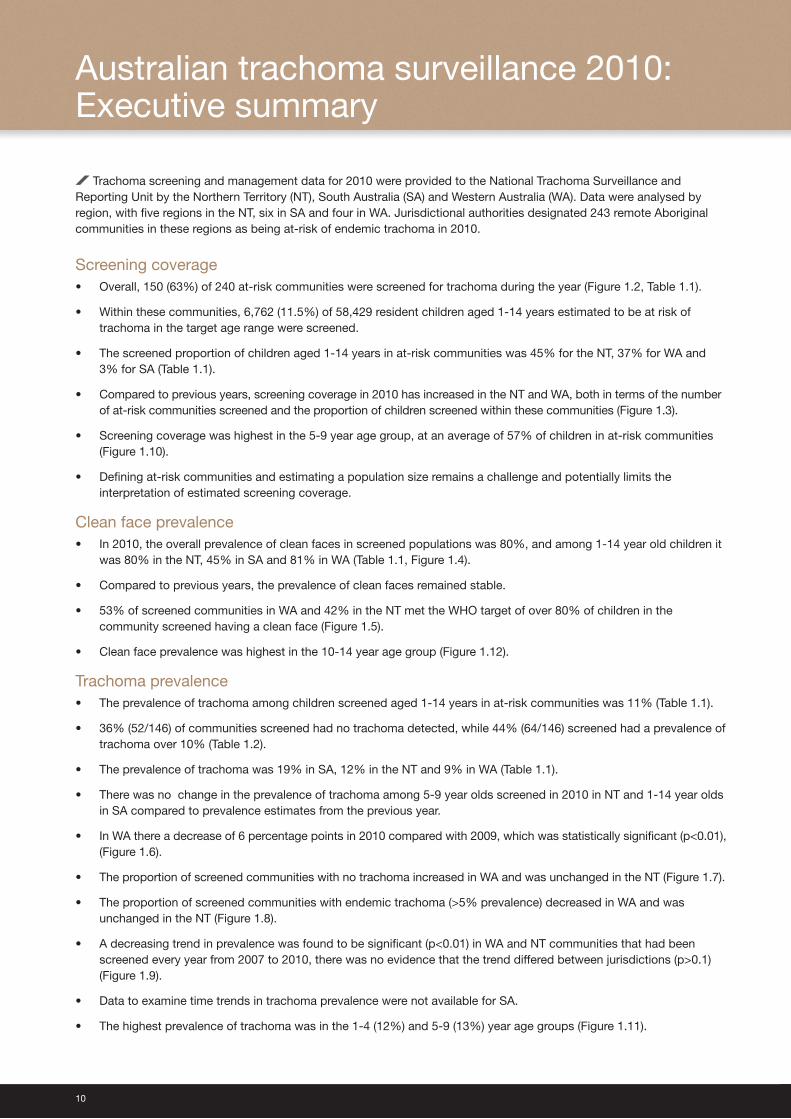
Trachoma screening and management data for 2010 were provided to the National Trachoma Surveillance and Reporting Unit by the Northern Territory (NT), South Australia (SA) and Western Australia (WA). Data were analysed by region, with five regions in the NT, six in SA and four in WA. Jurisdictional authorities designated 243 remote Aboriginal communities in these regions as being at-risk of endemic trachoma in 2010.
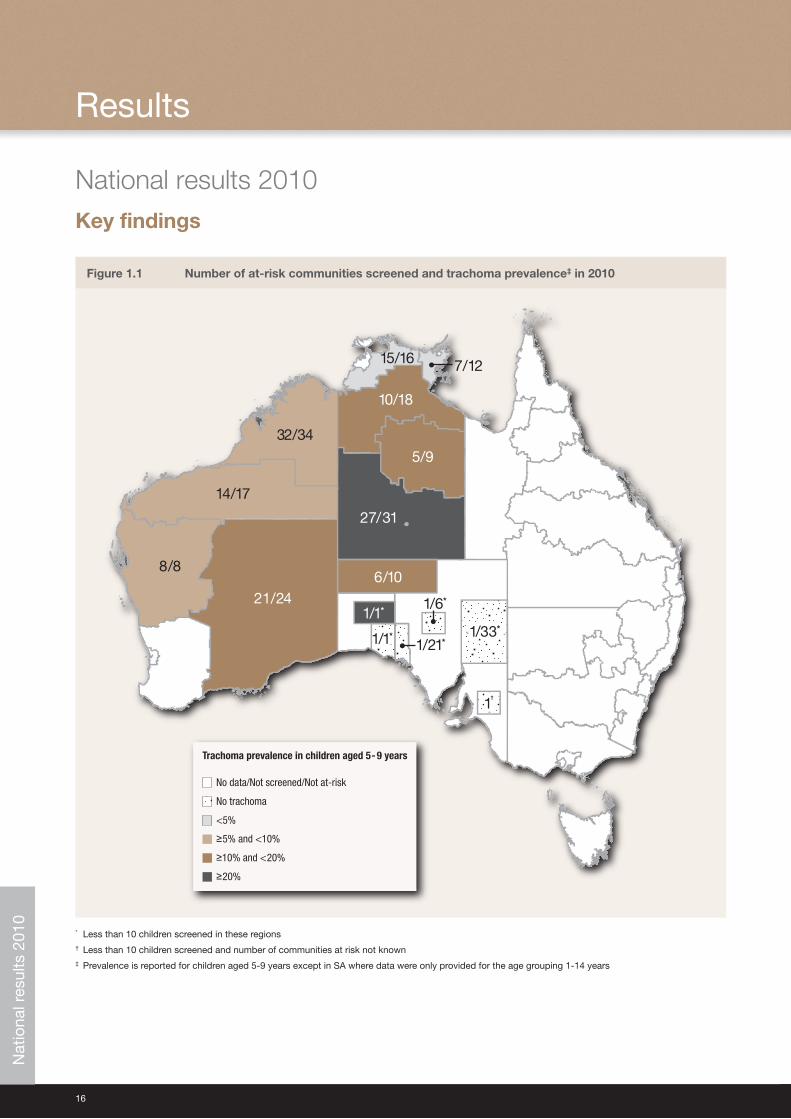
Screening coverage• Overall, 150 (63%) of 240 at-risk communities were screened for trachoma during the year (Figure 1.2, Table 1.1).
• Within these communities, 6,762 (11.5%) of 58,429 resident children aged 1-14 years estimated to be at risk of trachoma in the target age range were screened.
• The screened proportion of children aged 1-14 years in at-risk communities was 45% for the NT, 37% for WA and 3% for SA (Table 1.1).
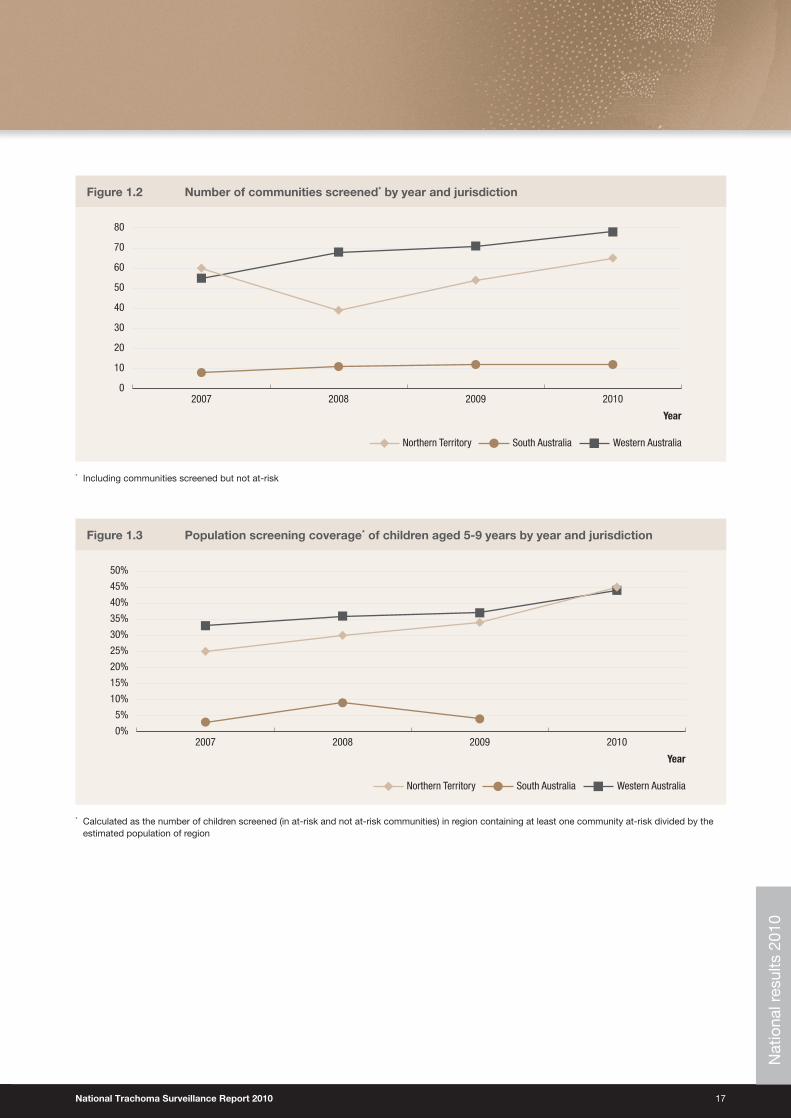
• Compared to previous years, screening coverage in 2010 has increased in the NT and WA, both in terms of the number of at-risk communities screened and the proportion of children screened within these communities (Figure 1.3).
• Screening coverage was highest in the 5-9 year age group, at an average of 57% of children in at-risk communities (Figure 1.10).
• Defining at-risk communities and estimating a population size remains a challenge and potentially limits the interpretation of estimated screening coverage.
Clean face prevalence• In 2010, the overall prevalence of clean faces in screened populations was 80%, and among 1-14 year old children it
was 80% in the NT, 45% in SA and 81% in WA (Table 1.1, Figure 1.4).
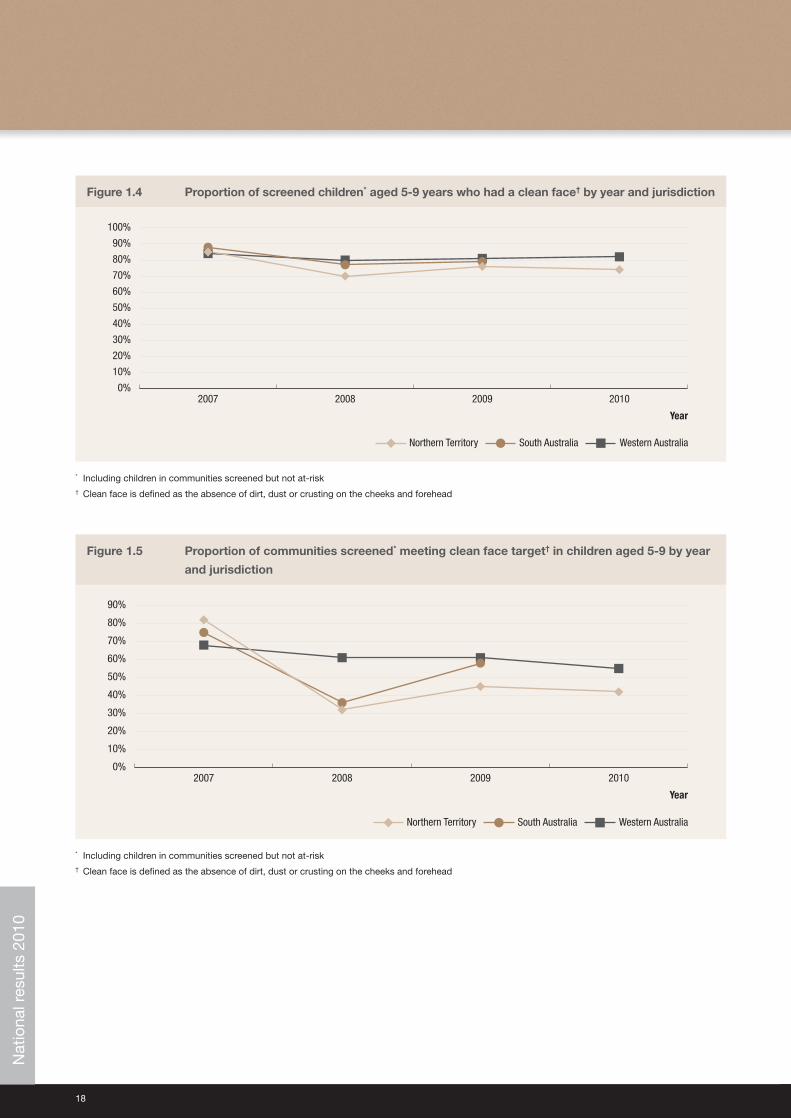
• Compared to previous years, the prevalence of clean faces remained stable.
• 53% of screened communities in WA and 42% in the NT met the WHO target of over 80% of children in the community screened having a clean face (Figure 1.5).
• Clean face prevalence was highest in the 10-14 year age group (Figure 1.12).
Trachoma prevalence• The prevalence of trachoma among children screened aged 1-14 years in at-risk communities was 11% (Table 1.1).
• 36% (52/146) of communities screened had no trachoma detected, while 44% (64/146) screened had a prevalence of trachoma over 10% (Table 1.2).
• The prevalence of trachoma was 19% in SA, 12% in the NT and 9% in WA (Table 1.1).
• There was no change in the prevalence of trachoma among 5-9 year olds screened in 2010 in NT and 1-14 year olds in SA compared to prevalence estimates from the previous year.
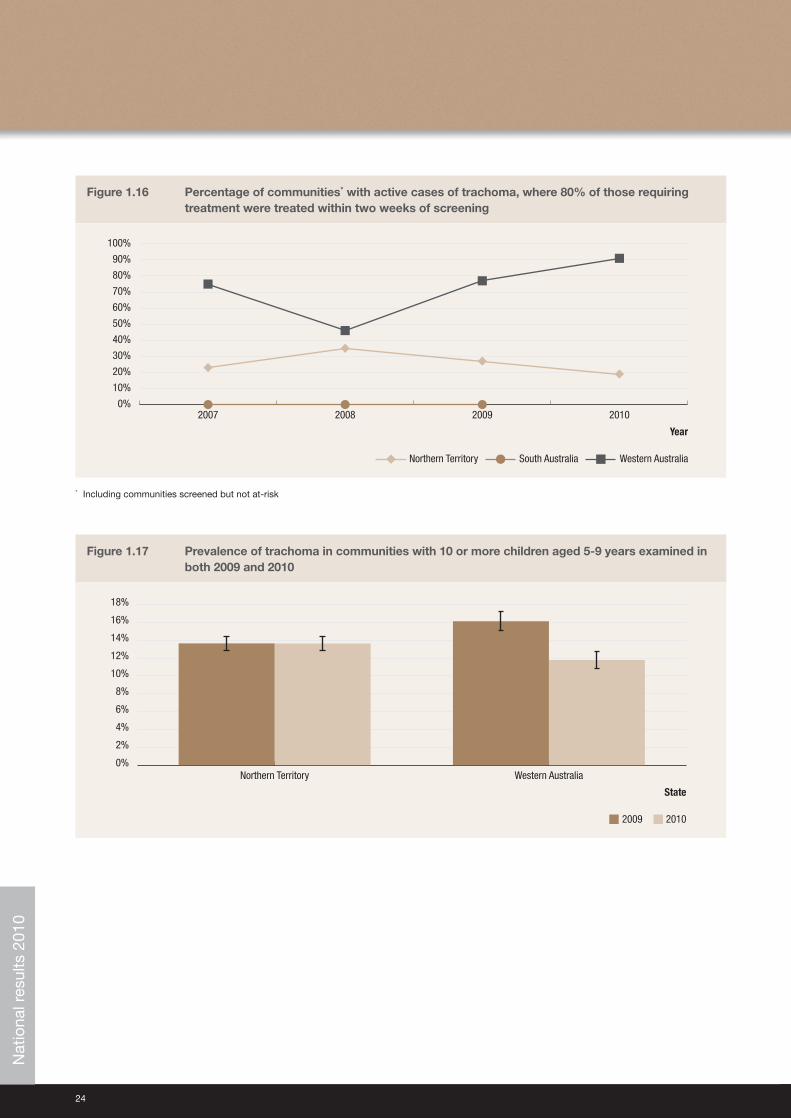
• In WA there a decrease of 6 percentage points in 2010 compared with 2009, which was statistically significant (p<0.01), (Figure 1.6).
• The proportion of screened communities with no trachoma increased in WA and was unchanged in the NT (Figure 1.7).
• The proportion of screened communities with endemic trachoma (>5% prevalence) decreased in WA and was unchanged in the NT (Figure 1.8).
• A decreasing trend in prevalence was found to be significant (p<0.01) in WA and NT communities that had been screened every year from 2007 to 2010, there was no evidence that the trend differed between jurisdictions (p>0.1) (Figure 1.9).
• Data to examine time trends in trachoma prevalence were not available for SA.
• The highest prevalence of trachoma was in the 1-4 (12%) and 5-9 (13%) year age groups (Figure 1.11).
Australian trachoma surveillance 2010:Executive summary
National Trachoma Surveillance Report 2010 11
Treatment coverage• In the NT and WA, cases requiring treatment were detected in 98 out of the 135 communities screened.
• In 91 communities, both trachoma cases and their contacts were treated.
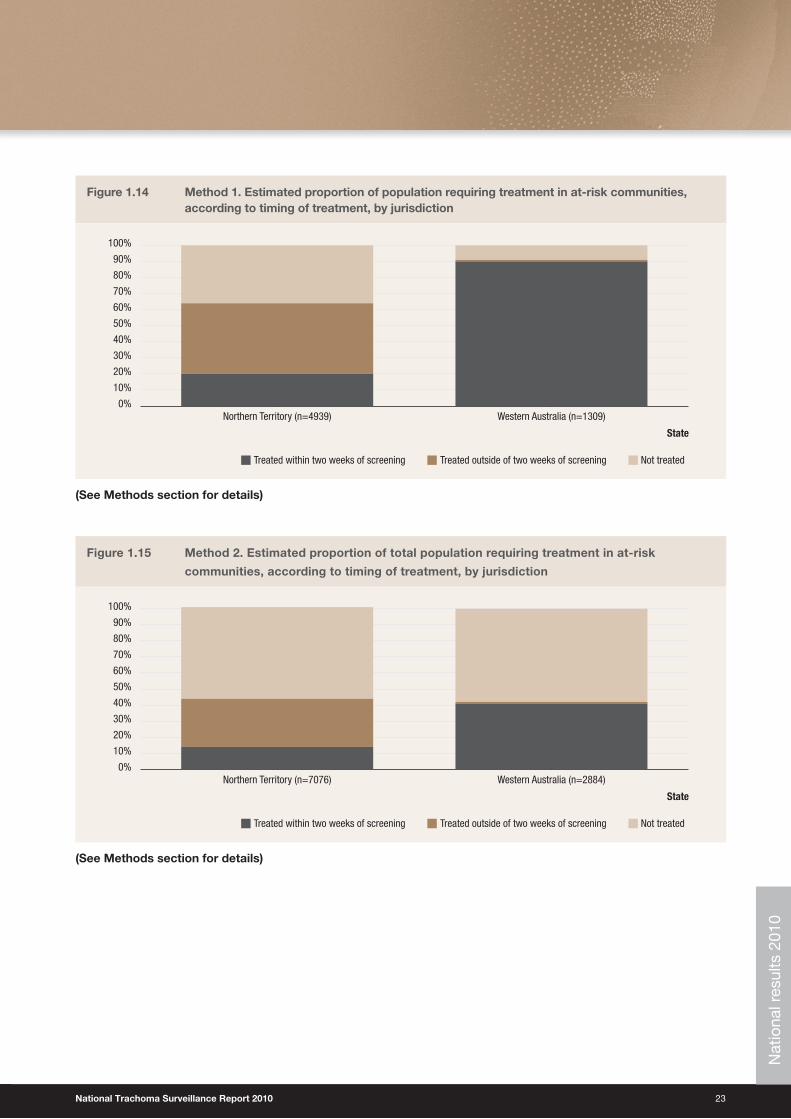
• Treatment coverage of cases and contacts was 64% in the NT, 90% in WA and 70% across both jurisdictions combined.
• Data on treatment coverage were not available for SA.
Trichiasis• Trichiasis screening coverage was low in all jurisdictions, with a total of 1036 adults of an estimated at-risk population
of 12557 were reported to have been screened across the NT, SA and WA (Table 1.2).
• Nine cases of trichiasis were reported in the NT, 13 cases in SA and none in WA, giving an overall prevalence among adults screened of 2%.
• No data were available regarding the extent of surgery for trichiasis in 2010.
Health Promotion activities• Both the NT and WA reported increases in health promotion resources and programs during 2010 that promote
clean faces.
• SA did not report on health promotion activities.
Environmental conditions• In WA, 29% of communities screened were reported as having good environmental conditions, 20% reported variable
conditions, 21% had poor conditions and there were no reports for 31%.
• SA and the NT did not report on the environmental conditions of communities screened.
Communities screened while not designated as at-risk• Five communities defined as being potentially at-risk, but not designated at-risk, were screened for trachoma in 2010:
one each in the NT and SA and three in WA.
• Trachoma was found in all three WA communities but not in the other two.
12
The number of communities screened has increased in Western Australia
and the Northern Territory between 2008 and 2010.
The proportion of children screened in at-risk communities increased in the
Northern Territory and Western Australia between 2007 and 2010.
Trachoma remains endemic, as defined by national and World Health
Organization guidelines, in many remote communities in the Northern
Territory, South Australia and Western Australia.
The prevalence of trachoma in screened communities decreased in Western
Australia between 2009 and 2010 and was stable in the Northern Territory.
Insufficient data were available from South Australia to determine a time trend.
The prevalence of clean faces in screened populations was high at 80% in
2010 and has been consistently so since 2007.
Overall treatment coverage was 70%, but varied widely, indicating the need for
improved coverage in many communities if control goals are to be achieved.
There was limited information on the extent of screening for trichiasis in adults in
at-risk communities, so the burden of disease cannot be accurately estimated.
Jurisdictions received a substantial injection of funding in 2010, which is
reflected in increases in personnel and health promotion resources.
Improvement is needed in the screening coverage of communities for both
trachoma and trichiasis, the coverage and timeliness of treatment, the
definition of populations to be screened, clarity of treatment strategies, and
in the methods used for data collection.
Main messages
National Trachoma Surveillance Report 2010 13
Trachoma is one of the major causes of preventable blindness globally.1 It is an eye infection caused by the bacterium Chlamydia trachomatis (C. trachomatis) serotypes A, B, Ba and C. The infection can be transmitted through close facial contact, hand-to-eye contact, via fomites (towels, clothing and bedding) or by flies. Trachoma is generally found in dry, dusty environments and is linked to poor living conditions. Overcrowding of households, limited water supply for bathing and general hygiene, poor waste disposal systems and high numbers of flies are all associated with trachoma. Children generally have the highest prevalence of trachoma and are believed to be the main reservoirs of infection due to longer durations of infection compared to adults.
Infections with C. trachomatis cause inflammation of the conjunctiva and trachoma is diagnosed by the presence of follicles (white spots) and papillae (red spots) of the inner upper eye lid. Repeated infections with C. trachomatis, especially during childhood, may lead to scarring, contraction and distortion of the eyelid which may in turn cause the eyelashes to rub against the globe; this is known as trichiasis and can lead to blindness.2 3
Trachoma is usually treated by a single dose of azithromycin. Best practice includes treatment of all members of the household in which a case resides. Depending on the prevalence of trachoma in the community as a whole, treatment may also be extended to all children aged six months to 14 years; all household contacts of children, or all members of the community.4
Scarring of the cornea due to trichiasis is irreversible. However, if early signs of in-turned eyelashes are found then surgery is usually effective in preventing further damage to the cornea.
The Global Elimination of Blinding Trachoma (GET) 2020 initiative, supported by the World Health Organization (WHO) Alliance, advocates the implementation of the SAFE strategy. The key components are Surgery (to correct trichiasis), Antibiotic treatment, Facial cleanliness and Environmental improvements. This strategy is ideally implemented through a primary care model within a community focus framework, ensuring consistency in screening, control measures and data collection and reporting.5 6
Trachoma control in AustraliaAustralia is the only developed country where trachoma is still endemic. It occurs primarily in remote and very remote Aboriginal communities in the NT, SA and WA. In 2008, cases were also found in Aboriginal communities in New South Wales and Queensland, regions where trachoma was believed to have been eliminated.4 7 8 The Australian Government, in accordance with the GET 2020 initiative and, through the Improving Eye and Ear Health Services for Indigenous Australians for Better Education and Employment Outcomes measure, committed $16 million over a four-year period towards eliminating trachoma in Australia. The funding is to be used for improving and expanding screening and control activities, as well as establishing a strong framework for monitoring and evaluation. In Australia, the surveillance and management of trachoma is guided by the Communicable Disease Network of Australia (CDNA) ‘Guidelines for the Public Health Management of Trachoma in Australia’ 2006. This document encompasses the WHO SAFE strategies and provides recommendations for improving data collection, collation and reporting systems.9 A substantial injection of funds was provided to the jurisdictions in 2010.
The National Trachoma Surveillance and Reporting Unit (NTSRU)The NTSRU is responsible for trachoma data collation, analysis and reporting related to the ongoing evaluation of trachoma control strategies in Australia. It operates under contract with the Australian Government Department of Health and Ageing, and its primary focus is the three jurisdictions that have been funded to undertake trachoma control activities by the Australian Government. Since the end of 2010, the NTSRU has been based at The Kirby Institute (formally known as the National Centre in HIV Epidemiology and Clinical Research) at the University of New South Wales. It was previously based at The Centre for Eye Research Australia, which produced the 2006 to 2008 Annual Reports10 11 12, and the Centre for Molecular, Environmental, Genetic and Analytic Epidemiology, The University of Melbourne, which produced the 2009 Annual Report.13
Background
14
Each jurisdiction undertook screening and treatment for trachoma according to their respective state/territory protocols, broadly following CDNA guidelines. Screening undertaken for each jurisdiction used a convenience sampling method.
In 2006, at the commencement of the National Trachoma Management Program, representatives from each jurisdiction identified at-risk communities from historical data and other knowledge. Over time, some communities have been reclassified. Screening for trachoma focuses on the at-risk communities, but a small number of other communities may be screened each year, generally if there is anecdotal information suggesting the presence of cases.
WHO trachoma grading criteria (Appendix 1) were used to diagnose and classify individual cases of trachoma. The CDNA guidelines recommend treatment strategies according to the prevalence of active trachoma within the community.Screening undertaken for each jurisdiction used a convenience sampling method.
Data collection forms (Appendix 2) were developed by the National Trachoma Surveillance Reference Group, based on the CDNA Guidelines. Jurisdictions agreed that data would be collected on the forms, entered into a database and forwarded to the NTSRU for checking and analysis. Information was to be provided to the NTSRU at the level of community and included:
• Number of Aboriginal children aged 1-14 years screened for clean faces and the number with clean faces;
• Number of Aboriginal children aged 1-14 years screened for trachoma and the number with trachoma;
• Episodes of treatment of active cases of trachoma, household contacts and community members;
• Number of Aboriginal adults screened for trichiasis, the number with trichiasis, and the number undergoing surgery for trichiasis;
• Community level implementation of WHO SAFE strategies.
Northern TerritoryTrachoma screening and management in the NT is undertaken through collaboration between the Centre for Disease Control and Child Health Program within the NT Department of Health. Trachoma screening is incorporated into the Healthy School Age Kids (HSAK)14 annual check and conducted by either local primary health care units or Aboriginal Community Controlled Health Service (ACCHS). Following screening, treatment is generally undertaken by primary health care services with support from the CDC.
In 2010, there was no systematic trichiasis screening in adults. Some adult screening took place during community visits by optometrists or ophthalmologists from the Regional Eye Health Service based in Alice Springs.
South AustraliaIn 2010, Country Health South Australia was responsible for trachoma screening and management, and activities were undertaken by the Eye Health and Chronic Disease Specialist Support Program (EH&CDSSP), Aboriginal Health Council of South Australia. Regular visits to South Australian Aboriginal communities were made by visiting optometrists, ophthalmologists and the project coordinator of EH&CDSSP and incorporated trachoma screening and management. Trichiasis screening was undertaken opportunistically for adults who saw the EH&CDSSP team.
Western AustraliaTrachoma screening and management is the responsibility of Population Health Units (PHUs) in the Kimberley, Goldfields, Pilbara and Midwest Health Regions. In collaboration with the local primary health care units, the PHUs screen communities in each region within a two week period, usually at the end of August or early September. Treatment is undertaken at the time of screening.
Trichiasis screening was undertaken in conjunction with adult influenza vaccinations.
Methodology
National Trachoma Surveillance Report 2010 15
Data analysisFor the purpose of the National Trachoma Management Program, a community is defined as a specific location where people reside and there is at least one school. Community coverage is defined as the proportion of at-risk communities screened for trachoma. Individual screening coverage is the proportion of children in the target age group in a community who were actually screened.
Population data were based as in previous reports, on the 2006 census conducted by the Australian Bureau of Statistics (ABS)15. The census counts for communities were projected forward for subsequent years using the ABS median series projected increase (1.6%, 1.8% and 2.1% in the NT, WA and SA respectively). Prevalence of active trachoma was calculated using the number of children screened as the denominator.
Trachoma data were collated in the age groups 0-4, 5-9 and 10-15 years. Comparisons over time were limited to the 5-9 year age range due to the consistently higher screening coverage across all jurisdictions in this age range. Data from 2006 were excluded from assessment of time trends as collection methods in this first year differed from those subsequently adopted.
Adherence to the CDNA guidelines was assessed by the proportion of active cases and contacts requiring treatment that were in fact treated within two weeks of screening of the index case. We also calculated the proportion of contacts treated regardless of when treatment took place. Data received did not provide information of treatment of active cases outside a two week period post screening.
If prevalence of trachoma exceeded the level at which community treatment was indicated, we used two methods to estimate the number of individuals requiring treatment for each region. Two methods were considered due to an apparent difference in interpretation of treatment guidelines.
• Method 1 (targeted treatment) was based on the number of cases of trachoma detected through screening, plus the number of contacts reported as requiring treatment. If the number of contacts was not reported and mass treatment was required, it was estimated as the number of children in the community aged 6 months – 14 years plus the number of household contacts of active cases.
• Method 2 (whole community treatment) was based on the assumption that all members of the community required treatment when mass treatment was required.
(See Appendix 3 for further detail)
Antibiotic resistanceThe recommended method of predicting Azithromycin resistance is by testing Streptococcus pneumoniae organisms for erythromycin resistance. The participating laboratory performed antimicrobial susceptibility tests according to their routine standardised methodology - CDS (calibrated dichotomous susceptibility test), CLSI (clinical and labarotory standards institute) agar dilution or MIC testing)16. Macrolide resistance will be measured to erythromycin (both intermediate and high level resistance) in S. pneumoniae (invasive and non-invasive) isolated from all specimen sites. This is the same testing methodology used by the AGAR in 2006.17
De-identified data will be extracted from the Pathology provider database for a period of six months from June to December 2010, and transferred to the NTSRU. While indigenous status is not recorded within the databases, region of residence or sample collection site will be utilised to include only regions with known high indigenous populations.
16
Results
National results 2010Key findings
Figure 1.1 Number of at-risk communities screened and trachoma prevalence‡ in 2010
1/1* 1/33*
1†
No data/Not screened/Not at-risk
No trachoma
<5%
≥5% and <10%
≥10% and <20%
≥20%
Trachoma prevalence in children aged 5-9 years
15/16
1/1*1/21*
1/6*
1/33*
1†
10/18
5/9
27/31
32/34
14/17
8/8
21/241/1*
6/10
7/12
* Less than 10 children screened in these regions† Less than 10 children screened and number of communities at risk not known‡ Prevalence is reported for children aged 5-9 years except in SA where data were only provided for the age grouping 1-14 years
Nat
iona
l res
ults
201
0
National Trachoma Surveillance Report 2010 17
Figure 1.2 Number of communities screened* by year and jurisdiction
0
10
20
30
40
50
60
70
80
2010200920082007
Western AustraliaSouth AustraliaNorthern Territory
Year
* Including communities screened but not at-risk
Figure 1.3 Population screening coverage* of children aged 5-9 years by year and jurisdiction
0%
5%
10%
15%
20%
25%
30%
35%
40%
45%
50%
2010200920082007
Western AustraliaSouth AustraliaNorthern Territory
Year
* Calculated as the number of children screened (in at-risk and not at-risk communities) in region containing at least one community at-risk divided by the estimated population of region
Nat
iona
l res
ults
201
0
18
Figure 1.4 Proportion of screened children* aged 5-9 years who had a clean face† by year and jurisdiction
0%
10%
20%
30%
40%
50%
60%
70%
80%
90%
100%
2010200920082007
Western AustraliaSouth AustraliaNorthern Territory
Year
* Including children in communities screened but not at-risk† Clean face is defined as the absence of dirt, dust or crusting on the cheeks and forehead
Figure 1.5 Proportion of communities screened* meeting clean face target† in children aged 5-9 by year
and jurisdiction
0%
10%
20%
30%
40%
50%
60%
70%
80%
90%
2010200920082007
Western AustraliaSouth AustraliaNorthern Territory
Year
* Including children in communities screened but not at-risk† Clean face is defined as the absence of dirt, dust or crusting on the cheeks and forehead
Nat
iona
l res
ults
201
0
National Trachoma Surveillance Report 2010 19
Figure 1.6 Trachoma prevalence in screened* children aged 5-9 years by year and jurisdiction
0%
5%
10%
15%
20%
25%
30%
2010200920082007
Western AustraliaSouth AustraliaNorthern Territory
Year
* Including children in communities screened but not at-risk
Figure 1.7 Proportion of communities screened* where no trachoma was reported among children
aged 5-9 years by year and jurisdiction
0%
10%
20%
30%
40%
50%
60%
70%
2010200920082007
Western AustraliaSouth AustraliaNorthern Territory
Year
* Including communities screened but not at-risk
Nat
iona
l res
ults
201
0
20
Figure 1.8 Proportion of communities screened* with endemic (greater than 5%) trachoma prevalence in children aged 5-9 years by year and jurisdiction
0%
10%
20%
30%
40%
50%
60%
70%
80%
2010200920082007
Western AustraliaSouth AustraliaNorthern Territory
Year
* Including communities screened but not at-risk
Figure 1.9 Trachoma prevalence in communities consistently screened* each year between 2007 and
2010 by year and jurisdiction
0%
5%
10%
15%
20%
25%
30%
2010200920082007
Western AustraliaNorthern Territory
Year
* Prevalence is for children aged 5-9 years in communities where more than 10 children were screened
Nat
iona
l res
ults
201
0
National Trachoma Surveillance Report 2010 21
Figure 1.10 Screening coverage of children in at-risk communities in 2010 by age group and jurisdiction
0%
10%
20%
30%
40%
50%
60%
70%
Western AustraliaNorthern Territory
1-4 years 5-9 years 10-14 years
State
Figure 1.11 Trachoma prevalence in children screened in at-risk communities in 2010 by age group
and jurisdiction
0%
2%
4%
6%
8%
10%
12%
14%
16%
Western AustraliaNorthern Territory
1-4 years 5-9 years 10-14 years
StateN
atio
nal r
esul
ts 2
010
22
Figure 1.12 Prevalence of Clean Face* in children screened in at-risk communities in 2010 by age group and jurisdiction
0%
10%
20%
30%
40%
50%
60%
70%
80%
90%
100%
Western AustraliaNorthern Territory
1-4 years 5-9 years 10-14 years
State
* Clean face is defined as the absence of dirt, dust or crusting on the cheeks and forehead
Figure 1.13 Trachoma prevalence among screened at-risk communities in 2010 by jurisdiction
0%
10%
20%
30%
40%
50%
60%
70%
80%
90%
100%
Western AustraliaSouth AustraliaNorthern Territory
≥5% but <10% ≥10% >0% but <5% 0%
State
Nat
iona
l res
ults
201
0
National Trachoma Surveillance Report 2010 23
Figure 1.14 Method 1. Estimated proportion of population requiring treatment in at-risk communities, according to timing of treatment, by jurisdiction
0%
10%
20%
30%
40%
50%
60%
70%
80%
90%
100%
Western Australia (n=1309)Northern Territory (n=4939)
Treated within two weeks of screening Treated outside of two weeks of screening Not treated
State
(See Methods section for details)
Figure 1.15 Method 2. Estimated proportion of total population requiring treatment in at-risk
communities, according to timing of treatment, by jurisdiction
0%
10%
20%
30%
40%
50%
60%
70%
80%
90%
100%
Western Australia (n=2884)Northern Territory (n=7076)
Treated within two weeks of screening Treated outside of two weeks of screening Not treated
State
(See Methods section for details)
Nat
iona
l res
ults
201
0
24
Figure 1.16 Percentage of communities* with active cases of trachoma, where 80% of those requiring treatment were treated within two weeks of screening
0%
10%
20%
30%
40%
50%
60%
70%
80%
90%
100%
2010200920082007
Western AustraliaSouth AustraliaNorthern Territory
Year
* Including communities screened but not at-risk
Figure 1.17 Prevalence of trachoma in communities with 10 or more children aged 5-9 years examined in both 2009 and 2010
0%
2%
4%
6%
8%
10%
12%
14%
16%
18%
Western AustraliaNorthern Territory
2009 2010
State
Nat
iona
l res
ults
201
0
National Trachoma Surveillance Report 2010 25
Tab
le 1
.1
Trac
hom
a sc
reen
ing
co
vera
ge
and
pre
vale
nce,
cle
an f
ace
pre
vale
nce
and
tre
atm
ent
cove
rag
e in
201
0 b
y ju
risd
icti
on
At-r
isk
com
mun
ities
Nort
hern
Ter
ritor
ySo
uth
Aust
ralia
Wes
tern
Aus
tral
iaTo
tal
Age
grou
p (y
ears
)1-
45-
910
-14
15+
All
1-4
5-9
10-1
415
+Al
l1-
45-
910
-14
15+
All
1-4
5-9
10-1
415
+Al
l
Estim
ated
Abo
rigin
al p
opul
atio
n at
-ris
k*28
4337
0533
9520
291
3078
481
810
2911
2578
9995
0317
2423
0019
8012
046
1814
253
8470
3465
0040
236
5842
9
Num
ber o
f com
mun
ities
at-
risk*
8671
8324
0
Num
ber o
f com
mun
ities
scr
eene
d64
1175
150
Child
ren
exam
ined
for c
lean
face
†34
424
6816
3944
5186
205
1570
501
2276
549
4038
2140
6813
Child
ren
with
cle
an fa
ce†
224
1836
1483
3543
3913
212
4146
118
3435
630
7719
4454
16
Clea
n fa
ce p
reva
lenc
e65
%74
%90
%80
%45
%64
%79
%92
%81
%65
%76
%91
%79
%
Child
ren
exam
ined
for t
rach
oma
345
2468
1628
4441
8620
215
4550
322
5054
740
1321
3167
77
Scre
enin
g co
vera
ge12
%67
%48
%45
%3%
12%
67%
25%
37%
10%
57%
33%
35%
Child
ren
with
act
ive
trach
oma
4235
912
552
616
2515
132
208
6751
015
775
0
Activ
e tra
chom
a pr
eval
ence
12%
15%
8%12
%19
%12
%10
%6%
9%12
%13
%7%
11%
Trac
hom
a pr
eval
ence
1-9
yea
rs
14
%
10%
13%
Trac
hom
a pr
eval
ence
1-9
yea
rs
(wei
ghte
d by
pop
ulat
ion)
‡
14
%
11%
13%
Age
grou
p (y
ears
) 0-
45-
910
-14
15+
All
0-4
5-9
10-1
415
+Al
l0-
45-
910
-14
15+
All
0-4
5-9
10-1
415
+Al
l
Num
ber o
f com
mun
ities
requ
iring
trea
tmen
t
50
48
98
Activ
e ca
ses
requ
iring
trea
tmen
t42
360
125
527
2515
132
20
864
508
154
72
6
Activ
e ca
ses
rece
ived
trea
tmen
t with
in 2
wee
ks25
145
4721
7
24
148
3220
446
290
76
412
% A
ctiv
e ca
ses
rece
ived
trea
tmen
t with
in 2
wee
ks60
%40
%38
%41
%
96%
98%
100%
98%
72%
57%
49%
57
%
Met
hod
1§
Estim
ated
con
tact
s re
quiri
ng tr
eatm
ent
42
57
11
81
54
38
Cont
acts
rece
ived
trea
tmen
t tot
al37
050
538
115
9528
51
97
271
149
537
1054
467
776
530
2132
3905
Estim
ated
ove
rall
trea
tmen
t cov
erag
e 2
wee
ks1
20
%
90
%
36
%
Estim
ated
ove
rall
trea
tmen
t cov
erag
e to
tal**
64%
91
%
70
%
Met
hod
2§
Estim
ated
con
tact
s re
quiri
ng tr
eatm
ent
6549
2791
9340
Cont
acts
rece
ived
trea
tmen
t tot
al37
050
538
115
9528
51
97
271
149
537
1054
467
776
530
2132
3905
Estim
ated
ove
rall
trea
tmen
t cov
erag
e 2
wee
ks
14
%
41
%
20
%
Estim
ated
ove
rall
trea
tmen
t cov
erag
e to
tal**
43%
42
%
43
%
* C
omm
uniti
es w
ere
clas
sifie
d a
s at
-ris
k or
not
at-
risk
by
juris
dic
tions
† C
lean
face
is d
efin
ed a
s th
e ab
senc
e of
dirt
, dus
t or
cru
stin
g on
the
che
eks
and
fore
head
2
‡ C
alcu
late
d a
s th
e p
rop
ortio
ns o
f chi
ldre
n w
ith a
ctiv
e tr
acho
ma
in a
ge g
roup
s 1-
4 an
d 5
-9 y
ears
, wei
ghte
d b
y th
e es
timat
ed p
opul
atio
n si
zes
of e
ach
age
grou
p. T
his
was
don
e in
ord
er t
o ac
coun
t fo
r un
even
cov
erag
e w
ith r
esp
ect
to a
ge g
roup
s§
Est
imat
ed u
sing
ave
rage
num
ber
of h
ouse
hold
con
tact
s p
er c
hild
in c
omm
uniti
es w
ho r
epor
ted
num
ber
of c
onta
cts
req
uirin
g tr
eatm
ent
and
pop
ulat
ion
stat
istic
s (s
ee M
etho
dol
ogy
for
det
ail)
** A
ctiv
e ca
ses
trea
ted
, but
not
with
in t
wo
wee
ks, w
ere
not
rep
orte
d. N
umb
er o
f act
ive
case
s tr
eate
d in
tot
al is
tak
en t
o b
e th
e sa
me
as n
umb
er o
f act
ive
case
s tr
eate
d in
tw
o w
eeks
Nat
iona
l res
ults
201
0
26
Table 1.2 Number of communities according to different trachoma prevalence ranges (among children aged 5-9 years)
Prevalence
At-risk* communities
Northern Territory South Australia Western Australia Total
0% 15 23% 7 64% 32 43% 54 36%
>0% but <5% 9 14% 0 0% 5 7% 14 9%
≥5% but <10% 9 14% 0 0% 7 9% 16 11%
≥10% 31 48% 4 36% 31 41% 66 44%
Total 64 11 75 150
* Communities were classified as at-risk or not at-risk by jurisdictions
Table 1.3 Trichiasis screening coverage, prevalence and treatment among Aboriginal adults aged over 40 years in 2010
Northern Territory South Australia Western Australia Total
Estimated adult population of at-risk* communities 6509 2297 3751 12557
Number of communities at-risk* 86 32 83 201
Number of communities screened for trichiasis 18 21% 12 38% 14 17% 34 17%
Adults examined (% of total estimated population) 221 3% 438 19% 377 10% 1036 8%
With trichiasis 13 6% 9 2% 0 22 2%
Offered ophthalmic consultation 12 0 0 12
Surgery in past 12 months 1 0 1 1
* Communities were classified as at-risk or not at-risk by jurisdictions
Nat
iona
l res
ults
201
0
National Trachoma Surveillance Report 2010 27
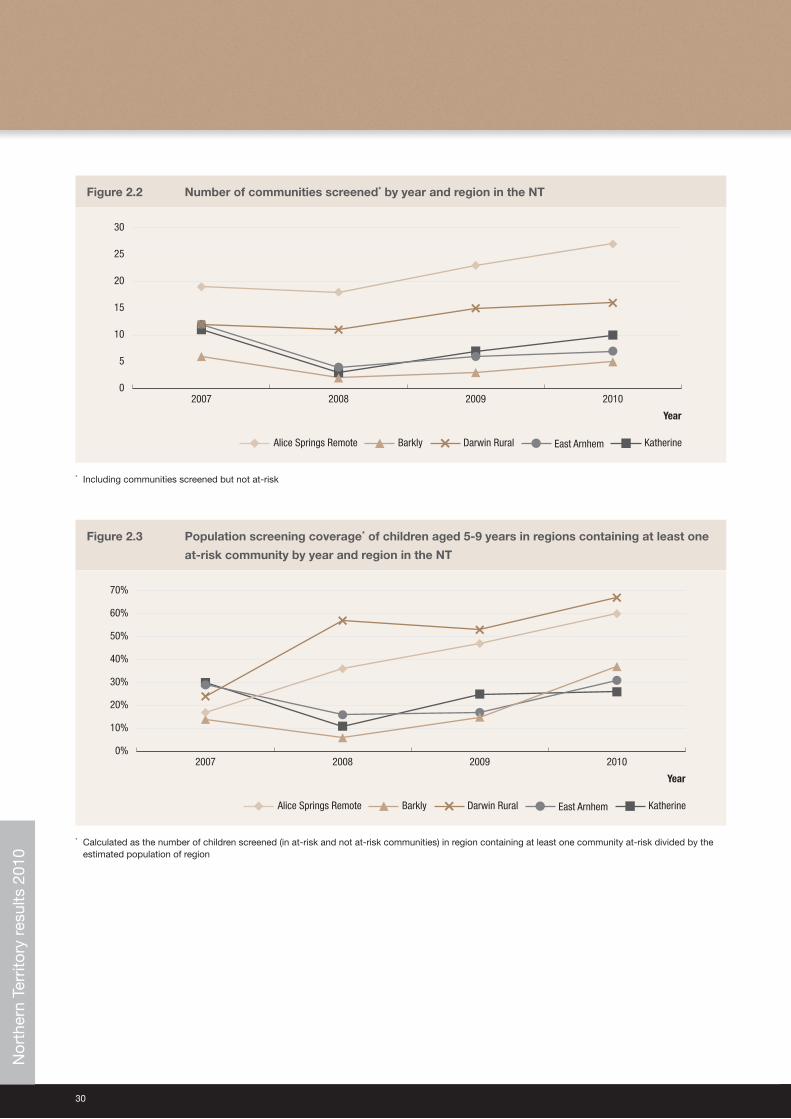
Northern Territory results 2010Key findingsScreening coverage• Overall, community screening coverage in the NT has been increasing across all regions since 2008. A greater
number of at-risk communities are being screened for trachoma over time (Figure 2.2).
• Community coverage of trachoma screening over the five endemic regions was 74%, with 64 communities screened for trachoma out of the 86 at-risk communities (Table 2.1).
• The proportion of children screened aged less than 14 years in those 64 at-risk communities was 45%; with a range of 31% to 56% occurring in regions (Table 2.1, Figure 2.3)
• Since 2008, the screening rates of children in at-risk communities have increased in all regions of the NT. (Figure 2.3).
Clean face prevalence• The overall prevalence of facial cleanliness in screened populations in the NT was 80%. The highest levels of facial
cleanliness were found in the regions in the Top End of the NT and the lowest levels (of 69%) were observed in Alice Springs Remote (Figure 2.4).
Trachoma prevalence• The overall prevalence of trachoma in children screened in the NT was 12%. This prevalence ranged from 1% in the
East Arnhem to 27% in Alice Springs Remote region (Table 2.1).
• 23% (15/64) of communities screened had no active trachoma (Table 2.1).
• 48% (31/64) of communities screened had a prevalence of trachoma of over 10% (Table 2.1).
• Despite a large increase in reported trachoma prevalence in 2008 in a number of regions, compared to previous years there is the suggestion of an overall decreasing trend in the prevalence of trachoma in most regions, except Alice Springs Remote (Figure 2.5).
Treatment coverage• 78% (50/64) of communities screened required treatment for trachoma (Table 2.1).
• 64% of the population estimated to require treatment received treatment, however, only 20% of those requiring treatment received treatment within 2 weeks of screening as recommended by CDNA guidelines (Table 2.1). Treatment coverage differed substantially between regions ranging from 41% to 98% (Figure 2.10). If treatment coverage is considered to be required to include all members of communities (method 2), then overall treatment coverage reduces to 43% (Table 2.1).
• Treatment is generally undertaken by primary health care service providers with support from the CDC.
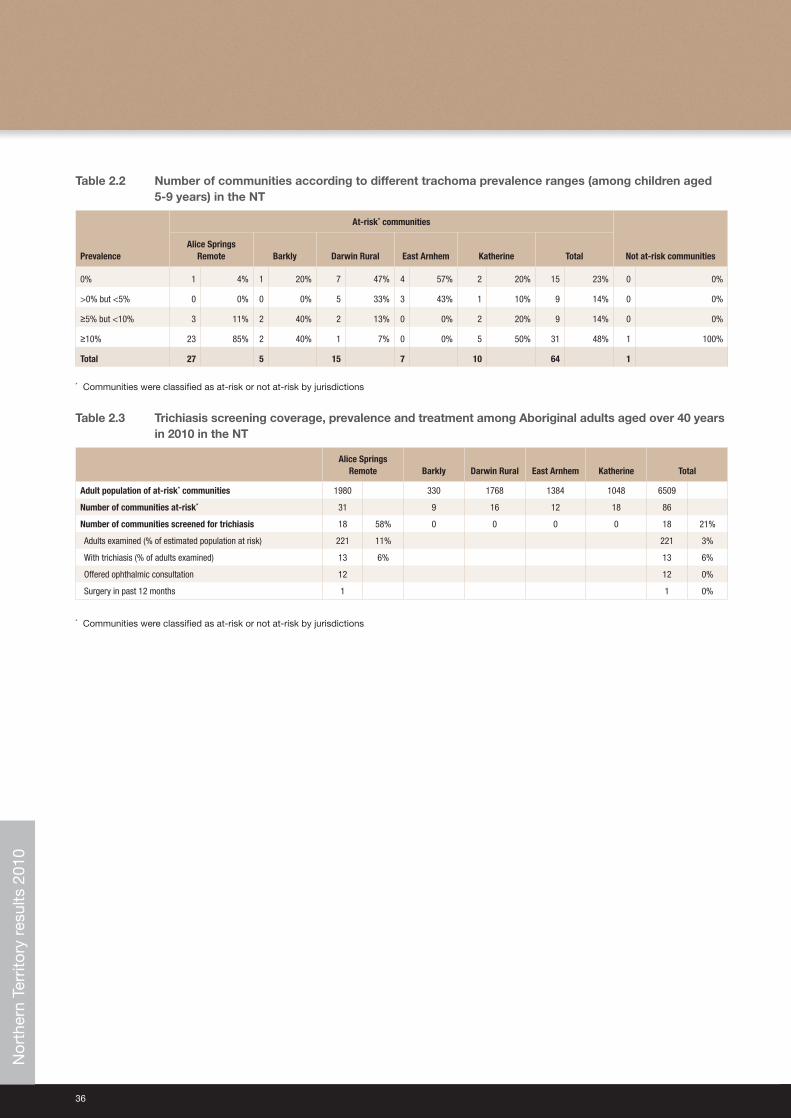
Trichiasis• Screening coverage for trichiasis was low with only Alice Springs Remote region undertaking any screening; 11%
(221/1980) of the target population in this region were screened (Table 2.2).
• 6% of adults screened were found to have trichiasis.
• No data were available regarding the extent of surgery for trichiasis (Table 2.2).
Nor
ther
n Te
rrito
ry r
esul
ts 2
010
28
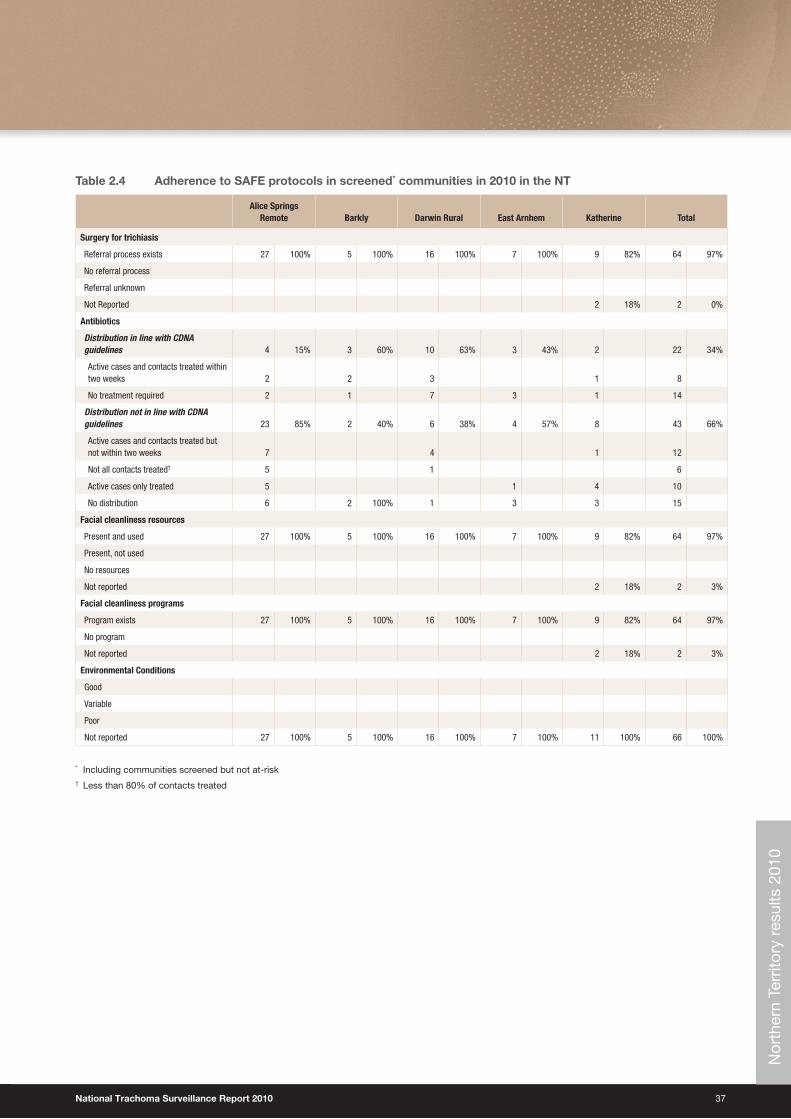
SAFE strategy compliance• 97% of all screened communities reported an operating trichiasis referral process. However, only one region
conducted screening for trichiasis and no data were available regarding surgery.
• 15% of all screened communities were treated according to CDNA guidelines.
• All communities reported the presence and use of facial cleanliness resources.
• No data were reported on environmental conditions in communities screened (Table 2.3).
Communities screened not designated as at-risk• One community designated as not-at-risk was screened in 2010, in the Darwin Rural region. This community had no
active trachoma and a 78% prevalence of facial cleanliness.
Nor
ther
n Te
rrito
ry r
esul
ts 2
010
National Trachoma Surveillance Report 2010 29
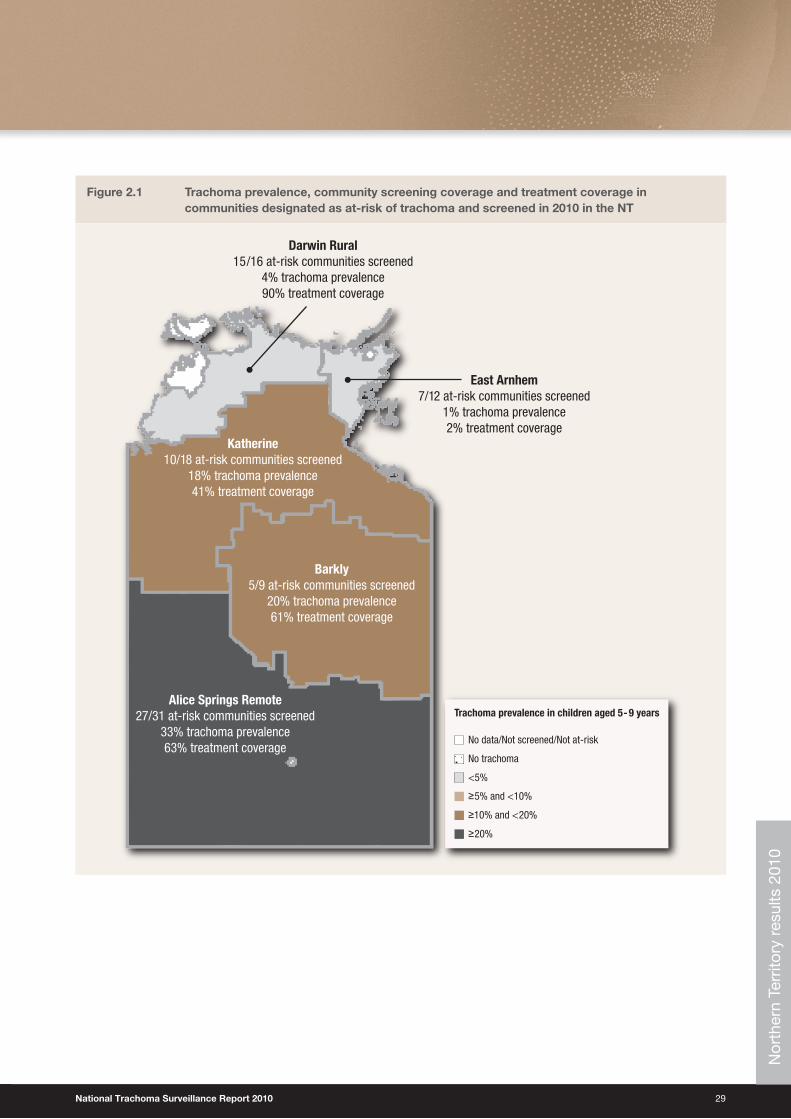
Figure 2.1 Trachoma prevalence, community screening coverage and treatment coverage in communities designated as at-risk of trachoma and screened in 2010 in the NT
No data/Not screened/Not at-risk
No trachoma
<5%
≥5% and <10%
≥10% and <20%
≥20%
Trachoma prevalence in children aged 5-9 years
Darwin Rural15/16 at-risk communities screened
4% trachoma prevalence90% treatment coverage
East Arnhem7/12 at-risk communities screened
1% trachoma prevalence2% treatment coverage
Katherine10/18 at-risk communities screened
18% trachoma prevalence41% treatment coverage
Barkly5/9 at-risk communities screened
20% trachoma prevalence61% treatment coverage
Alice Springs Remote27/31 at-risk communities screened
33% trachoma prevalence63% treatment coverage
Nor
ther
n Te
rrito
ry r
esul
ts 2
010
30
Figure 2.2 Number of communities screened* by year and region in the NT
0
5
10
15
20
25
30
2010200920082007
KatherineEast ArnhemDarwin RuralBarklyAlice Springs Remote
Year
* Including communities screened but not at-risk
Figure 2.3 Population screening coverage* of children aged 5-9 years in regions containing at least one
at-risk community by year and region in the NT
0%
10%
20%
30%
40%
50%
60%
70%
2010200920082007
KatherineEast ArnhemDarwin RuralBarklyAlice Springs Remote
Year
* Calculated as the number of children screened (in at-risk and not at-risk communities) in region containing at least one community at-risk divided by the estimated population of region
Nor
ther
n Te
rrito
ry r
esul
ts 2
010
National Trachoma Surveillance Report 2010 31
Figure 2.4 Proportion of screened* children aged 5-9 years who had a clean face† by year and region in
the NT
0%
10%
20%
30%
40%
50%
60%
70%
80%
90%
100%
2010200920082007
KatherineEast ArnhemDarwin RuralBarklyAlice Springs Remote
Year
* Including children in communities screened but not at-risk† Clean face is defined as the absence of dirt, dust or crusting on the cheeks and forehead
Figure 2.5 Trachoma prevalence of screened* children aged 5-9 years by year and region in the NT
0%
10%
20%
30%
40%
50%
60%
70%
2010200920082007
KatherineEast ArnhemDarwin RuralBarklyAlice Springs Remote
Year
* Including children in communities screened but not at-risk
Nor
ther
n Te
rrito
ry r
esul
ts 2
010
32
Figure 2.6 Screening coverage of children in at-risk communities in 2010 by age group and region in the NT
0%
10%
20%
30%
40%
50%
60%
70%
80%
90%
East ArnhemDarwin RuralBarklyKatherineAlice Springs Remote
1-4 years 5-9 years 10-14 years
Region
Figure 2.7 Trachoma prevalence of children screened in at-risk communities in 2010 by age group
and region in the NT
0%
5%
10%
15%
20%
25%
30%
35%
East ArnhemDarwin RuralBarklyKatherineAlice Springs Remote
1-4 years 5-9 years 10-14 years
Region
Nor
ther
n Te
rrito
ry r
esul
ts 2
010
National Trachoma Surveillance Report 2010 33
Figure 2.8 Proportion of screened children who had a clean face* in 2010 by age group and region in the NT
0%
10%
20%
30%
40%
50%
60%
70%
80%
90%
100%
East ArnhemDarwin RuralBarklyKatherineAlice Springs Remote
1-4 years 5-9 years 10-14 years
Region
* Clean face is defined as the absence of dirt, dust or crusting on the cheeks and forehead
Figure 2.9 Trachoma prevalence among screened at-risk communities in 2010 by region in the NT
0%
10%
20%
30%
40%
50%
60%
70%
80%
90%
100%
East Arnhem (n=7)Darwin Rural (n=15)Barkly (n=5)Katherine (n=10)Alice Springs Remote (n=27)
≥5% but <10% ≥10% >0% but <5% 0%
RegionN
orth
ern
Terr
itory
res
ults
201
0
34
Tab
le 2
.1
Trac
hom
a sc
reen
ing
co
vera
ge
and
pre
vale
nce,
cle
an f
ace
pre
vale
nce
and
tre
atm
ent
cove
rag
e N
T in
201
0 b
y re
gio
n
At-r
isk
com
mun
ities
Not a
t-ris
k co
mm
uniti
es
Alic
e Sp
rings
Rem
ote
Bark
lyDa
rwin
Rur
alEa
st A
rnhe
mKa
ther
ine
Tota
lTo
tal
Age
grou
p (y
ears
)1-
45-
910
-14
15+
All
1-4
5-9
10-1
415
+Al
l1-
45-
910
-14
15+
All
1-4
5-9
10-1
415
+Al
l1-
45-
910
-14
15+
All
1-4
5-9
10-1
415
+Al
l1-
45-
910
-14
15+
All
Estim
ated
Abo
rigin
al
popu
latio
n at
-ris
k* 72
793
996
159
2287
0215
919
517
810
3316
0788
111
2410
1956
5988
4149
070
760
242
2360
9658
674
063
534
5355
3928
4337
0533
9520
291
3078
4
Num
ber o
f com
mun
ities
at
-ris
k*
31
9
16
12
18
86
Num
ber o
f com
mun
ities
sc
reen
ed
27
5
15
7
10
64
1
Child
ren
exam
ined
for c
lean
fa
ce†
6266
043
5
1157
1714
679
24
217
291
461
7
1703
3938
330
9
731
5436
519
9
618
344
2468
1639
44
510
027
27
Child
ren
with
cle
an fa
ce†
2439
238
279
814
117
7921
012
475
057
114
4531
321
284
636
3125
616
745
422
418
3614
8335
430
021
21
Clea
n fa
ce p
reva
lenc
e39
%59
%88
%
69%
82%
80%
100%
87
%72
%82
%93
%
85%
79%
84%
92%
87
%57
%70
%84
%
73%
65%
74%
90%
80
%
78
%
78%
Child
ren
exam
ined
for
trach
oma
6266
043
511
5717
146
7924
217
291
461
717
0339
383
309
731
5536
518
860
834
524
6816
2844
410
027
27
Scre
enin
g co
vera
ge9%
70%
45%
44%
11%
75%
44%
45%
20%
81%
61%
56%
8%54
%51
%41
%9%
49%
30%
31%
12%
67%
48%
45%
Child
ren
with
act
ive
trach
oma
1521
973
307
429
740
640
1864
04
37
1767
2410
842
359
125
526
00
00
Activ
e tra
chom
a pr
eval
ence
24%
33%
17%
27
%24
%20
%9%
17
%3%
4%3%
4%
0%1%
1%
1%31
%18
%13
%
18%
12%
15%
8%
12%
0%
0%
Trac
hom
a pr
eval
ence
1-9
yea
rs
32%
20%
4%
1%
20%
14%
Trac
hom
a pr
eval
ence
1-9
yea
rs
(wei
ghte
d by
pop
ulat
ion)
‡
29
%
22
%
4%
1%
23
%
14
%
Age
grou
p (y
ears
) 0-
45-
910
-14
15+
All
0-4
5-9
10-1
415
+Al
l0-
45-
910
-14
15+
All
0-4
5-9
10-1
415
+Al
l0-
45-
910
-14
15+
All
0-4
5-9
10-1
415
+Al
l0-
45-
910
-14
15+
All
Num
ber o
f com
mun
ities
re
quiri
ng tr
eatm
ent
26
4
8
4
8
50
0
Activ
e ca
ses
requ
iring
tre
atm
ent
1522
073
308
429
740
640
1864
04
37
1767
2410
842
360
125
527
Activ
e ca
ses
rece
ived
tre
atm
ent w
ithin
2 w
eeks
860
1482
013
316
114
722
00
11
1658
2296
2514
547
217
% A
ctiv
e ca
ses
rece
ived
tre
atm
ent w
ithin
2 w
eeks
53%
27%
19%
27%
0%45
%43
%40
%17
%35
%39
%34
%
0%33
%14
%94
%87
%92
%89
%60
%40
%38
%41
%
Met
hod
1§
Estim
ated
con
tact
s re
quiri
ng
treat
men
t
2473
17
2
740
43
.83
82
8
4257
Cont
acts
rece
ived
trea
tmen
t to
tal
212
284
206
968
1670
2019
1659
114
9612
410
237
970
10
00
00
4278
5718
936
637
050
538
115
9528
51
Estim
ated
ove
rall
trea
tmen
t co
vera
ge 2
wee
ks
8%
61
%
20%
2%
49
%
20%
Estim
ated
ove
rall
trea
tmen
t co
vera
ge to
tal**
63
%
61
%
90
%
2%
49%
64%
Met
hod
2§
Estim
ated
con
tact
s re
quiri
ng
treat
men
t
3555
439
74
043
.8
1771
6549
Cont
acts
rece
ived
trea
tmen
t to
tal
212
284
206
968
1670
2019
1659
114
9612
410
237
970
10
00
00
4278
5718
936
637
050
538
115
9528
51Es
timat
ed o
vera
ll tr
eatm
ent
cove
rage
2 w
eeks
6%
27%
20
%2%
25
%
14
%
Estim
ated
ove
rall
trea
tmen
t co
vera
ge to
tal**
45%
27%
90%
2%
25
%
43
%
Nor
ther
n Te
rrito
ry r
esul
ts 2
010
National Trachoma Surveillance Report 2010 35
* C
omm
uniti
es w
ere
clas
sifie
d a
s at
-ris
k or
not
at-
risk
by
juris
dic
tions
† C
lean
face
is d
efin
ed a
s th
e ab
senc
e of
dirt
, dus
t or
cru
stin
g on
the
che
eks
and
fore
head
2
‡ C
alcu
late
d a
s th
e p
rop
ortio
ns o
f chi
ldre
n w
ith a
ctiv
e tr
acho
ma
in a
ge g
roup
s 1-
4 an
d 5
-9 y
ears
, wei
ghte
d b
y th
e es
timat
ed p
opul
atio
n si
zes
of e
ach
age
grou
p. T
his
was
don
e in
ord
er t
o ac
coun
t fo
r un
even
cov
erag
e w
ith r
esp
ect
to a
ge g
roup
s§
Est
imat
ed u
sing
ave
rage
num
ber
of h
ouse
hold
con
tact
s p
er c
hild
in c
omm
uniti
es w
ho r
epor
ted
num
ber
of c
onta
cts
req
uirin
g tr
eatm
ent
and
pop
ulat
ion
stat
istic
s (s
ee M
etho
dol
ogy
for
det
ail)
** A
ctiv
e ca
ses
trea
ted
, but
not
with
in t
wo
wee
ks, w
ere
not
rep
orte
d. N
umb
er o
f act
ive
case
s tr
eate
d in
tot
al is
tak
en t
o b
e th
e sa
me
as n
umb
er o
f act
ive
case
s tr
eate
d in
tw
o w
eeks
Nor
ther
n Te
rrito
ry r
esul
ts 2
010
36
Table 2.2 Number of communities according to different trachoma prevalence ranges (among children aged 5-9 years) in the NT
Prevalence
At-risk* communities
Not at-risk communitiesAlice Springs
Remote Barkly Darwin Rural East Arnhem Katherine Total
0% 1 4% 1 20% 7 47% 4 57% 2 20% 15 23% 0 0%
>0% but <5% 0 0% 0 0% 5 33% 3 43% 1 10% 9 14% 0 0%
≥5% but <10% 3 11% 2 40% 2 13% 0 0% 2 20% 9 14% 0 0%
≥10% 23 85% 2 40% 1 7% 0 0% 5 50% 31 48% 1 100%
Total 27 5 15 7 10 64 1
* Communities were classified as at-risk or not at-risk by jurisdictions
Table 2.3 Trichiasis screening coverage, prevalence and treatment among Aboriginal adults aged over 40 years in 2010 in the NT
Alice Springs Remote Barkly Darwin Rural East Arnhem Katherine Total
Adult population of at-risk* communities 1980 330 1768 1384 1048 6509
Number of communities at-risk* 31 9 16 12 18 86
Number of communities screened for trichiasis 18 58% 0 0 0 0 18 21%
Adults examined (% of estimated population at risk) 221 11% 221 3%
With trichiasis (% of adults examined) 13 6% 13 6%
Offered ophthalmic consultation 12 12 0%
Surgery in past 12 months 1 1 0%
* Communities were classified as at-risk or not at-risk by jurisdictions
Nor
ther
n Te
rrito
ry r
esul
ts 2
010
National Trachoma Surveillance Report 2010 37
Table 2.4 Adherence to SAFE protocols in screened* communities in 2010 in the NT
Alice Springs Remote Barkly Darwin Rural East Arnhem Katherine Total
Surgery for trichiasis
Referral process exists 27 100% 5 100% 16 100% 7 100% 9 82% 64 97%
No referral process
Referral unknown
Not Reported 2 18% 2 0%
Antibiotics
Distribution in line with CDNA guidelines 4 15% 3 60% 10 63% 3 43% 2 22 34%
Active cases and contacts treated within two weeks 2 2 3 1 8
No treatment required 2 1 7 3 1 14
Distribution not in line with CDNA guidelines 23 85% 2 40% 6 38% 4 57% 8 43 66%
Active cases and contacts treated but not within two weeks 7 4 1 12
Not all contacts treated† 5 1 6
Active cases only treated 5 1 4 10
No distribution 6 2 100% 1 3 3 15
Facial cleanliness resources
Present and used 27 100% 5 100% 16 100% 7 100% 9 82% 64 97%
Present, not used
No resources
Not reported 2 18% 2 3%
Facial cleanliness programs
Program exists 27 100% 5 100% 16 100% 7 100% 9 82% 64 97%
No program
Not reported 2 18% 2 3%
Environmental Conditions
Good
Variable
Poor
Not reported 27 100% 5 100% 16 100% 7 100% 11 100% 66 100%
* Including communities screened but not at-risk† Less than 80% of contacts treated
Nor
ther
n Te
rrito
ry r
esul
ts 2
010
38
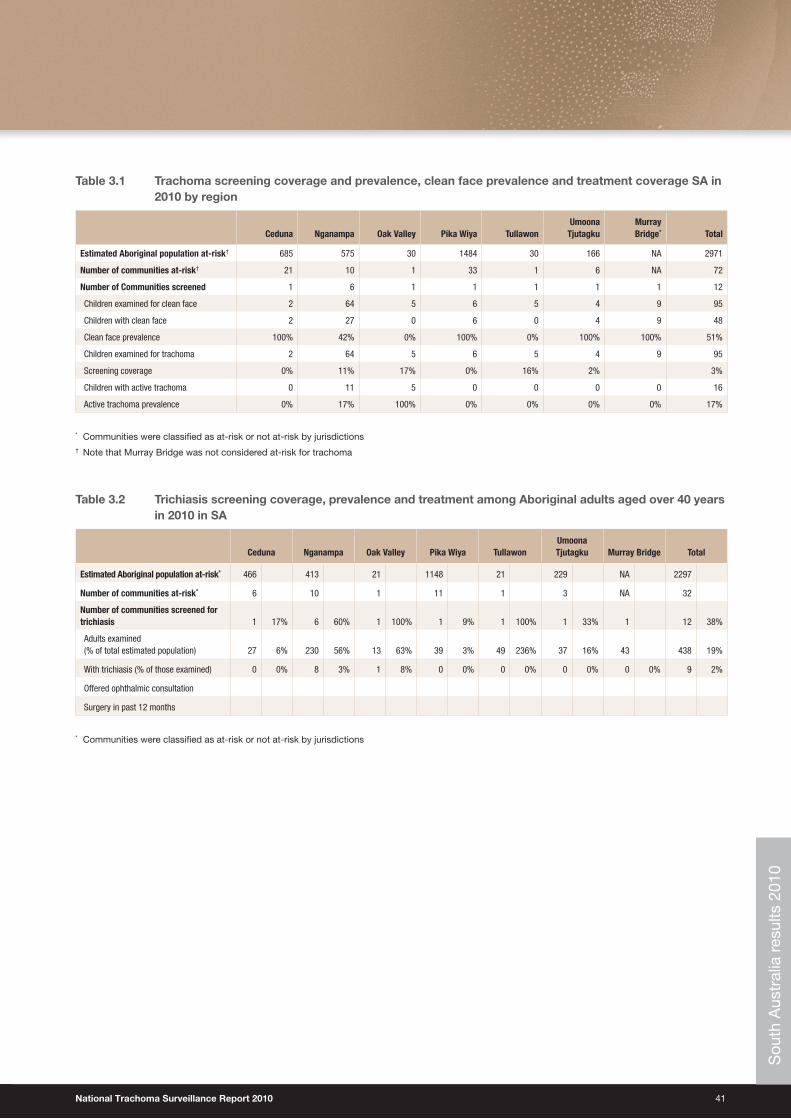
South Australia results 2010Key findings Screening coverage• The overall, community coverage among at-risk communities in SA over the six endemic regions was 17%, with 12
communities screened for trachoma out of the 72 designated at- risk communities (Table 3.1).
• The proportion of children screened in those 32 at-risk communities was 3% (86/2971); Oak Valley had the highest coverage with 17% (Table 3.1).
• The overall trend for screening coverage has decreased in 2010 with 95 children screened, compared to 2009 where 149 children were screened for trachoma.
Clean face prevalence• The overall prevalence of facial cleanliness among screened populations in SA was 51%, ranging from 0% to 100%
(Table 3.1).
• The trends over time are difficult to interpret given the small numbers in the data.
Trachoma prevalence• The overall prevalence of trachoma in children screened in SA was 17% (Table 3.1).
• 67% (8/12) of communities screened had no active trachoma.
• 33% (4/12) of communities screened had a prevalence of trachoma of over 10%.
• Small numbers of children screened suggest that estimates of trachoma prevalence in SA regions may not be representative of the true extent of the prevalence of trachoma.
• The trends over time are difficult to interpret given the small numbers in the data.
Treatment coverage• Data were not available.
Trichiasis• 438 adults in 12 communities were screened for trichiasis.
• Among adults screened the prevalence of trichiasis was 2% (9/438) (Table 3.2).
SAFE strategy compliance• Data were not available.
Communities screened not designated as at-risk• One not-at-risk community was screened in SA in the Murray Bridge region which has not been previously screened
for trachoma
• No cases of trachoma were found in the children screened (Table 3.1).
Sou
th A
ustr
alia
res
ults
201
0
National Trachoma Surveillance Report 2010 39
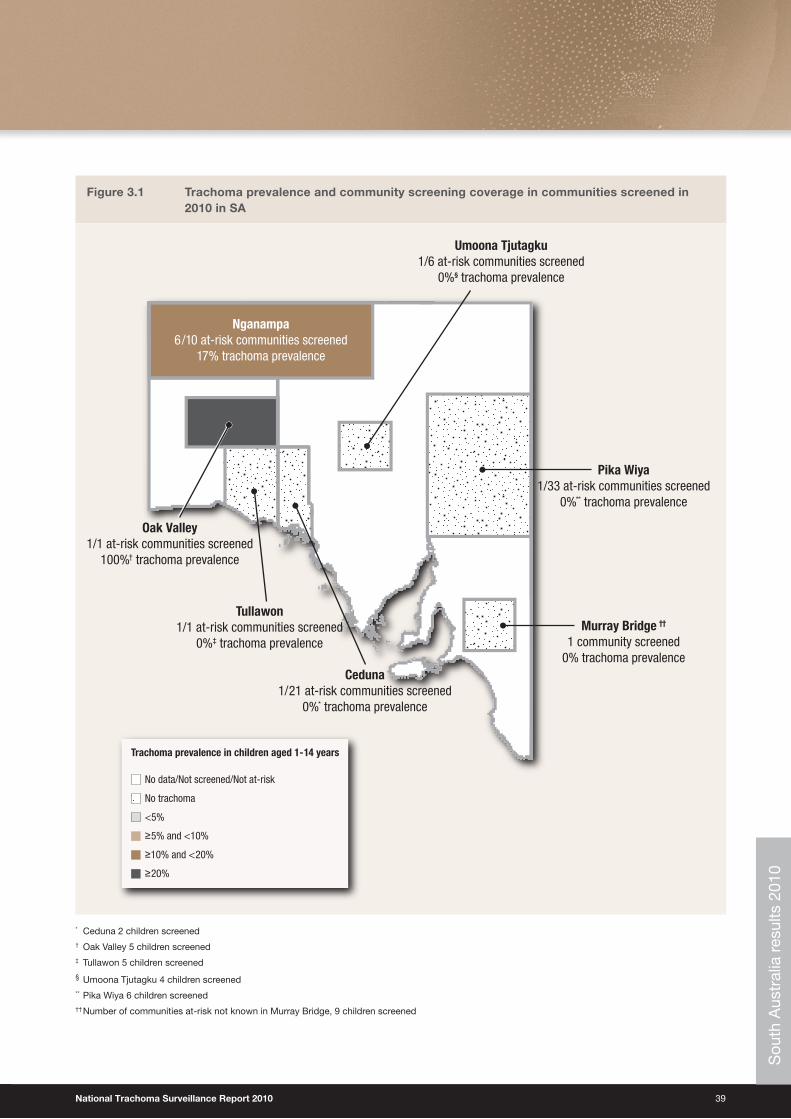
Figure 3.1 Trachoma prevalence and community screening coverage in communities screened in 2010 in SA
No data/Not screened/Not at-risk
No trachoma
<5%
≥5% and <10%
≥10% and <20%
≥20%
Trachoma prevalence in children aged 1-14 years
Murray Bridge ††
1 community screened0% trachoma prevalence
Pika Wiya1/33 at-risk communities screened
0%** trachoma prevalence
Umoona Tjutagku1/6 at-risk communities screened
0%§ trachoma prevalence
Nganampa6/10 at-risk communities screened
17% trachoma prevalence
Oak Valley1/1 at-risk communities screened
100%† trachoma prevalence
Tullawon1/1 at-risk communities screened
0%‡ trachoma prevalence
Ceduna1/21 at-risk communities screened
0%* trachoma prevalence
* Ceduna 2 children screened† Oak Valley 5 children screened‡ Tullawon 5 children screened
§ Umoona Tjutagku 4 children screened** Pika Wiya 6 children screened†† Number of communities at-risk not known in Murray Bridge, 9 children screened
Sou
th A
ustr
alia
res
ults
201
0
40
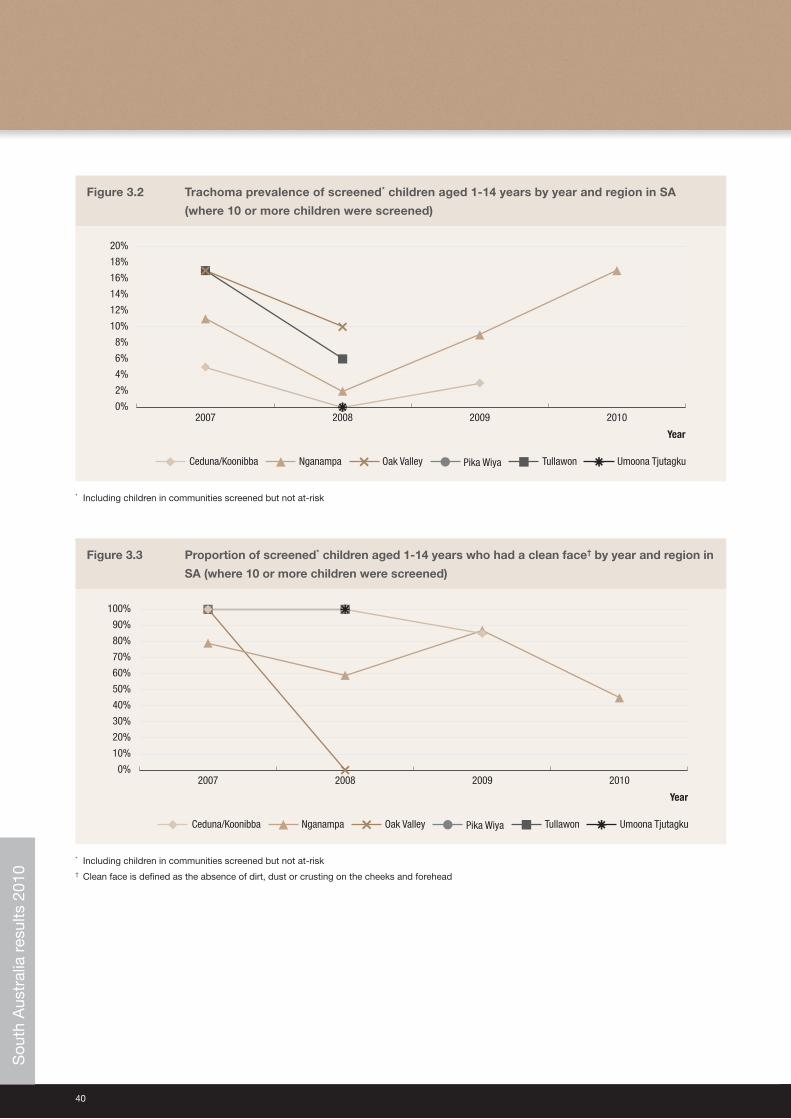
Figure 3.2 Trachoma prevalence of screened* children aged 1-14 years by year and region in SA
(where 10 or more children were screened)
0%
2%
4%
6%
8%
10%
12%
14%
16%
18%
20%
2010200920082007
TullawonPika WiyaNganampaCeduna/Koonibba Oak Valley Umoona Tjutagku
Year
* Including children in communities screened but not at-risk
Figure 3.3 Proportion of screened* children aged 1-14 years who had a clean face† by year and region in
SA (where 10 or more children were screened)
0%
10%
20%
30%
40%
50%
60%
70%
80%
90%
100%
2010200920082007
Tullawon Umoona TjutagkuPika WiyaNganampaCeduna/Koonibba Oak Valley
Year
* Including children in communities screened but not at-risk† Clean face is defined as the absence of dirt, dust or crusting on the cheeks and forehead
Sou
th A
ustr
alia
res
ults
201
0
National Trachoma Surveillance Report 2010 41
Table 3.1 Trachoma screening coverage and prevalence, clean face prevalence and treatment coverage SA in 2010 by region
Ceduna Nganampa Oak Valley Pika Wiya Tullawon
Umoona Tjutagku
Murray Bridge* Total
Estimated Aboriginal population at-risk† 685 575 30 1484 30 166 NA 2971
Number of communities at-risk† 21 10 1 33 1 6 NA 72
Number of Communities screened 1 6 1 1 1 1 1 12
Children examined for clean face 2 64 5 6 5 4 9 95
Children with clean face 2 27 0 6 0 4 9 48
Clean face prevalence 100% 42% 0% 100% 0% 100% 100% 51%
Children examined for trachoma 2 64 5 6 5 4 9 95
Screening coverage 0% 11% 17% 0% 16% 2% 3%
Children with active trachoma 0 11 5 0 0 0 0 16
Active trachoma prevalence 0% 17% 100% 0% 0% 0% 0% 17%
* Communities were classified as at-risk or not at-risk by jurisdictions† Note that Murray Bridge was not considered at-risk for trachoma
Table 3.2 Trichiasis screening coverage, prevalence and treatment among Aboriginal adults aged over 40 years in 2010 in SA
Ceduna Nganampa Oak Valley Pika Wiya TullawonUmoona Tjutagku Murray Bridge Total
Estimated Aboriginal population at-risk* 466 413 21 1148 21 229 NA 2297
Number of communities at-risk* 6 10 1 11 1 3 NA 32
Number of communities screened for trichiasis 1 17% 6 60% 1 100% 1 9% 1 100% 1 33% 1 12 38%
Adults examined (% of total estimated population) 27 6% 230 56% 13 63% 39 3% 49 236% 37 16% 43 438 19%
With trichiasis (% of those examined) 0 0% 8 3% 1 8% 0 0% 0 0% 0 0% 0 0% 9 2%
Offered ophthalmic consultation
Surgery in past 12 months
* Communities were classified as at-risk or not at-risk by jurisdictions
Sou
th A
ustr
alia
res
ults
201
0
42
Western Australia results 2010Key findings Screening coverage• The overall community screening coverage in WA over the four regions with endemic trachoma was 90%, with 75
communities screened for trachoma out of the 83 at-risk communities (Table 4.1).
• Compared to previous years the community screening coverage remains stable with some increases in screening coverage from 2009 to 2010 in the Midwest and Kimberley region (Figure 4.2).
• The proportion of children screened in the 75 at-risk communities was 37%; this ranged from 72% in the Midwest region to 30% in the Kimberley region (Table 4.1, Figure 4.3).
Clean face prevalence• The overall prevalence of facial cleanliness among screened populations in WA was 81%. There was little variation
between regions with the highest levels found in the Midwest region (92%) and the lowest level (73%) observed was in the Goldfields region (Table 4.1, Figure 4.4).
Trachoma prevalence• The prevalence of trachoma in children screened in WA was 9%. The Goldfield and Kimberley region reported
active trachoma among 10% of screened children, 8% in the Pilbara region and the Midwest Region reported active trachoma among 7% of screened children (Table 4.1).
• 43% (32/75) of communities screened had no active trachoma (Table 4.2).
• 33% (31/75) of communities screened had a prevalence of trachoma of more than 10% (Table 4.2).
Treatment coverage• 58% (48/83) of at-risk communities and 66% (48/73) of communities screened required treatment for trachoma (Table 4.1).
• 90% of the at-risk population estimated to require treatment received treatment and the vast majority were treated within 2 weeks of screening in accord with CDNA Guidelines. If treatment coverage is considered to be required of all members of communities (method 2), then overall treatment coverage reduces to 41% (Table 4.1, Figure 4.10).
Trichiasis• Overall, 10% of the target population were screened for trichiasis; the level of screening ranged from 6% in the
Goldfields Region to 16% in the Kimberley Region (Table 4.3).
• No cases of trichiasis were reported in adults screened.
• One case of trichiasis was reported to have received surgery (Table 4.3).
Wes
tern
Aus
tral
ia r
esul
ts 2
010
National Trachoma Surveillance Report 2010 43
SAFE strategy compliance• 45% of all communities screened for trichiasis reported an operating trichiasis referral process.
• 90% of all screened communities were treated according to CDNA guidelines.
• 63% of communities screened reported the presence and use of facial cleanliness resources.
• 75% of communities screened reported having facial cleanliness programs functioning within the community.
• 29% of screened communities reported good environmental conditions, 20% reported variable environmental conditions, 21% reported poor environmental conditions, and 31% did not report on environmental conditions (Table 4.4).
Communities screened not designated as at-risk• Three not-at-risk communities were screened in WA, all three communities were in the Kimberley region.
• Collectively, these communities reported a 4% prevalence of active trachoma and a 97% prevalence of facial cleanliness.
• 100% of contacts were treated within 2 weeks of screening within these not-at-risk communities (Table 4.1).
Wes
tern
Aus
tral
ia r
esul
ts 2
010
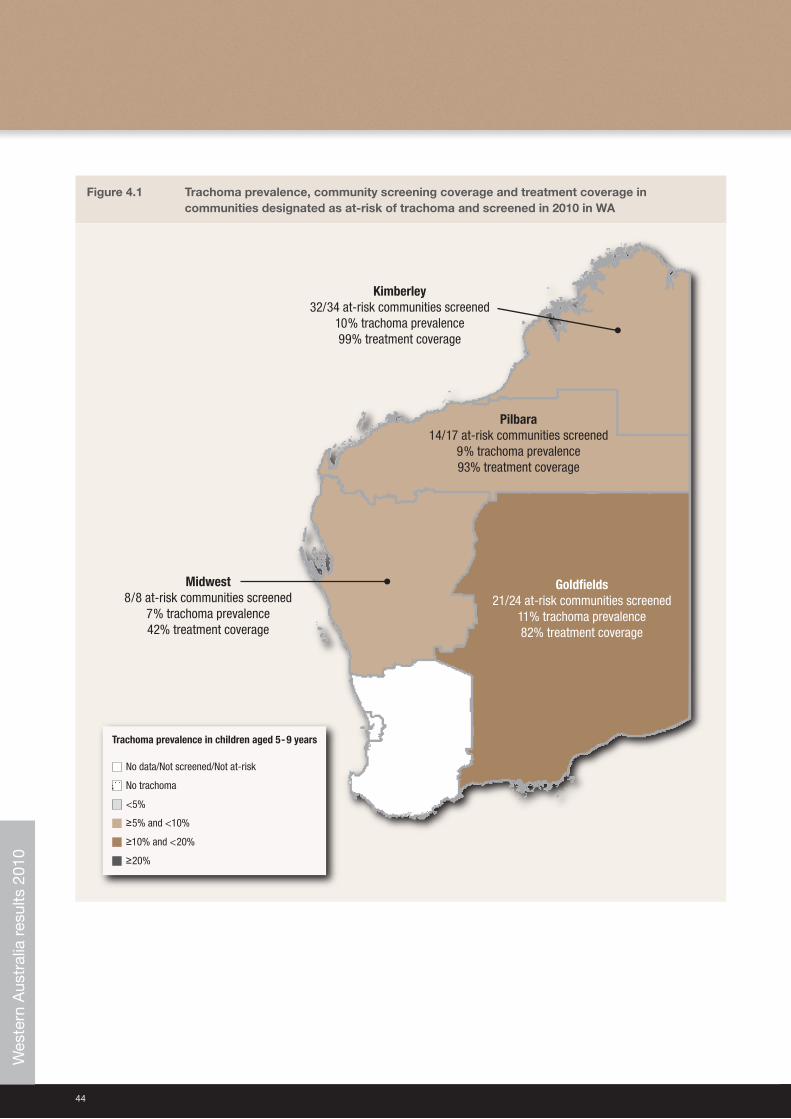
44
Figure 4.1 Trachoma prevalence, community screening coverage and treatment coverage in communities designated as at-risk of trachoma and screened in 2010 in WA
No data/Not screened/Not at-risk
No trachoma
<5%
≥5% and <10%
≥10% and <20%
≥20%
Trachoma prevalence in children aged 5-9 years
Midwest8/8 at-risk communities screened
7% trachoma prevalence42% treatment coverage
Kimberley32/34 at-risk communities screened
10% trachoma prevalence99% treatment coverage
Pilbara14/17 at-risk communities screened
9% trachoma prevalence93% treatment coverage
Goldfields21/24 at-risk communities screened
11% trachoma prevalence82% treatment coverage
Wes
tern
Aus
tral
ia r
esul
ts 2
010
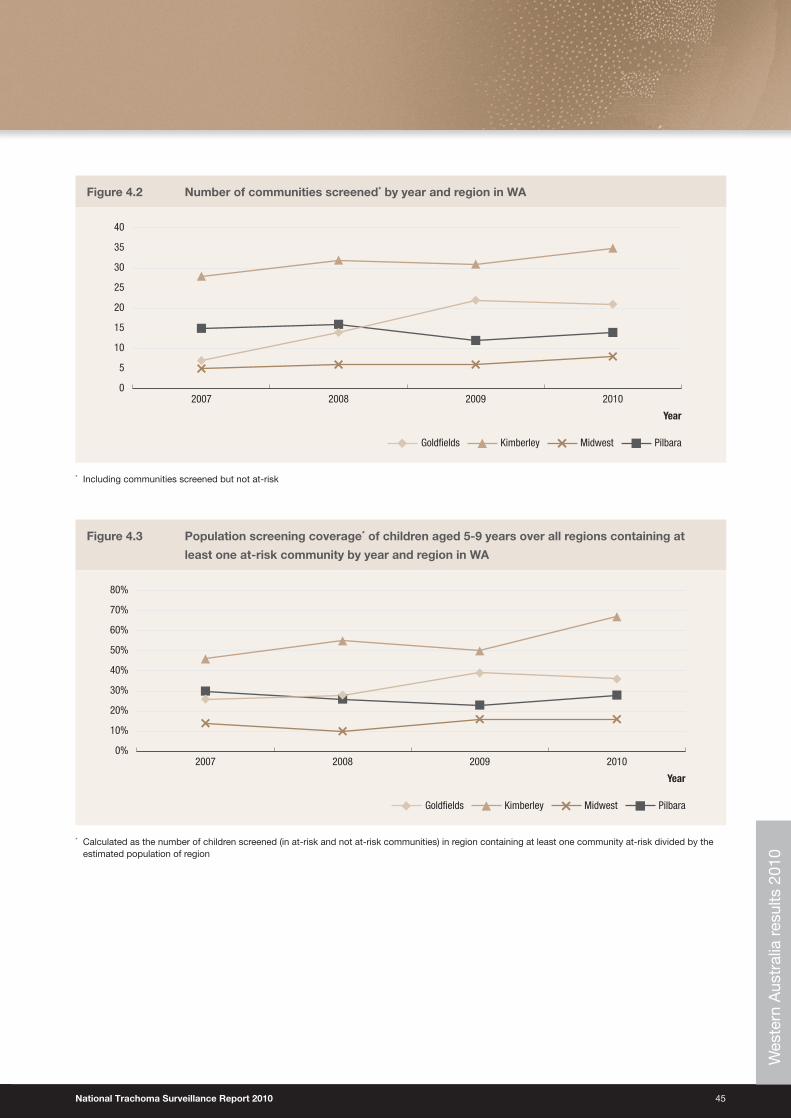
National Trachoma Surveillance Report 2010 45
Figure 4.2 Number of communities screened* by year and region in WA
0
5
10
15
20
25
30
35
40
2010200920082007
PilbaraKimberleyGoldfields Midwest
Year
* Including communities screened but not at-risk
Figure 4.3 Population screening coverage* of children aged 5-9 years over all regions containing at
least one at-risk community by year and region in WA
0%
10%
20%
30%
40%
50%
60%
70%
80%
2010200920082007
PilbaraKimberleyGoldfields Midwest
Year
* Calculated as the number of children screened (in at-risk and not at-risk communities) in region containing at least one community at-risk divided by the estimated population of region
Wes
tern
Aus
tral
ia r
esul
ts 2
010
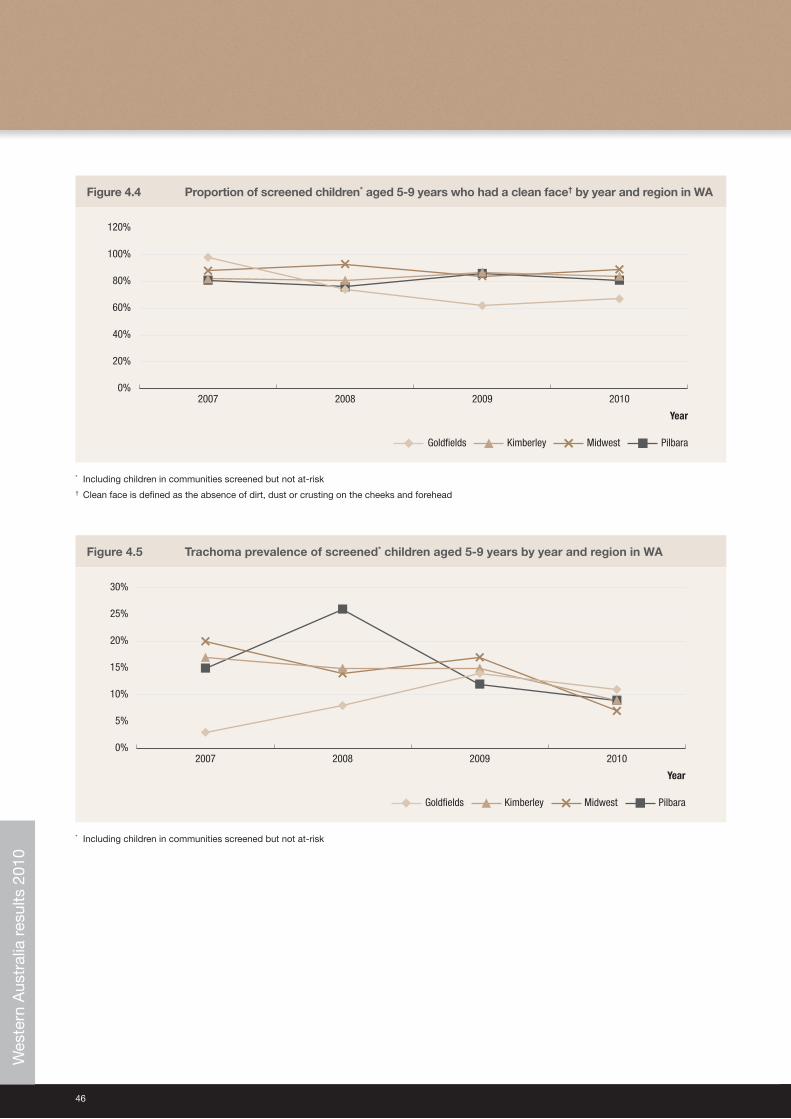
46
Figure 4.4 Proportion of screened children* aged 5-9 years who had a clean face† by year and region in WA
0%
20%
40%
60%
80%
100%
120%
2010200920082007
PilbaraKimberleyGoldfields Midwest
Year
* Including children in communities screened but not at-risk† Clean face is defined as the absence of dirt, dust or crusting on the cheeks and forehead
Figure 4.5 Trachoma prevalence of screened* children aged 5-9 years by year and region in WA
0%
5%
10%
15%
20%
25%
30%
2010200920082007
PilbaraKimberleyGoldfields Midwest
Year
* Including children in communities screened but not at-risk
Wes
tern
Aus
tral
ia r
esul
ts 2
010
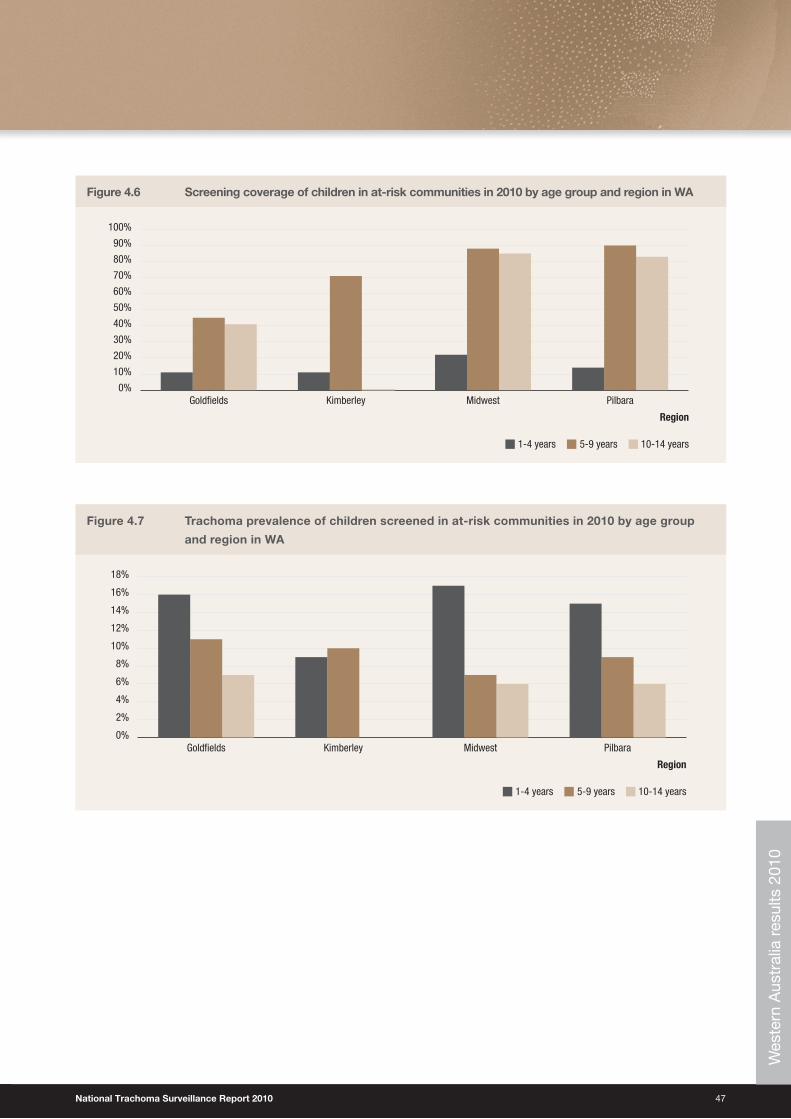
National Trachoma Surveillance Report 2010 47
Figure 4.6 Screening coverage of children in at-risk communities in 2010 by age group and region in WA
0%
10%
20%
30%
40%
50%
60%
70%
80%
90%
100%
PilbaraMidwestKimberleyGoldfields
1-4 years 5-9 years 10-14 years
Region
Figure 4.7 Trachoma prevalence of children screened in at-risk communities in 2010 by age group
and region in WA
0%
2%
4%
6%
8%
10%
12%
14%
16%
18%
PilbaraMidwestKimberleyGoldfields
1-4 years 5-9 years 10-14 years
RegionW
este
rn A
ustr
alia
res
ults
201
0
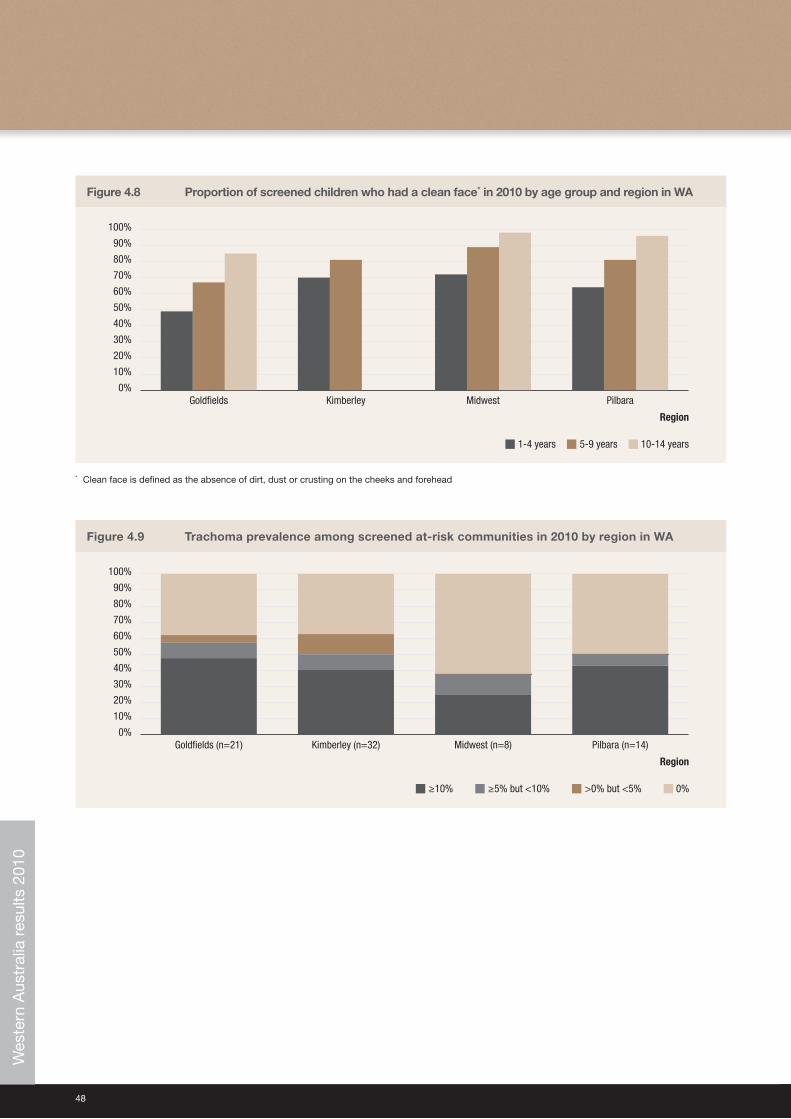
48
Figure 4.8 Proportion of screened children who had a clean face* in 2010 by age group and region in WA
0%
10%
20%
30%
40%
50%
60%
70%
80%
90%
100%
PilbaraMidwestKimberleyGoldfields
1-4 years 5-9 years 10-14 years
Region
* Clean face is defined as the absence of dirt, dust or crusting on the cheeks and forehead
Figure 4.9 Trachoma prevalence among screened at-risk communities in 2010 by region in WA
0%
10%
20%
30%
40%
50%
60%
70%
80%
90%
100%
Pilbara (n=14)Midwest (n=8)Kimberley (n=32)Goldfields (n=21)
≥5% but <10% ≥10% >0% but <5% 0%
Region
Wes
tern
Aus
tral
ia r
esul
ts 2
010
National Trachoma Surveillance Report 2010 49
Page left intentionally blank
Wes
tern
Aus
tral
ia r
esul
ts 2
010
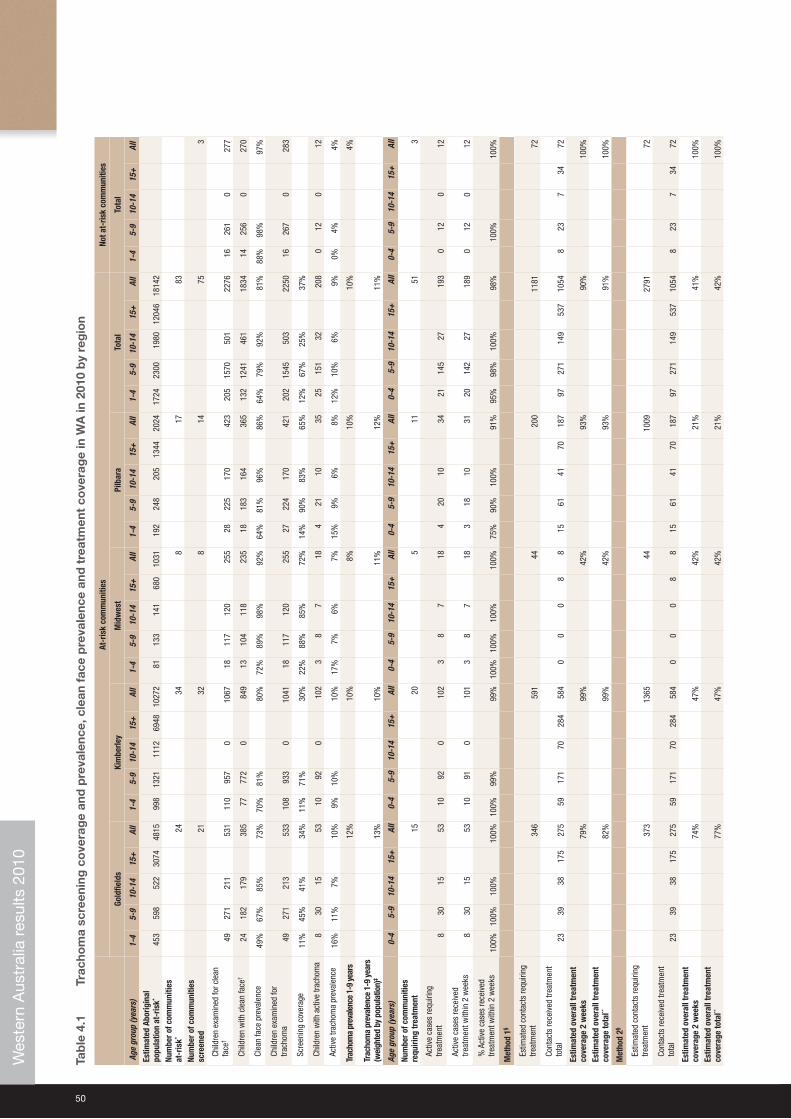
50
Tab
le 4
.1
Trac
hom
a sc
reen
ing
co
vera
ge
and
pre
vale
nce,
cle
an f
ace
pre
vale
nce
and
tre
atm
ent
cove
rag
e in
WA
in 2
010
by
reg
ion
At-r
isk
com
mun
ities
Not a
t-ris
k co
mm
uniti
es
Gold
field
sKi
mbe
rley
Mid
wes
tPi
lbar
aTo
tal
Tota
l
Age
grou
p (y
ears
)1-
45-
910
-14
15+
All
1-4
5-9
10-1
415
+Al
l1-
45-
910
-14
15+
All
1-4
5-9
10-1
415
+Al
l1-
45-
910
-14
15+
All
1-4
5-9
10-1
415
+Al
l
Estim
ated
Abo
rigin
al
popu
latio
n at
-ris
k* 45
359
852
230
7448
1599
813
2111
1269
4810
272
8113
314
168
010
3119
224
820
513
4420
2417
2423
0019
8012
046
1814
2
Num
ber o
f com
mun
ities
at
-ris
k*24
348
1783
Num
ber o
f com
mun
ities
sc
reen
ed
2132
814
753
Child
ren
exam
ined
for c
lean
fa
ce†
4927
121
153
111
095
70
1067
1811
712
025
528
225
170
42
320
515
7050
1
2276
1626
10
27
7
Child
ren
with
cle
an fa
ce†
2418
217
938
577
772
084
913
104
118
235
1818
316
436
513
212
4146
118
3414
256
027
0
Clea
n fa
ce p
reva
lenc
e49
%67
%85
%73
%70
%81
%80
%72
%89
%98
%92
%64
%81
%96
%
86%
64%
79%
92%
81
%88
%98
%
97
%
Child
ren
exam
ined
for
trach
oma
4927
121
353
310
893
30
1041
1811
712
025
527
224
170
42
120
215
4550
322
5016
267
0
283
Scre
enin
g co
vera
ge11
%45
%41
%34
%11
%71
%30
%22
%88
%85
%72
%14
%90
%83
%65
%12
%67
%25
%37
%
Child
ren
with
act
ive
trach
oma
830
1553
1092
010
23
87
184
2110
3525
151
3220
80
120
12
Activ
e tra
chom
a pr
eval
ence
16%
11%
7%10
%9%
10%
10%
17%
7%6%
7%15
%9%
6%8%
12%
10%
6%9%
0%4%
4%
Trac
hom
a pr
eval
ence
1-9
yea
rs
12%
10%
8%
10
%
10
%
4%
Trac
hom
a pr
eval
ence
1-9
yea
rs
(wei
ghte
d by
pop
ulat
ion)
‡ 13
%10
%11
%
12
%
11
%
Age
grou
p (y
ears
) 0-
45-
910
-14
15+
All
0-4
5-9
10-1
415
+Al
l0-
45-
910
-14
15+
All
0-4
5-9
10-1
415
+Al
l0-
45-
910
-14
15+
All
0-4
5-9
10-1
415
+Al
l
Num
ber o
f com
mun
ities
re
quiri
ng tr
eatm
ent
15
20
5
11
51
3
Activ
e ca
ses
requ
iring
tre
atm
ent
830
1553
1092
010
23
87
184
2010
3421
145
2719
30
120
12
Activ
e ca
ses
rece
ived
tre
atm
ent w
ithin
2 w
eeks
830
1553
1091
010
13
87
183
1810
3120
142
2718
90
120
12
% A
ctiv
e ca
ses
rece
ived
tre
atm
ent w
ithin
2 w
eeks
100%
100%
100%
100%
100%
99%
99%
100%
100%
100%
100%
75%
90%
100%
91%
95%
98%
100%
98%
10
0%10
0%
Met
hod
1§
Estim
ated
con
tact
s re
quiri
ng
treat
men
t34
659
144
20
0
1181
72
Cont
acts
rece
ived
trea
tmen
t to
tal
2339
3817
527
559
171
7028
458
40
00
88
1561
4170
187
9727
114
953
710
548
237
3472
Estim
ated
ove
rall
trea
tmen
t co
vera
ge 2
wee
ks
79%
99%
42%
93
%
90%
10
0%
Estim
ated
ove
rall
trea
tmen
t co
vera
ge to
tal**
82
%99
%42
%
93
%
91
%
10
0%
Met
hod
2§
Estim
ated
con
tact
s re
quiri
ng
treat
men
t37
313
65
44
1009
27
91
72
Cont
acts
rece
ived
trea
tmen
t to
tal
2339
3817
527
559
171
7028
458
40
00
88
1561
4170
187
9727
114
953
710
548
237
3472
Estim
ated
ove
rall
trea
tmen
t co
vera
ge 2
wee
ks74
%47
%42
%21
%41
%
100%
Estim
ated
ove
rall
trea
tmen
t co
vera
ge to
tal**
77%
47%
42%
21%
42%
100%
Wes
tern
Aus
tral
ia r
esul
ts 2
010

National Trachoma Surveillance Report 2010 51
* C
omm
uniti
es w
ere
clas
sifie
d a
s at
-ris
k or
not
at-
risk
by
juris
dic
tions
† C
lean
face
is d
efin
ed a
s th
e ab
senc
e of
dirt
, dus
t or
cru
stin
g on
the
che
eks
and
fore
head
2
‡ C
alcu
late
d a
s th
e p
rop
ortio
ns o
f chi
ldre
n w
ith a
ctiv
e tr
acho
ma
in a
ge g
roup
s 1-
4 an
d 5
-9 y
ears
, wei
ghte
d b
y th
e es
timat
ed p
opul
atio
n si
zes
of e
ach
age
grou
p. T
his
was
don
e in
ord
er t
o ac
coun
t fo
r un
even
cov
erag
e w
ith r
esp
ect
to a
ge g
roup
s.§
Est
imat
ed u
sing
ave
rage
num
ber
of h
ouse
hold
con
tact
s p
er c
hild
in c
omm
uniti
es w
ho r
epor
ted
num
ber
of c
onta
cts
req
uirin
g tr
eatm
ent
and
pop
ulat
ion
stat
istic
s (s
ee M
etho
dol
ogy
for
det
ail)
** A
ctiv
e ca
ses
trea
ted
, but
not
with
in t
wo
wee
ks, w
ere
not
rep
orte
d. N
umb
er o
f act
ive
case
s tr
eate
d in
tot
al is
tak
en t
o b
e th
e sa
me
as n
umb
er o
f act
ive
case
s tr
eate
d in
tw
o w
eeks
Wes
tern
Aus
tral
ia r
esul
ts 2
010
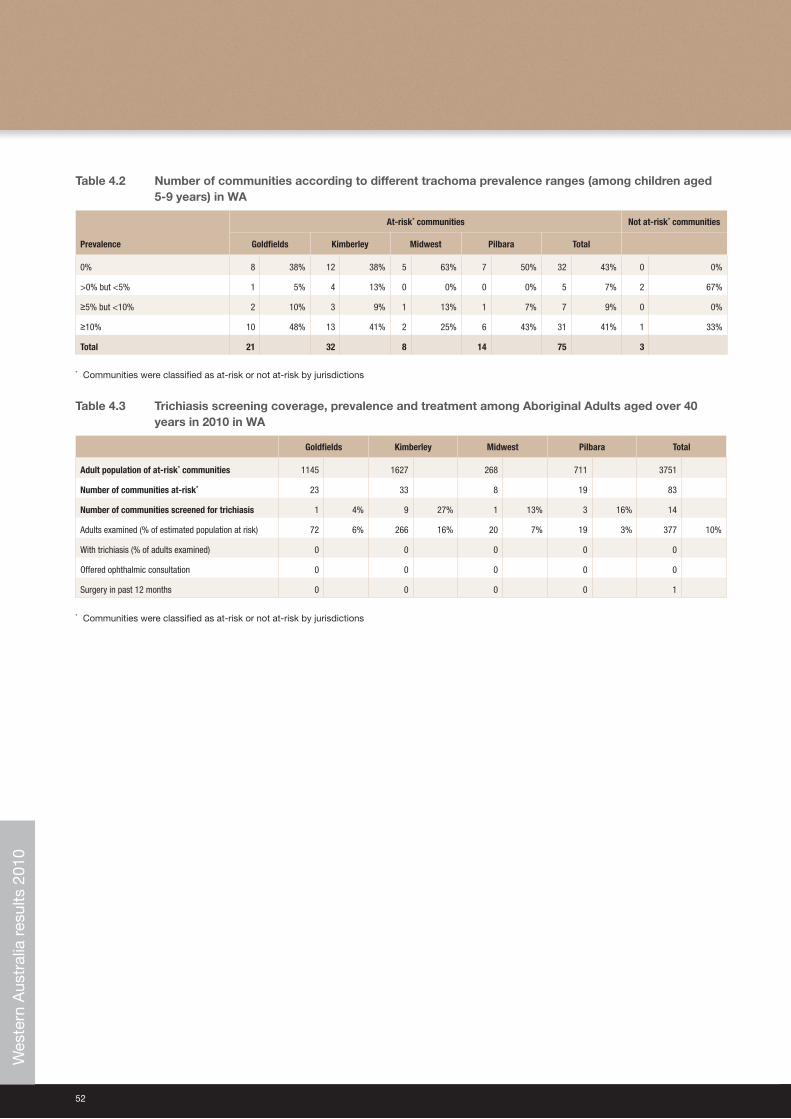
52
Table 4.2 Number of communities according to different trachoma prevalence ranges (among children aged 5-9 years) in WA
Prevalence
At-risk* communities Not at-risk* communities
Goldfields Kimberley Midwest Pilbara Total
0% 8 38% 12 38% 5 63% 7 50% 32 43% 0 0%
>0% but <5% 1 5% 4 13% 0 0% 0 0% 5 7% 2 67%
≥5% but <10% 2 10% 3 9% 1 13% 1 7% 7 9% 0 0%
≥10% 10 48% 13 41% 2 25% 6 43% 31 41% 1 33%
Total 21 32 8 14 75 3
* Communities were classified as at-risk or not at-risk by jurisdictions
Table 4.3 Trichiasis screening coverage, prevalence and treatment among Aboriginal Adults aged over 40 years in 2010 in WA
Goldfields Kimberley Midwest Pilbara Total
Adult population of at-risk* communities 1145 1627 268 711 3751
Number of communities at-risk* 23 33 8 19 83
Number of communities screened for trichiasis 1 4% 9 27% 1 13% 3 16% 14
Adults examined (% of estimated population at risk) 72 6% 266 16% 20 7% 19 3% 377 10%
With trichiasis (% of adults examined) 0 0 0 0 0
Offered ophthalmic consultation 0 0 0 0 0
Surgery in past 12 months 0 0 0 0 1
* Communities were classified as at-risk or not at-risk by jurisdictions
Wes
tern
Aus
tral
ia r
esul
ts 2
010
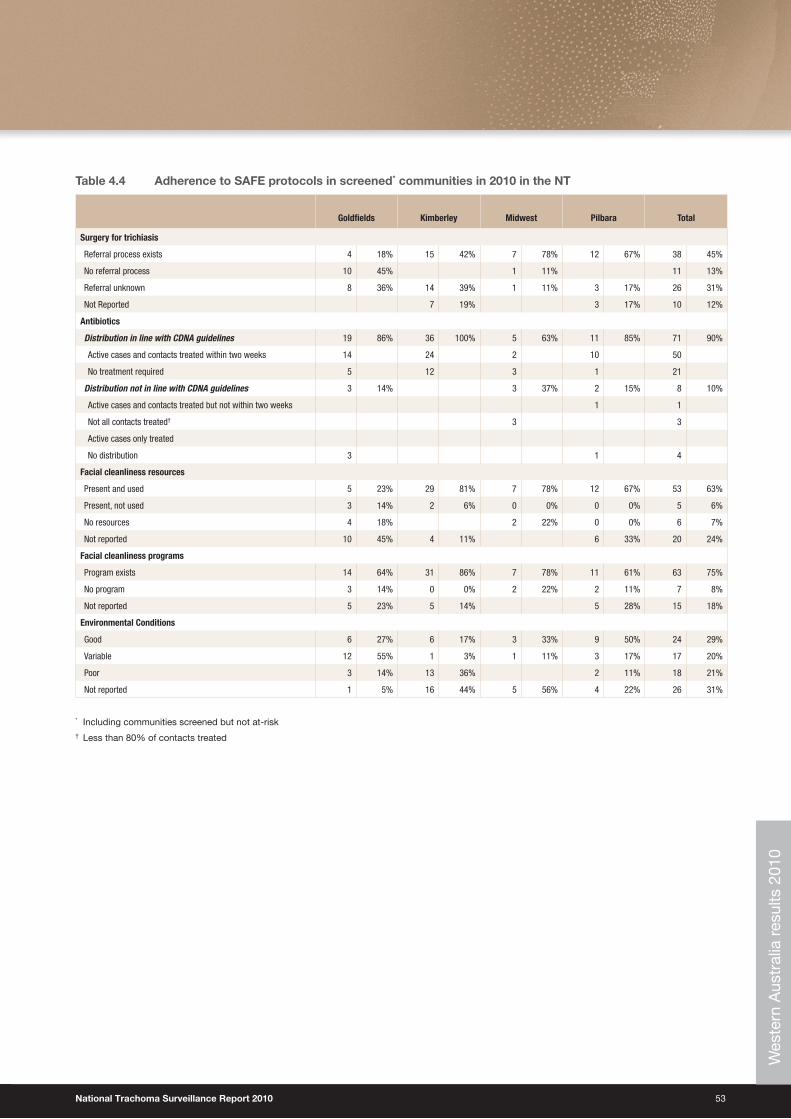
National Trachoma Surveillance Report 2010 53
Table 4.4 Adherence to SAFE protocols in screened* communities in 2010 in the NT
Goldfields Kimberley Midwest Pilbara Total
Surgery for trichiasis
Referral process exists 4 18% 15 42% 7 78% 12 67% 38 45%
No referral process 10 45% 1 11% 11 13%
Referral unknown 8 36% 14 39% 1 11% 3 17% 26 31%
Not Reported 7 19% 3 17% 10 12%
Antibiotics
Distribution in line with CDNA guidelines 19 86% 36 100% 5 63% 11 85% 71 90%
Active cases and contacts treated within two weeks 14 24 2 10 50
No treatment required 5 12 3 1 21
Distribution not in line with CDNA guidelines 3 14% 3 37% 2 15% 8 10%
Active cases and contacts treated but not within two weeks 1 1
Not all contacts treated† 3 3
Active cases only treated
No distribution 3 1 4
Facial cleanliness resources
Present and used 5 23% 29 81% 7 78% 12 67% 53 63%
Present, not used 3 14% 2 6% 0 0% 0 0% 5 6%
No resources 4 18% 2 22% 0 0% 6 7%
Not reported 10 45% 4 11% 6 33% 20 24%
Facial cleanliness programs
Program exists 14 64% 31 86% 7 78% 11 61% 63 75%
No program 3 14% 0 0% 2 22% 2 11% 7 8%
Not reported 5 23% 5 14% 5 28% 15 18%
Environmental Conditions
Good 6 27% 6 17% 3 33% 9 50% 24 29%
Variable 12 55% 1 3% 1 11% 3 17% 17 20%
Poor 3 14% 13 36% 2 11% 18 21%
Not reported 1 5% 16 44% 5 56% 4 22% 26 31%
* Including communities screened but not at-risk† Less than 80% of contacts treated
Wes
tern
Aus
tral
ia r
esul
ts 2
010
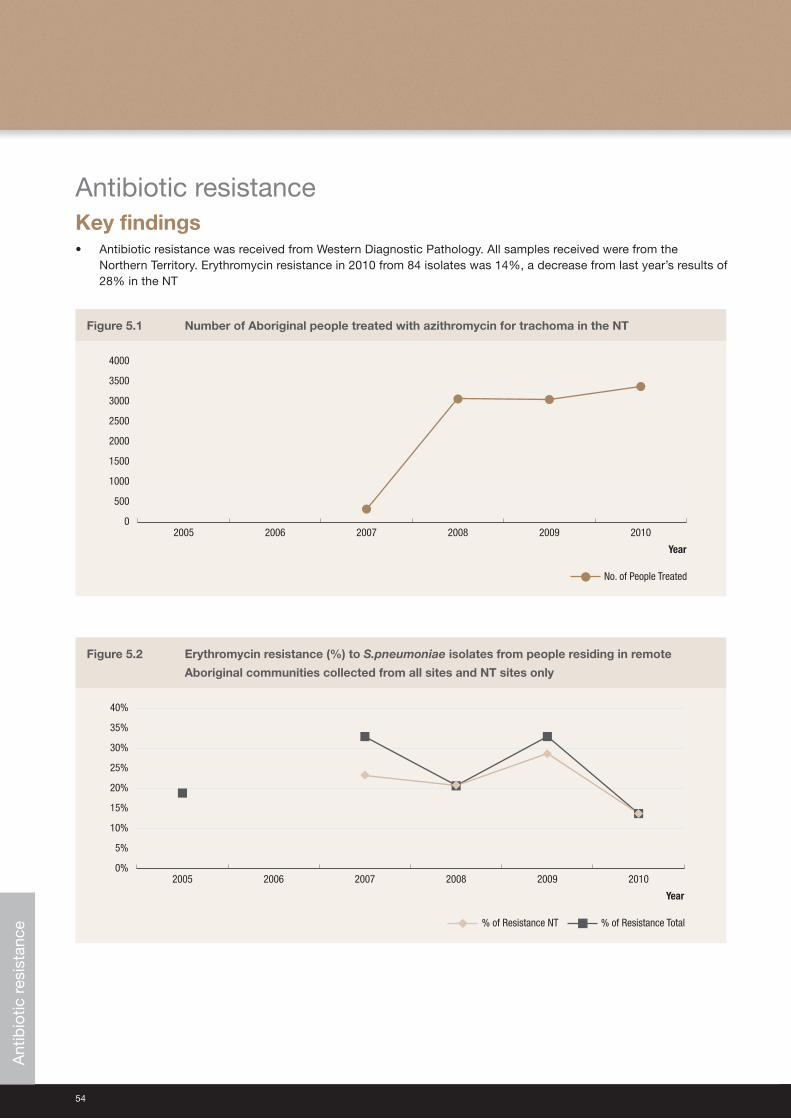
54
Antibiotic resistanceKey findings • Antibiotic resistance was received from Western Diagnostic Pathology. All samples received were from the
Northern Territory. Erythromycin resistance in 2010 from 84 isolates was 14%, a decrease from last year’s results of 28% in the NT
Figure 5.1 Number of Aboriginal people treated with azithromycin for trachoma in the NT
0
500
1000
1500
2000
2500
3000
3500
4000
201020092008200720062005
No. of People Treated
Year
Figure 5.2 Erythromycin resistance (%) to S.pneumoniae isolates from people residing in remote
Aboriginal communities collected from all sites and NT sites only
0%
5%
10%
15%
20%
25%
30%
35%
40%
201020092008200720062005
% of Resistance Total% of Resistance NT
Year
Ant
ibio
tic r
esis
tanc
e
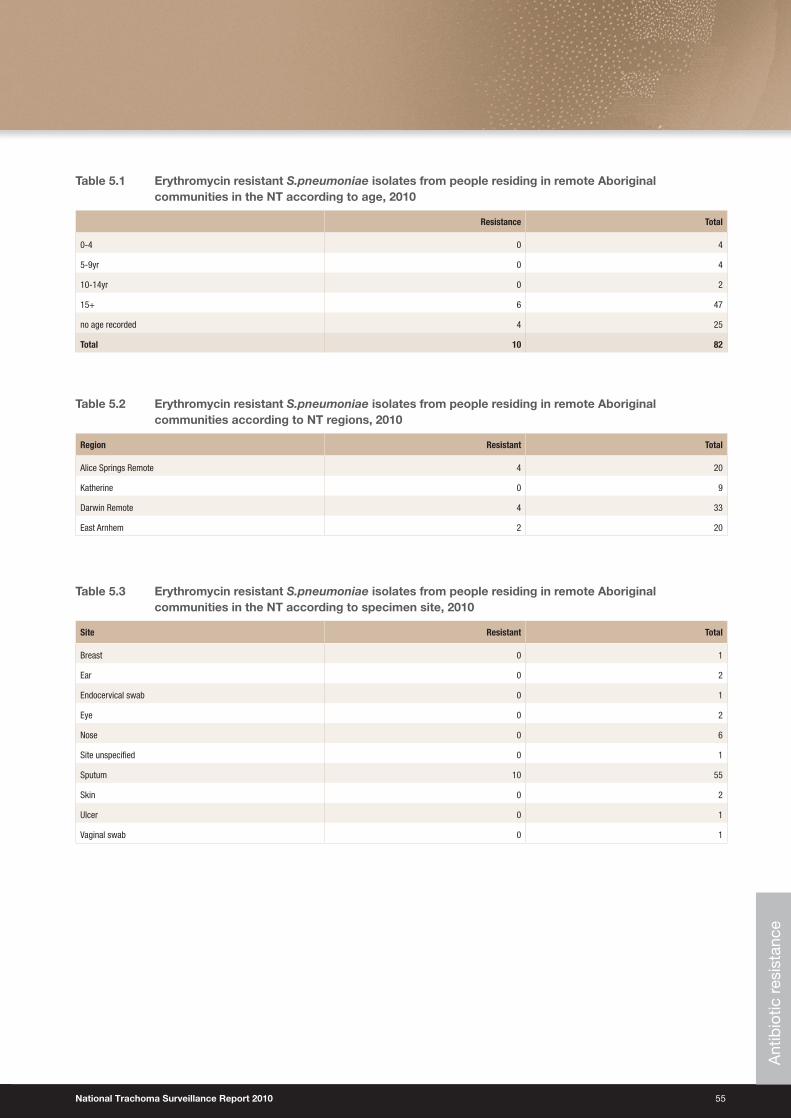
National Trachoma Surveillance Report 2010 55
Table 5.1 Erythromycin resistant S.pneumoniae isolates from people residing in remote Aboriginal communities in the NT according to age, 2010
Resistance Total
0-4 0 4
5-9yr 0 4
10-14yr 0 2
15+ 6 47
no age recorded 4 25
Total 10 82
Table 5.2 Erythromycin resistant S.pneumoniae isolates from people residing in remote Aboriginal communities according to NT regions, 2010
Region Resistant Total
Alice Springs Remote 4 20
Katherine 0 9
Darwin Remote 4 33
East Arnhem 2 20
Table 5.3 Erythromycin resistant S.pneumoniae isolates from people residing in remote Aboriginal communities in the NT according to specimen site, 2010
Site Resistant Total
Breast 0 1
Ear 0 2
Endocervical swab 0 1
Eye 0 2
Nose 0 6
Site unspecified 0 1
Sputum 10 55
Skin 0 2
Ulcer 0 1
Vaginal swab 0 1
Ant
ibio
tic r
esis
tanc
e
56
Endemic trachoma remains a concern in Aboriginal communities in Australia. The Australian Government’s commitment to the WHO’s GET2020 trachoma elimination campaign resulted in a substantial increase in funding for jurisdictional-based activities in 2009-10. This has resulted in increased community and population screening and treatment coverage, additional health promotion resources and exercises, and a increased focus on hygiene and environmental health. In principle, these measures should ensure a continued downward trend of endemic trachoma in the following years.
Screening coverageCoverage can be measured as a proportion of communities or as a proportion of individuals screened. In 2010 the community coverage levels in the NT and WA were high, with 74% of the designated at-risk communities screened in the NT and 83% in WA. Community coverage was low in SA at 17%. On the measure of individual coverage, results were poorer, with 45% of children in the target age range of 1-14 having been seen in screened communities in the NT, 37% in WA, and only 3% in SA. Compared to previous years, there was a small increase in the number of at-risk communities screened in all three jurisdictions with the trend most apparent in WA.
Trachoma was found in four communities screened in WA that were not previously classified as at-risk. With a combined prevalence of 6%, these communities should now be considered for reclassification as at-risk.
Interpretation of the coverage data is limited by the accuracy of community population estimates, the school-based approach to screening and the designation of communities at-risk. Community population estimates are based on projections from census data. Although this approach is current best practice, the estimates may not accurately reflect populations at the time of screening, given the small size and mobility of some communities.
The majority of children were screened through schools-based programs; consequently, with screening rates higher in the 5-9 and 10-14 year age groups than in the 1-4 year age group, even though this youngest group is recognised to be at highest risk of trachoma. Within the 1-4 year age group, the majority of children screened were at the older end of the range, and were usually attending preschools, kindergartens or play groups linked to the schools. Extending trachoma screening to other programs that target younger children in the 1-4 year age group would improve coverage in this important age range.
Designation of at-risk status does not appear to have been systematically reviewed in any jurisdiction. Data collected in WA in 2010, as well as previous Annual National Trachoma Reports and in the National Indigenous Eye Health Survey conducted in 2008, have all demonstrated that communities considered not at-risk may in fact have endemic trachoma. It is recommended that the NTSRU and jurisdictional stakeholders collaborate to establish a register of communities that includes the at-risk status and trachoma screening history. This would provide guidance to jurisdictions regarding communities to be screened and ensure consistency in estimating and monitoring coverage.
Trachoma prevalenceOf all children screened across jurisdictions, 11% had trachoma, demonstrating that Australia continues to have endemic levels of infection. The target set by both WHO and CDNA is community prevalence in children 1-9 years of less than 5%. Compared to previous years, the proportion of children with active trachoma decreased in WA from 15% in 2009 to 9% in 2010, with decreases observed in all four regions (p<0.01). In the NT, the prevalence remained stable at 12% in 2009-2010, with variation in trends across the regions. Trachoma prevalence in SA increased from 13% in 2009 to 17% in 2010, although this estimate is based on very small numbers of children screened. Among at-risk communities screened annually from 2007-2010, there were clear decreasing trends in trachoma in WA but not in the NT.
It is likely that the fall in trachoma prevalence observed in at-risk WA communities is real, but there is not a ready explanation for the difference in trend between NT and WA. The prevalence of clean faces has been at the same high levels in both jurisdictions, as has the proportion of children screened in communities. However, WA has been consistently screening a higher proportion of designated at-risk communities. Furthermore, it does so in the same short (two week) time period and has reduced the interval to treatment (see below), so it may be postulated that re-infection is occurring more frequently in the NT, either in the interval between screening and treatment, or through contacts between people in screened and unscreened communities. This hypothesis will require further critical examination.
Discussion
National Trachoma Surveillance Report 2010 57
Trachoma treatment CDNA guidelines recommend treating active cases as well as their household contacts and community members when required. The guidelines also recommend treatment occurs within two weeks of screening. Nationally, just over a third of cases detected through screening and their contacts were treated according to this recommendation. In WA, the treatment coverage was 89%, up from 70% in 200913 and exceeding the WHO target of 80%. In the NT, 20% of cases and contacts were treated within the recommended time period. Overall treatment of active cases and their appropriate contacts, despite length of time from screening, is also an important indicator of appropriate management. When treatment coverage is estimated regardless of timing, treatment coverage of contacts was 90% in WA and 65% in the NT. Data on active cases treated outside of the two week post screening period was not collected in 2010. The success in meeting treatment goals in WA can be attributed to the method of program delivery, which involves screening and treatment all taking place over the two week period across regions. In the NT an unusually wet dry season in 2010 contributed to some delays in treatment.18 SA did not provide data regarding treatment of cases or contacts.
CDNA guidelines recommend a range of treatment strategies according to the prevalence and clustering of active cases. These guidelines have been interpreted differently by different stakeholders. For this report, a second method was used to estimate treatment coverage (see Methods and Findings Tables 1.1, 2.1 & 4.1). The method leads to substantially lower treatment coverage estimates. Resolution of inconsistencies in the guidelines for treating contacts is required to ensure that best practice is being followed.
TrichiasisScreening coverage for trichiasis was low across all jurisdictions. Among Aboriginal adults aged 40 years and older, coverage was 3% in the NT, 19% in SA and in 10% in WA. The low levels suggest that current approaches to integrate trichiasis screening with other programs appear to not be achieving their goal. Furthermore, it is not clear that the screening programs are being optimally targeted, given that they are based on communities currently designated as at-risk for trachoma, and do not take into account the possibility that as endemic areas have changed over time, current at-risk communities may not reflect adult populations who were exposed to trachoma as children. Establishing a register of all remote communities may assist in better establishing records of those likely to have substantial adult populations affected by trichiasis.
Referral processes were reported to be functioning within 97% of communities in the NT and 45% of communities in WA; however, this does not assess the effectiveness of the systems. Ophthalmic consultation and surgery reports do not reflect the extent of actual service delivery. Greater collaboration in developing data transfer processes with stakeholders and jurisdictions that provide ophthalmic consultations and trichiasis surgery is required.
Facial cleanlinessAt a community level, lower levels of facial cleanliness are a recognised risk factor for trachoma.4 For this reason, facial cleanliness is a major component of the SAFE strategy. The overall proportion of children screened who had clean faces remained stable, with 80% prevalence in children screened in the NT, 82% prevalence in WA and 51% in SA. Measures of facial cleanliness may not be a true estimation of actual risk due to the definition specified by the CDNA guidelines. The definition according to CDNA guidelines is “absence of dirt or crusting on cheeks or forehead”9, which does not align with actual risk of transmission, which is increased with ocular and nasal discharge.
WA and the NT reported facial cleanliness or hygiene-based programs in operation in most communities. Facial cleanliness resources were present and used in 97% of communities in the NT in 2010, an increase from 76% in the previous year13. There have also been increases in the presence and use of facial cleanliness programs and resources in at-risk WA communities from 43% in 2009 to 75% in 2010. The increase in facial cleanliness programs may be attributable to the rollout of the Trachoma Story Kits in 2010.19 WA may have also benefited from other Information, Education and Communication (IEC) resources and the recruitment of Health Promotion personnel.
58
EnvironmentThe NT and SA did not report on environmental conditions and less than a third of WA communities reported good environmental conditions, with another third not reporting on this outcome. For future reports, the NTSRU will work with environmental health units and other authorities to develop data collection tools and processes that facilitate the compilation of information on environmental factors known to affect trachoma prevalence.
Antibiotic resistanceAntibiotic resistance data was collected from Western Diagnostic Pathology of isolates of S.pneumoniae specimens from individuals residing in remote Aboriginal communities in the NT. Erythromycin resistance in 2010 from 84 isolates was 14%, a decrease from last year’s estimates (which were 28% in the NT and 33% for all jurisdictions that provided data). Antibiotic coverage rates for trachoma have continued to increase. Azithromycin is also widely used in remote Aboriginal communities for a range of diseases including pneumonia, genital chlamydia and acute ear infections. Interpretation of this result is difficult, given the small sample size as well as the age range of individuals tested which do not reflect the target age group of those receiving mass drug administration therapy. However, the results are encouraging in that resistance to erythromycin and presumably azithromycin does not appear to be increasing.
Data quality and surveillance systemsAs noted in the preceding sections, a number of conceptual issues must be addressed if the national trachoma surveillance system is to provide optimal support for control programs. They include the definition of population denominators, designation of at-risk status for communities and the interpretation of the CDNA trachoma control guidelines. There are also issues of data quality to be addressed, particularly in regard to inconsistent and missing items. For example, counts by age groups were not uniformly provided, and data were missing for numbers treated and components of the SAFE strategy implemented.
Over the coming year, the NTSRU will work with the Reference Group and jurisdictions to address these issues. It will also undertake the development of a web-based data entry system, and collaborate with jurisdictions and Aboriginal community controlled health organisations to facilitate the transfer of trachoma data from clinic-based health information systems to jurisdictional and national databases. These changes will reduce delays in data transfer and minimise human error in data transfer.
Particular attention is required for SA, where previously there has not been a systematic screening and treatment program. The data provided for the 2010 report show very moderate community coverage, low population coverage and inconsistent reporting of other variables. The establishment of a contract between the Department of Health and Ageing and the South Australian Government in late 2010 to conduct trachoma control activities is likely to lead to a substantial improvement in program coverage and the quantity and quality of surveillance data from SA.
National Trachoma Surveillance Report 2010 59
Recommendations for trachoma surveillanceWhile improvements have occurred over the past five reporting years, gaps in data collected and limitations noted in the discussion prevents precise estimates of disease prevalence and program delivery and impact. For this reason, the further recommendations are made:
• Establish a web-based system that will allow efficient transfer of data between jurisdictions and the NTSRU, as well as the generation of reports in a timely manner.
• Ensure jurisdictional data collection protocols and trachoma management guidelines are consistent with the CDNA Guidelines and that there is no ambiguity in the guidelines.
• Establish a systematic and accountable procedure for updating designation of communities as at-risk or not at-risk, including a register of communities.
• Extend screening and reporting of trachoma to other Australian jurisdictions where communities may be at risk of trachoma.
• Review and formalise procedures (and agreements as needed) in the following areas:
• Estimation of denominators for population sizes of communities
• Collection of antibiotic resistance data
• Collection of environmental data
• Collection of information on health promotion IEC material and program activity
• Trichiasis screening processes and management, referral systems and related data collection including data pertaining to surgery for trichiasis.
These programmatic recommendations along with greater collaboration within and between jurisdictions and communities will continue to decrease the prevalence of trachoma in Australia, moving towards elimination.

60
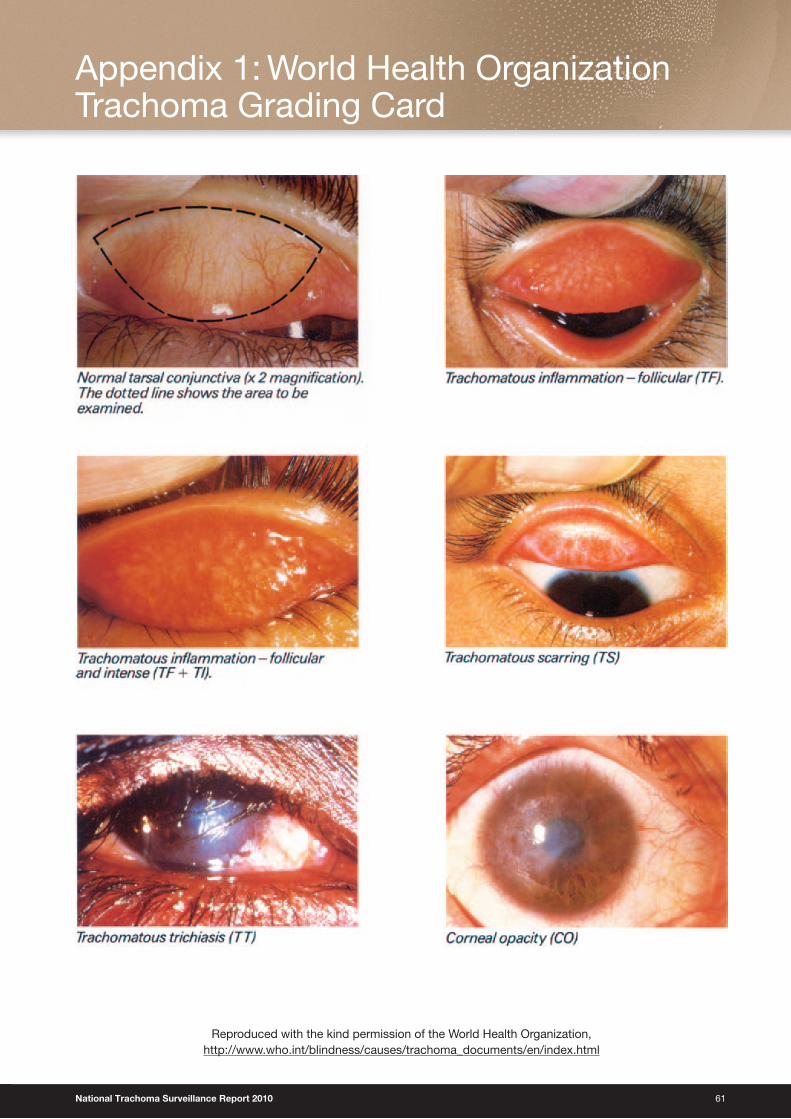
National Trachoma Surveillance Report 2010 61
Reproduced with the kind permission of the World Health Organization, http://www.who.int/blindness/causes/trachoma_documents/en/index.html
Appendix 1: World Health Organization Trachoma Grading Card

62
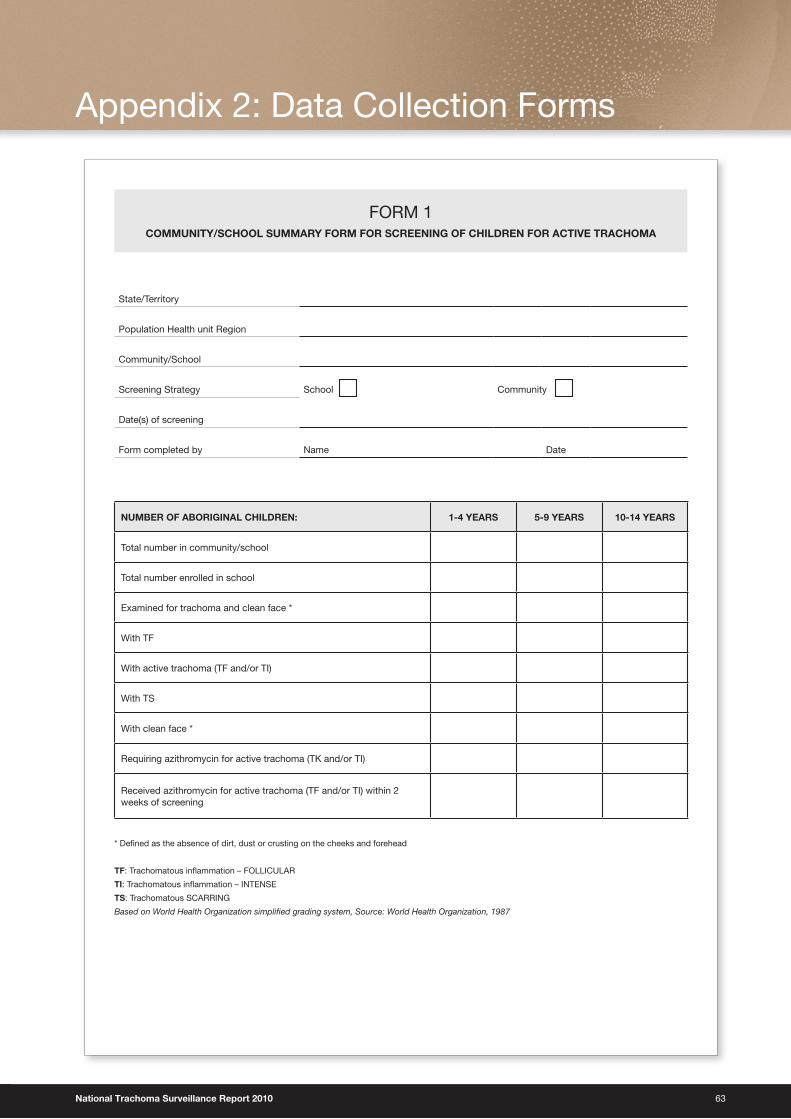
National Trachoma Surveillance Report 2010 63
Appendix 2: Data Collection Forms
FORM 1COMMUNITY/SCHOOL SUMMARY FORM FOR SCREENING OF CHILDREN FOR ACTIVE TRACHOMA
State/Territory
Population Health unit Region
Community/School
Screening Strategy School Community
Date(s) of screening
Form completed by Name Date
NUMBER OF ABORIGINAL CHILDREN: 1-4 YEARS 5-9 YEARS 10-14 YEARS
Total number in community/school
Total number enrolled in school
Examined for trachoma and clean face *
With TF
With active trachoma (TF and/or TI)
With TS
With clean face *
Requiring azithromycin for active trachoma (TK and/or TI)
Received azithromycin for active trachoma (TF and/or TI) within 2 weeks of screening
* Defi ned as the absence of dirt, dust or crusting on the cheeks and forehead
TF: Trachomatous infl ammation – FOLLICULAR
TI: Trachomatous infl ammation – INTENSE
TS: Trachomatous SCARRING
Based on World Health Organization simplifi ed grading system, Source: World Health Organization, 1987
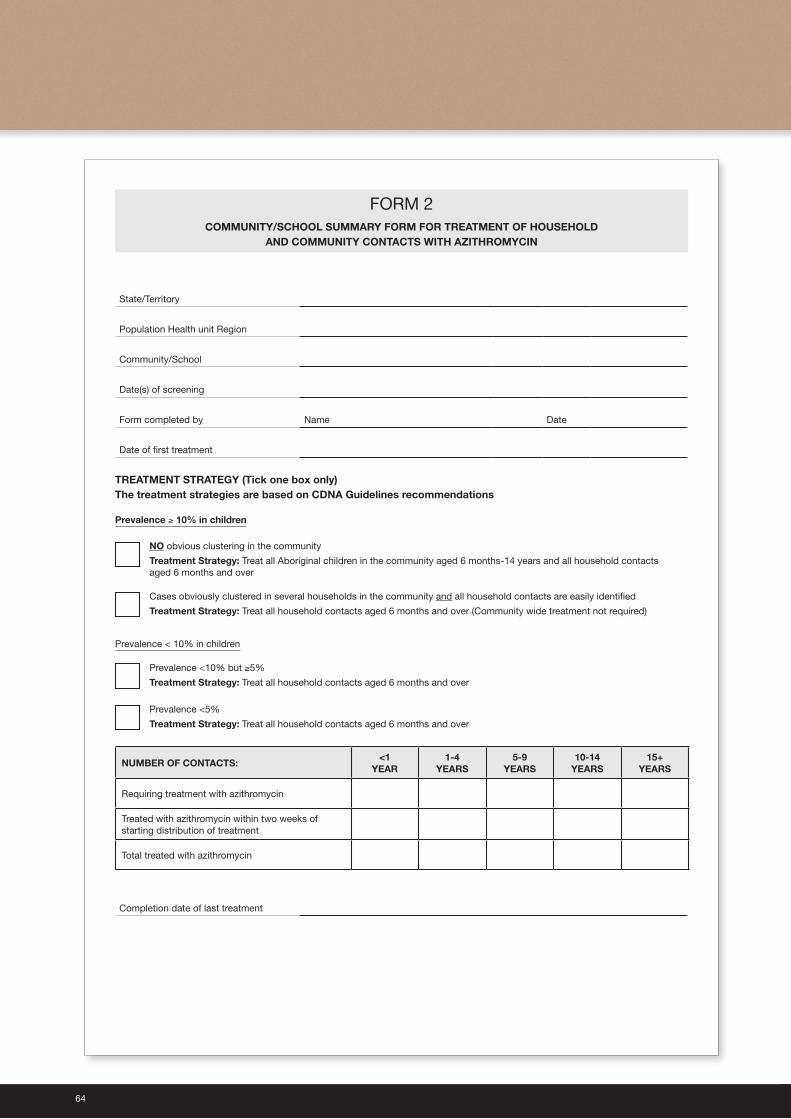
64
FORM 2COMMUNITY/SCHOOL SUMMARY FORM FOR TREATMENT OF HOUSEHOLD
AND COMMUNITY CONTACTS WITH AZITHROMYCIN
State/Territory
Population Health unit Region
Community/School
Date(s) of screening
Form completed by Name Date
Date of fi rst treatment
TREATMENT STRATEGY (Tick one box only)The treatment strategies are based on CDNA Guidelines recommendations
Prevalence ≥ 10% in children
NO obvious clustering in the community
Treatment Strategy: Treat all Aboriginal children in the community aged 6 months-14 years and all household contacts aged 6 months and over
Cases obviously clustered in several households in the community and all household contacts are easily identifi ed
Treatment Strategy: Treat all household contacts aged 6 months and over (Community wide treatment not required)
Prevalence < 10% in children
Prevalence <10% but ≥5%
Treatment Strategy: Treat all household contacts aged 6 months and over
Prevalence <5%
Treatment Strategy: Treat all household contacts aged 6 months and over
NUMBER OF CONTACTS:<1
YEAR1-4
YEARS5-9
YEARS10-14
YEARS15+
YEARS
Requiring treatment with azithromycin
Treated with azithromycin within two weeks of starting distribution of treatment
Total treated with azithromycin
Completion date of last treatment
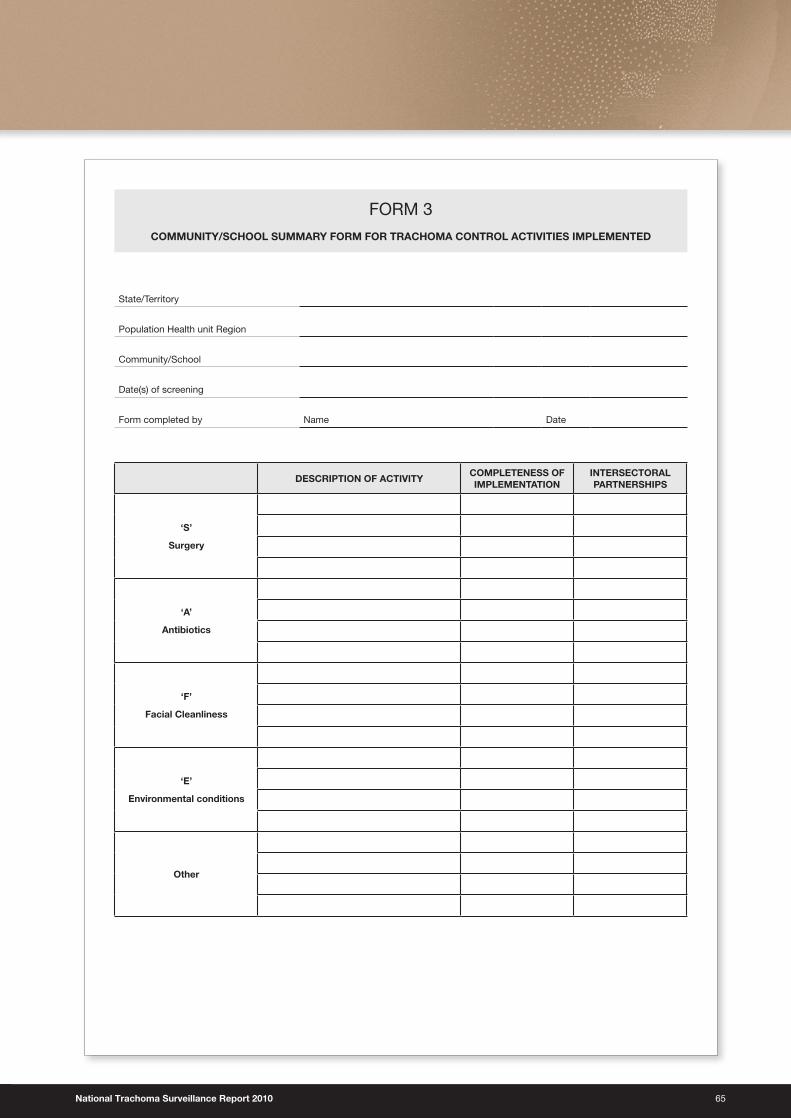
National Trachoma Surveillance Report 2010 65
FORM 3
COMMUNITY/SCHOOL SUMMARY FORM FOR TRACHOMA CONTROL ACTIVITIES IMPLEMENTED
State/Territory
Population Health unit Region
Community/School
Date(s) of screening
Form completed by Name Date
DESCRIPTION OF ACTIVITYCOMPLETENESS OF IMPLEMENTATION
INTERSECTORAL PARTNERSHIPS
‘S’
Surgery
‘A’
Antibiotics
‘F’
Facial Cleanliness
‘E’
Environmental conditions
Other
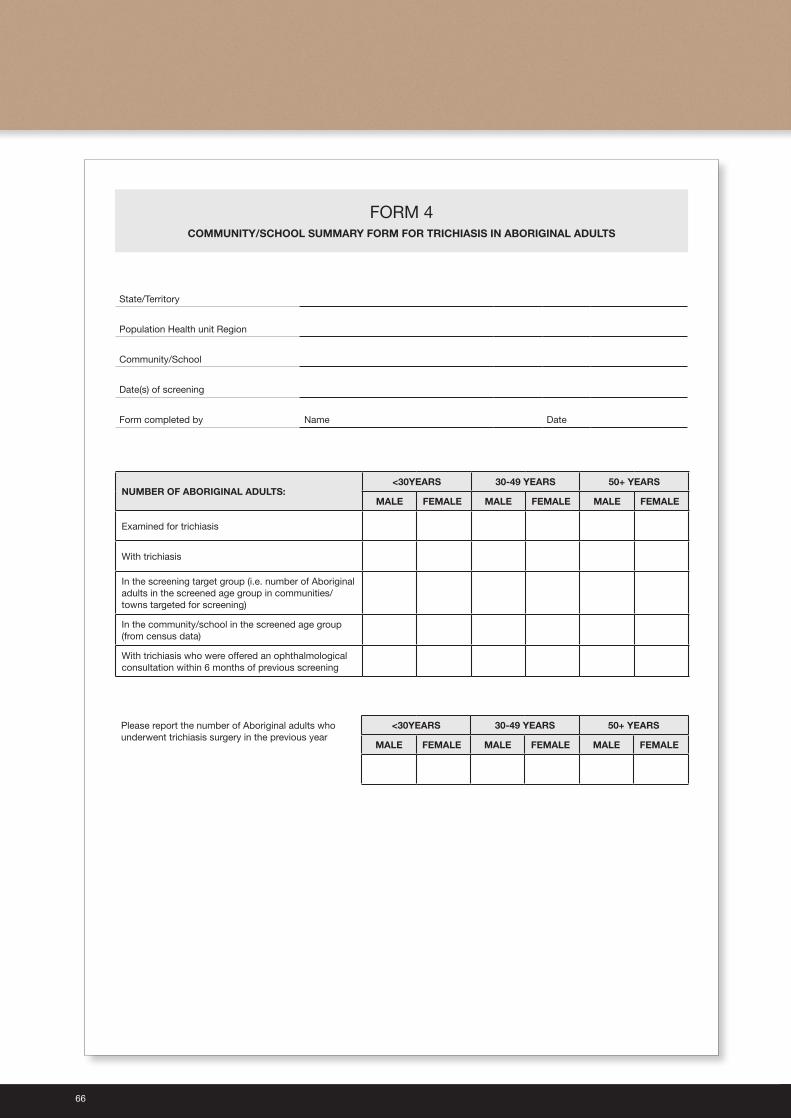
66
FORM 4COMMUNITY/SCHOOL SUMMARY FORM FOR TRICHIASIS IN ABORIGINAL ADULTS
State/Territory
Population Health unit Region
Community/School
Date(s) of screening
Form completed by Name Date
NUMBER OF ABORIGINAL ADULTS:<30YEARS 30-49 YEARS 50+ YEARS
MALE FEMALE MALE FEMALE MALE FEMALE
Examined for trichiasis
With trichiasis
In the screening target group (i.e. number of Aboriginal adults in the screened age group in communities/towns targeted for screening)
In the community/school in the screened age group (from census data)
With trichiasis who were offered an ophthalmological consultation within 6 months of previous screening
Please report the number of Aboriginal adults who underwent trichiasis surgery in the previous year
<30YEARS 30-49 YEARS 50+ YEARS
MALE FEMALE MALE FEMALE MALE FEMALE
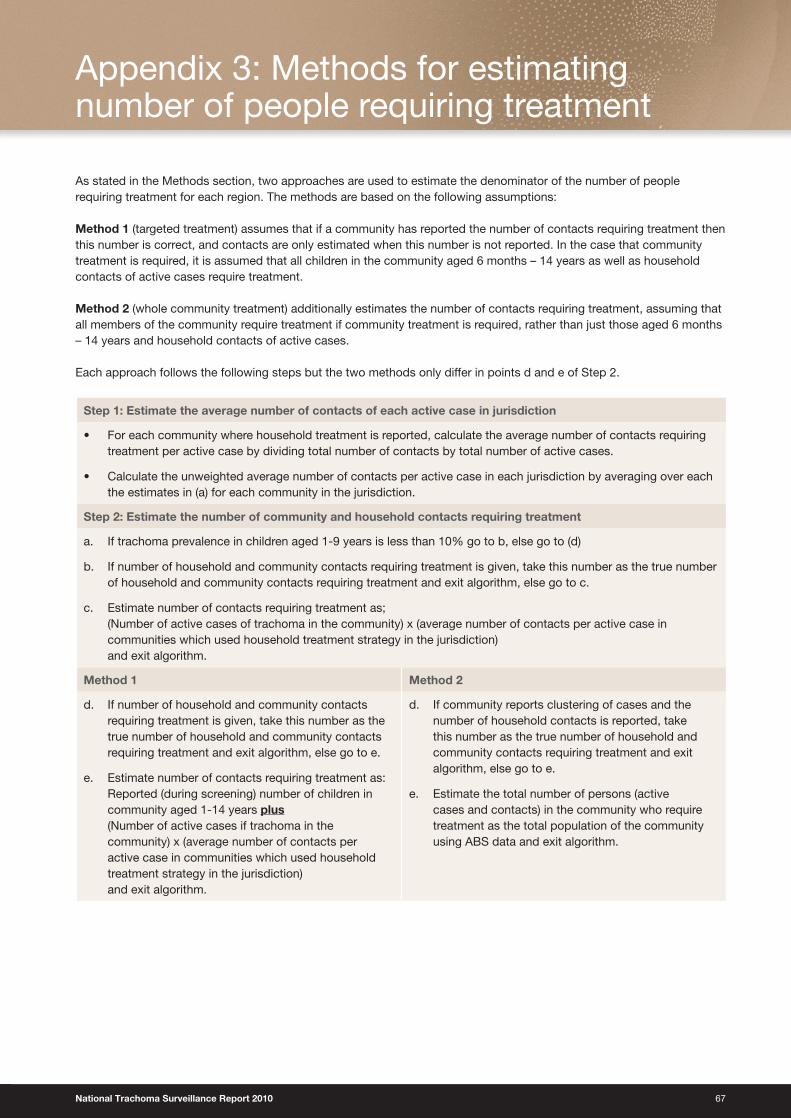
National Trachoma Surveillance Report 2010 67
As stated in the Methods section, two approaches are used to estimate the denominator of the number of people requiring treatment for each region. The methods are based on the following assumptions:
Method 1 (targeted treatment) assumes that if a community has reported the number of contacts requiring treatment then this number is correct, and contacts are only estimated when this number is not reported. In the case that community treatment is required, it is assumed that all children in the community aged 6 months – 14 years as well as household contacts of active cases require treatment.
Method 2 (whole community treatment) additionally estimates the number of contacts requiring treatment, assuming that all members of the community require treatment if community treatment is required, rather than just those aged 6 months – 14 years and household contacts of active cases.
Each approach follows the following steps but the two methods only differ in points d and e of Step 2.
Step 1: Estimate the average number of contacts of each active case in jurisdiction
• For each community where household treatment is reported, calculate the average number of contacts requiring treatment per active case by dividing total number of contacts by total number of active cases.
• Calculate the unweighted average number of contacts per active case in each jurisdiction by averaging over each the estimates in (a) for each community in the jurisdiction.
Step 2: Estimate the number of community and household contacts requiring treatment
a. If trachoma prevalence in children aged 1-9 years is less than 10% go to b, else go to (d)
b. If number of household and community contacts requiring treatment is given, take this number as the true number of household and community contacts requiring treatment and exit algorithm, else go to c.
c. Estimate number of contacts requiring treatment as; (Number of active cases of trachoma in the community) x (average number of contacts per active case in communities which used household treatment strategy in the jurisdiction) and exit algorithm.
Method 1 Method 2
d. If number of household and community contacts requiring treatment is given, take this number as the true number of household and community contacts requiring treatment and exit algorithm, else go to e.
e. Estimate number of contacts requiring treatment as: Reported (during screening) number of children in community aged 1-14 years plus (Number of active cases if trachoma in the community) x (average number of contacts per active case in communities which used household treatment strategy in the jurisdiction) and exit algorithm.
d. If community reports clustering of cases and the number of household contacts is reported, take this number as the true number of household and community contacts requiring treatment and exit algorithm, else go to e.
e. Estimate the total number of persons (active cases and contacts) in the community who require treatment as the total population of the community using ABS data and exit algorithm.
Appendix 3: Methods for estimating number of people requiring treatment
68
1 Resnikoff S, Pascolini D, Etya’ale D, et al., Global data on visual impairment in the year 2002. Bulletin of the World Health Organization, 2004. 82(11): p. 844-851.
2 Communicable Diseases Network Australia, Guidelines for the public health management of trachoma in Australia. 2006, Canberra: Commonwealth of Australia
3 Polack S, Brooker S, Kuper K, Mariotti S, Mabey D and Foster A. Mapping the Global Distribution of Trachoma. Bulletin of the World Health Organization, 2005, 80(12).
4 Taylor HR, Trachoma: A blinding scourge from the Bronze Age to the Twenty First Century. 2008, Melbourne: Centre for Eye Research Australia
5 World Health Organization. Future Approaches to Trachoma Control – Report of a Global Scientific Meeting. Geneva . WHO 1996.
6 Mariotti SP, Pararajasegaram R, and Resnikoff S, Trachoma: Looking forward to Global Elimination of Trachoma by 2020 (GET 2020). American Journal of Tropical Medicine and Hygiene, 2003. 69(5): p. 33-35.
7 World Health Organization. Report of the 2nd Global Scientific Meeting on Trachoma. Geneva. WHO. 2003.
8 Taylor HR, Fox SS, Xie J, et al., The prevalence of trachoma in Australia: the National Indigenous Eye Health Survey. Med J Aust. 2010 192(5): p. 248-53.
9 Communicable Diseases Network Australia, Guidelines for the public health management of trachoma in Australia. 2006, Canberra: Commonwealth of Australia
10 Tellis B, Dunn R, Keeffe JE, et al., Trachoma Surveillance Report 2006: National Trachoma Surveillance and Reporting Unit. 2007, Centre for Eye Research Australia www.health.gov.au
11 Tellis B, Dunn R, Keeffe JE, et al., Trachoma Surveillance Report 2007: National Trachoma Surveillance and Reporting Unit. 2008, Centre for Eye Research Australia www.health.gov.au.
12 Tellis B, Fotis K, Dunn R, et al., Trachoma Surveillance Report 2008: National Trachoma Surveillance and Reporting Unit. 2009, Centre for Eye Research Australia, www.health.gov.au.
13 Adams K, Burgess J, Dharmage S. National Trachoma Surveillance Report 2009: National Trachoma Surveillance and Reporting Unit, 2010. Centre for Molecular, Environmental, Genetic and Analytic Epidemiology, University of Melbourne
14 http://remotehealthatlas.nt.gov.au/healthy_school_age_kids_program.pdf15 Australian Bureau of Statistics 2009, Estimates and Projections, Aboriginal and Torres Strait Islander Australians, 1991 to 2021, data
cube: SuperTABLE, cat. no. 3238.0, viewed 15 May 2011.
16 Performance Standards for Antimicrobial Susceptibility Testing; Twentieth Informational Supplement. Clinical and Laboratory Standards Institute January 2010;30(1).
17 Gotlieb T, Collignon P, Robson J, et al. Streptococcus pneumoniae Survey: 2005 Antimicrobial Susceptibility Report: The Australian Group on Antimicrobial Resistance http://antimicrobial-resistance.com, August 2006.
18 http://www.bom.gov.au/climate/current/annual/nt/summary.shtml
19 http://www.iehu.unimelb.edu.au/trachoma_resources/the_trachoma_story_kit
Reference List

Australian Trachoma Surveillance Report 2010
ISSN 1839-2210
Suggested citation:The Kirby Institute for infection and immunity in society. Australian Trachoma Surveillance Report 2010. The Kirby Institute for infection and immunity in society, The University of New South Wales, NSW.
© Commonwealth of Australia 2011
This report has been produced by the National Trachoma Surveillance Unit of The Kirby Institute for infection and immunity in society, Unversity of New South Wales for the Australian Government Department of Health and Ageing.
This work is copyright. You may reproduce the whole or part of this work in unaltered form for your own personal use or, if you are part of an organisation, for internal use within your organisation, but only if you or your organisation do not use the reproduction for any commercial purpose and retain this copyright notice and all disclaimer notices as part of that reproduction. Apart from rights to use as permitted by the Copyright Act 1968 or allowed by this copyright notice, all other rights are reserved and you are not allowed to reproduce the whole or any part of this work in any way (electronic or otherwise) without first being given the specific written permission from the Commonwealth to do so. Requests and inquiries concerning reproduction and rights are to be sent to the Communications Branch, Department of Health and Ageing, GPO Box 9848, Canberra ACT 2601, or via e-mail to [email protected].
This publication is available at Internet address http://www.kirby.unsw.edu.au/trachoma
The Kirby Institute for infection and immunity in society. Centre for Immunology Building, Cnr Boundary and West Streets, Darlinghurst NSW 2010 Australia
Telephone: 02 9385 0900 Facsimile: 02 9385 0920 International prefix: 61 2 Email: [email protected] Design: il Razzo Telephone: 02 48 211136 E-mail: [email protected]

Australian Trachoma Surveillance Report
2010
Edited by National Trachoma Surveillance and Reporting Unit