Embed Size (px)
Citation preview
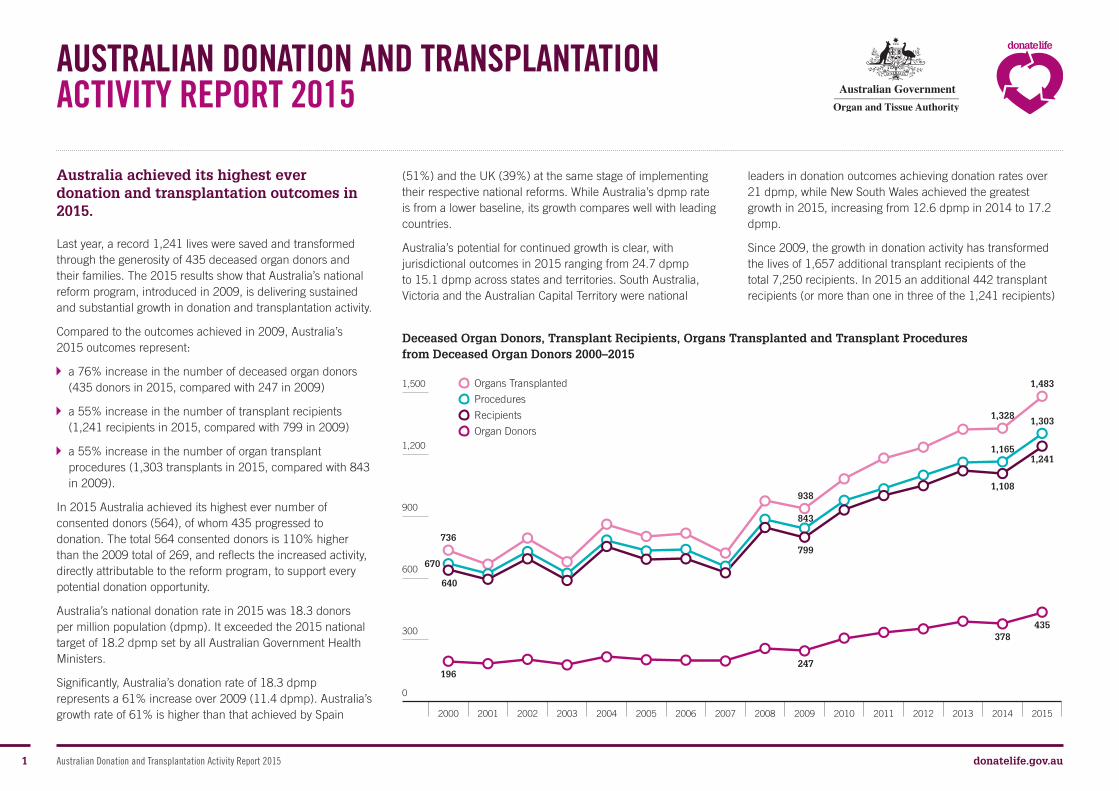
1 donatelife.gov.auAustralian Donation and Transplantation Activity Report 2015
Australia achieved its highest ever donation and transplantation outcomes in 2015.
Last year, a record 1,241 lives were saved and transformed through the generosity of 435 deceased organ donors and their families. The 2015 results show that Australia’s national reform program, introduced in 2009, is delivering sustained and substantial growth in donation and transplantation activity.
Compared to the outcomes achieved in 2009, Australia’s 2015 outcomes represent:
a 76% increase in the number of deceased organ donors (435 donors in 2015, compared with 247 in 2009)
a 55% increase in the number of transplant recipients (1,241 recipients in 2015, compared with 799 in 2009)
a 55% increase in the number of organ transplant procedures (1,303 transplants in 2015, compared with 843 in 2009).
In 2015 Australia achieved its highest ever number of consented donors (564), of whom 435 progressed to donation. The total 564 consented donors is 110% higher than the 2009 total of 269, and reflects the increased activity, directly attributable to the reform program, to support every potential donation opportunity.
Australia’s national donation rate in 2015 was 18.3 donors per million population (dpmp). It exceeded the 2015 national target of 18.2 dpmp set by all Australian Government Health Ministers.
Significantly, Australia’s donation rate of 18.3 dpmp represents a 61% increase over 2009 (11.4 dpmp). Australia’s growth rate of 61% is higher than that achieved by Spain
(51%) and the UK (39%) at the same stage of implementing their respective national reforms. While Australia’s dpmp rate is from a lower baseline, its growth compares well with leading countries.
Australia’s potential for continued growth is clear, with jurisdictional outcomes in 2015 ranging from 24.7 dpmp to 15.1 dpmp across states and territories. South Australia, Victoria and the Australian Capital Territory were national
leaders in donation outcomes achieving donation rates over 21 dpmp, while New South Wales achieved the greatest growth in 2015, increasing from 12.6 dpmp in 2014 to 17.2 dpmp.
Since 2009, the growth in donation activity has transformed the lives of 1,657 additional transplant recipients of the total 7,250 recipients. In 2015 an additional 442 transplant recipients (or more than one in three of the 1,241 recipients)
AUSTRALIAN DONATION AND TRANSPLANTATIONACTIVITY REPORT 2015
0
300
600
900
1,200
1,500
2000 2001 2002 2003 2004 2005 2006 2007 2008 2009 2010 2011 2012 2013 2014 2015
Organs Transplanted
Procedures
Recipients
Organ Donors
Deceased Organ Donors, Transplant Recipients, Organs Transplanted and Transplant Procedures from Deceased Organ Donors 2000–2015
938
736
670
1,483
1,303
1,165
1,328
843
247196
640
799
1,241
435378
1,108
2 donatelife.gov.auAustralian Donation and Transplantation Activity Report 2015
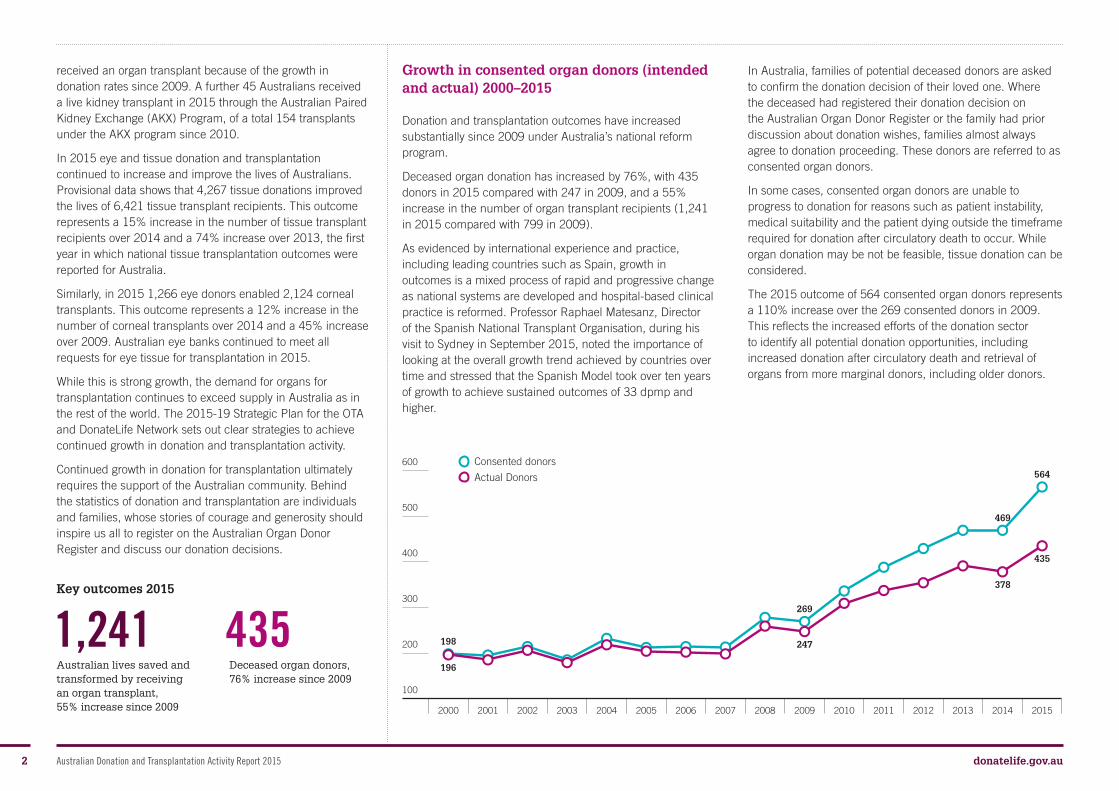
Growth in consented organ donors (intended and actual) 2000–2015
Donation and transplantation outcomes have increased substantially since 2009 under Australia’s national reform program.
Deceased organ donation has increased by 76%, with 435 donors in 2015 compared with 247 in 2009, and a 55% increase in the number of organ transplant recipients (1,241 in 2015 compared with 799 in 2009).
As evidenced by international experience and practice, including leading countries such as Spain, growth in outcomes is a mixed process of rapid and progressive change as national systems are developed and hospital-based clinical practice is reformed. Professor Raphael Matesanz, Director of the Spanish National Transplant Organisation, during his visit to Sydney in September 2015, noted the importance of looking at the overall growth trend achieved by countries over time and stressed that the Spanish Model took over ten years of growth to achieve sustained outcomes of 33 dpmp and higher.
In Australia, families of potential deceased donors are asked to confirm the donation decision of their loved one. Where the deceased had registered their donation decision on the Australian Organ Donor Register or the family had prior discussion about donation wishes, families almost always agree to donation proceeding. These donors are referred to as consented organ donors.
In some cases, consented organ donors are unable to progress to donation for reasons such as patient instability, medical suitability and the patient dying outside the timeframe required for donation after circulatory death to occur. While organ donation may be not be feasible, tissue donation can be considered.
The 2015 outcome of 564 consented organ donors represents a 110% increase over the 269 consented donors in 2009. This reflects the increased efforts of the donation sector to identify all potential donation opportunities, including increased donation after circulatory death and retrieval of organs from more marginal donors, including older donors.
100
200
300
400
500
600
2000 2001 2002 2003 2004 2005 2006 2007 2008 2009 2010 2011 2012 2013 2014 2015
Consented donors
Actual Donors
received an organ transplant because of the growth in donation rates since 2009. A further 45 Australians received a live kidney transplant in 2015 through the Australian Paired Kidney Exchange (AKX) Program, of a total 154 transplants under the AKX program since 2010.
In 2015 eye and tissue donation and transplantation continued to increase and improve the lives of Australians. Provisional data shows that 4,267 tissue donations improved the lives of 6,421 tissue transplant recipients. This outcome represents a 15% increase in the number of tissue transplant recipients over 2014 and a 74% increase over 2013, the first year in which national tissue transplantation outcomes were reported for Australia.
Similarly, in 2015 1,266 eye donors enabled 2,124 corneal transplants. This outcome represents a 12% increase in the number of corneal transplants over 2014 and a 45% increase over 2009. Australian eye banks continued to meet all requests for eye tissue for transplantation in 2015.
While this is strong growth, the demand for organs for transplantation continues to exceed supply in Australia as in the rest of the world. The 2015-19 Strategic Plan for the OTA and DonateLife Network sets out clear strategies to achieve continued growth in donation and transplantation activity.
Continued growth in donation for transplantation ultimately requires the support of the Australian community. Behind the statistics of donation and transplantation are individuals and families, whose stories of courage and generosity should inspire us all to register on the Australian Organ Donor Register and discuss our donation decisions.
198
196
269
247
469
378
564
435
Key outcomes 2015
Australian lives saved and transformed by receiving an organ transplant, 55% increase since 2009
Deceased organ donors, 76% increase since 2009
1,241 435
3 donatelife.gov.auAustralian Donation and Transplantation Activity Report 2015
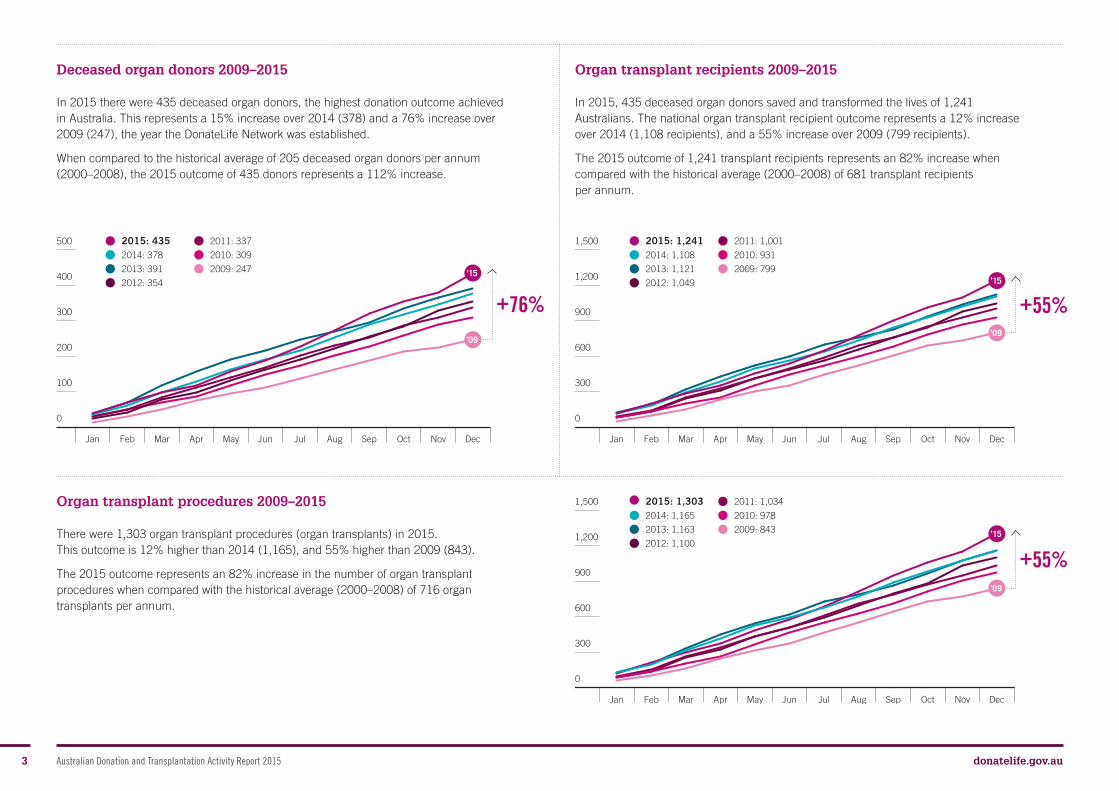
Deceased organ donors 2009–2015
In 2015 there were 435 deceased organ donors, the highest donation outcome achieved in Australia. This represents a 15% increase over 2014 (378) and a 76% increase over 2009 (247), the year the DonateLife Network was established.
When compared to the historical average of 205 deceased organ donors per annum (2000–2008), the 2015 outcome of 435 donors represents a 112% increase.
Organ transplant recipients 2009–2015
In 2015, 435 deceased organ donors saved and transformed the lives of 1,241 Australians. The national organ transplant recipient outcome represents a 12% increase over 2014 (1,108 recipients), and a 55% increase over 2009 (799 recipients).
The 2015 outcome of 1,241 transplant recipients represents an 82% increase when compared with the historical average (2000–2008) of 681 transplant recipients per annum.
Organ transplant procedures 2009–2015
There were 1,303 organ transplant procedures (organ transplants) in 2015. This outcome is 12% higher than 2014 (1,165), and 55% higher than 2009 (843).
The 2015 outcome represents an 82% increase in the number of organ transplant procedures when compared with the historical average (2000–2008) of 716 organ transplants per annum.
Jan Feb Mar Apr May Jun Jul Aug Sep Oct Nov Dec
0
100
200
300
400
500
’09
’15
Jan Feb Mar Apr May Jun Jul Aug Sep Oct Nov Dec
0
300
600
900
1,200
1,500
’09
’15
Jan Feb Mar Apr May Jun Jul Aug Sep Oct Nov Dec
0
300
600
900
1,200
1,500
’09
’15
2015: 435 2014: 378
2013: 391
2012: 354
2011: 337
2010: 309
2009: 247
2015: 1,241 2014: 1,108
2013: 1,121
2012: 1,049
2011: 1,001
2010: 931
2009: 799
2015: 1,303 2014: 1,165
2013: 1,163
2012: 1,100
2011: 1,034
2010: 978
2009: 843
+76% +55%
+55%
4 donatelife.gov.auAustralian Donation and Transplantation Activity Report 2015
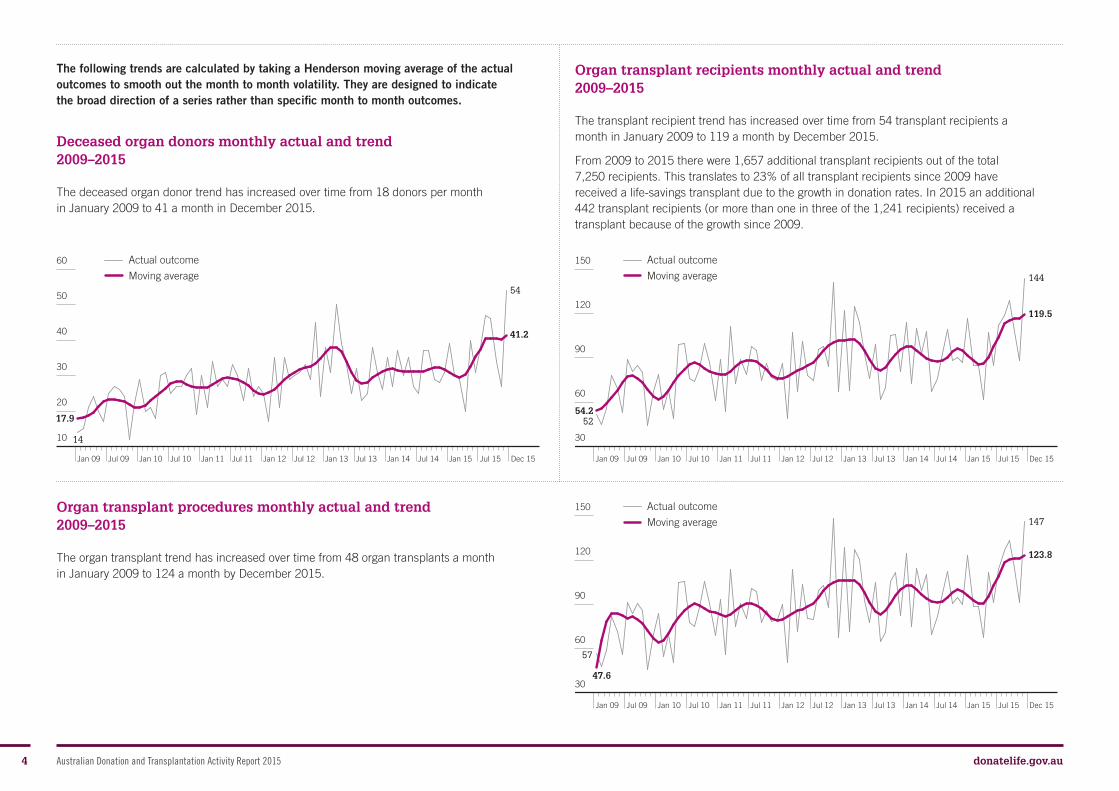
The following trends are calculated by taking a Henderson moving average of the actual outcomes to smooth out the month to month volatility. They are designed to indicate the broad direction of a series rather than specific month to month outcomes.
Deceased organ donors monthly actual and trend 2009–2015
The deceased organ donor trend has increased over time from 18 donors per month in January 2009 to 41 a month in December 2015.
Organ transplant procedures monthly actual and trend 2009–2015
The organ transplant trend has increased over time from 48 organ transplants a month in January 2009 to 124 a month by December 2015.
Organ transplant recipients monthly actual and trend 2009–2015
The transplant recipient trend has increased over time from 54 transplant recipients a month in January 2009 to 119 a month by December 2015.
From 2009 to 2015 there were 1,657 additional transplant recipients out of the total 7,250 recipients. This translates to 23% of all transplant recipients since 2009 have received a life-savings transplant due to the growth in donation rates. In 2015 an additional 442 transplant recipients (or more than one in three of the 1,241 recipients) received a transplant because of the growth since 2009.
Jan 09 Jul 09 Jan 10 Jul 10 Jan 11 Jul 11 Jan 12 Jul 12 Jan 13 Jul 13 Jan 14 Jul 14 Jan 15 Jul 15 Dec 15
10
20
30
40
50
60
Jan 09 Jul 09 Jan 10 Jul 10 Jan 11 Jul 11 Jan 12 Jul 12 Jan 13 Jul 13 Jan 14 Jul 14 Jan 15 Jul 15
30
60
90
120
150
Dec 15
Jan 09 Jul 09 Jan 10 Jul 10 Jan 11 Jul 11 Jan 12 Jul 12 Jan 13 Jul 13 Jan 14 Jul 14 Jan 15 Jul 15
30
60
90
120
150
Dec 15
Actual outcome
Moving average
Actual outcome
Moving average
Actual outcome
Moving average
17.9
47.6
54.2
41.2
123.8
119.5
14
57
52
54
147
144
5 donatelife.gov.auAustralian Donation and Transplantation Activity Report 2015
2015201420132012201120102009
0
10
20
30
40
50
60
pmp
0* 1 2 3 4 5 6 7 8 9 10 11 12 13 14 15 16 17 18 19 20 21 22 23 24
Year0
5
10
15
20
25
30
35
40
23
51
4
dpmp
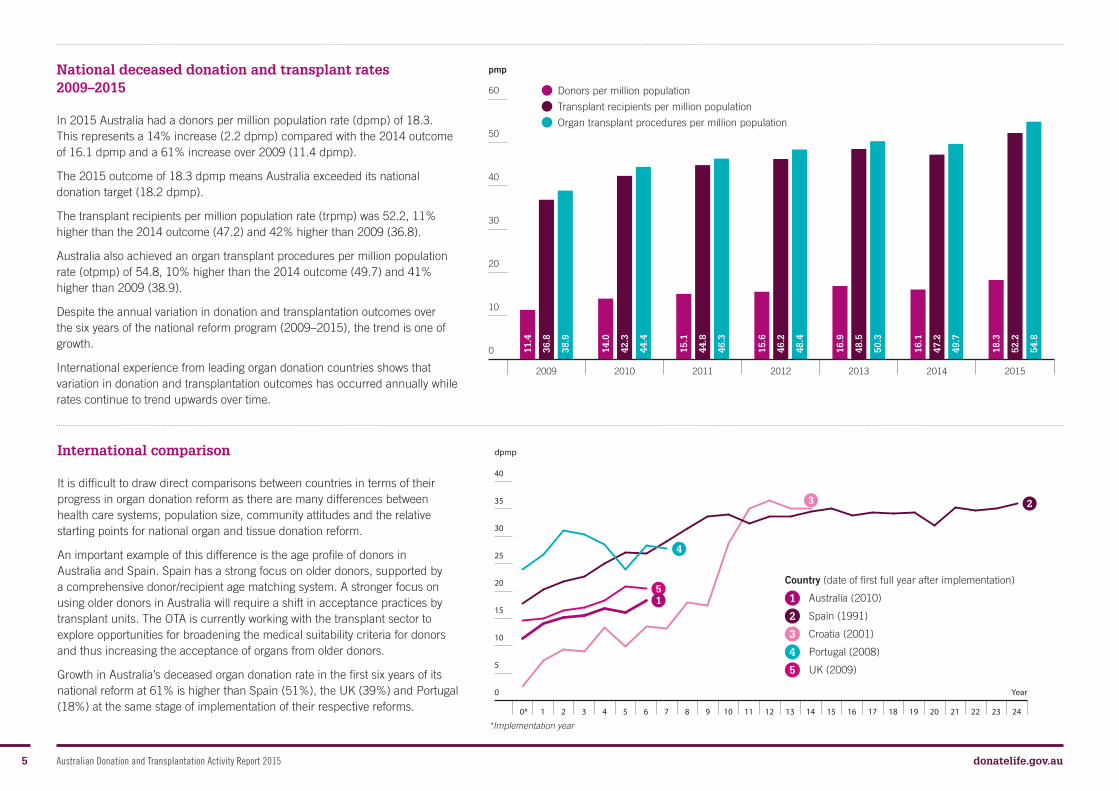
National deceased donation and transplant rates 2009–2015
In 2015 Australia had a donors per million population rate (dpmp) of 18.3. This represents a 14% increase (2.2 dpmp) compared with the 2014 outcome of 16.1 dpmp and a 61% increase over 2009 (11.4 dpmp).
The 2015 outcome of 18.3 dpmp means Australia exceeded its national donation target (18.2 dpmp).
The transplant recipients per million population rate (trpmp) was 52.2, 11% higher than the 2014 outcome (47.2) and 42% higher than 2009 (36.8).
Australia also achieved an organ transplant procedures per million population rate (otpmp) of 54.8, 10% higher than the 2014 outcome (49.7) and 41% higher than 2009 (38.9).
Despite the annual variation in donation and transplantation outcomes over the six years of the national reform program (2009–2015), the trend is one of growth.
International experience from leading organ donation countries shows that variation in donation and transplantation outcomes has occurred annually while rates continue to trend upwards over time.
International comparison
It is difficult to draw direct comparisons between countries in terms of their progress in organ donation reform as there are many differences between health care systems, population size, community attitudes and the relative starting points for national organ and tissue donation reform.
An important example of this difference is the age profile of donors in Australia and Spain. Spain has a strong focus on older donors, supported by a comprehensive donor/recipient age matching system. A stronger focus on using older donors in Australia will require a shift in acceptance practices by transplant units. The OTA is currently working with the transplant sector to explore opportunities for broadening the medical suitability criteria for donors and thus increasing the acceptance of organs from older donors.
Growth in Australia’s deceased organ donation rate in the first six years of its national reform at 61% is higher than Spain (51%), the UK (39%) and Portugal (18%) at the same stage of implementation of their respective reforms.
Donors per million population
Transplant recipients per million population
Organ transplant procedures per million population
Country (date of first full year after implementation)
1 Australia (2010)
2 Spain (1991)
3 Croatia (2001)
4 Portugal (2008)
5 UK (2009)
11.4
14.0
15.1
15.6
16.9
16.1
18.3
36.8
42.3
44.8
46.2
48.5
47.2
52.2
38.9
44.4
46.3
48.4
50.3
49.7
54.8
*Implementation year

6 donatelife.gov.auAustralian Donation and Transplantation Activity Report 2015
Jurisdictional donation rates 2009–2015
Jurisdictional outcomes in 2015 continued to demonstrate variation across states and territories, with annual donation rates ranging from 15.1 dpmp to 24.7 dpmp. New South Wales, Victoria, Queensland, South Australia, Western Australia and the Australian Capital Territory exceeded their 2014 outcomes for donation rates.
South Australia, Victoria and the Australian Capital Territory were national leaders in donation outcomes achieving donation rates over 21 dpmp. This indicates there is considerable potential for other jurisdictions to improve their donation performance.
NSW achieved strong growth in 2015 with the donation rate increasing from 12.6 dpmp in 2014 to 17.2 dpmp in 2015.
2015201420132012201120102009
0
5
10
15
20
25
30
35
dpmp
9.9
12.6
11.0
12.4
14.2
12.6
17.2
12.1
17.9
19.3
16.3
19.2
20.0
21.2
10.9
11.1
15.0
17.1
16.6
15.0
15.1
20.5
19.0
21.3
17.5
20.4
21.4
24.7
8.5
9.6
14.0
13.1
18.7
13.7
16.2
9.9
19.7
11.7
29.3
15.6
17.5
17.4
8.8
8.7
17.3
33.9
28.9
28.7
16.4
14.1
17.4
13.7
20.2
10.0
18.1
21.2
11.4
14.0
15.1
15.6
16.9
16.1
18.3
NSW
Victoria
Queensland
South Australia
Western Australia
Tasmania
Northern Territory
ACT
Australia
7 donatelife.gov.auAustralian Donation and Transplantation Activity Report 2015
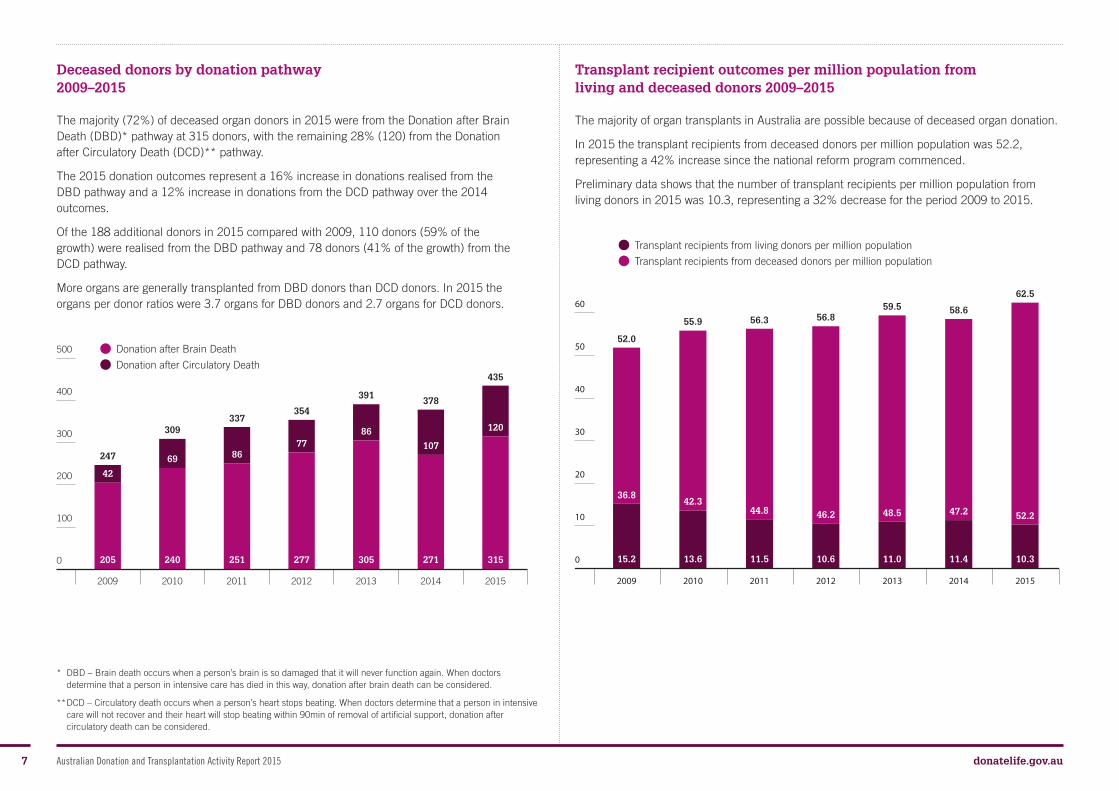
Deceased donors by donation pathway 2009–2015
The majority (72%) of deceased organ donors in 2015 were from the Donation after Brain Death (DBD)* pathway at 315 donors, with the remaining 28% (120) from the Donation after Circulatory Death (DCD)** pathway.
The 2015 donation outcomes represent a 16% increase in donations realised from the DBD pathway and a 12% increase in donations from the DCD pathway over the 2014 outcomes.
Of the 188 additional donors in 2015 compared with 2009, 110 donors (59% of the growth) were realised from the DBD pathway and 78 donors (41% of the growth) from the DCD pathway.
More organs are generally transplanted from DBD donors than DCD donors. In 2015 the organs per donor ratios were 3.7 organs for DBD donors and 2.7 organs for DCD donors.
Transplant recipient outcomes per million population from living and deceased donors 2009–2015
The majority of organ transplants in Australia are possible because of deceased organ donation.
In 2015 the transplant recipients from deceased donors per million population was 52.2, representing a 42% increase since the national reform program commenced.
Preliminary data shows that the number of transplant recipients per million population from living donors in 2015 was 10.3, representing a 32% decrease for the period 2009 to 2015.
* DBD – Brain death occurs when a person’s brain is so damaged that it will never function again. When doctors determine that a person in intensive care has died in this way, donation after brain death can be considered.
** DCD – Circulatory death occurs when a person’s heart stops beating. When doctors determine that a person in intensive care will not recover and their heart will stop beating within 90min of removal of artificial support, donation after circulatory death can be considered.
2009 2010 2011 2012 2013 2014 2015
0
100
200
300
400
500
205
42
240
69
251
86
277
77
305
86
271
107
315
120
Donation after Brain Death
Donation after Circulatory Death
Transplant recipients from living donors per million population
Transplant recipients from deceased donors per million population
2009 2010 2011 2012 2013 2014 2015
0
10
20
30
40
50
60
15.2 13.6 11.5 10.6 11.0 11.4 10.3
36.842.3
44.8 46.2 48.5 47.2 52.2
52.0
55.9 56.3 56.859.5 58.6
62.5
247
309337
354
391378
435
8 donatelife.gov.auAustralian Donation and Transplantation Activity Report 2015
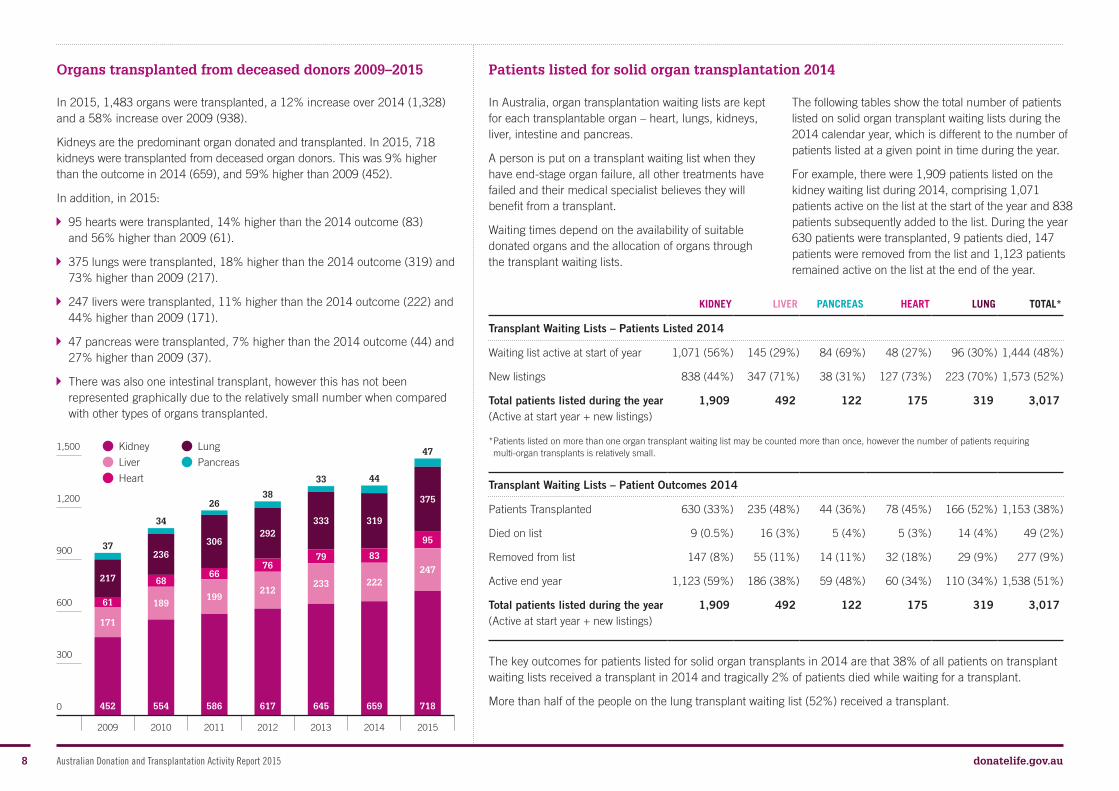
Organs transplanted from deceased donors 2009–2015
In 2015, 1,483 organs were transplanted, a 12% increase over 2014 (1,328) and a 58% increase over 2009 (938).
Kidneys are the predominant organ donated and transplanted. In 2015, 718 kidneys were transplanted from deceased organ donors. This was 9% higher than the outcome in 2014 (659), and 59% higher than 2009 (452).
In addition, in 2015:
95 hearts were transplanted, 14% higher than the 2014 outcome (83) and 56% higher than 2009 (61).
375 lungs were transplanted, 18% higher than the 2014 outcome (319) and 73% higher than 2009 (217).
247 livers were transplanted, 11% higher than the 2014 outcome (222) and 44% higher than 2009 (171).
47 pancreas were transplanted, 7% higher than the 2014 outcome (44) and 27% higher than 2009 (37).
There was also one intestinal transplant, however this has not been represented graphically due to the relatively small number when compared with other types of organs transplanted.
Patients listed for solid organ transplantation 2014
In Australia, organ transplantation waiting lists are kept for each transplantable organ – heart, lungs, kidneys, liver, intestine and pancreas.
A person is put on a transplant waiting list when they have end-stage organ failure, all other treatments have failed and their medical specialist believes they will benefit from a transplant.
Waiting times depend on the availability of suitable donated organs and the allocation of organs through the transplant waiting lists.
The following tables show the total number of patients listed on solid organ transplant waiting lists during the 2014 calendar year, which is different to the number of patients listed at a given point in time during the year.
For example, there were 1,909 patients listed on the kidney waiting list during 2014, comprising 1,071 patients active on the list at the start of the year and 838 patients subsequently added to the list. During the year 630 patients were transplanted, 9 patients died, 147 patients were removed from the list and 1,123 patients remained active on the list at the end of the year.
The key outcomes for patients listed for solid organ transplants in 2014 are that 38% of all patients on transplant waiting lists received a transplant in 2014 and tragically 2% of patients died while waiting for a transplant.
More than half of the people on the lung transplant waiting list (52%) received a transplant.
KIDNEY LIVER PANCREAS HEART LUNG TOTAL*
Transplant Waiting Lists – Patients Listed 2014
Waiting list active at start of year 1,071 (56%) 145 (29%) 84 (69%) 48 (27%) 96 (30%) 1,444 (48%)
New listings 838 (44%) 347 (71%) 38 (31%) 127 (73%) 223 (70%) 1,573 (52%)
Total patients listed during the year(Active at start year + new listings)
1,909 492 122 175 319 3,017
* Patients listed on more than one organ transplant waiting list may be counted more than once, however the number of patients requiring multi-organ transplants is relatively small.
Transplant Waiting Lists – Patient Outcomes 2014
Patients Transplanted 630 (33%) 235 (48%) 44 (36%) 78 (45%) 166 (52%) 1,153 (38%)
Died on list 9 (0.5%) 16 (3%) 5 (4%) 5 (3%) 14 (4%) 49 (2%)
Removed from list 147 (8%) 55 (11%) 14 (11%) 32 (18%) 29 (9%) 277 (9%)
Active end year 1,123 (59%) 186 (38%) 59 (48%) 60 (34%) 110 (34%) 1,538 (51%)
Total patients listed during the year(Active at start year + new listings)
1,909 492 122 175 319 3,017
2009 2010 2011 2012 201520142013
0
300
600
900
1,200
1,500 Kidney
Liver
Heart
Lung
Pancreas
37
34
2638
33 44
47
452 554 586 617 645 659 718
217
236306
292333 319
375
61
6866
7679 83
95
171
189199
212233 222
247
9 donatelife.gov.auAustralian Donation and Transplantation Activity Report 2015
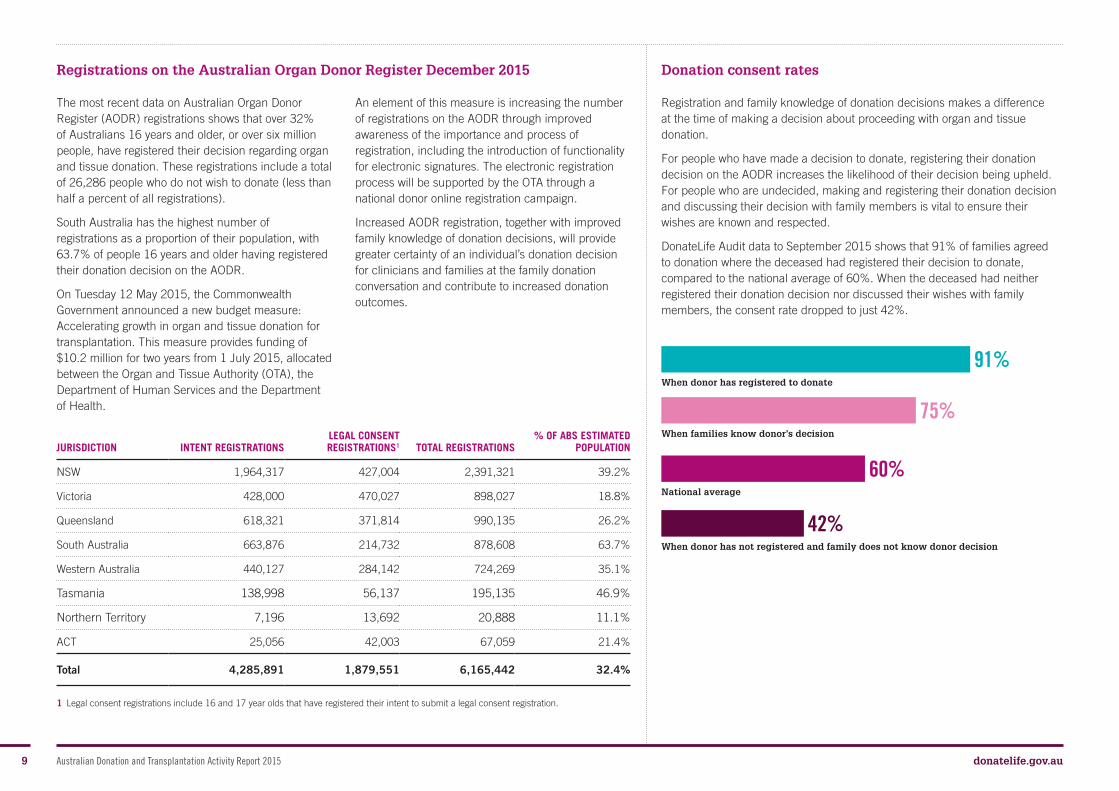
Registrations on the Australian Organ Donor Register December 2015
The most recent data on Australian Organ Donor Register (AODR) registrations shows that over 32% of Australians 16 years and older, or over six million people, have registered their decision regarding organ and tissue donation. These registrations include a total of 26,286 people who do not wish to donate (less than half a percent of all registrations).
South Australia has the highest number of registrations as a proportion of their population, with 63.7% of people 16 years and older having registered their donation decision on the AODR.
On Tuesday 12 May 2015, the Commonwealth Government announced a new budget measure: Accelerating growth in organ and tissue donation for transplantation. This measure provides funding of $10.2 million for two years from 1 July 2015, allocated between the Organ and Tissue Authority (OTA), the Department of Human Services and the Department of Health.
An element of this measure is increasing the number of registrations on the AODR through improved awareness of the importance and process of registration, including the introduction of functionality for electronic signatures. The electronic registration process will be supported by the OTA through a national donor online registration campaign.
Increased AODR registration, together with improved family knowledge of donation decisions, will provide greater certainty of an individual’s donation decision for clinicians and families at the family donation conversation and contribute to increased donation outcomes.
Donation consent rates
Registration and family knowledge of donation decisions makes a difference at the time of making a decision about proceeding with organ and tissue donation.
For people who have made a decision to donate, registering their donation decision on the AODR increases the likelihood of their decision being upheld. For people who are undecided, making and registering their donation decision and discussing their decision with family members is vital to ensure their wishes are known and respected.
DonateLife Audit data to September 2015 shows that 91% of families agreed to donation where the deceased had registered their decision to donate, compared to the national average of 60%. When the deceased had neither registered their donation decision nor discussed their wishes with family members, the consent rate dropped to just 42%.
100
JURISDICTION INTENT REGISTRATIONSLEGAL CONSENT REGISTRATIONS1 TOTAL REGISTRATIONS
% OF ABS ESTIMATED POPULATION
NSW 1,964,317 427,004 2,391,321 39.2%
Victoria 428,000 470,027 898,027 18.8%
Queensland 618,321 371,814 990,135 26.2%
South Australia 663,876 214,732 878,608 63.7%
Western Australia 440,127 284,142 724,269 35.1%
Tasmania 138,998 56,137 195,135 46.9%
Northern Territory 7,196 13,692 20,888 11.1%
ACT 25,056 42,003 67,059 21.4%
Total 4,285,891 1,879,551 6,165,442 32.4%
When donor has registered to donate
When families know donor’s decision
National average
When donor has not registered and family does not know donor decision
91%
75%
60%
42%
1 Legal consent registrations include 16 and 17 year olds that have registered their intent to submit a legal consent registration.
10 donatelife.gov.auAustralian Donation and Transplantation Activity Report 2015
2009
2010
2011
2012
2013
2014
2015
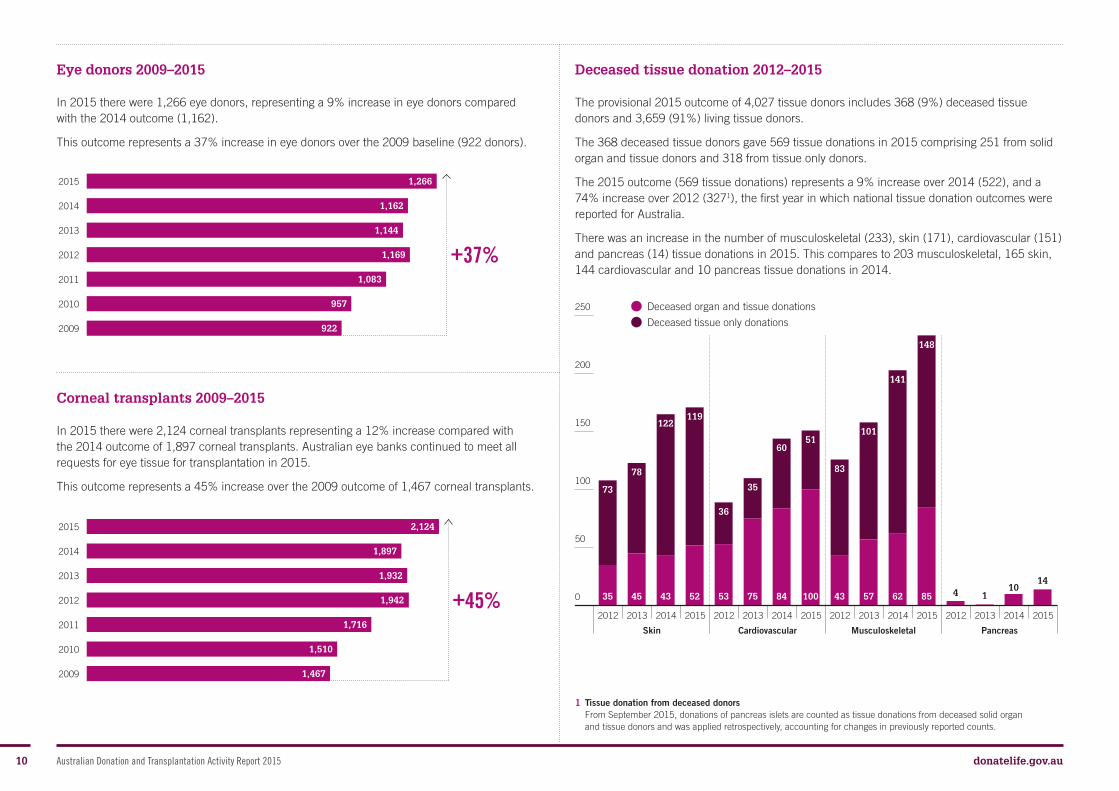
Eye donors 2009–2015
In 2015 there were 1,266 eye donors, representing a 9% increase in eye donors compared with the 2014 outcome (1,162).
This outcome represents a 37% increase in eye donors over the 2009 baseline (922 donors).
Corneal transplants 2009–2015
In 2015 there were 2,124 corneal transplants representing a 12% increase compared with the 2014 outcome of 1,897 corneal transplants. Australian eye banks continued to meet all requests for eye tissue for transplantation in 2015.
This outcome represents a 45% increase over the 2009 outcome of 1,467 corneal transplants.
Deceased tissue donation 2012–2015
The provisional 2015 outcome of 4,027 tissue donors includes 368 (9%) deceased tissue donors and 3,659 (91%) living tissue donors.
The 368 deceased tissue donors gave 569 tissue donations in 2015 comprising 251 from solid organ and tissue donors and 318 from tissue only donors.
The 2015 outcome (569 tissue donations) represents a 9% increase over 2014 (522), and a 74% increase over 2012 (3271), the first year in which national tissue donation outcomes were reported for Australia.
There was an increase in the number of musculoskeletal (233), skin (171), cardiovascular (151) and pancreas (14) tissue donations in 2015. This compares to 203 musculoskeletal, 165 skin, 144 cardiovascular and 10 pancreas tissue donations in 2014.
2009
2010
2011
2012
2013
2014
2015
2012 2013 2014 2015 2012 2013 2014 2015 2012 2013 2014 2015 2012 2013 2014 2015
Skin Cardiovascular Musculoskeletal Pancreas
0
50
100
150
200
250
1 Tissue donation from deceased donors From September 2015, donations of pancreas islets are counted as tissue donations from deceased solid organ and tissue donors and was applied retrospectively, accounting for changes in previously reported counts.
+37%
+45%
1,266
2,124
1,162
1,897
1,144
1,932
1,169
1,942
1,083
1,716
957
1,510
922
1,467
Deceased organ and tissue donations
Deceased tissue only donations
35 45 43 52 53 75 84 100 43 57 62 85 4 110
14
73
78
122119
36
35
6051
83
101
141
148

11 donatelife.gov.auAustralian Donation and Transplantation Activity Report 2015
Living tissue donation 2012–2015
The 3,659 living tissue donors in 2015 gave 3,698 tissue donations, predominantly from patients undergoing joint replacement surgery.
This outcome is comparable to 2014 (3,704), and is 1% higher than 2012 (3,652).
Notified tissue grafts transplanted 2013–2015
In 2015 there were 10,596 notified tissue grafts transplanted. Of these, 8,854 were musculoskeletal tissue, 213 were cardiovascular tissue, 1,515 were skin tissue and 14 were pancreas tissue transplants1.
This outcome represents a 17% increase compared to the 2014 outcome of 9,0812 notified tissue grafts transplanted and a 70% increase over 2013 (6,2492).
Notified tissue transplant recipients 2013–2015
In the same period, there were 6,421 notified tissue transplant recipients3, some recipients receiving multiple grafts. These included 6,107 recipients of musculoskeletal tissue, 212 recipients of cardiovascular tissue, 89 recipients of skin tissue and 13 recipients of pancreas tissue.
This outcome represents a 15% increase over the 2014 outcome of 5,5632 notified tissue transplant recipients and a 74% increase over 2013 (3,6922).
2013 2014 2015 2013 2014 2015 2013 2014 2015 2013 2014 2015
0
2,000
4,000
6,000
8,000
10,000
2013 2014 2015 2013 2014 2015 2013 2014 2015 2013 2014 2015
0
1,000
2,000
3,000
4,000
5,000
6,000
7,000
8,000
1 While the majority of tissue transplanted in Australia comes from Australian donors, tissue is imported in certain circumstances utilising the Therapeutic Goods Administration’s special access scheme.
2 Tissue transplantation from deceased tissue donors From September 2015, pancreas islets transplants and recipients are counted as tissue grafts transplanted and tissue transplant recipients. This was applied retrospectively, accounting for changes in previously reported counts.
3 For the purpose of national reporting a tissue transplant recipient is counted as a transplantation event.
2013
2014
2015
2012
3,683
3,687
3,784
3,652 0
20
17
15
Musculoskeletal Cardiovascular
Skin
Skin
Cardiovascular
Cardiovascular
Musculoskeletal
Musculoskeletal
Pancreas
Pancreas
793
89
166
166
1
1
1,515
89
213
212
14
13
1,379
103
204
203
10
10
5,289
3,436
7,488
5,247
8,854
6,107
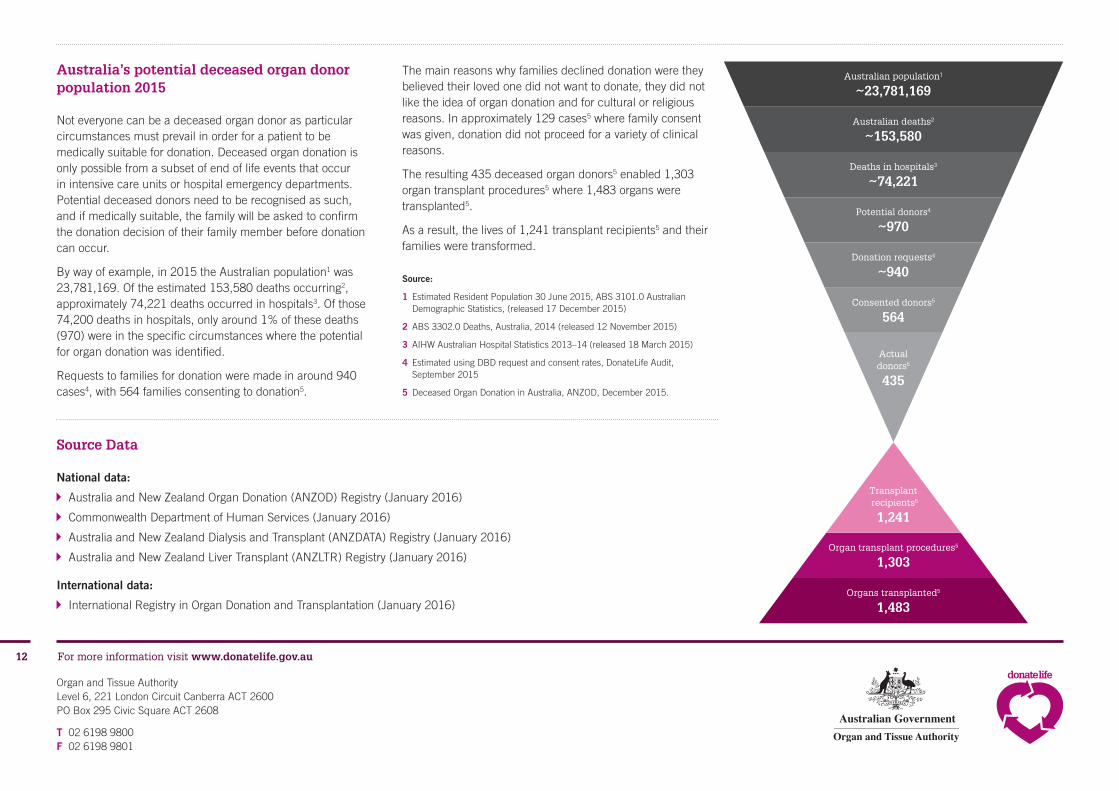
Australia’s potential deceased organ donor population 2015
Not everyone can be a deceased organ donor as particular circumstances must prevail in order for a patient to be medically suitable for donation. Deceased organ donation is only possible from a subset of end of life events that occur in intensive care units or hospital emergency departments. Potential deceased donors need to be recognised as such, and if medically suitable, the family will be asked to confirm the donation decision of their family member before donation can occur.
By way of example, in 2015 the Australian population1 was 23,781,169. Of the estimated 153,580 deaths occurring2, approximately 74,221 deaths occurred in hospitals3. Of those 74,200 deaths in hospitals, only around 1% of these deaths (970) were in the specific circumstances where the potential for organ donation was identified.
Requests to families for donation were made in around 940 cases4, with 564 families consenting to donation5.
The main reasons why families declined donation were they believed their loved one did not want to donate, they did not like the idea of organ donation and for cultural or religious reasons. In approximately 129 cases5 where family consent was given, donation did not proceed for a variety of clinical reasons.
The resulting 435 deceased organ donors5 enabled 1,303 organ transplant procedures5 where 1,483 organs were transplanted5.
As a result, the lives of 1,241 transplant recipients5 and their families were transformed.
Source Data
National data:
Australia and New Zealand Organ Donation (ANZOD) Registry (January 2016)
Commonwealth Department of Human Services (January 2016)
Australia and New Zealand Dialysis and Transplant (ANZDATA) Registry (January 2016)
Australia and New Zealand Liver Transplant (ANZLTR) Registry (January 2016)
International data:
International Registry in Organ Donation and Transplantation (January 2016)
Source:
1 Estimated Resident Population 30 June 2015, ABS 3101.0 Australian Demographic Statistics, (released 17 December 2015)
2 ABS 3302.0 Deaths, Australia, 2014 (released 12 November 2015)
3 AIHW Australian Hospital Statistics 2013–14 (released 18 March 2015)
4 Estimated using DBD request and consent rates, DonateLife Audit, September 2015
5 Deceased Organ Donation in Australia, ANZOD, December 2015.
Australian population1
~23,781,169
Australian deaths2
~153,580
Deaths in hospitals3
~74,221
Potential donors4
~970
Donation requests4
~940
Consented donors5
564
Actual donors5
435
Transplant recipients5
1,241
Organs transplanted5
1,483
Organ transplant procedures5
1,303
For more information visit www.donatelife.gov.au
Organ and Tissue Authority Level 6, 221 London Circuit Canberra ACT 2600 PO Box 295 Civic Square ACT 2608
T 02 6198 9800 F 02 6198 9801
12