Embed Size (px)
Citation preview

November 10, 2017
ICICI Securities Ltd | Retail Equity Research
Result Update
Strong growth across key geographies…
Revenues increased 18% YoY to | 4436 crore (I-direct estimate: |
4189 crore) mainly due to strong growth in the US and Europe. The
US revenue grew 21% YoY to | 2099 crore (I-direct estimate: | 1957
crore) mainly due to launched of limited competition product
Sevelamer carbonate (nephrology). Europe revenues grew 37% YoY
to | 1114 crore (I-direct estimate: | 997 crore).
EBITDA margins improved 58 bps YoY to 25.2% (I-direct estimates:
26.8%) mainly on account of higher gross margins
Net profit increased 29% YoY to | 782 crore (I-direct estimates: | 728
crore) mainly due to strong operational performance
US key growth driver despite imminent pricing pressure
After filing ANDA in the US in 2003, the company has come a long way as
current ANDA filings are at 463. The US revenue run rate has grown from
~US$100 million in 2009 to crossing $1 billion sales as on 2017. Note that
this was despite the USFDA embargo in FY12-13 on unit VI and unit III. In
rupee term, US sales have grown at 41% CAGR to | 6827 crore in FY13-
17. US formulations now constitute 45% of total turnover, up from 30% in
FY13. US traction has also boosted investor’s confidence, which was
affected by warning letters, piling debts besides non-business political
adversaries. We expect US sales to grow at 7% CAGR on a higher base to
| 8243 crore in FY17-20E.
Transformation, capacity optimisation to improve margins, cash flows
The API: formulations ratio has improved from 43:57 in FY13 to 20:80 in
FY17. Another USP of the company is its vertically integrated model with
huge capacity, unmatched by most peers. The company owns 22
manufacturing facilities, including eight key formulations facilities in India
and abroad. These can be optimised by 1) continuous US filings and
launches, 2) incremental launches and filings in the RoW markets and 3)
site transfers and supplies for products covered under the Actavis deal.
Higher capacity utilisation is likely to improve operating leverage thereby
maintaining the margin improvement trend.
Debt no more a fear factor
The company’s debts kept on piling over the last few years as the
capacity built up was in full flow and rupee depreciation. Working capital
loans are now 85% of overall debts from 65-70% earlier. However, with
consistent and incremental US cash flows the situation improved
markedly. While D/E ratio improved from 1.9x to 0.3x, the debt/EBITDA
improved from 4.5x to 0.9x in FY09-17. As the capex cycle moderates by
FY18, the company expects to utilise maximum FCF for debt repayment.
Injectable portfolio expanding but pricing pressure in orals to weigh
The Q2 numbers were a positive surprise on the European front. US sales
were also higher than expected due to solid growth in injectables
segment besides Sevelamer carbonate (gRenvela) windfall. Going
forward, we expect the injectable portfolio aggressive growth trend to
continue and contribute to ~23% of the US portfolio by FY20 from
current 14%. However prospects on the US oral solids business front
remain weak despite substantial pending pipe line as the macros on this
front continue to be challenging and no let-off is expected in the near
term. European business on the other hand is continuously delivering
better numbers. However the exposure to the US oral solid space (even
though waning) is likely to weigh on the stock in the near term. Our new
target price arrives at | 810, based on 18x FY20E EPS of | 45.
Rating matrix
Rating : Hold
Target : | 810
Target Period : 15-18 months
Potential Upside : 7%
What’s Changed?
Target Changed from | 755 to | 810
EPS FY18E Changed from | 46.8 to | 39.4
EPS FY19E Changed from | 41.4 to | 39.4
EPS FY20E Introduced at | 45.1
Rating Unchanged
Quarterly Performance
Q2FY18 Q2FY17 YoY (%) Q1FY18 QoQ (%)
Revenue 4,435.9 3,775.5 17.5 3,678.8 20.6
EBITDA 1,117.3 929.2 20.2 841.6 32.8
EBITDA (%) 25.2 24.6 57.6 22.9 231.1
Net Profit 781.6 605.6 29.1 518.5 50.7
Key Financials
(| Crore) FY17 FY18E FY19E FY20E
Revenues 15089.9 17007.2 17508.4 18845.9
EBITDA 3434.3 3974.8 3826.0 4161.7
Net Profit 2301.6 2606.5 2412.3 2626.0
Adjusted PAT 2265.7 2625.3 2412.3 2626.0
EPS (|) 39.4 44.8 41.4 45.1
Adjusted EPS (|) 38.8 45.1 41.4 45.1
Valuation summary
FY17 FY18E FY19E FY20E
PE (x) 19.2 16.9 18.3 16.8
Target PE (x) 20.6 18.1 19.6 18.0
EV to EBITDA (x) 13.6 11.8 12.1 10.9
Price to book (x) 4.7 3.7 3.1 2.7
RoNW (%) 24.2 22.3 17.2 16.0
RoCE (%) 24.4 23.8 19.8 19.2
Stock data
Particular
Market Capitalisation
Debt (FY16)
Cash (FY16)
EV
52 week H/L (|) 809/503
Equity capital
Face value | 1
| 58.6 crore
Amount
| 44351 crore
| 47320 crore
| 3084 crore
| 115 crore
Price performance (%)
1M 3M 6M 1Y
Aurobindo Pharma 2.7 10.2 22.2 -4.3
Sun Pharma 0.1 15.2 -17.4 -20.3
Lupin -21.3 -10.8 -33.2 -43.7
Dr Reddy's -2.5 20.9 -9.0 -27.8
Aurobindo Pharma (AURPHA) | 757
Research Analyst
Siddhant Khandekar
Mitesh Shah
Harshal Mehta

ICICI Securities Ltd | Retail Equity Research Page 2
Variance analysis
| cr Q2FY18 Q2FY18E Q2FY17 Q1FY18 YoY (%) QoQ (%) Comments
Revenue 4,435.9 4,188.7 3,775.5 3,678.8 17.5 20.6 YoY growth mainly due to robust growth in US, Europe and RoW markets
Raw Material Expenses 1,767.9 1,675.5 1,629.9 1,497.8 8.5 18.0 Gross margins improved 332 bps YoY mainly due to launch of limited
product Sevelamer in the US
Employee Expenses 518.7 490.7 426.6 490.2 21.6 5.8
Other Expenditure 1,031.9 900.6 789.8 849.2 30.7 21.5 YoY Increased mainly due to higher carriage, customer charges, settlement,
commissioning of new plant and acquisition
EBITDA 1,117.3 1,121.9 929.2 841.6 20.2 32.8
EBITDA (%) 25.2 26.8 24.6 22.9 58 bps 231 bps YoY improvement mainly due to higher gross margins.
Interest 17.3 15.4 17.5 16.9 -1.5 2.4
Depreciation 132.1 131.2 110.2 131.2 19.9 0.7 YoY increased due to consolidation of Generis group in Portugal and
commissioning of new plants in India
Other Income 10.3 21.0 8.3 33.3 24.0 -69.1
PBT before EO & Forex 978.2 996.2 809.8 726.8 20.8 34.6
Forex & EO 0.0 0.0 -20.2 18.8 -100.0 -100.0
PBT 978.2 996.2 829.9 708.0 17.9 38.2
Tax 198.0 268.8 224.0 191.0 -11.6 3.6
Tax Rate (%) 20.2 27.0 27.0 27.0 -675 bps -674 bps
PAT before MI 780.3 727.5 606.0 517.0 28.8 50.9
MI -0.2 -0.1 -0.1 -0.2 100.0 0.0
Net Profit 781.6 727.6 605.6 518.5 29.1 50.7
Adj. Net Profit (ex forex) 781.6 727.6 585.5 537.3 33.5 45.5 YoY increased mainly due to strong operational performance and lower
taxation
Key Metrics
US 2,098.9 1,956.5 1,735.1 1,694.9 21.0 23.8 YoY growth was mainly due to launch of Sevelamer and robust growth in
injectable segment. Injectable segment grew 21% YoY to US$ 46 million.
Beat vis-à-vis I-direct estimates mainly due to higher-than-expected sales in
Injectable segment
Europe 1,113.5 997.3 813.4 917.6 36.9 21.3 Excluding acquisition of Generis, European revenue grew 22% YoY. Beat vis-
à-vis I-direct estimates mainly due to higher-than-expected growth in most
of the key geographies
RoW 243.4 203.3 176.8 193.9 37.7 25.5
ARV 207.5 245.1 278.5 244.6 -25.5 -15.2
API 771.8 784.2 768.8 625.0 0.4 23.5
Source: Company, ICICIdirect.com Research
Change in estimates
(| Crore) Old New % Change Old New % Change
Revenue 16,253.4 17,007.2 4.6 16,990.2 17,508.4 3.1
EBITDA 4,143.7 3,974.8 -4.1 3,737.9 3,826.0 2.4
EBITDA Margin (%) 25.5 23.4 -213 bps 22.0 21.9 -15 bps
Adj. PAT 2,724.8 2,625.3 -3.7 2,411.3 2,412.3 0.0
EPS (|) 46.8 45.1 -3.7 41.4 41.4 0.1
FY18E FY19E
Source: Company, ICICIdirect.com Research
Assumptions
(| crore) FY16 FY17 FY18E FY19E FY18E FY19E
US 6,143.8 6,827.3 8,023.0 7,704.0 7,462.4 7,630.5 Increased mainly due to better-than-expected sales in Q2FY18 and strong injectable
segment growth
Europe 3,125.3 3,277.2 4,177.0 4,632.4 3,791.9 3,992.2 Increased mainly due to higher-than-expected growth in Q2FY18
ARV 1,199.9 1,185.3 953.3 1,001.0 1,171.0 1,229.6 Reduced mainly due to lower-than-expected 1H sales
RoW 646.0 755.7 879.9 1,011.9 839.9 965.8
API 2,883.9 3,042.0 2,966.3 3,150.6 2,978.7 3,163.2
Current Earlier
Source: Company, ICICIdirect.com Research

ICICI Securities Ltd | Retail Equity Research Page 3
Company Analysis
Aurobindo Pharma was set up by first generation entrepreneurs PV
Ramprasad Reddy and K Nithyananda Reddy in 1986. Based in
Hyderabad, the company is an integrated pharmaceutical company,
which started as an API manufacturer. In 2001, it moved up the value
chain by foraying into formulations while from 2007 onwards it started
scaling up the formulation business. APL's manufacturing facilities have
been approved by several leading regulatory agencies like USFDA,
UKMHRA, WHO, Health Canada, MCC South Africa, ANVISA Brazil. The
company owns 22 manufacturing facilities, including eight key
formulations facilities in India and abroad. The company owns three R&D
centres. The current employee strength is more than 8000, which
includes more than 750 scientists.
In FY17, the API: formulations ratio is at 20:80. US formulations constitute
45% of revenues followed by APIs & RoW formulations (25%), Europe
(22%) and ARV formulations (8%).
The company faced a USFDA embargo in 2011 for two of its units for
non-compliance with cGMP. It also went through political turmoil due to
the Telangana issue and alleged favours received by promoters through
political connections. Aurobindo acquired commercial operations in
seven Western European countries from Actavis. The company has
acquired personnel, commercial infrastructure, products, marketing
authorisation and dossier license rights in these seven countries. The
acquisition brought in a pipeline of ~1200 products from different
segments and an additional pipeline of over 200 products under its foray.
Net sales for acquired businesses were ~€320 million. GPMs were ~30%.
They were fetching losses of ~€23 million at the EBITDA level.
Aurobindo Pharma also acquired the Generis group in Portugal in
Q4FY17, through its step down subsidiary Agile Pharma (Netherlands) for
a consideration of ~€135 million (~| 985 crore). Generis’ CY16 revenues
were €64.8 million and EBITDA was €12.7 million.
The company also acquired the assets of nutritional supplement maker
Natrol Inc for a consideration of ~US$132.5 million. With this acquisition,
the company has forayed into the nutritional OTC business in the US and
other international markets. Overall, we expect revenues to grow at 8%
CAGR in FY17-20E to | 18846 crore on the back of Actavis consolidation
and incremental US launches.
Exhibit 1: Revenues to grow at CAGR of 8% in FY17-20E
5855.3
8099.9
12120.5
13831.2
15089.9
17007.217508.4
18845.9
0
2000
4000
6000
8000
10000
12000
14000
16000
18000
20000
FY13 FY14 FY15 FY16 FY17 FY18E FY19E FY20E
(|
crore)
Total Operating Income
Source: Company, ICICIdirect.com Research
26.7% CAGR
7.7% CAGR
ICICI Securities Ltd | Retail Equity Research Page 4
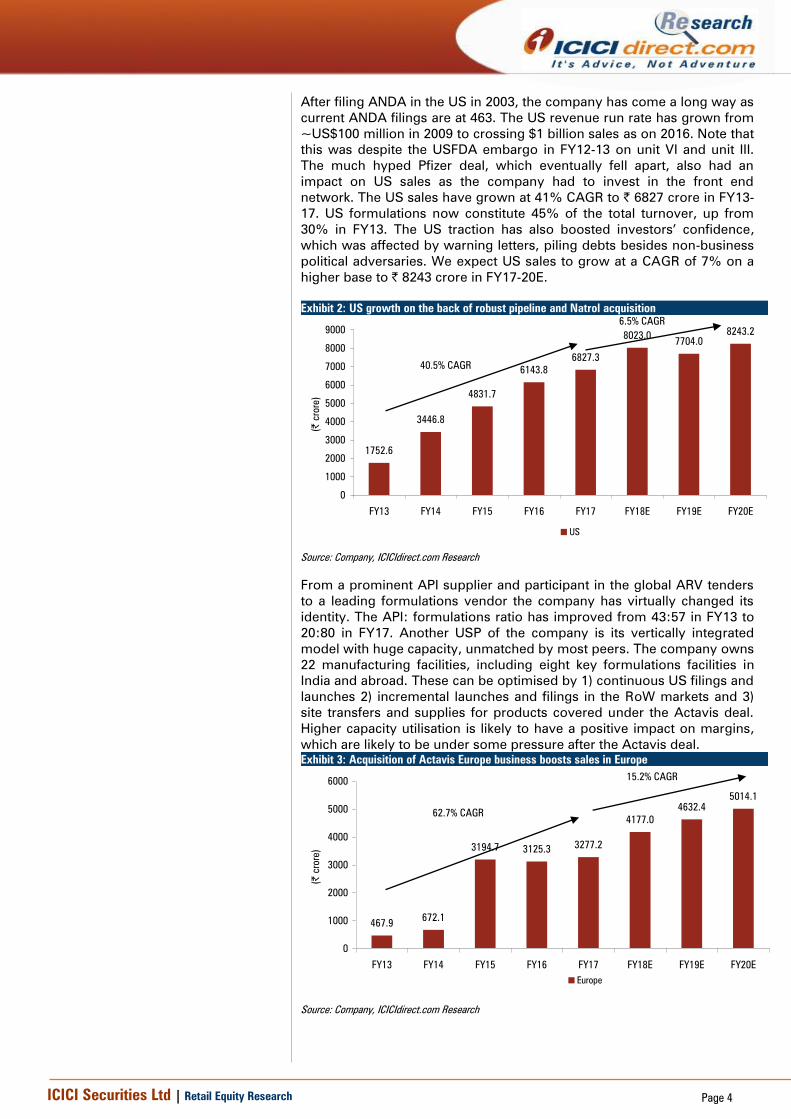
After filing ANDA in the US in 2003, the company has come a long way as
current ANDA filings are at 463. The US revenue run rate has grown from
~US$100 million in 2009 to crossing $1 billion sales as on 2016. Note that
this was despite the USFDA embargo in FY12-13 on unit VI and unit III.
The much hyped Pfizer deal, which eventually fell apart, also had an
impact on US sales as the company had to invest in the front end
network. The US sales have grown at 41% CAGR to | 6827 crore in FY13-
17. US formulations now constitute 45% of the total turnover, up from
30% in FY13. The US traction has also boosted investors’ confidence,
which was affected by warning letters, piling debts besides non-business
political adversaries. We expect US sales to grow at a CAGR of 7% on a
higher base to | 8243 crore in FY17-20E.
Exhibit 2: US growth on the back of robust pipeline and Natrol acquisition
1752.6
3446.8
4831.7
6143.8
6827.3
8023.07704.0
8243.2
0
1000
2000
3000
4000
5000
6000
7000
8000
9000
FY13 FY14 FY15 FY16 FY17 FY18E FY19E FY20E
(|
crore)
US
Source: Company, ICICIdirect.com Research
From a prominent API supplier and participant in the global ARV tenders
to a leading formulations vendor the company has virtually changed its
identity. The API: formulations ratio has improved from 43:57 in FY13 to
20:80 in FY17. Another USP of the company is its vertically integrated
model with huge capacity, unmatched by most peers. The company owns
22 manufacturing facilities, including eight key formulations facilities in
India and abroad. These can be optimised by 1) continuous US filings and
launches 2) incremental launches and filings in the RoW markets and 3)
site transfers and supplies for products covered under the Actavis deal.
Higher capacity utilisation is likely to have a positive impact on margins,
which are likely to be under some pressure after the Actavis deal.
Exhibit 3: Acquisition of Actavis Europe business boosts sales in Europe
467.9672.1
3194.7 3125.33277.2
4177.0
4632.4
5014.1
0
1000
2000
3000
4000
5000
6000
FY13 FY14 FY15 FY16 FY17 FY18E FY19E FY20E
(|
crore)
Europe
Source: Company, ICICIdirect.com Research
40.5% CAGR
6.5% CAGR
62.7% CAGR
15.2% CAGR

ICICI Securities Ltd | Retail Equity Research Page 5
Exhibit 4: Aurobindo to concentrate on high margins tender business
750.3
840.2
963.9
1199.9 1185.3
953.31001.0
1051.0
0
200
400
600
800
1000
1200
1400
FY13 FY14 FY15 FY16 FY17 FY18E FY19E FY20E
(|
crore)
ARV
Source: Company, ICICIdirect.com Research
Exhibit 5: API business to see muted growth due to higher captive consumption
2536.2
2828.92706.2
2883.93042.0
2966.3
3150.6
3366.1
0
1000
2000
3000
4000
FY13 FY14 FY15 FY16 FY17 FY18E FY19E FY20E
(|
crore)
Total API
Source: Company, ICICIdirect.com Research
Exhibit 6: Impact on margins due to acquisitions to be neutralised by US growth
889.2
2132.9
2563.6
3140.7
3434.3
3974.83826.0
4161.7
15.2
26.3
21.2
22.7 22.823.4
21.9
22.1
0
500
1000
1500
2000
2500
3000
3500
4000
4500
FY13 FY14 FY15 FY16 FY17 FY18E FY19E FY20E
(|
crore)
0
5
10
15
20
25
30
(%
)
Operating Profit (EBITDA) EBITDA Margins (%)
Source: Company, ICICIdirect.com Research
12.1% CAGR
-3.9% CAGR
4.7% CAGR
3.4% CAGR

ICICI Securities Ltd | Retail Equity Research Page 6
Exhibit 7: Net profit to grow at CAGR of 5% in FY17-20E
1575.8
2301.6
2606.5
2412.3
2626.0
293.9
1173.0
1915.6
0
500
1000
1500
2000
2500
3000
FY13 FY14 FY15 FY16 FY17 FY18E FY19E FY20E
(|
crore)
PAT
Source: Company, ICICIdirect.com Research
Exhibit 8: Trends in return ratios
10.9
23.8 24.123.1
24.4 23.8
19.8
17.6
36.7
30.4
27.2
22.3
19.2
24.2
17.2
16.0
0
5
10
15
20
25
30
35
40
FY13 FY14 FY15 FY16 FY17 FY18E FY19E FY20E
(%
)
RoCE (%) RoNW (%)
Source: Company, ICICIdirect.com Research
4.5% CAGR
67.3% CAGR

ICICI Securities Ltd | Retail Equity Research Page 7
Exhibit 9: Trends in quarterly financials
(| Crore) Q2FY15 Q3FY15 Q4FY15 Q1FY16 Q2FY16 Q3FY16 Q4FY16 Q1FY17 Q2FY17 Q3FY17 Q4FY17 Q1FY18 Q2FY18 YoY (%) QoQ(%)
Total Operating Income 2881.2 3166.2 3162.1 3298.9 3365.1 3505.6 3745.9 3766.6 3775.5 3906.2 3641.6 3678.8 4435.9 17.5 20.6
Raw Material Expenses 1264.7 1538.5 1373.6 1512.4 1512.1 1550.8 1625.9 1637.0 1629.9 1709.7 1502.8 1497.8 1767.9 8.5 18.0
% of revenue 43.9 48.6 43.4 45.8 44.9 44.2 43.4 43.5 43.2 43.8 41.3 40.7 39.9 -332 bps -86 bps
Gross Profit 1616.5 1627.6 1788.5 1786.6 1853.0 1954.8 2120.0 2129.6 2145.6 2196.5 2138.8 2180.9 2668.0 24.3 22.3
GPM (%) 56.1 51.4 56.6 54.2 55.1 55.8 56.6 56.5 56.8 56.2 58.7 59.3 60.1 332 bps 86 bps
Employee Expenses 337.0 368.0 373.3 361.2 373.0 401.6 406.8 432.1 426.6 445.6 463.5 490.2 518.7 21.6 5.8
% of revenue 11.7 11.6 11.8 10.9 11.1 11.5 10.9 11.5 11.3 11.4 12.7 13.3 11.7 39 bps -163 bps
Other Manufacturing Expenses642.4 647.4 759.1 700.3 700.9 735.5 852.1 808.6 789.8 856.0 954.1 849.2 1031.9 30.7 21.5
% revenues 22.3 20.4 24.0 21.2 20.8 21.0 22.7 21.5 20.9 21.9 26.2 23.1 23.3 234 bps 18 bps
Total Expenditure 2244.0 2554.0 2506.0 2573.9 2586.1 2687.9 2884.8 2877.6 2846.2 3011.3 2920.4 2837.2 3318.6 16.6 17.0
% of revenue 77.9 80.7 79.3 78.0 76.9 76.7 77.0 76.4 75.4 77.1 80.2 77.1 74.8 -58 bps -231 bps
EBITDA 637.2 612.2 656.1 725.1 779.0 817.7 861.1 889.0 929.2 894.8 721.2 841.6 1117.3 20.2 32.8
EBITDA Margins (%) 22.1 19.3 20.7 22.0 23.1 23.3 23.0 23.6 24.6 22.9 19.8 22.9 25.2 58 bps 231 bps
Depreciation 89.9 67.3 84.7 89.0 92.6 99.4 111.4 106.2 110.2 111.1 100.1 131.2 132.1 19.9 0.7
Interest 21.0 21.9 22.6 20.8 24.1 22.7 25.1 20.6 17.5 14.3 14.3 16.9 17.3 -1.5 2.4
Other Income 27.3 35.9 6.7 29.4 12.2 7.5 21.0 22.9 8.3 7.9 40.8 33.3 10.3 24.0 -69.1
Less: Forex & Exceptional Items42.0 20.2 -1.2 10.6 43.9 -14.0 -15.3 0.0 -20.2 -15.8 0.0 18.8 0.0
PBT 511.7 538.7 556.8 634.0 630.6 717.2 761.0 785.0 829.9 793.2 647.7 708.0 978.2 17.9 38.2
Total Tax 140.4 156.3 153.4 163.4 176.7 174.2 206.4 200.8 224.0 217.7 117.2 191.0 198.0 -11.6 3.6
Tax rate (%) 27.4 29.0 27.6 25.8 28.0 24.3 27.1 25.6 27.0 27.4 18.1 27.0 20.2 -675 bps -674 bps
PAT 371.2 382.4 403.4 470.6 453.9 543.0 554.6 584.2 606.0 575.5 530.5 517.0 780.3 28.8 50.9
Minority Interest -1.0 -2.0 -0.5 -1.9 -1.1 0.4 -0.3 -0.1 -0.1 -0.1 -0.2 -0.2 -0.2 100.0 0.0
Net Profit 372.2 384.4 403.8 472.5 455.0 542.6 554.9 584.2 606.0 575.6 530.8 517.2 780.5 28.8 50.9
EPS (|) 6.4 6.6 6.9 8.1 7.8 9.3 9.5 10.0 10.4 9.9 9.1 8.9 13.4
Source: Company, ICICIdirect.com Research
SWOT Analysis
Strengths - US product pipeline, huge capacity, vertically integrated
business model
Weakness - No presence in Indian domestic formulations, substantial debt
Opportunities - US generics space, foray into oncology
Industry specific threats- Increased USFDA scrutiny across the globe
regarding cGMP issues, pricing pressure due to client consolidation.
Conference call highlights
As per the management, the price erosion in the US oral solid
base business was at low double digits (10-12% YoY) in Q2FY18
and the scenario is likely to continue. Sequentially the price
erosion on the oral solid base business was ~5%
On the Sevelamer Carbonate launch front, the company has
communicated that 5-6 players have entered the market leading
to a price erosion of 70-80%
Aurobindo JV Eugia Pharma has filed 9 ANDAs with the USFDA
and 6 in the current quarter (potential size of $1.8 billion of the 6
filed ANDAs). The management expects the JV to file 7-8 ANDAs
each year. Revenues from the JV is expected post H1FY19
The management expects the Dolutegravir (HIV) sales (PEPFAR)
to commence from 1 April, 2018 and estimates US$40 million
sales annually
On the pneumococcal vaccine front, the company is in clinical
trials phase and expects 3-4 years for its launch
Aurobindo’s cumulative filings were at 463 ANDAs including 294
final approvals, 40 tentative approvals and 129 pending approvals.
During Q2FY18, the company filed 21 ANDAs with USFDA
including 11 in Oral and 10 in Injectable category. It has launched
8 products in US including 6 in Oral and 2 in Injectable category in
Q2FY18

ICICI Securities Ltd | Retail Equity Research Page 8
In Q2FY18, R&D spend was at | 161 crore, 3.6% of revenues. The
company expects R&D spending to be ~ 5% for FY18 and FY19
Capex spent during the quarter stood at US$53 million. The
management has guided for a capex of US$120-130 million
(excluding vaccine and biosimilar) in FY18
For FY18, the effective tax rate will remain in the range of 25-26%
On the M&A strategy, the company intends to focus on market
penetration (East Europe businesses on priority list) and newer
technologies
The company as on 30 September, 2017, has transferred
manufacturing of 74 products from Europe (Actavis) to India
On the debt front, the company reported net debt of US$ 616
million in Q2FY18, which is expected to be reduced to US$ 475
million by FY18 end
The company expects to file microsphere and liposomal
injectables from next year and also expects biosimilar drugs trial
to begin next year
Exhibit 10: Major facilities
Unit No. Segment Approvals Type Location
Aurolife Formulations USFDA Non antibiotic & Controlled substances USA
Unit-I API CVS, CNS, Anti-Allergics, Non-Sterile India
Unit-II API Intermediates for non antibiotics, Penems India
Unit-III Formulations USFDA Non antibiotics, ARVs / Orals India
Unit-IV Formulations USFDA Injectables (Non-antibiotics) & Ophthalmics India
Unit-V API Antibiotics (Sterile & Non-sterile) India
Unit-VI Formulations USFDA Cephalosporins Orals India
Unit-VII (SEZ) Formulations USFDA Oral dosage India
Unit-VIII API ARV, CVS, CNS (Non-sterile) India
Unit-IX API Intermediates India
Unit-X * Formulations Facilities under construction/development India
Unit-XI API India
Unit-XII Formulations USFDA Antibiotics, injectables, Orals India
Unit-XIV * Facilities under construction/development India
Unit-XV India
Unit-XVI * Facilities under construction/development India
Unit-XVII * Facilities under construction/development India
APLRC-I @ R&D Center Research and Development Centers India
APLRC-II @ R&D Center Research and Development Centers India
Bhiwadi Unit Formulations USFDA Penem Injecables India
Source: Company, ICICIdirect.com Research
Exhibit 11: US pipeline
Units Therapies Tentative Approvals Final Approvals Pending Total
Unit III Oral Formulations 14 102 10 126
Unit IV Injectables & Ophthalmics 2 42 45 89
Unit VIB Cephalosphorins Oral 11 11
Unit VII (SEZ) Oral Formulations 24 103 33 160
Unit X Oral Formulations 17 17
Unit XII Penicillin Oral & Injectables 19 1 20
Aurolife USA Oral Formulations 16 11 27
AuroNext Penem Injectables 1 3 4
Eugia Oral &Injectable Formulations 9 9
Total 40 294 129 463
Source: Company, ICICIdirect.com Research

ICICI Securities Ltd | Retail Equity Research Page 9
Valuation
The Q2 numbers were a positive surprise on the European front. US sales
were also higher than expected due to solid growth in injectables
segment besides Sevelamer carbonate (gRenvela) windfall. Going
forward, we expect the injectable portfolio aggressive growth trend to
continue and contribute to ~23% of the US portfolio by FY20 from
current 14%. However prospects on the US oral solids business front
remain weak despite substantial pending pipe line as the macros on this
front continue to be challenging and no let-off is expected in the near
term. European business on the other hand is continuously delivering
better numbers. However the exposure to the US oral solid space (even
though waning) is likely to weigh on the stock in the near term. Our new
target price arrives at | 810, based on 18x FY20E EPS of | 45.
Exhibit 12: One year forward PE
0.0
200.0
400.0
600.0
800.0
1000.011/10/20
11
5/10/201
2
11/10/20
12
5/10/201
3
11/10/20
13
5/10/201
4
11/10/20
14
5/10/201
5
11/10/20
15
5/10/201
6
11/10/20
16
5/10/201
7
11/10/20
17
|
Aurobindo 18.1x 15.1x 8.9x 5.8x
[
Source: Company, ICICIdirect.com Research
Exhibit 13: One year forward PE of company vs. CNX Pharma
0.00
5.00
10.00
15.00
20.00
25.00
30.00
35.00
40.00
45.00
11/10/20
11
5/10/201
2
11/10/20
12
5/10/201
3
11/10/20
13
5/10/201
4
11/10/20
14
5/10/201
5
11/10/20
15
5/10/201
6
11/10/20
16
5/10/201
7
11/10/20
17
x
Aurobindo CNX Pharma
20% Discount
Source: Company, ICICIdirect.com Research
Exhibit 14: Valuation
Revenues Growth Adj. EPS Growth P/E EV/EBITDA RoNW RoCE
(| crore) (%) (|) (%) (x) (X) (%) (%)
FY17 15090 9.1 39.4 14.3 19.2 13.6 24.2 24.4
FY18E 17007 12.7 44.8 15.9 16.9 11.8 22.3 23.8
FY19E 17508 2.9 41.4 -8.1 18.3 12.1 17.2 19.8
FY20E 18846 7.6 45.1 8.9 16.8 10.9 16.0 19.2
Source: Company, ICICIdirect.com Research

ICICI Securities Ltd | Retail Equity Research Page 10
Recommendation history vs. Consensus
0
200
400
600
800
1,000
1,200
Nov-17Aug-17Jun-17Apr-17Jan-17Nov-16Aug-16Jun-16Mar-16Jan-16Nov-15
(|
)
74.0
76.0
78.0
80.0
82.0
84.0
86.0
88.0
90.0
92.0
94.0
96.0
(%
)
Price Idirect target Consensus Target Mean % Consensus with BUY
Source: Reuters, Company, ICICIdirect.com Research
Key events
Date Event
Mar-10 Starts contract manufacturing business Aurolife
Sep-10 Signs an agreement with AstraZeneca to supply generic drugs for emerging markets
Jan-11 Sells stake in API unit of China for US$23 million
Feb-11 USFDA issues import alert for Unit VI
May-11 Redeems FCCB bonds
May-11 Receives warning letter for Unit VI & concerns on packing division of Unit III
Apr-12 CBI raids company premises
May-12 Ramprasad Reddy & Nithyananda Reddy step down from CEO and MD posts. Govindarajan appointed Managing Director
Mar-13 USFDA withdraws import alert for Unit VI
Jan-14 Acquires Actavis's Western European operations in 7 countries for ~EUR 30 million
Nov-14 Highest bidder for US nutritional supplement market Natrol with a bid of US$ 132.5 million
Dec-14 Acquires manufacturing assets, personnel, commercial infrastructure including the well established nutraceuticals brands in USA of Natrol along with an agreement
to take on certain liabilities, with a bid of $ 132.5 million
Feb-15 Gets approval for setting up JV with Tergene Biotech Pvt Ltd for development of Pneumococcal Conjugate Vaccine with a global market of more than US$5 billion.
The company holds majority stake in the JV
Feb-16 The USFDA inspects Unit III and Unit VII facilities of the company. Unit III was cleared without observations while unit VII received four 483 observations.
Jan-17 Acquires Portugal’s Generis Farmaceutica SA from Magnum Capital Partners for a consideration of €135 mn
Feb-17 Forays into biosimilars development through an acquisition of four products from TL Biopharmaceutical AG
Source: Company, ICICIdirect.com Research
Top 10 Shareholders Shareholding Pattern
Rank Investor Name Latest Filing Date % O/S Position (%) Position Change
1 RPR Sons Advisors Pvt. Ltd. 30-Sep-17 33.5 196.38m 0.00m
2 HDFC Asset Management Co., Ltd. 30-Jun-17 5.4 31.78m 6.84m
3 Reddy (Nityananda K) 30-Sep-17 4.3 25.36m 0.00m
4 Kambam (Kirthi Reddy) 30-Sep-17 3.5 20.70m 0.00m
5 Reddy (Ramaprasad P V) 30-Sep-17 3.1 18.00m 0.00m
6 Axis Clinicals, Ltd. 30-Sep-17 3.0 17.38m 0.00m
7 Sivakumaran (M) 30-Sep-17 2.5 14.49m 0.00m
8 SBI Funds Management Pvt. Ltd. 30-Sep-17 2.1 12.56m (0.97)m
9 Aditya Birla Sun Life AMC Limited 30-Sep-17 2.0 11.44m 0.57m
10 The Vanguard Group, Inc. 30-Sep-17 1.6 9.22m (0.08)m
(in %) Sep-16 Dec-16 Mar-17 Jun-17 Sep-17
Promoter 53.8 53.8 51.9 51.9 51.9
Others 46.2 46.2 48.1 48.1 48.1
Source: Reuters, ICICIdirect.com Research
Recent Activity
Investor name Value ($) Shares Investor name Value ($) Shares
HDFC Asset Management Co., Ltd. 72.5m 6.8m Reliance Nippon Life Asset Management Limited -22.5m -2.1m
ICICI Prudential Asset Management Co. Ltd. 17.5m 1.6m Macquarie Funds Management Hong Kong Ltd. -20.3m -1.9m
Kotak Mahindra Asset Management Company Ltd. 10.9m 1.0m Artisan Partners Limited Partnership -14.9m -1.4m
Aditya Birla Sun Life AMC Limited 6.1m 0.6m SBI Funds Management Pvt. Ltd. -10.2m -1.0m
FIL Investment Management (Singapore) Ltd. 5.4m 0.5m Lyxor Asset Management -8.3m -0.9m
Buys Sells
Source: Reuters, ICICIdirect.com Research

ICICI Securities Ltd | Retail Equity Research Page 11
.
Financial summary
Profit and loss statement | Crore
(Year-end March) FY17 FY18E FY19E FY20E
Revenues 15,089.9 17,007.2 17,508.4 18,845.9
Growth (%) 9.1 12.7 2.9 7.6
Raw Material Expenses 6,479.4 7,101.8 7,309.5 7,726.8
Employee Expenses 1,767.8 2,097.8 2,297.8 2,471.5
Other Manufacturing Expenses 3,408.5 3,832.8 4,075.1 4,485.8
Total Operating Expenditure 11,655.6 13,032.4 13,682.4 14,684.2
EBITDA 3,434.3 3,974.8 3,826.0 4,161.7
Growth (%) 9.3 15.7 -3.7 8.8
Interest 66.7 65.0 51.7 41.7
Depreciation 427.6 527.4 582.9 638.3
Other Income 79.9 64.1 24.1 18.9
PBT before Exceptional Items 3,019.8 3,446.5 3,215.6 3,500.6
Less: Forex & Exceptional Items -36.0 18.8 0.0 0.0
PBT 3,055.8 3,427.7 3,215.6 3,500.6
Total Tax 759.7 824.3 803.9 875.1
PAT before MI 2,296.2 2,603.4 2,411.7 2,625.4
Minority Interest -0.5 -0.6 -0.6 -0.6
PAT 2,301.6 2,606.5 2,412.3 2,626.0
Adjusted PAT 2,265.7 2,625.3 2,412.3 2,626.0
Growth (%) 14.3 15.9 -8.1 8.9
EPS (Diluted) 39.4 44.8 41.4 45.1
Source: Company, ICICIdirect.com Research
Cash flow statement | Crore
(Year-end March) FY17 FY18E FY19E FY20E
Profit/(Loss) after taxation 2,301.6 2,606.5 2,412.3 2,626.0
Add: Depreciation & Amortization 427.6 527.4 582.9 638.3
Net Increase in Current Assets 801.4 -1,218.8 -426.0 -838.3
Net Increase in Current Liabilities -102.4 411.3 187.3 335.6
CF from operating activities 3,428.3 2,326.4 2,756.4 2,761.8
(Purchase)/Sale of Fixed Assets -1,675.6 -1,628.6 -900.0 -900.0
(Inc)/dec in Investments -122.9 100.0 -1,000.0 -1,000.0
Others -102.5 -726.0 -45.9 -50.3
CF from investing activities -1,901.1 -2,254.6 -1,945.9 -1,950.3
Issue of Equity Shares 0.1 0.0 0.0 0.0
Inc / (Dec) in Debt -1,676.9 -280.0 -500.0 -500.0
Dividend & Dividend Tax -137.2 -189.9 -175.8 -191.4
others 0.0 0.0 0.0 0.0
CF from financing activities -1,814.0 -469.9 -675.8 -691.4
Net Cash flow -286.8 -398.2 134.8 120.1
Opening Cash 800.3 513.5 115.3 250.1
Closing Cash 513.5 115.3 250.1 370.2
Free Cash Flow 1,752.7 697.7 1,856.4 1,861.8
Source: Company, ICICIdirect.com Research
Balance sheet | Crore
(Year-end March) FY17 FY18E FY19E FY20E
Equity Capital 58.6 58.6 58.6 58.6
Reserve and Surplus 9,313.3 11,729.9 13,966.4 16,401.1
Total Shareholders funds 9,371.9 11,788.5 14,025.0 16,459.6
Total Debt 3,364.1 3,084.1 2,584.1 2,084.1
Deferred Tax Liability 49.3 54.2 60.7 68.0
Minority Interest 2.1 2.3 2.6 2.9
Long term Provisions 22.4 24.7 27.6 30.9
Source of Funds 12,809.8 14,953.8 16,700.0 18,645.6
Gross Block - Fixed Assets 4,799.8 5,595.5 6,245.5 6,895.5
Accumulated Depreciation 716.8 1,160.0 1,654.8 2,201.0
Net Block 4,083.1 4,435.5 4,590.8 4,694.5
Capital WIP 1,237.4 1,437.4 1,637.4 1,837.4
Net Fixed Assets 5,320.4 5,872.9 6,228.1 6,531.9
Total Intangible Assets 565.2 1,113.9 1,075.8 1,033.7
Goodwill on Consolidation 406.3 1089.11 1089.11 1089.11
Investments 245.9 145.9 1,145.9 2,145.9
Inventory 4,330.5 4,880.8 5,024.6 5,408.5
Cash 513.5 115.3 250.1 370.2
Debtors 2,765.3 3,116.7 3,208.6 3,453.7
Loans & Advances & Other CA 1,596.8 1,914.0 2,104.3 2,313.6
Total Current Assets 9,206.2 10,026.8 10,587.6 11,546.0
Creditors 2,488.3 2,804.4 2,887.1 3,107.6
Provisions & Other CL 951.3 1,046.4 1,151.1 1,266.2
Total Current Liabilities 3,439.6 3,850.9 4,038.2 4,373.8
Net Current Assets 5,766.6 6,175.9 6,549.4 7,172.2
LT L& A, Other Assets 337.8 371.5 408.7 449.6
Deferred Tax Assets 167.8 184.5 203.0 223.3
Application of Funds 12,809.8 14,953.8 16,700.0 18,645.6
Source: Company, ICICIdirect.com Research
Key ratios
(Year-end March) FY17 FY18E FY19E FY20E
Per share data (|)
Adjusted EPS (Diluted) 38.8 45.1 41.4 45.1
BV per share 160.5 202.5 240.9 282.7
Dividend per share 2.3 3.3 3.0 3.3
Cash Per Share 8.8 2.0 4.3 6.4
Operating Ratios (%)
Gross Profit Margins 57.1 58.2 58.3 59.0
EBITDA margins 22.8 23.4 21.9 22.1
Net Profit margins 15.0 15.4 13.8 13.9
Inventory days 104.7 104.7 104.7 104.7
Debtor days 66.9 66.9 66.9 66.9
Creditor days 60.2 60.2 60.2 60.2
Asset Turnover 1.2 1.2 1.1 1.0
EBITDA Conversion Rate 99.8 58.5 72.0 66.4
Return Ratios (%)
RoE 24.2 22.3 17.2 16.0
RoCE 24.4 23.8 19.8 19.2
RoIC 28.8 27.0 22.9 22.4
Valuation Ratios (x)
P/E 19.2 16.9 18.3 16.8
EV / EBITDA 13.6 11.8 12.1 10.9
EV / Net Sales 3.1 2.8 2.6 2.4
Market Cap / Sales 2.9 2.6 2.5 2.3
Price to Book Value 4.7 3.7 3.1 2.7
Solvency Ratios
Debt / Equity 0.4 0.3 0.2 0.1
Debt / EBITDA 1.0 0.8 0.7 0.5
Current Ratio 2.5 2.6 2.6 2.6
Source: Company, ICICIdirect.com Research

ICICI Securities Ltd | Retail Equity Research Page 12
ICICIdirect.com coverage universe (Healthcare)
Company I-Direct CMP TP Rating M Cap
Code (|) (|) (| Cr) FY16 FY17E FY18E FY19E FY16 FY17E FY18E FY19E FY16 FY17E FY18E FY19E FY16 FY17E FY18E FY19E
Ajanta Pharma AJAPHA 1212 1,300 Hold 10667.4 47.0 57.4 49.3 61.5 25.8 21.1 24.6 19.7 46.0 42.3 30.9 30.2 36.7 33.7 23.8 24.3
Alembic Pharma ALEMPHA 514 530 Hold 9690.7 38.2 21.2 20.4 25.3 13.5 24.3 25.1 20.3 52.2 25.3 18.9 20.8 45.1 21.0 17.5 18.6
Apollo Hospitals APOHOS 1002 1,180 Hold 13933.4 13.2 15.9 6.9 19.5 75.9 63.1 145.8 51.4 6.6 6.0 5.8 8.9 5.3 6.0 2.5 6.7
Aurobindo Pharma AURPHA 757 810 Hold 44351.3 33.9 38.8 45.1 41.4 22.3 19.5 16.8 18.3 23.1 24.4 23.8 19.8 27.2 24.2 22.3 17.2
Biocon BIOCON 392 380 Hold 23520.0 5.2 8.5 8.2 11.7 74.7 46.2 48.1 33.5 6.5 9.6 10.3 14.1 7.8 10.5 9.4 12.2
Cadila Healthcare CADHEA 465 440 Hold 47604.0 15.0 14.5 19.4 22.8 31.1 32.0 24.0 20.4 24.9 13.1 17.3 19.8 34.4 21.4 23.5 22.9
Cipla CIPLA 617 650 Hold 49649.5 18.5 12.5 22.0 27.2 33.4 49.2 28.0 22.7 11.8 7.7 13.1 14.6 12.9 8.0 12.7 13.9
Divi's Lab DIVLAB 1026 1,090 Hold 27230.4 42.4 39.9 34.6 43.1 24.2 25.7 29.6 23.8 31.6 25.3 20.1 22.1 26.2 19.8 15.4 16.9
Dr Reddy's Labs DRREDD 2350 2,520 Hold 38968.2 125.0 78.0 63.5 94.0 18.8 30.1 37.0 25.0 15.3 7.3 6.5 9.4 17.0 10.5 8.0 10.8
Glenmark Pharma GLEPHA 587 670 Hold 16567.5 26.4 42.2 34.7 36.6 22.2 13.9 16.9 16.1 15.7 19.5 16.0 15.9 20.5 26.5 18.1 16.2
Indoco Remedies INDREM 259 250 Hold 2387.2 9.4 8.4 5.3 12.5 27.6 31.0 49.0 20.7 12.9 8.7 6.1 11.4 14.8 11.8 7.1 14.8
Ipca Laboratories IPCLAB 561 410 Hold 7076.4 7.4 15.4 12.4 25.5 76.0 36.4 45.2 22.0 4.5 8.7 6.9 12.5 4.1 7.9 6.1 11.3
Jubilant Life JUBLIF 634 815 Buy 10100.8 24.6 36.1 40.5 54.0 25.8 17.5 15.7 11.7 11.8 13.8 13.5 16.0 13.2 16.8 16.0 17.8
Lupin LUPIN 835 890 Hold 37723.4 50.4 56.7 35.5 38.5 16.6 14.7 23.5 21.7 17.8 16.6 11.0 12.0 20.3 19.0 10.8 10.7
Natco Pharma NATPHA 906 1,190 Buy 15800.1 8.9 27.9 48.0 64.4 102.1 32.5 18.9 14.1 15.7 33.6 43.6 44.8 11.9 29.5 36.7 35.6
Sun Pharma SUNPHA 527 445 Hold 126548.3 23.4 29.0 14.6 19.8 22.5 18.2 36.2 26.7 18.6 19.8 9.7 12.2 18.0 19.0 9.0 11.1
Syngene Int. SYNINT 504 580 Buy 10081.0 12.0 14.4 16.0 20.4 42.6 35.7 32.2 25.1 15.3 16.8 18.6 20.9 23.5 20.3 18.8 19.5
Torrent Pharma TORPHA 1222 1,365 Hold 20683.3 110.9 55.2 53.3 66.5 11.0 22.2 23.0 18.4 46.5 18.9 19.3 20.7 53.7 21.5 17.9 19.2
RoE (%)EPS (|) PE(x) RoCE (%)
Source: Company, ICICIdirect.com Research
ICICI Securities Ltd | Retail Equity Research Page 13
RATING RATIONALE
ICICIdirect.com endeavours to provide objective opinions and recommendations. ICICIdirect.com assigns
ratings to its stocks according to their notional target price vs. current market price and then categorises them
as Strong Buy, Buy, Hold and Sell. The performance horizon is two years unless specified and the notional
target price is defined as the analysts' valuation for a stock.
Strong Buy: >15%/20% for large caps/midcaps, respectively, with high conviction;
Buy: >10%/15% for large caps/midcaps, respectively;
Hold: Up to +/-10%;
Sell: -10% or more;
Pankaj Pandey Head – Research [email protected]
ICICIdirect.com Research Desk,
ICICI Securities Limited,
1st Floor, Akruti Trade Centre,
Road No 7, MIDC,
Andheri (East)
Mumbai – 400 093

ICICI Securities Ltd | Retail Equity Research Page 14
ANALYST CERTIFICATION
We /I, Siddhant Khandekar CA-INTER, Mitesh Shah MS (Finance) Harshal Mehta M. Tech (Biotechnology) Research Analysts, authors and the names subscribed to this report, hereby certify that all of the
views expressed in this research report accurately reflect our views about the subject issuer(s) or securities. We also certi fy that no part of our compensation was, is, or will be directly or indirectly related
to the specific recommendation(s) or view(s) in this report.
Terms & conditions and other disclosures:
ICICI Securities Limited (ICICI Securities) is a full-service, integrated investment banking and is, inter alia, engaged in the business of stock brokering and distribution of financial products. ICICI Securities
Limited is a Sebi registered Research Analyst with Sebi Registration Number – INH000000990. ICICI Securities is a wholly-owned subsidiary of ICICI Bank which is India’s largest private sector bank and has
its various subsidiaries engaged in businesses of housing finance, asset management, life insurance, general insurance, venture capital fund management, etc. (“associates”), the details in respect of which
are available on www.icicibank.com.
ICICI Securities is one of the leading merchant bankers/ underwriters of securities and participate in virtually all securities trading markets in India. We and our associates might have investment banking
and other business relationship with a significant percentage of companies covered by our Investment Research Department. ICICI Securities generally prohibits its analysts, persons reporting to analysts
and their relatives from maintaining a financial interest in the securities or derivatives of any companies that the analysts cover.
The information and opinions in this report have been prepared by ICICI Securities and are subject to change without any notice. The report and information contained herein is strictly confidential and
meant solely for the selected recipient and may not be altered in any way, transmitted to, copied or distributed, in part or in whole, to any other person or to the media or reproduced in any form, without
prior written consent of ICICI Securities. While we would endeavour to update the information herein on a reasonable basis, ICICI Securities is under no obligation to update or keep the information current.
Also, there may be regulatory, compliance or other reasons that may prevent ICICI Securities from doing so. Non-rated securities indicate that rating on a particular security has been suspended
temporarily and such suspension is in compliance with applicable regulations and/or ICICI Securities policies, in circumstances where ICICI Securities might be acting in an advisory capacity to this
company, or in certain other circumstances.
This report is based on information obtained from public sources and sources believed to be reliable, but no independent verification has been made nor is its accuracy or completeness guaranteed. This
report and information herein is solely for informational purpose and shall not be used or considered as an offer document or solicitation of offer to buy or sell or subscribe for securities or other financial
instruments. Though disseminated to all the customers simultaneously, not all customers may receive this report at the same time. ICICI Securities will not treat recipients as customers by virtue of their
receiving this report. Nothing in this report constitutes investment, legal, accounting and tax advice or a representation that any investment or strategy is suitable or appropriate to your specific
circumstances. The securities discussed and opinions expressed in this report may not be suitable for all investors, who must make their own investment decisions, based on their own investment
objectives, financial positions and needs of specific recipient. This may not be taken in substitution for the exercise of independent judgment by any recipient. The recipient should independently evaluate
the investment risks. The value and return on investment may vary because of changes in interest rates, foreign exchange rates or any other reason. ICICI Securities accepts no liabilities whatsoever for any
loss or damage of any kind arising out of the use of this report. Past performance is not necessarily a guide to future performance. Investors are advised to see Risk Disclosure Document to understand the
risks associated before investing in the securities markets. Actual results may differ materially from those set forth in projections. Forward-looking statements are not predictions and may be subject to
change without notice.
ICICI Securities or its associates might have managed or co-managed public offering of securities for the subject company or might have been mandated by the subject company for any other assignment
in the past twelve months.
ICICI Securities or its associates might have received any compensation from the companies mentioned in the report during the period preceding twelve months from the date of this report for services in
respect of managing or co-managing public offerings, corporate finance, investment banking or merchant banking, brokerage services or other advisory service in a merger or specific transaction.
ICICI Securities or its associates might have received any compensation for products or services other than investment banking or merchant banking or brokerage services from the companies mentioned
in the report in the past twelve months.
ICICI Securities encourages independence in research report preparation and strives to minimize conflict in preparation of research report. ICICI Securities or its associates or its analysts did not receive any
compensation or other benefits from the companies mentioned in the report or third party in connection with preparation of the research report. Accordingly, neither ICICI Securities nor Research Analysts
and their relatives have any material conflict of interest at the time of publication of this report.
It is confirmed that Siddhant Khandekar CA-INTER, Mitesh Shah MS (Finance) Harshal Mehta MTech (Biotechnology) Research Analysts of this report have not received any compensation from the
companies mentioned in the report in the preceding twelve months.
Compensation of our Research Analysts is not based on any specific merchant banking, investment banking or brokerage service transactions.
ICICI Securities or its subsidiaries collectively or Research Analysts or their relatives do not own 1% or more of the equity securities of the Company mentioned in the report as of the last day of the month
preceding the publication of the research report.
Since associates of ICICI Securities are engaged in various financial service businesses, they might have financial interests or beneficial ownership in various companies including the subject
company/companies mentioned in this report.
It is confirmed that Siddhant Khandekar CA-INTER, Mitesh Shah MS (Finance) Harshal Mehta MTech (Biotechnology) Research Analysts do not serve as an officer, director or employee of the companies
mentioned in the report.
ICICI Securities may have issued other reports that are inconsistent with and reach different conclusion from the information presented in this report.
Neither the Research Analysts nor ICICI Securities have been engaged in market making activity for the companies mentioned in the report.
We submit that no material disciplinary action has been taken on ICICI Securities by any Regulatory Authority impacting Equity Research Analysis activities.
This report is not directed or intended for distribution to, or use by, any person or entity who is a citizen or resident of or located in any locality, state, country or other jurisdiction, where such distribution,
publication, availability or use would be contrary to law, regulation or which would subject ICICI Securities and affiliates to any registration or licensing requirement within such jurisdiction. The securities
described herein may or may not be eligible for sale in all jurisdictions or to certain category of investors. Persons in whose possession this document may come are required to inform themselves of and
to observe such restriction.
report and information herein is solely for informational purpose and shall not be used or considered as an offer document or solicitation of offer to buy or sell or subscribe for securities or other financial
instruments. Though disseminated to all the customers simultaneously, not all customers may receive this report at the same time. ICICI Securities will not treat recipients as customers by virtue of their
receiving this report. Nothing in this report constitutes investment, legal, accounting and tax advice or a representation that any investment or strategy is suitable or appropriate to your specific
circumstances. The securities discussed and opinions expressed in this report may not be suitable for all investors, who must make their own investment decisions, based on their own investment
objectives, financial positions and needs of specific recipient. This may not be taken in substitution for the exercise of independent judgment by any recipient. The recipient should independently evaluate
the investment risks. The value and return on investment may vary because of changes in interest rates, foreign exchange rates or any other reason. ICICI Securities accepts no liabilities whatsoever for any
loss or damage of any kind arising out of the use of this report. Past performance is not necessarily a guide to future performance. Investors are advised to see Risk Disclosure Document to understand the
risks associated before investing in the securities markets. Actual results may differ materially from those set forth in projections. Forward-looking statements are not predictions and may be subject to
change without notice.
ICICI Securities or its associates might have managed or co-managed public offering of securities for the subject company or might have been mandated by the subject company for any other assignment
in the past twelve months.
ICICI Securities or its associates might have received any compensation from the companies mentioned in the report during the period preceding twelve months from the date of this report for services in
respect of managing or co-managing public offerings, corporate finance, investment banking or merchant banking, brokerage services or other advisory service in a merger or specific transaction.
ICICI Securities or its associates might have received any compensation for products or services other than investment banking or merchant banking or brokerage services from the companies mentioned
in the report in the past twelve months.
ICICI Securities encourages independence in research report preparation and strives to minimize conflict in preparation of research report. ICICI Securities or its analysts did not receive any compensation
or other benefits from the companies mentioned in the report or third party in connection with preparation of the research report. Accordingly, neither ICICI Securities nor Research Analysts have any
material conflict of interest at the time of publication of this report.
It is confirmed that Siddhant Khandekar CA-INTER Mitesh Shah MS (Finance), Harshal Mehta MTech (Biotechnology) Research Analysts of this report have not received any compensation from the
companies mentioned in the report in the preceding twelve months.
Compensation of our Research Analysts is not based on any specific merchant banking, investment banking or brokerage service transactions.


![GSV Publications requiring copyright permission Publications requiring copyright permission: 4 GSV Library 929.2 CANE CAN 67. Canty, Wendy. All the shades of Gray. [Photocopy] GSV](https://img.dokumen.tips/doc/110x75/5aa7f75b7f8b9a54748cb5e9/gsv-publications-requiring-copyright-permission-publications-requiring-copyright.jpg)