Embed Size (px)
Citation preview

NYSE: DVNdevonenergy.com
Investor Presentation
August 2015

Investor Contacts & Notices
Investor Relations Contacts
Howard J. Thill, Senior Vice President, Communications & Investor Relations(405) 552‐3693 / [email protected]
Scott Coody, Director, Investor Relations(405) 552‐4735 / [email protected]
Shea Snyder, Director, Investor Communications(405) 552‐4782 / [email protected]
Safe HarborSome of the information provided in this presentation includes “forward‐looking statements” as defined by the Securities and Exchange Commission. Words such as “forecasts," "projections," "estimates," "plans," "expectations," "targets," and other comparable terminology often identify forward‐looking statements. Such statements concerning future performance are subject to a variety of risks and uncertainties that could cause Devon’s actual results to differ materially from the forward‐looking statements contained herein, including as a result of the items described under "Risk Factors" in our most recent Form 10‐K; and the items described under "Information Regarding Forward‐Looking Estimates" in our Form 8‐K furnished August 4, 2015.
Cautionary Note to Investors The United States Securities and Exchange Commission permits oil and gas companies, in their filings with the SEC, to disclose only proved, probable and possible reserves that meet the SEC's definitions for such terms, and price and cost sensitivities for such reserves, and prohibits disclosure of resources that do not constitute such reserves. This presentation may contain certain terms, such as resource potential and exploration target size. These estimates are by their nature more speculative than estimates of proved, probable and possible reserves and accordingly are subject to substantially greater risk of being actually realized. The SEC guidelines strictly prohibit us from including these estimates in filings with the SEC. Investors are urged to consider closely the disclosure in our Form 10‐K, available from us at Devon Energy Corporation, Attn. Investor Relations, 333 West Sheridan, Oklahoma City, OK 73102‐5015. You can also obtain this form from the SEC by calling 1‐800‐SEC‐0330 or from the SEC’s website at www.sec.gov.
2

Devon TodayA Leading North American E&P
3
Premier asset portfolio
Platform for sustainable growth
Delivering superior execution
Advantaged capital structure
Disciplined capital allocation

Premier Asset Portfolio
4
Positioned in top‐tier basins
— Leading Delaware Basin operator
— Prolific Eagle Ford assets
— High‐quality Anadarko Basin position
— World‐class heavy oil projects
Significant operational momentum
— Delivering top‐tier well productivity
— Achieving efficiencies
— Improving cost structure
Heavy Oil
Rockies Oil
Barnett Shale
Eagle Ford
Delaware Basin
Anadarko Basin
Oil Assets
Liquids‐Rich Gas Assets

Delaware BasinOverview
5
Industry leader in basin
— Net risked acres: 585,000 — Q2 net production: 64 MBOED (65% oil)— Delivering top‐tier well results
Deep inventory of low‐risk projects
— >5,000 risked locations— Significant upside from downspacing
Most active asset in portfolio
— 2015 capital: ≈$1.2 billion— Activity focused in Bone Spring play
EddyLea
Delaware SandsLeonard ShaleBone SpringWolfcamp

Delaware BasinDelivering Prolific Production Growth
6
Delaware Basin Production GrowthMBOED
Oil NGL Gas
Q2 2014 Q2 2015
40%Growth
Per‐well productivity continues to increase
Q2 net production increased 40% YoY
Bone Spring driving growth46
64

Q2 Bone Spring Basin Wells30‐Day IP Rate, BOED
Delaware BasinBone Spring Results Continue to Improve
7
900
1,400
Type Well Q2 2015
>50%Increase
1,500 ‐ 2,000 lbs./ft.
Enhanced completion design drivesproductivity gains
— ≈3x more sand than historic design
— 16 Bone Spring basin wells in Q2
— Avg. 30‐day IP: 1,400 BOED
— Results >50% above type curve
Significant reduction in well costs
— >30% decline in well costs since Q4 2014
— Substantial improvements in drilling efficiency
— Completions sized to maximize returns523
574
615
Q4 2014 Q1 2015 Q2 2015
18%Productivity Increase
Bone Spring DrillingAverage Feet Drilled Per Day

Delaware BasinSignificant & Growing Resource Opportunity
8
Identified >5,000 risked, undrilled locations
Downspacing pilots expected to grow inventory— Testing 8 wells per section in lower 2nd Bone Spring interval (traditional landing zone)— Appraising stand‐alone commerciality of upper portion of 2nd Bone Spring
Wolfcamp provides significant upside potential
Formation Net RiskedAcres
Risked WellsPer Section
Gross RiskedLocations
Gross UnriskedLocations
Delaware Sands 80,000 4 700
Leonard Shale 60,000 5 700
Bone Spring 285,000 4 – 5 3,500
Wolfcamp 140,000 N/A Evaluating
Other 20,000 4 >200
Total 585,000 >5,000 >11,000

Eagle FordOverview
9
Top‐tier acreage position
— 75,000 net acres focused in DeWitt Co.— Q2 net production: 114 MBOED (≈60% oil)
Highest returning asset in portfolio
— Delivering best‐in‐class well results— Condensate exports boost realizations— Low cost asset: LOE $5 per BOE
Growing resource opportunity
— ≈400 MMBOE of risked resource— Encouraging Upper Eagle Ford Marl results— Staggered lateral pilots underway
Dewitt
LavacaGonzales
Karnes
Devon AcreageOil Condensate & NGLsDry Gas

Eagle FordBest‐In‐Class Results
10
Acreage located in best part of Eagle Ford
Consistently delivering world‐class development results
90‐Day IP rates 125% higher than industry average
0
250
500
750
1,000
Eagle Ford 90‐Day Wellhead IPsBOED, 20:1
Source: IHS/Devon. Based on wellhead rates for operated wells online for 90 days from July 2014.
1,000
Industry Average: 440 BOED
Peers

Eagle Ford
11
Per‐well productivity up 74%...
While achieving drilling efficiencies... Driving well costs down.
Eagle Ford ProductionMBOED
Driving prolific production growth...
1,120
1,950
March 2014 Q2 2015
74%Increase
30‐Day IP RatesBOED
51
114
March Q2 2015
≈125%Growth
2014
15.7
23.9
Q1 2014 Q2 2015
≈50%Efficiency
Improvement
DeWitt DrillingWells Per Rig Per Year
$9.5
$7.5
Previous Revised
D&C Cost $ Millions
≈20%Reduction
DeWitt County Productivity Gains Enhance Results

Anadarko BasinCana‐Woodford Development Play
12
Best position in Cana‐Woodford play
— 280,000 net risked acres— Identified 3,600 risked locations— Q2 net production: 59 MBOED
Record‐setting pad brought online
— 8‐well Haley section: 30‐day IP ≈1,850 BOED— >50% above type curve— Driven by enhanced completion design
Significant drilling efficiencies achieved
— Drilling time improved >30% since Q4 — Offsetting larger completion design— Total well costs declined by 15%
Cana‐Woodford Acreage280,000 Net Acres
Cana‐Woodford Core
Woodford Activity
Haley Pad8 WellsAvg. 30‐Day IP: 1,850 BOED

Anadarko BasinEmerging Meramec Opportunity
13
Appraisal activity yields high‐rate wells
— Initial 14 wells: 30‐day IP ≈1,500 BOED— Delivering competitive returns— Upside with improving completions
Growing resource opportunity
— Net risked acres: 60,000— Risked inventory: >400 locations— Meramec potential across Cana acreage
Accelerating Meramec activity
— Increasing activity up to 6 rigs— Spacing pilots underway— 2015 plans: 40 appraisal wells
Meramec Oil & Liquids Window60,000 Net Risked Acres
Meramec Activity
Meramec Appraisal2 Wells (Q2 2015)Avg. 30‐Day IP: 1,500 BOED

Rockies OilPowder River Basin
14
Parkman Focus Area
Campbell
Converse
Johnson
Devon AcreageRecently Acquired42,000 net acres
Emerging asset with significant potential
— Recently added 42,000 acres— Total net surface acres: 225,000— Risked locations: ≈800 across Parkman,
Turner and Frontier formations
Delivering substantial growth rates
— Q2 net production: 27 MBOED— Oil production increased ≈90% YoY
Strong Q2 development results
— 8 wells: 30‐day IP ≈1,400 BOED— Driven by 9,600’ extended reach laterals— 2x length of previous design

Heavy OilOverview
15
Located in best part of oil sands
— Low geologic risk— Thick and continuous reservoir— Industry leading operating results— Massive risked resource: 1.4 BBO
Features of each Jackfish project:
— 300 MMBO gross EUR— Long reserve life >20 years— Flat production profile
Delivering top‐tier results
— Per‐well productivity >40% above industry average
650450
DevonJackfish
IndustryAverage
Production Per Well(Bbls/d)
Source: FirstEnergy

Heavy Oil Delivering Visible Oil Growth
16
Oil production up 27% over past year
Driven by world‐class Jackfish complex
— Q2 gross production: 75 MBOD— Production increased 41% YoY— LOE declined by >30% YTD
Jackfish 3 ramp‐up ahead of schedule
— Current gross production: 27.5 MBOD— Expect 35 MBOD by end of 2015
Q2 margins expanded to $17 per barrel
Heavy Oil ProductionMBOD
Q2 2014 Q2 2015
Lloydminster
Jackfish 1
Jackfish 2
Jackfish 377
98
27%Growth
1.7
11.2 14.623.1
27.535.0
Q3 2014 Q4 2014 Q1 2015 Q2 2015 Current YE 2015
Jackfish 3 Gross Production Ramp‐UpMBOD

Platform For Sustainable GrowthSignificant & Growing Resource Opportunity
17
Heavy Oil
Rockies Oil
Barnett Shale
Eagle Ford
Anadarko Basin
Oil Assets
Liquids‐Rich Gas Assets
Delaware Basin
Asset Risked Opportunity Upside Potential
Delaware Basin
>5,000 undrilled locations
Spacing pilots underway
Eagle Ford ≈400 MMBoe of risked resource
Upper EF delineation and staggered lateral development of Lower EF
Anadarko Basin
>4,000 undrilled locations
Continued appraisal of Meramec
Heavy Oil 1.4 billion barrels of risked resource
Technology to improve facility performance and increase future recovery rates
Barnett Shale
5,000‐plus producing wells
Significant horizontal refrac potential
Rockies Oil ≈800 undrilled locations
Further de‐risking of Parkman oil fairway

18
Delivering Superior Execution
Maximize base production
— Minimize controllable downtime
— Enhance well productivity
— Leverage midstream operations
— Reduce operating costs
Operating Strategy For Long‐Term Success
Optimize capital program
— Disciplined project execution
— Perform premier technical work
— Focus on development drilling
— Reduce capital costs
Capture Full Value
ImproveReturns

Delivering Superior ExecutionLeveraging Technology To Enhance Performance
19
Decision support centers enhance performance
— Minimize downtime
— Reduce drilling times
— Improve well placement and completion design
— Optimize flow rates and NPV per well
Benefits beyond well performance
— Enhanced collaboration with technical teams
— Faster decision making
— Encourages innovation
Targeting up to $250 million of value gains annually
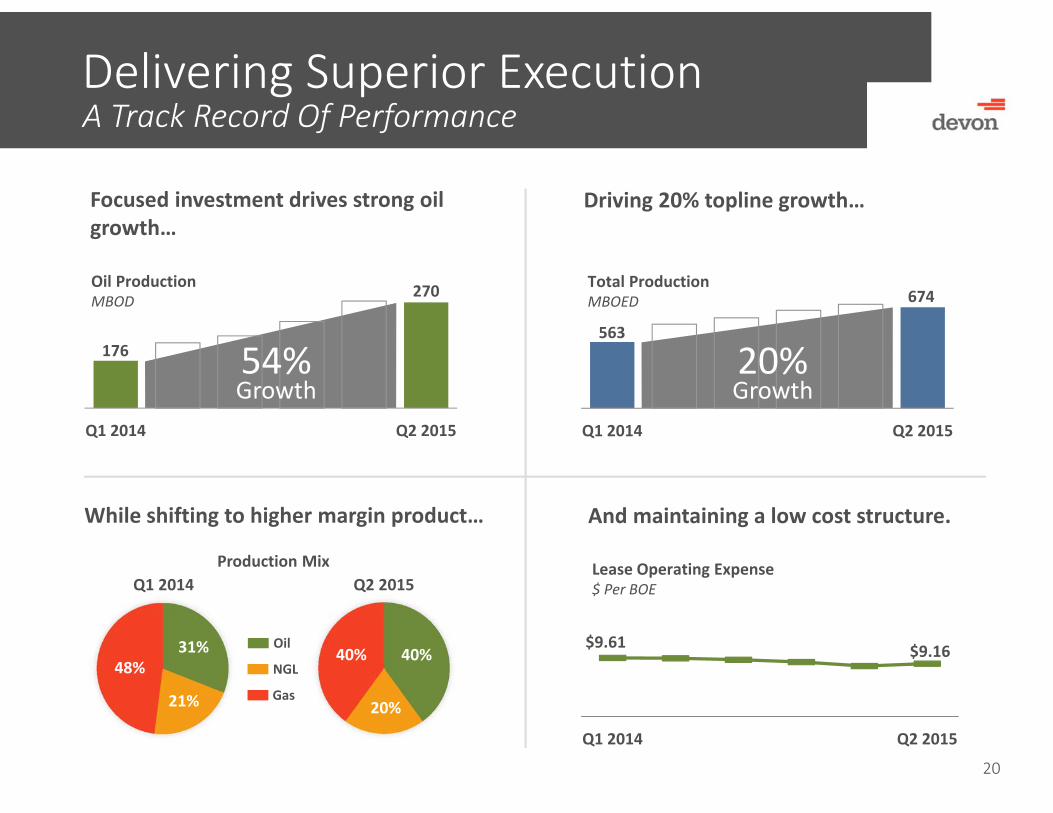
Delivering Superior ExecutionA Track Record Of Performance
20
176
270
Q1 2014 Q2 2015
Oil ProductionMBOD
Focused investment drives strong oil growth…
While shifting to higher margin product… And maintaining a low cost structure.
54%Growth
Production MixQ1 2014
40%
20%
40%
Q2 2015
Oil
NGL
Gas
31%
21%
48%$9.61 $9.16
Q1 2014 Q2 2015
Lease Operating Expense$ Per BOE
563
674
Q1 2014 Q2 2015
Total ProductionMBOED
Driving 20% topline growth…
20%Growth

21
Advantaged Capital Structure
Excellent financial strength & flexibility
— Strong investment‐grade credit ratings
— Cash & credit facility availability: $4.5 billion
— Low leverage: $7.6 billion of net debt(1)
The EnLink Midstream advantage
— Asset dropdown visibility
— Annual distributions: ≈$270 million
— Equity ownership valued at ≈$5 billion
(1) Net debt is a Non‐GAAP measure defined as total debt less cash and cash equivalents and debt attributable to the consolidationof EnLink Midstream.
Market Value of EnLink OwnershipAugust 2015

22
Disciplined Capital Allocation
Protect the balance sheet
— Match capital investment with cash inflows
Prepared to dynamically allocate capital
— Minimal service contracts >12 months
— No long‐term project commitments
— Leases held by production
— Tailor activity to market conditions
Approach To Current Environment
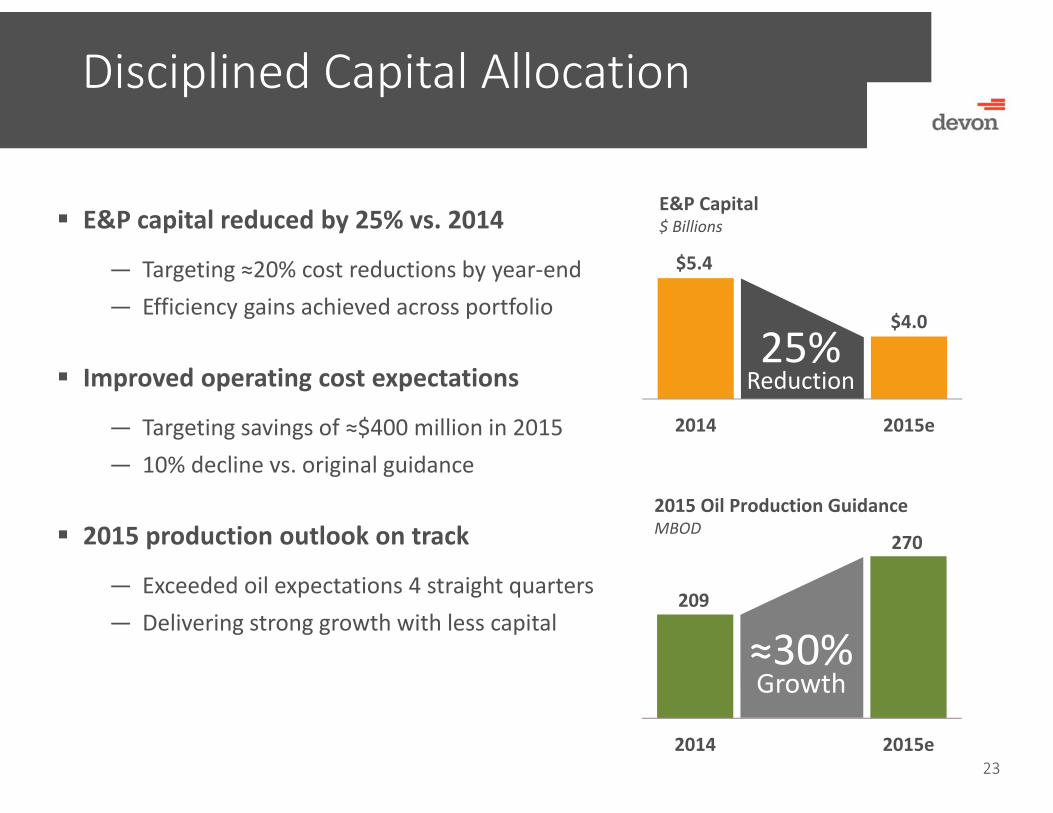
Disciplined Capital Allocation
23
E&P capital reduced by 25% vs. 2014
— Targeting ≈20% cost reductions by year‐end— Efficiency gains achieved across portfolio
Improved operating cost expectations
— Targeting savings of ≈$400 million in 2015— 10% decline vs. original guidance
2015 production outlook on track
— Exceeded oil expectations 4 straight quarters— Delivering strong growth with less capital
Heavy Oil
$5.4
$4.0
2014 2015e
25%Reduction
E&P Capital$ Billions
209
270
2014 2015e
≈30%Growth
2015 Oil Production GuidanceMBOD

Why Own Devon?
24
Premier asset portfolio
Platform for sustainable growth
Delivering superior execution
Advantaged capital structure
Disciplined capital allocation

Thank you.

Appendix

Barnett ShaleLiquids‐Rich Gas Development
27
Wise
Parker
Johnson
Hood
Denton
FortWorth
1,900Verticals
Barnett Wells
>3,000Horizontals
Significant gas optionality
— Net acres: 620,000— Best position in play— Q2 net production: 185 MBOED— Liquids 27% of production mix
Focused on optimizing base production
— Active vertical refrac program (150 wells)— Up to 15 horizontal refrac tests
2015 outlook
— 2015 capital: ≈$150 million

Potential Drop Down AssetAccess Pipeline
28
Three ≈180 mile pipelines fromSturgeon Terminal to Devon’sthermal acreage
≈30 miles of dual pipeline fromSturgeon Terminal to Edmonton
Capacity net to Devon:
— Blended bitumen: 170 MBOD
Devon ownership: 50%
— ≈$1 B invested to date
ExpressTo U.S. Rockies
JACKFISH & PIKE
SturgeonTerminal
EDMONTON
HARDISTY
16” Diluent Line(Edmonton to Jackfish)
Oil Pipelines
24” Diluent Line(Sturgeon to Jackfish)
42” Blend Line(Jackfish to Sturgeon)
30” Blend Line(Sturgeon to Edmonton)

SCOOP
STACK
CANA‐WOODFORD
Bridgeport PlantEnLink
Cana PlantEnLink
NGPL Proposed ProcessingFacility
OKLAHOMA
TEXAS
Red
Potential Drop Down AssetNGPL
29
92‐mile gas pipeline from North Texasto Central Oklahoma
Acquisition of NGPL nearing completion
— Regulatory approval received
— Expect to close transaction early 2016
Strategic opportunity with growingSTACK, SCOOP and Cana‐Woodford

Delaware BasinBone Spring Spacing Pilots
30
Lower
2ndBO
NE SPRING
Upp
er
3rd
BONE
SPRING
Pilot 1
Planned Pilot Well Existing Producer
Pilot 2
660’
Pilot 3 Pilot 4 Pilot 5
660’ 880’
1,320’
280’660’
Results will help optimize future development schemes and ultimatelymaximize resource value
Pilots are underway with data collection and analysis occurring in the2nd half of 2015 and into 2016

Anadarko BasinMeramec Spacing Pilots
31
Results will help determine the optimal future development schemesof both the Meramec and Woodford formations
Pilot activity to begin in the 2nd half of 2015
PlannedPilotWell
Spacing Pilot Staggered Lateral Pilot
MISSISSIPPIAN
1,150’
(5 wells/section)
660’
Lower
Upp
er
MER
AMEC

Key Modeling Statistics
0%
15%
30%
45%
60%
75%
Yr 1 Yr 2 Yr 3 Yr 4 Yr 5
Decline Rates(1st month to 13th month)
Bone Spring Slope (Delaware Basin)
Working interest / royalty: 71% / 21%
30‐day IP rate: 500 BOED
EUR: 450 MBOE
Oil / NGLs as % of production: 65% / 12%
0%
15%
30%
45%
60%
75%
Yr 1 Yr 2 Yr 3 Yr 4 Yr 5
Decline Rates(1st month to 13th month)
Bone Spring Basin (Delaware Basin)
Working interest / royalty: 71% / 21%
30‐day IP rate: 900 BOED
EUR: 600 MBOE
Oil / NGLs as % of production: 65% / 20%
32

Key Modeling Statistics
0%
15%
30%
45%
60%
75%
90%
Yr 1 Yr 2 Yr 3 Yr 4 Yr 5
Decline Rates(1st month to 13th month)
Rockies: Powder River Basin (Parkman)
Working interest / royalty: 58% / 18%
30‐day IP rate: 1,300 BOED
EUR: 425 MBOE
Oil / Gas as % of production: 95% / 5%
0%
15%
30%
45%
60%
75%
Yr 1 Yr 2 Yr 3 Yr 4 Yr 5
Decline Rates(1st month to 13th month)
Eagle Ford (DeWitt County)
Working interest / royalty: 54% / 22%
30‐day IP rate: 1,650 BOED
EUR: 900 MBOE
Oil / NGLs as % of production: 60% / 20%
33

Key Modeling Statistics
0%
15%
30%
45%
60%
75%
Yr 1 Yr 2 Yr 3 Yr 4 Yr 5
Decline Rates(1st month to 13th month)
Cana‐Woodford Shale
Working interest / royalty: 51% / 21%
30‐day IP rate: 1,200 BOED
EUR: 1,700 MBOE
Oil / NGLs as % of production: 5% / 40%
34
0%
15%
30%
45%
60%
75%
90%
Yr 1 Yr 2 Yr 3 Yr 4 Yr 5
Decline Rates(1st month to 13th month)
Meramec
Working interest / royalty: 34% / 18%
30‐day IP rate: 1,500 BOED
EUR: 1,400 MBOE
Oil / NGLs as % of production: 9% / 42%

Discussion of Risk Factors
35
Forward‐Looking Statements: Information provided in this presentation includes “forward‐looking statements” as defined by the Securities and Exchange Commission. Forward‐looking statements are often identified by use of the words “forecasts”, “projections”, “estimates”, “plans”, “expectations”, “targets”, “opportunities”, “potential”, “outlook”, and other similar terminology.” Such statements are subject to a variety of risk factors. A discussion of risk factors that could cause Devon’s actual results to differ materially from the forward‐looking statements contained herein are outlined below.The forward‐looking statements provided in this presentation are based on management’s examination of historical operating trends, the information which was used to prepare reserve reports and other data in Devon’s possession or available from third parties. Devon cautions that its future oil, natural gas and NGL production, revenues and expenses are subject to all of the risks and uncertainties normally incident to the exploration for and development, production and sale of oil, gas and NGL. These risks include, but are not limited to, price volatility, inflation or lack of availability of goods and services, environmental risks, drilling risks, political changes, changes in laws or regulations, the uncertainty inherent in estimating future oil and gas production or reserves, and other risks identified in our Form 10‐K and our other filings with the SEC.
Specific Assumptions and Risks Related to Price and Production Estimates: A significant and prolonged deterioration in market conditions and the other assumptions on which our estimates are based will impact many aspects of our business and our results. Substantially all of Devon’s revenues are attributable to sales, processing and transportation of three commodities: oil, natural gas and NGL. Prices for oil, natural gas and NGL are determined primarily by prevailing market conditions, which may be impacted by a variety of general and specific factors that are difficult to control or predict. Worldwide and regional economic conditions, weather and other local market conditions influence the supply of and demand for energy commodities. In particular, concerns about the level of global crude‐oil and natural‐gas inventories and the production trends of significant oil producers like OPEC, among other things, have led to a significant drop in prices. In addition to volatility from general market conditions, Devon’s oil, natural gas and NGL prices may vary considerably due to factors specific to Devon, such as pricing differentials among the various regional markets in which our products are sold, the value derivable from the quality of oil Devon produces (i.e., sweet crude versus heavy or sour crude),the Btu content of gas produced, the availability and capacity of transportation facilities we may utilize, and the costs and demand for the various products derived from oil, natural gas and NGL. Estimates for Devon’s future production of oil, natural gas and NGL are based on the assumption that market demand and prices for oil, natural gas and NGL will be at levels that allow for profitable production of these products. As illustrated by recent market trends, there can be no assurance of such stability. Much of Devon’s production in Canada is subject to government royalties that fluctuate with prices, which, therefore, will affect reported production. Estimates for Devon’s future processing and transportation of oil, natural gas and NGL are based on the assumption that market demand and prices for oil, natural gas and NGL will be at levels that allow for profitable processing and transport of these products. As with our production estimates, there can be no assurance of such stability. The production, transportation, processing and marketing of oil, natural gas and NGL are complex processes which are subject to disruption due to transportation and processing availability, mechanical failure, human error, meteorological events including, but not limited to, tornadoes, extreme temperatures, and numerous other factors.
Assumptions and Risks Related to Capital Expenditures Estimates: Devon’s capital expenditures budget is based on an expected range of future oil, natural gas and NGL prices as well as the expected costs of the capital additions. Should actual prices received differ materially from Devon’s price expectations for its future production, some projects may be accelerated or deferred and, consequently, may increase or decrease capital expenditures. In addition, if the actual material or labor costs of the budgeted items vary significantly from the anticipated amounts, actual capital expenditures could vary materially from Devon’s estimates.
Assumptions and Risks Related to Marketing and Midstream Estimates: Devon cautions that its future marketing and midstream revenues and expenses are subject to all of the risks and uncertainties normally incident to the marketing and midstream business. These risks include, but are not limited to, price volatility, environmental risks, mechanical failures, regulatory changes, the uncertainty inherent in estimating future processing volumes and pipeline throughput, cost of goods and services and other risks.