Embed Size (px)
Citation preview
1
August 2015 Farming and Food Brief
Headline Summary
The monthly farming and food brief summarises the latest statistical and economic information relating to the agricultural sector. In particular, it highlights the results of recently published evidence and research.
Food prices continue to fall
Year on year food prices have continued to fall, with an annual rate of inflation of -2.7% in the year to July 2015, according to official figures released on 18th August 2015. General inflation is 0.1 %, up from 0.0% in June. (More details: see section 4.)
Major changes to the farm business
In results from the Farm Business Survey published on 13th August 2015, more than half of cropping farms
(54%) planned to carry out a major change to the business in 2015 or 2016. For those planning a change, the most common reason given was to increase profitability.
Around 40% of cropping businesses planned a major investment in their business within the next two years. Larger farms were more likely to invest than smaller farms
A third of cropping businesses had introduced a new or innovative practice in the previous 12 months. For around half of these farms (48%) this was primarily the result of the farmer’s own ideas; 19% cited the primary source as the media and 17% cited other farmers, discussion groups or farm staff.
(More details: see section 2.2)
Average Farm Household Income little changed from 2012/13
In results from the Farm Business Survey published on 20th August 2015, the average household income
before tax) of the principal farmer was £51,800 in 2013/14, little changed from 2012/13 (£51,400 per household). A quarter of these households had an income of less £16,000 and a quarter had an income greater than £65,900.
(More details: see section 2.3)
Monthly milk production lower than previous year
Monthly milk production was lower than the previous year for the first time since June 2013 (25 months). But continued pressure from international markets have led to a 1.3% (0.32p per litre) decrease on the UK average farm gate milk price since in the month to July 2015 to 23.35p per litre. (More details: see section 2.1.2 and the detailed briefing Annex A at the end of this document).
2
Contents Headline Summary ...................................................................................................................................... 1
1. Overall economic position ................................................................. 3
2. Farming ............................................................................................... 4
2.1. Economic ............................................................................................................. 4 2.1.1. UK Prices – Inputs .......................................................................................................................... 4 2.1.2. Prices and Market Information – Commodities ........................................................................... 4
2.2. Farmer Intentions ................................................................................................ 7
2.3. Farm Household Income .................................................................................... 8
3. Environment, Health and Welfare ...................................................... 9
3.1. Health and Welfare .............................................................................................. 9 3.1.1. TB Statistics May 2015 – Great Britain ......................................................................................... 9
4. Food ..................................................................................................... 9
4.1. Food inflation ...................................................................................................... 9 4.1.1. Consumer and retail prices ........................................................................................................... 9
4.2. International Trade in Food, Feed and Drink .................................................. 11 4.2.1. Value of Trade ............................................................................................................................... 11
Annex A: Dairy Briefing: August 2015 .................................................. 12
3
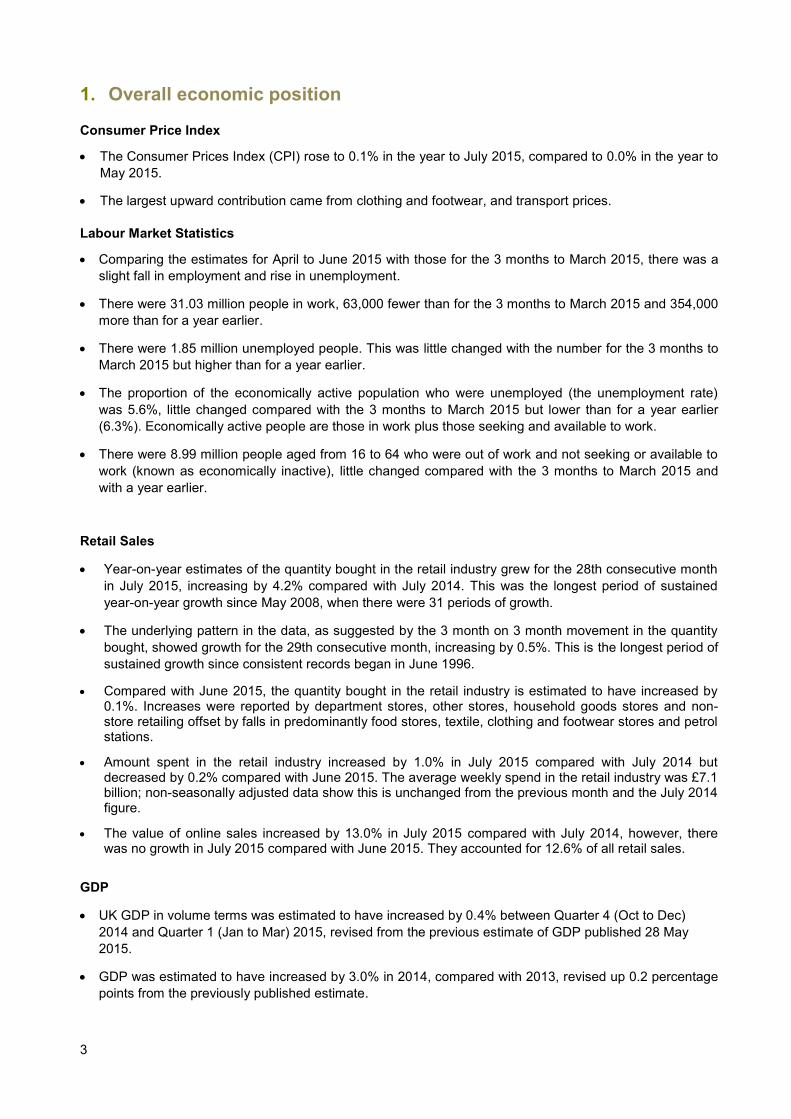
1. Overall economic position
Consumer Price Index
The Consumer Prices Index (CPI) rose to 0.1% in the year to July 2015, compared to 0.0% in the year to
May 2015.
The largest upward contribution came from clothing and footwear, and transport prices.
Labour Market Statistics
Comparing the estimates for April to June 2015 with those for the 3 months to March 2015, there was a
slight fall in employment and rise in unemployment.
There were 31.03 million people in work, 63,000 fewer than for the 3 months to March 2015 and 354,000
more than for a year earlier.
There were 1.85 million unemployed people. This was little changed with the number for the 3 months to
March 2015 but higher than for a year earlier.
The proportion of the economically active population who were unemployed (the unemployment rate)
was 5.6%, little changed compared with the 3 months to March 2015 but lower than for a year earlier
(6.3%). Economically active people are those in work plus those seeking and available to work.
There were 8.99 million people aged from 16 to 64 who were out of work and not seeking or available to
work (known as economically inactive), little changed compared with the 3 months to March 2015 and
with a year earlier.
Retail Sales
Year-on-year estimates of the quantity bought in the retail industry grew for the 28th consecutive month
in July 2015, increasing by 4.2% compared with July 2014. This was the longest period of sustained
year-on-year growth since May 2008, when there were 31 periods of growth.
The underlying pattern in the data, as suggested by the 3 month on 3 month movement in the quantity
bought, showed growth for the 29th consecutive month, increasing by 0.5%. This is the longest period of
sustained growth since consistent records began in June 1996.
Compared with June 2015, the quantity bought in the retail industry is estimated to have increased by 0.1%. Increases were reported by department stores, other stores, household goods stores and non-store retailing offset by falls in predominantly food stores, textile, clothing and footwear stores and petrol stations.
Amount spent in the retail industry increased by 1.0% in July 2015 compared with July 2014 but decreased by 0.2% compared with June 2015. The average weekly spend in the retail industry was £7.1 billion; non-seasonally adjusted data show this is unchanged from the previous month and the July 2014 figure.
The value of online sales increased by 13.0% in July 2015 compared with July 2014, however, there was no growth in July 2015 compared with June 2015. They accounted for 12.6% of all retail sales.
GDP
UK GDP in volume terms was estimated to have increased by 0.4% between Quarter 4 (Oct to Dec)
2014 and Quarter 1 (Jan to Mar) 2015, revised from the previous estimate of GDP published 28 May
2015.
GDP was estimated to have increased by 3.0% in 2014, compared with 2013, revised up 0.2 percentage
points from the previously published estimate.

4
2. Farming
This section brings together the latest economic position for the farming sector (including UK and
international input and commodity price intelligence) and the highlights of recently published evidence and
research.
2.1. Economic
2.1.1. UK Prices – Inputs
Red Diesel: In July 2015, the average price for red diesel was 52 pence per litre. Current prices are 22%
lower than July 2014.
Fertiliser: In July the average price for 34.5% UK Ammonium Nitrate bags fell to £232.50 per tonne.
Current prices are 8% lower than July 2014. June figures were estimated as data was unavailable.
(Source: Dairy Co Datum).
Contact: Graham Brown, Farming Statistics (Accounts and Prices), [email protected]
2.1.2. Prices and Market Information – Commodities
Cereals
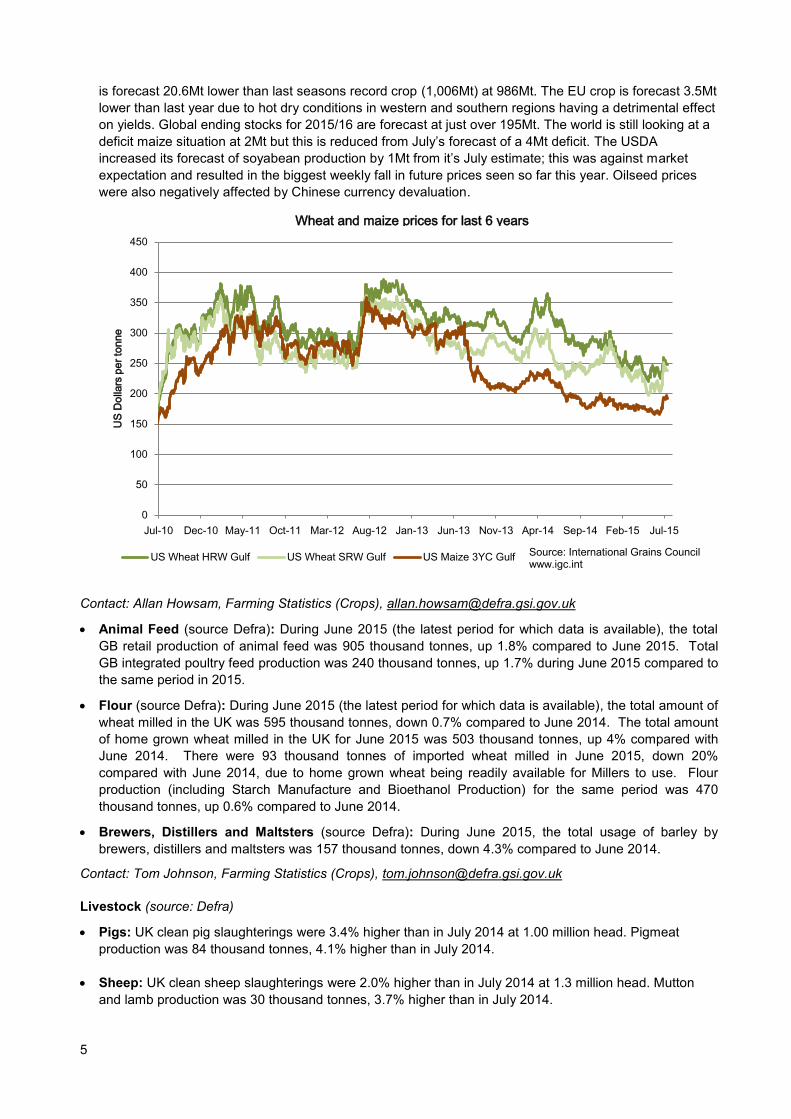
The July 2015 average price for Hard Red winter wheat was $237 per tonne, which was a 31% decline
from the May 2014 average price of $342 as markets react to the latest harvest information. The 2014
and 2015 decline in prices has been steeper than that seen in 2013 when prices of Hard Red winter
wheat fell from $330 in May to $311 in June. Soft Red winter wheat followed a similar pattern and is 33%
lower than the May 2014 average price.
Maize prices have fallen from a record high of $358 per tonne in July 2012 to $174 in June 2015. Over
recent weeks prices have increased to$185 per tonne in mid-August 2015, 6.5% higher than the June
average).
The USDA published their World Agricultural Supply and Demand 2015/16 production forecasts on 12
August. For wheat, the global production forecast has been increased by 4.5Mt to 726.55Mt (which
compares to the actual level of production of 725.25Mt for 2014/15). The increase in the forecast is due
to higher forecasts in Russia and Ukraine offsetting a lower than expected crop in Canada and a
reduction in carryover stock. Global wheat demand for 2015/16 shows little change from previous
forecasts and world ending stocks are are now forecast 1.66Mt higher than the July forecast at 221.47Mt
and 12Mt higher than the actual 2014/15 ending stock. Global production of maize is forecast 1.5Mt
lower than the July forecast but this offset by higher opening stocks (+3.47Mt). Overall global production
45
50
55
60
65
70
75
Aug Oct Dec Feb Apr June
Red Diesel Prices
2013-2014 2014-2015
pence
per
litre
230
250
270
290
310
Aug Oct Dec Feb Apr Jun
UK Nitrogen Fertiliser Bags
2013-2014 2014-2015
£ p
er
tonne
5
is forecast 20.6Mt lower than last seasons record crop (1,006Mt) at 986Mt. The EU crop is forecast 3.5Mt
lower than last year due to hot dry conditions in western and southern regions having a detrimental effect
on yields. Global ending stocks for 2015/16 are forecast at just over 195Mt. The world is still looking at a
deficit maize situation at 2Mt but this is reduced from July’s forecast of a 4Mt deficit. The USDA
increased its forecast of soyabean production by 1Mt from it’s July estimate; this was against market
expectation and resulted in the biggest weekly fall in future prices seen so far this year. Oilseed prices
were also negatively affected by Chinese currency devaluation.
Contact: Allan Howsam, Farming Statistics (Crops), [email protected]
Animal Feed (source Defra): During June 2015 (the latest period for which data is available), the total
GB retail production of animal feed was 905 thousand tonnes, up 1.8% compared to June 2015. Total
GB integrated poultry feed production was 240 thousand tonnes, up 1.7% during June 2015 compared to
the same period in 2015.
Flour (source Defra): During June 2015 (the latest period for which data is available), the total amount of
wheat milled in the UK was 595 thousand tonnes, down 0.7% compared to June 2014. The total amount
of home grown wheat milled in the UK for June 2015 was 503 thousand tonnes, up 4% compared with
June 2014. There were 93 thousand tonnes of imported wheat milled in June 2015, down 20%
compared with June 2014, due to home grown wheat being readily available for Millers to use. Flour
production (including Starch Manufacture and Bioethanol Production) for the same period was 470
thousand tonnes, up 0.6% compared to June 2014.
Brewers, Distillers and Maltsters (source Defra): During June 2015, the total usage of barley by
brewers, distillers and maltsters was 157 thousand tonnes, down 4.3% compared to June 2014.
Contact: Tom Johnson, Farming Statistics (Crops), [email protected]
Livestock (source: Defra)
Pigs: UK clean pig slaughterings were 3.4% higher than in July 2014 at 1.00 million head. Pigmeat
production was 84 thousand tonnes, 4.1% higher than in July 2014.
Sheep: UK clean sheep slaughterings were 2.0% higher than in July 2014 at 1.3 million head. Mutton
and lamb production was 30 thousand tonnes, 3.7% higher than in July 2014.
0
50
100
150
200
250
300
350
400
450
Jul-10 Dec-10 May-11 Oct-11 Mar-12 Aug-12 Jan-13 Jun-13 Nov-13 Apr-14 Sep-14 Feb-15 Jul-15
US
Do
llars
pe
r to
nne
US Wheat HRW Gulf US Wheat SRW Gulf US Maize 3YC Gulf Source: International Grains Councilwww.igc.int
Wheat and maize prices for last 6 years
6
Cattle: UK prime cattle (steers, heifers and young bulls) slaughterings in July 2015 were 2.8% higher
than July 2014 at 181 thousand head. Beef and veal production was 83 thousand tonnes, 6.2% higher
than in July 2014.
Contact: Leigh Riley, Farming Statistics (Livestock), [email protected]
Livestock products (source: Defra)
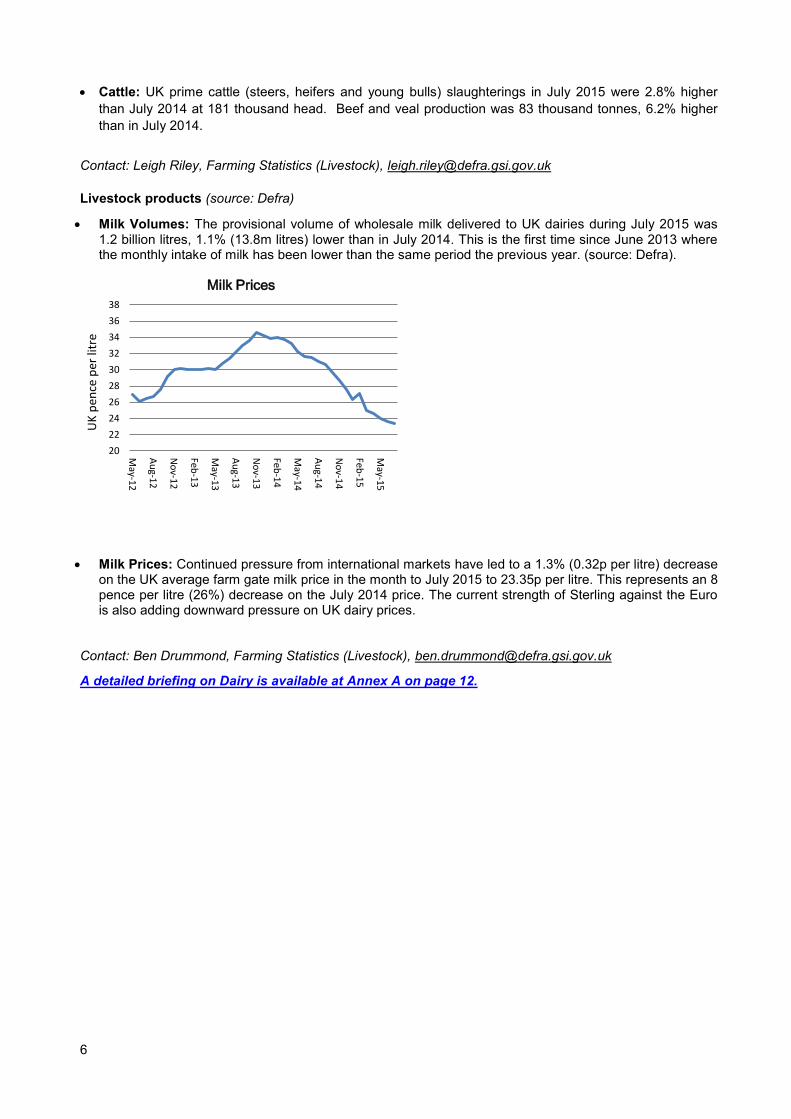
Milk Volumes: The provisional volume of wholesale milk delivered to UK dairies during July 2015 was 1.2 billion litres, 1.1% (13.8m litres) lower than in July 2014. This is the first time since June 2013 where the monthly intake of milk has been lower than the same period the previous year. (source: Defra).
Milk Prices: Continued pressure from international markets have led to a 1.3% (0.32p per litre) decrease on the UK average farm gate milk price in the month to July 2015 to 23.35p per litre. This represents an 8 pence per litre (26%) decrease on the July 2014 price. The current strength of Sterling against the Euro is also adding downward pressure on UK dairy prices.
Contact: Ben Drummond, Farming Statistics (Livestock), [email protected]
A detailed briefing on Dairy is available at Annex A on page 12.
20
22
24
26
28
30
32
34
36
38
May-12
Au
g-12
No
v-12
Feb-1
3
May-13
Au
g-13
No
v-13
Feb-1
4
May-14
Au
g-14
No
v-14
Feb-1
5
May-15
Milk Prices
UK
pen
ce p
er li
tre
7
2.2. Farmer Intentions
In 2013/14, the Farm Business Survey (FBS) collected data from a subset of cropping (cereal, general cropping, horticulture and mixed farms) farms within the main survey. This data covered farmers’ aspirations and plans for 2015 and 2016 for the whole business and for individual enterprises, the strength of these intentions and the reasons behind them. It also included any innovations or new practices adopted by the business in 2014. The results from these questions were published on the 13
th August 2015. The key
results from the survey are given below: Major changes to the farm business
More than half of cropping farms (54%) planned to carry out a major change to the business in 2015 or 2016. Major changes were more likely for those in the North West than other regions and/or for those with a net worth of less than £500,000 or more than £2 million.
For those planning a change, the most common reason given was to increase profitability (63%).
The most common changes planned were to production levels on existing agricultural enterprises (34%) and to output on diversified enterprises (21%). The strength of intention for carrying out these changes was relatively strong; 47% and 42% (respectively) of those planning to make these changes indicated that plans were well developed and the changes were almost certain to be implemented.
Enterprise level changes
Major changes to agricultural enterprises were more likely to involve increasing or decreasing an existing enterprise (by at least 10%) than stopping or commencing something new. Changes were most likely to existing ornamental enterprises and least likely to existing combinable crop enterprises.
Very few cropping farms (11%) had an existing enterprise that added value by selling direct to customers or by processing. Of those that did, 35% planned a major change in 2015 or 2016.
Around a fifth (21%) of cropping businesses planned a major change to a diversification enterprise within the next two years. The planned change was largely to increase an existing enterprise (12% of cropping businesses) or to start a new enterprise (7%). The most common new enterprise type was generating electricity.
Major investment in the farm business
Around 40% of cropping businesses planned a major investment in their business within the next two years. Larger farms were more likely to invest than smaller farms.
The most common area for investment was in new machinery (16%).
Innovation
A third of cropping businesses had introduced a new or innovative practice in the previous 12 months. For around half of these farms (48%) this was primarily the result of the farmer’s own ideas; 19% cited the primary source as the media and 17% cited other farmers, discussion groups or farm staff.
Of those cropping business that introduced a new or innovative practice, over a third (36%) were related to crop and livestock husbandry. For 27% the new practice was linked to precision farming and for 25% linked to farm management. Eighteen percent had introduced specialist equipment and for 14% the new practice was related to renewable energy and water management.
Link to full release: https://www.gov.uk/government/statistics/farmer-intentions-survey
Contact: Katherine Merrett, Farming Statistics (Farm Business Survey), [email protected]
8
2.3. Farm Household Income
The final estimates of farm household income from the 2013/14 Farm Business Survey were published on 20
th August 2015. Farm household income comprises Farm Business Income (including that from diversified
enterprises), the off farm income of the principal farmer and their spouse/common law partner and income from other household members. The key results are:
The average household income (before tax) of the principal farmer was £51,800 in 2013/14, little changed from 2012/13 (£51,400 per household). A quarter of these households had an income of less £16,000 and a quarter had an income greater than £65,900.
Changes in farm household income tend to be driven by changes in Farm Business Income (FBI). In 2013/14, FBI accounted for 70% of farm household income. Non-farm income (off-farm income of the farmer and their spouse or common law partner and income of other household members) has remained largely unchanged over the last 5 years, averaging between £14,000 and £15,500 per household.
92% of farm households had off-farm income from the principal farmer or their spouse or common law partner (on average £15,200 per household); 10% had income from other household members (on average £16,200 per household).
Around half of principal farmer households obtained at least 50% of their non-farm income from unearned sources such as investments and pensions; in 2013/14 30% was from investments and 21% was from pensions. Only 2% of households obtained at least 50% of their non-farm income from working on another farm.
37,900 farm businesses (65%) are comprised of a single household. Analysing data for these businesses reveals a stark contrast between income and assets. For example, 25% had a household income below £17,900, but the median net worth of this group was £413,000.
Link to full release: https://www.gov.uk/government/statistics/farm-household-income-and-household-composition-201213
Contact: Katherine Merrett, Farming Statistics (Farm Business Survey), [email protected]
9
3. Environment, Health and Welfare
3.1. Health and Welfare
3.1.1. TB Statistics May 2015 – Great Britain
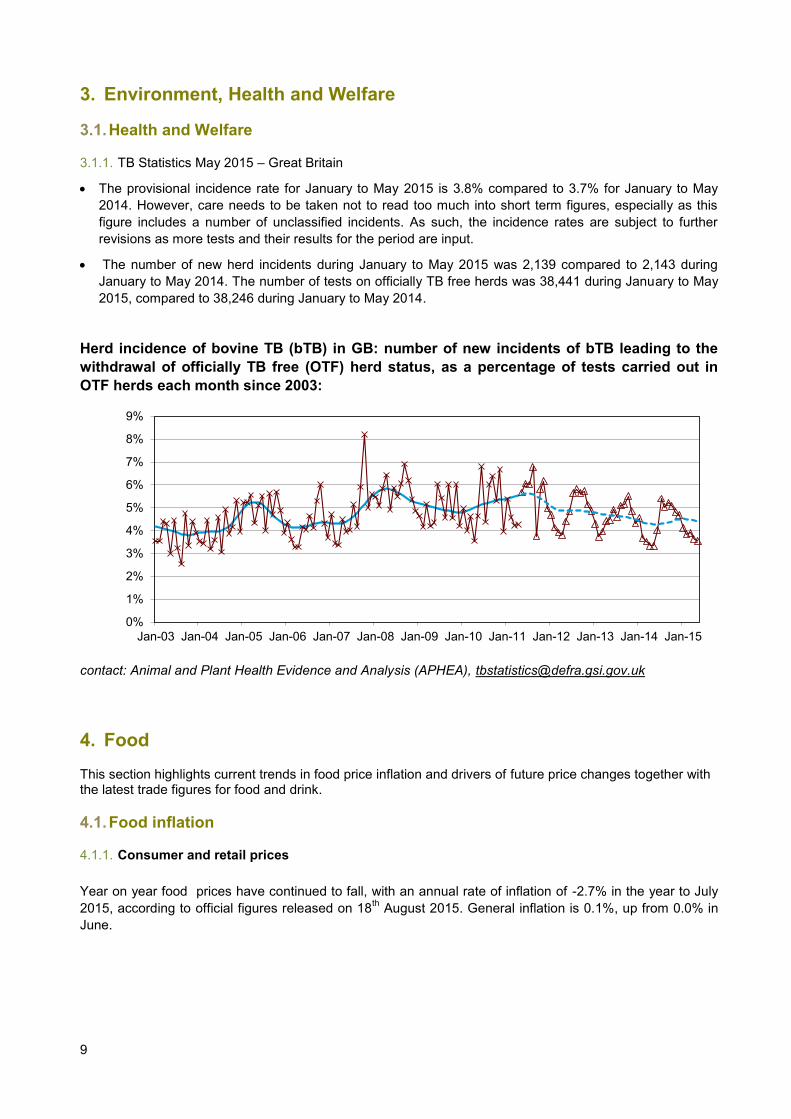
The provisional incidence rate for January to May 2015 is 3.8% compared to 3.7% for January to May
2014. However, care needs to be taken not to read too much into short term figures, especially as this
figure includes a number of unclassified incidents. As such, the incidence rates are subject to further
revisions as more tests and their results for the period are input.
The number of new herd incidents during January to May 2015 was 2,139 compared to 2,143 during
January to May 2014. The number of tests on officially TB free herds was 38,441 during January to May
2015, compared to 38,246 during January to May 2014.
Herd incidence of bovine TB (bTB) in GB: number of new incidents of bTB leading to the
withdrawal of officially TB free (OTF) herd status, as a percentage of tests carried out in
OTF herds each month since 2003:
contact: Animal and Plant Health Evidence and Analysis (APHEA), [email protected]
4. Food
This section highlights current trends in food price inflation and drivers of future price changes together with the latest trade figures for food and drink.
4.1. Food inflation
4.1.1. Consumer and retail prices
Year on year food prices have continued to fall, with an annual rate of inflation of -2.7% in the year to July
2015, according to official figures released on 18th August 2015. General inflation is 0.1%, up from 0.0% in
June.
0%
1%
2%
3%
4%
5%
6%
7%
8%
9%
Jan-03 Jan-04 Jan-05 Jan-06 Jan-07 Jan-08 Jan-09 Jan-10 Jan-11 Jan-12 Jan-13 Jan-14 Jan-15
10
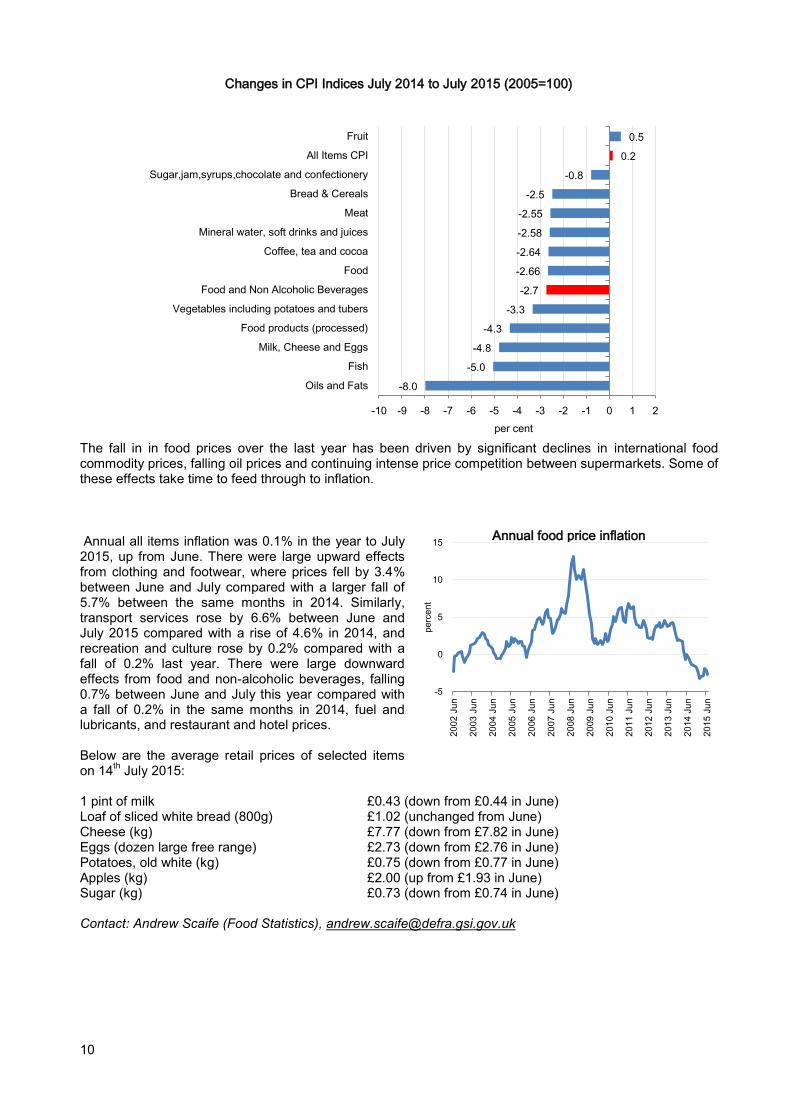
The fall in in food prices over the last year has been driven by significant declines in international food commodity prices, falling oil prices and continuing intense price competition between supermarkets. Some of these effects take time to feed through to inflation.
Annual all items inflation was 0.1% in the year to July 2015, up from June. There were large upward effects from clothing and footwear, where prices fell by 3.4% between June and July compared with a larger fall of 5.7% between the same months in 2014. Similarly, transport services rose by 6.6% between June and July 2015 compared with a rise of 4.6% in 2014, and recreation and culture rose by 0.2% compared with a fall of 0.2% last year. There were large downward effects from food and non-alcoholic beverages, falling 0.7% between June and July this year compared with a fall of 0.2% in the same months in 2014, fuel and lubricants, and restaurant and hotel prices. Below are the average retail prices of selected items on 14
th July 2015:
1 pint of milk £0.43 (down from £0.44 in June) Loaf of sliced white bread (800g) £1.02 (unchanged from June) Cheese (kg) £7.77 (down from £7.82 in June) Eggs (dozen large free range) £2.73 (down from £2.76 in June) Potatoes, old white (kg) £0.75 (down from £0.77 in June) Apples (kg) £2.00 (up from £1.93 in June) Sugar (kg) £0.73 (down from £0.74 in June) Contact: Andrew Scaife (Food Statistics), [email protected]
-8.0
-5.0
-4.8
-4.3
-3.3
-2.7
-2.66
-2.64
-2.58
-2.55
-2.5
-0.8
0.2
0.5
-10 -9 -8 -7 -6 -5 -4 -3 -2 -1 0 1 2
Oils and Fats
Fish
Milk, Cheese and Eggs
Food products (processed)
Vegetables including potatoes and tubers
Food and Non Alcoholic Beverages
Food
Coffee, tea and cocoa
Mineral water, soft drinks and juices
Meat
Bread & Cereals
Sugar,jam,syrups,chocolate and confectionery
All Items CPI
Fruit
per cent
-5
0
5
10
15
20
02
Ju
n
20
03
Ju
n
20
04
Ju
n
20
05
Ju
n
20
06
Ju
n
20
07
Ju
n
20
08
Ju
n
20
09
Ju
n
20
10
Ju
n
20
11
Ju
n
20
12
Ju
n
20
13
Ju
n
20
14
Ju
n
20
15
Ju
n
perc
ent
Annual food price inflation
Changes in CPI Indices July 2014 to July 2015 (2005=100)
11
4.2. International Trade in Food, Feed and Drink
4.2.1. Value of Trade
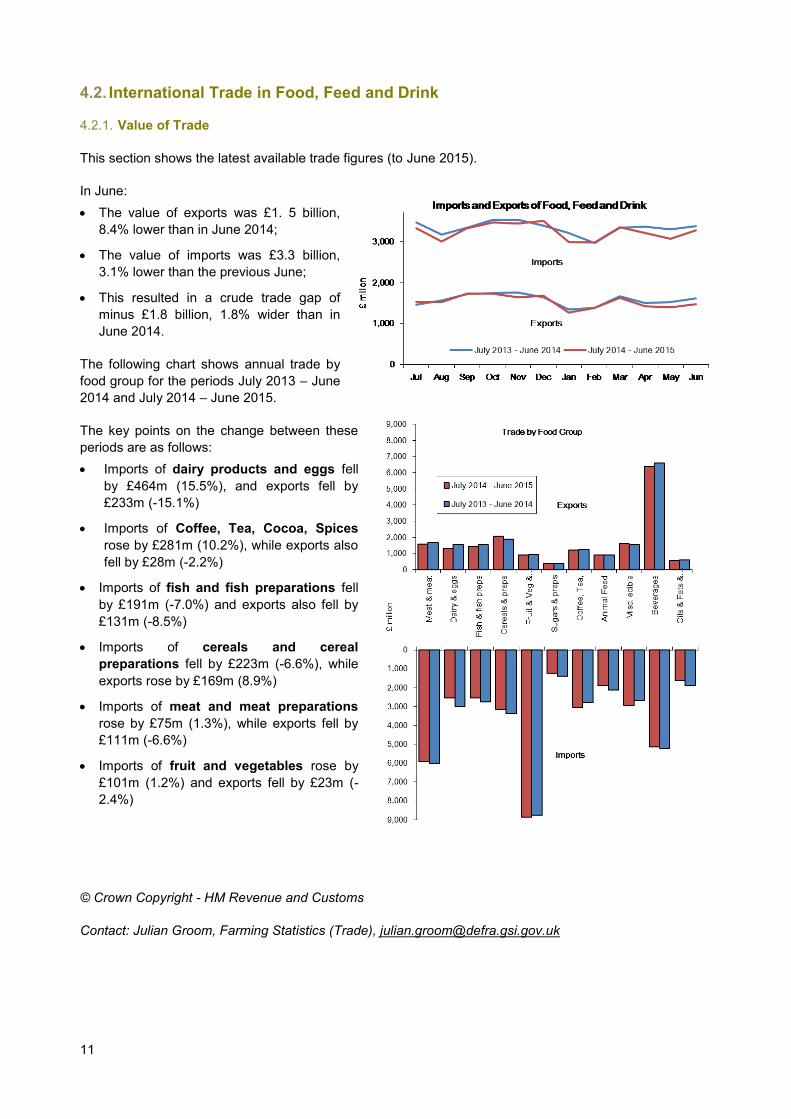
This section shows the latest available trade figures (to June 2015).
In June:
The value of exports was £1. 5 billion,
8.4% lower than in June 2014;
The value of imports was £3.3 billion,
3.1% lower than the previous June;
This resulted in a crude trade gap of
minus £1.8 billion, 1.8% wider than in
June 2014.
The following chart shows annual trade by
food group for the periods July 2013 – June
2014 and July 2014 – June 2015.
The key points on the change between these
periods are as follows:
Imports of dairy products and eggs fell
by £464m (15.5%), and exports fell by
£233m (-15.1%)
Imports of Coffee, Tea, Cocoa, Spices
rose by £281m (10.2%), while exports also
fell by £28m (-2.2%)
Imports of fish and fish preparations fell
by £191m (-7.0%) and exports also fell by
£131m (-8.5%)
Imports of cereals and cereal
preparations fell by £223m (-6.6%), while
exports rose by £169m (8.9%)
Imports of meat and meat preparations
rose by £75m (1.3%), while exports fell by
£111m (-6.6%)
Imports of fruit and vegetables rose by
£101m (1.2%) and exports fell by £23m (-
2.4%)
© Crown Copyright - HM Revenue and Customs
Contact: Julian Groom, Farming Statistics (Trade), [email protected]
12
Annex A: Dairy Briefing: August 2015
Summary
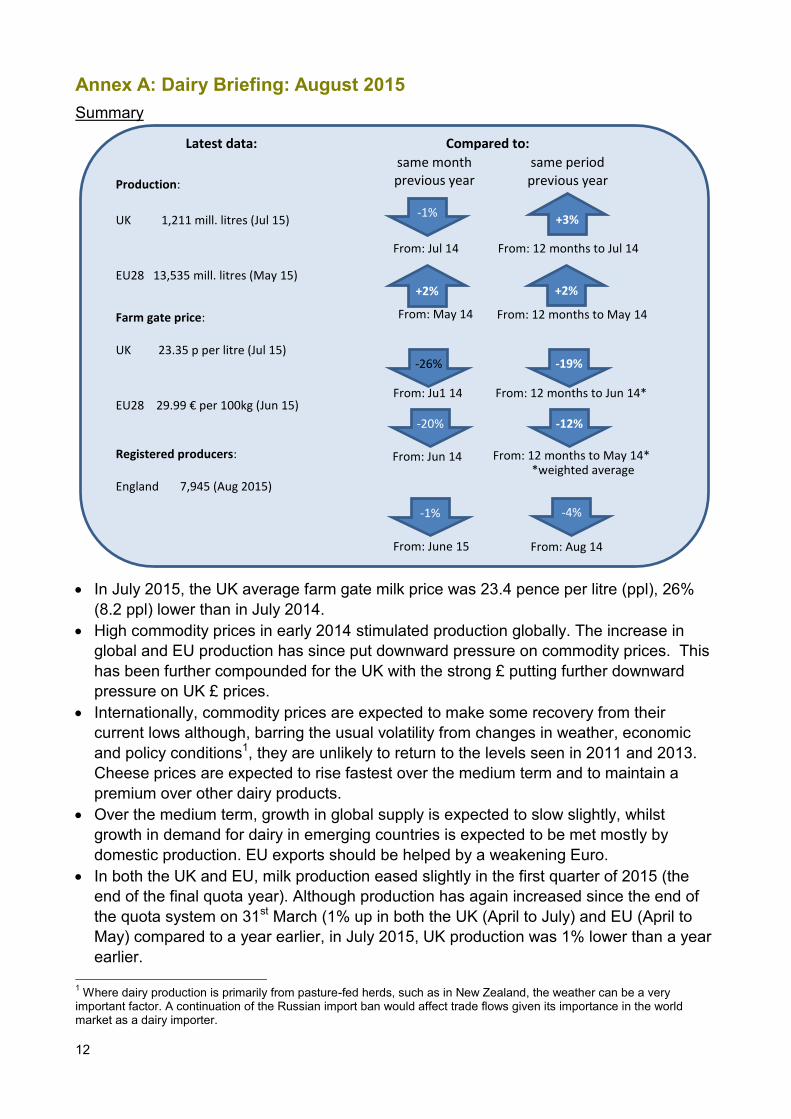
In July 2015, the UK average farm gate milk price was 23.4 pence per litre (ppl), 26%
(8.2 ppl) lower than in July 2014.
High commodity prices in early 2014 stimulated production globally. The increase in
global and EU production has since put downward pressure on commodity prices. This
has been further compounded for the UK with the strong £ putting further downward
pressure on UK £ prices.
Internationally, commodity prices are expected to make some recovery from their
current lows although, barring the usual volatility from changes in weather, economic
and policy conditions1, they are unlikely to return to the levels seen in 2011 and 2013.
Cheese prices are expected to rise fastest over the medium term and to maintain a
premium over other dairy products.
Over the medium term, growth in global supply is expected to slow slightly, whilst
growth in demand for dairy in emerging countries is expected to be met mostly by
domestic production. EU exports should be helped by a weakening Euro.
In both the UK and EU, milk production eased slightly in the first quarter of 2015 (the
end of the final quota year). Although production has again increased since the end of
the quota system on 31st March (1% up in both the UK (April to July) and EU (April to
May) compared to a year earlier, in July 2015, UK production was 1% lower than a year
earlier.
1 Where dairy production is primarily from pasture-fed herds, such as in New Zealand, the weather can be a very
important factor. A continuation of the Russian import ban would affect trade flows given its importance in the world market as a dairy importer.
Production:
UK 1,211 mill. litres (Jul 15)
EU28 13,535 mill. litres (May 15)
Farm gate price: UK 23.35 p per litre (Jul 15)
EU28 29.99 € per 100kg (Jun 15) Registered producers: England 7,945 (Aug 2015)
From: Jul 14
+3%
From: 12 months to Jul 14
Compared to:
same month previous year
same period previous year
From: May 14
+2%
From: 12 months to May 14
-26%
-20%
From: Ju1 14
From: Jun 14
From: 12 months to Jun 14*
*weighted average From: 12 months to May 14*
Latest data:
-12%
-19%
-4%
From: Aug 14 From: June 15
+2%
-1%
-1%
13
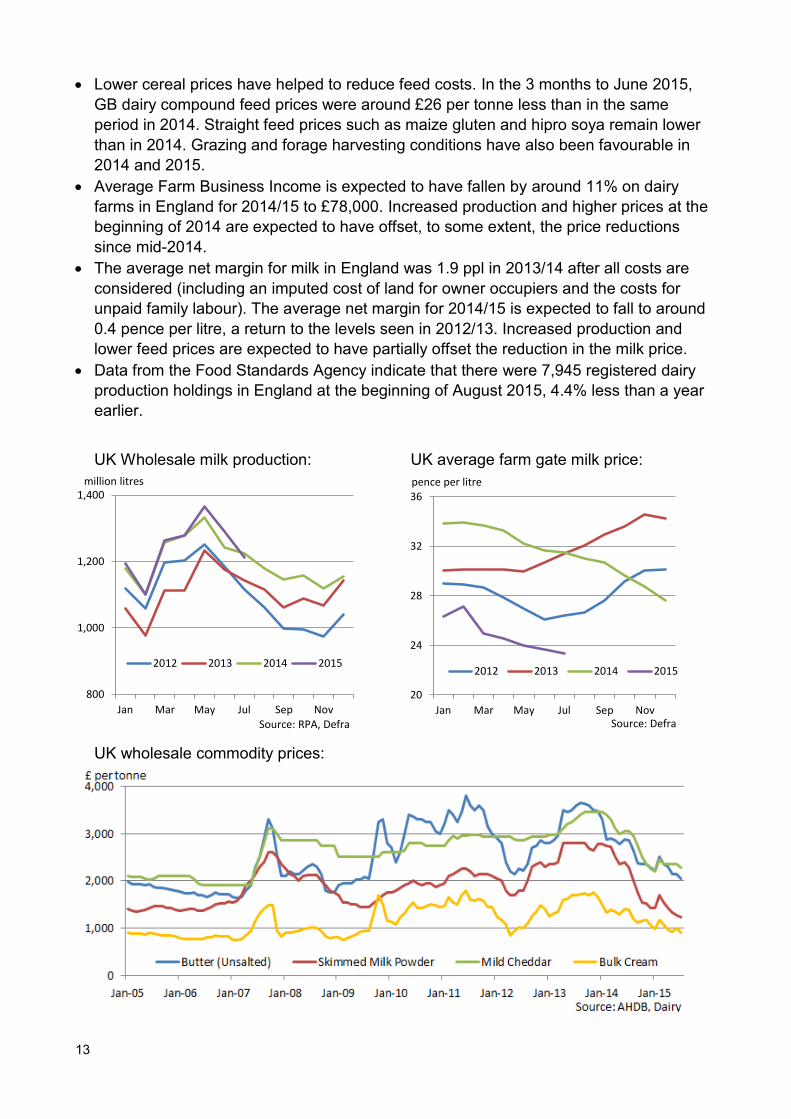
Lower cereal prices have helped to reduce feed costs. In the 3 months to June 2015,
GB dairy compound feed prices were around £26 per tonne less than in the same
period in 2014. Straight feed prices such as maize gluten and hipro soya remain lower
than in 2014. Grazing and forage harvesting conditions have also been favourable in
2014 and 2015.
Average Farm Business Income is expected to have fallen by around 11% on dairy
farms in England for 2014/15 to £78,000. Increased production and higher prices at the
beginning of 2014 are expected to have offset, to some extent, the price reductions
since mid-2014.
The average net margin for milk in England was 1.9 ppl in 2013/14 after all costs are
considered (including an imputed cost of land for owner occupiers and the costs for
unpaid family labour). The average net margin for 2014/15 is expected to fall to around
0.4 pence per litre, a return to the levels seen in 2012/13. Increased production and
lower feed prices are expected to have partially offset the reduction in the milk price.
Data from the Food Standards Agency indicate that there were 7,945 registered dairy
production holdings in England at the beginning of August 2015, 4.4% less than a year
earlier.
UK Wholesale milk production: UK average farm gate milk price:
UK wholesale commodity prices:
800
1,000
1,200
1,400
Jan Mar May Jul Sep Nov
2012 2013 2014 2015
million litres
Source: RPA, Defra
20
24
28
32
36
Jan Mar May Jul Sep Nov
2012 2013 2014 2015
pence per litre
Source: Defra
14
Chart A: UK average monthly milk prices
20
24
28
32
36
Jan Mar May Jul Sep Nov
2012 2013 2014 2015
pence per litre
Source: Defra
BACKGROUND DATA
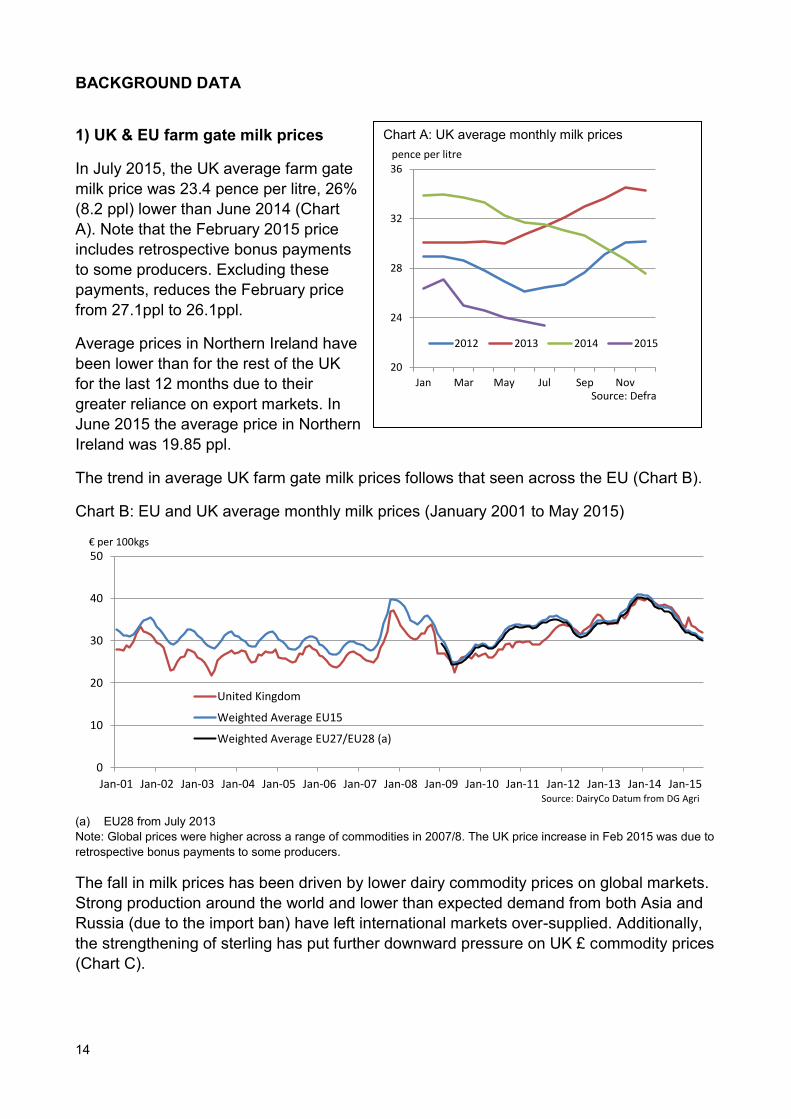
1) UK & EU farm gate milk prices
In July 2015, the UK average farm gate
milk price was 23.4 pence per litre, 26%
(8.2 ppl) lower than June 2014 (Chart
A). Note that the February 2015 price
includes retrospective bonus payments
to some producers. Excluding these
payments, reduces the February price
from 27.1ppl to 26.1ppl.
Average prices in Northern Ireland have
been lower than for the rest of the UK
for the last 12 months due to their
greater reliance on export markets. In
June 2015 the average price in Northern
Ireland was 19.85 ppl.
The trend in average UK farm gate milk prices follows that seen across the EU (Chart B).
Chart B: EU and UK average monthly milk prices (January 2001 to May 2015)
(a) EU28 from July 2013
Note: Global prices were higher across a range of commodities in 2007/8. The UK price increase in Feb 2015 was due to
retrospective bonus payments to some producers.
The fall in milk prices has been driven by lower dairy commodity prices on global markets.
Strong production around the world and lower than expected demand from both Asia and
Russia (due to the import ban) have left international markets over-supplied. Additionally,
the strengthening of sterling has put further downward pressure on UK £ commodity prices
(Chart C).
0
10
20
30
40
50
Jan-01 Jan-02 Jan-03 Jan-04 Jan-05 Jan-06 Jan-07 Jan-08 Jan-09 Jan-10 Jan-11 Jan-12 Jan-13 Jan-14 Jan-15
United Kingdom
Weighted Average EU15
Weighted Average EU27/EU28 (a)
€ per 100kgs
Source: DairyCo Datum from DG Agri
15
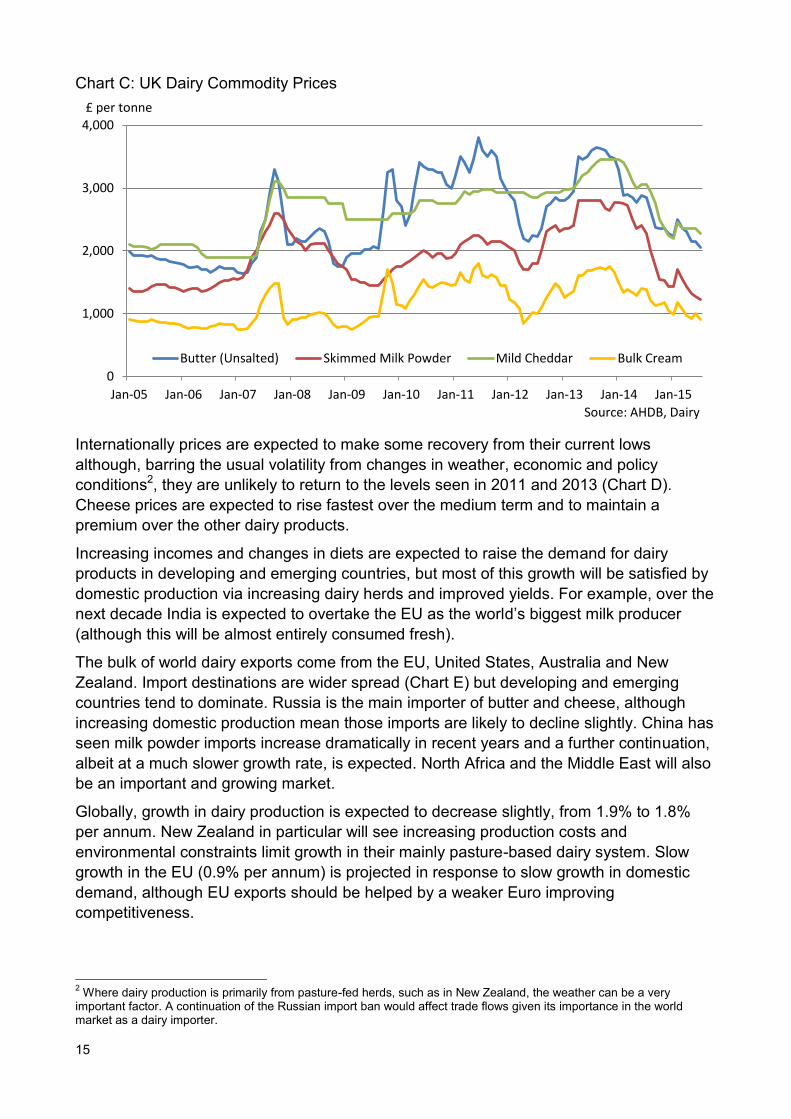
Chart C: UK Dairy Commodity Prices
Internationally prices are expected to make some recovery from their current lows
although, barring the usual volatility from changes in weather, economic and policy
conditions2, they are unlikely to return to the levels seen in 2011 and 2013 (Chart D).
Cheese prices are expected to rise fastest over the medium term and to maintain a
premium over the other dairy products.
Increasing incomes and changes in diets are expected to raise the demand for dairy
products in developing and emerging countries, but most of this growth will be satisfied by
domestic production via increasing dairy herds and improved yields. For example, over the
next decade India is expected to overtake the EU as the world’s biggest milk producer
(although this will be almost entirely consumed fresh).
The bulk of world dairy exports come from the EU, United States, Australia and New
Zealand. Import destinations are wider spread (Chart E) but developing and emerging
countries tend to dominate. Russia is the main importer of butter and cheese, although
increasing domestic production mean those imports are likely to decline slightly. China has
seen milk powder imports increase dramatically in recent years and a further continuation,
albeit at a much slower growth rate, is expected. North Africa and the Middle East will also
be an important and growing market.
Globally, growth in dairy production is expected to decrease slightly, from 1.9% to 1.8%
per annum. New Zealand in particular will see increasing production costs and
environmental constraints limit growth in their mainly pasture-based dairy system. Slow
growth in the EU (0.9% per annum) is projected in response to slow growth in domestic
demand, although EU exports should be helped by a weaker Euro improving
competitiveness.
2 Where dairy production is primarily from pasture-fed herds, such as in New Zealand, the weather can be a very
important factor. A continuation of the Russian import ban would affect trade flows given its importance in the world market as a dairy importer.
0
1,000
2,000
3,000
4,000
Jan-05 Jan-06 Jan-07 Jan-08 Jan-09 Jan-10 Jan-11 Jan-12 Jan-13 Jan-14 Jan-15
Butter (Unsalted) Skimmed Milk Powder Mild Cheddar Bulk Cream
£ per tonne
Source: AHDB, Dairy
16
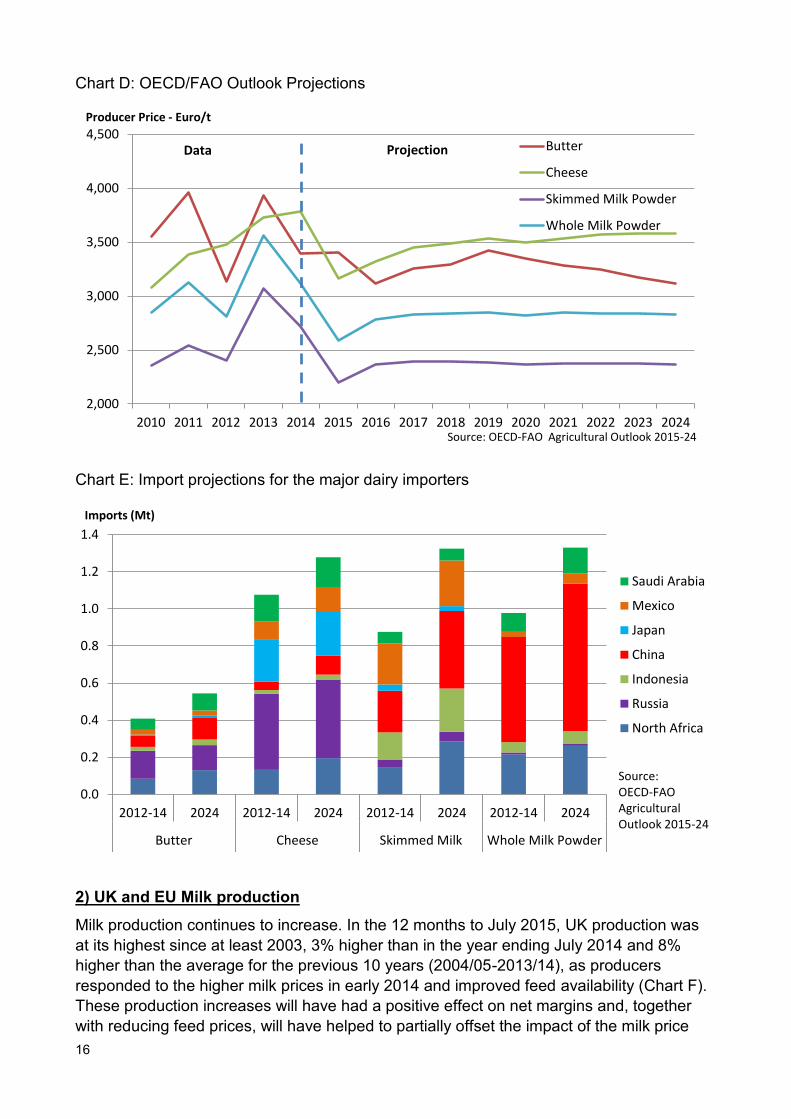
Chart D: OECD/FAO Outlook Projections
Chart E: Import projections for the major dairy importers
2) UK and EU Milk production
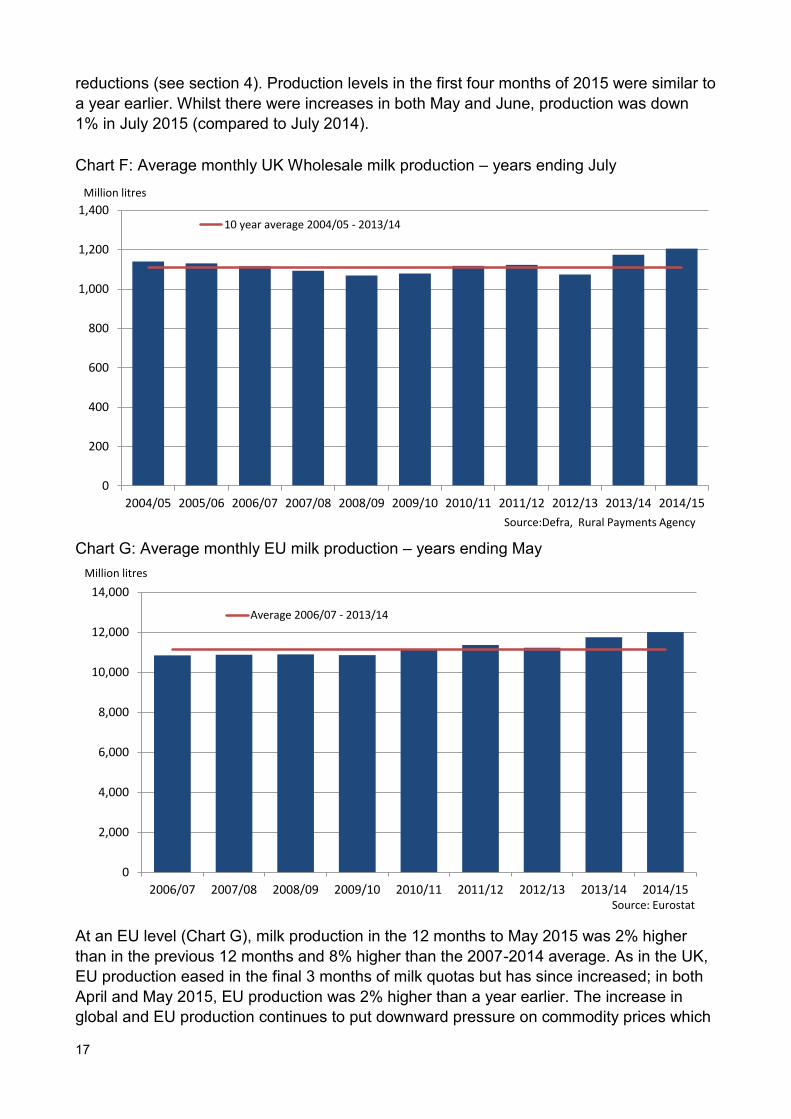
Milk production continues to increase. In the 12 months to July 2015, UK production was
at its highest since at least 2003, 3% higher than in the year ending July 2014 and 8%
higher than the average for the previous 10 years (2004/05-2013/14), as producers
responded to the higher milk prices in early 2014 and improved feed availability (Chart F).
These production increases will have had a positive effect on net margins and, together
with reducing feed prices, will have helped to partially offset the impact of the milk price
2,000
2,500
3,000
3,500
4,000
4,500
2010 2011 2012 2013 2014 2015 2016 2017 2018 2019 2020 2021 2022 2023 2024
Butter
Cheese
Skimmed Milk Powder
Whole Milk Powder
Data Projection
Source: OECD-FAO Agricultural Outlook 2015-24
Producer Price - Euro/t
0.0
0.2
0.4
0.6
0.8
1.0
1.2
1.4
2012-14 2024 2012-14 2024 2012-14 2024 2012-14 2024
Butter Cheese Skimmed MilkPowder
Whole Milk Powder
Saudi Arabia
Mexico
Japan
China
Indonesia
Russia
North Africa
Source: OECD-FAO Agricultural Outlook 2015-24
Imports (Mt)
17
reductions (see section 4). Production levels in the first four months of 2015 were similar to
a year earlier. Whilst there were increases in both May and June, production was down
1% in July 2015 (compared to July 2014).
Chart F: Average monthly UK Wholesale milk production – years ending July
Chart G: Average monthly EU milk production – years ending May
At an EU level (Chart G), milk production in the 12 months to May 2015 was 2% higher
than in the previous 12 months and 8% higher than the 2007-2014 average. As in the UK,
EU production eased in the final 3 months of milk quotas but has since increased; in both
April and May 2015, EU production was 2% higher than a year earlier. The increase in
global and EU production continues to put downward pressure on commodity prices which
0
200
400
600
800
1,000
1,200
1,400
2004/05 2005/06 2006/07 2007/08 2008/09 2009/10 2010/11 2011/12 2012/13 2013/14 2014/15
10 year average 2004/05 - 2013/14
Million litres
Source:Defra, Rural Payments Agency
0
2,000
4,000
6,000
8,000
10,000
12,000
14,000
2006/07 2007/08 2008/09 2009/10 2010/11 2011/12 2012/13 2013/14 2014/15
Average 2006/07 - 2013/14
Million litres
Source: Eurostat
18
Chart H: Average quarterly GB compound feed prices for Cattle and Calves
190
210
230
250
270
Jan to Mar Apr to Jun Jul to Sep Oct to Dec
2012 2013
2014 2015
£ per tonne
Chart I: Average net margin for milk production: England
-0.5
0.0
0.5
1.0
1.5
2.0
2.5
2009/10
2010/11
2011/12
2012/13
2013/14
2014/15f'cast
pence per litre
Source: Defra, Farm Business Survey
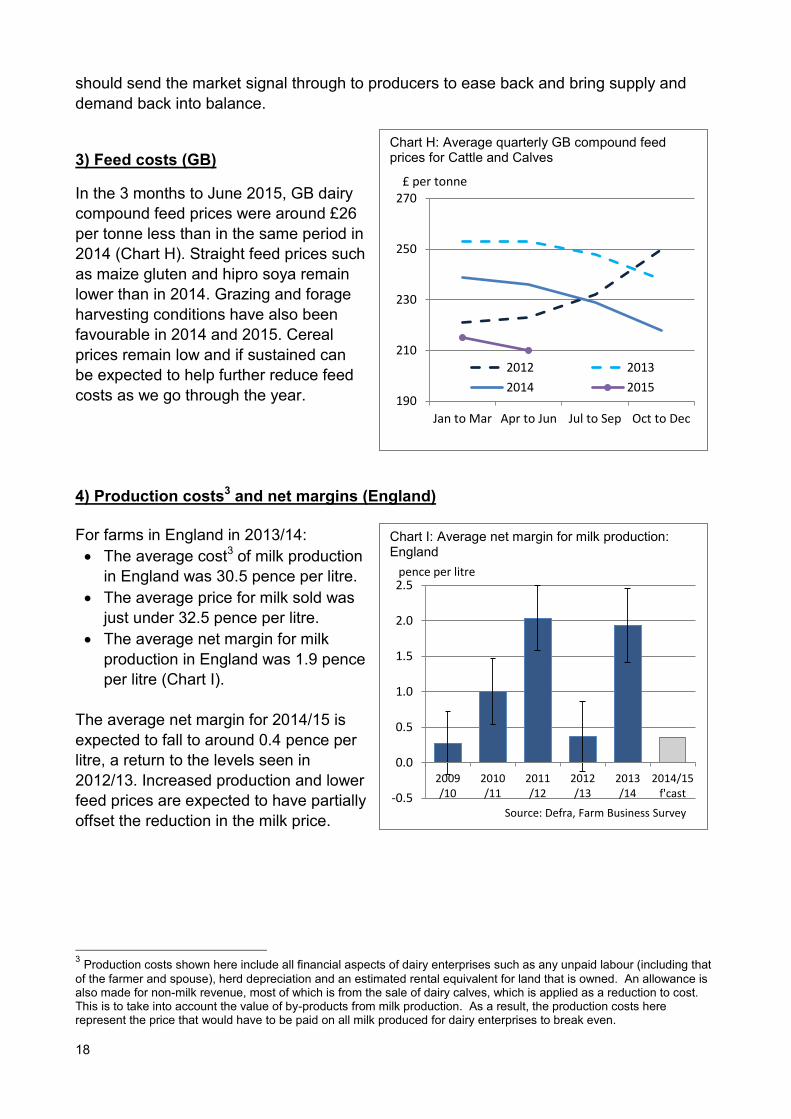
should send the market signal through to producers to ease back and bring supply and
demand back into balance.
3) Feed costs (GB)
In the 3 months to June 2015, GB dairy
compound feed prices were around £26
per tonne less than in the same period in
2014 (Chart H). Straight feed prices such
as maize gluten and hipro soya remain
lower than in 2014. Grazing and forage
harvesting conditions have also been
favourable in 2014 and 2015. Cereal
prices remain low and if sustained can
be expected to help further reduce feed
costs as we go through the year.
4) Production costs3 and net margins (England)
For farms in England in 2013/14:
The average cost3 of milk production
in England was 30.5 pence per litre.
The average price for milk sold was
just under 32.5 pence per litre.
The average net margin for milk
production in England was 1.9 pence
per litre (Chart I).
The average net margin for 2014/15 is
expected to fall to around 0.4 pence per
litre, a return to the levels seen in
2012/13. Increased production and lower
feed prices are expected to have partially
offset the reduction in the milk price.
3 Production costs shown here include all financial aspects of dairy enterprises such as any unpaid labour (including that
of the farmer and spouse), herd depreciation and an estimated rental equivalent for land that is owned. An allowance is also made for non-milk revenue, most of which is from the sale of dairy calves, which is applied as a reduction to cost. This is to take into account the value of by-products from milk production. As a result, the production costs here represent the price that would have to be paid on all milk produced for dairy enterprises to break even.
19
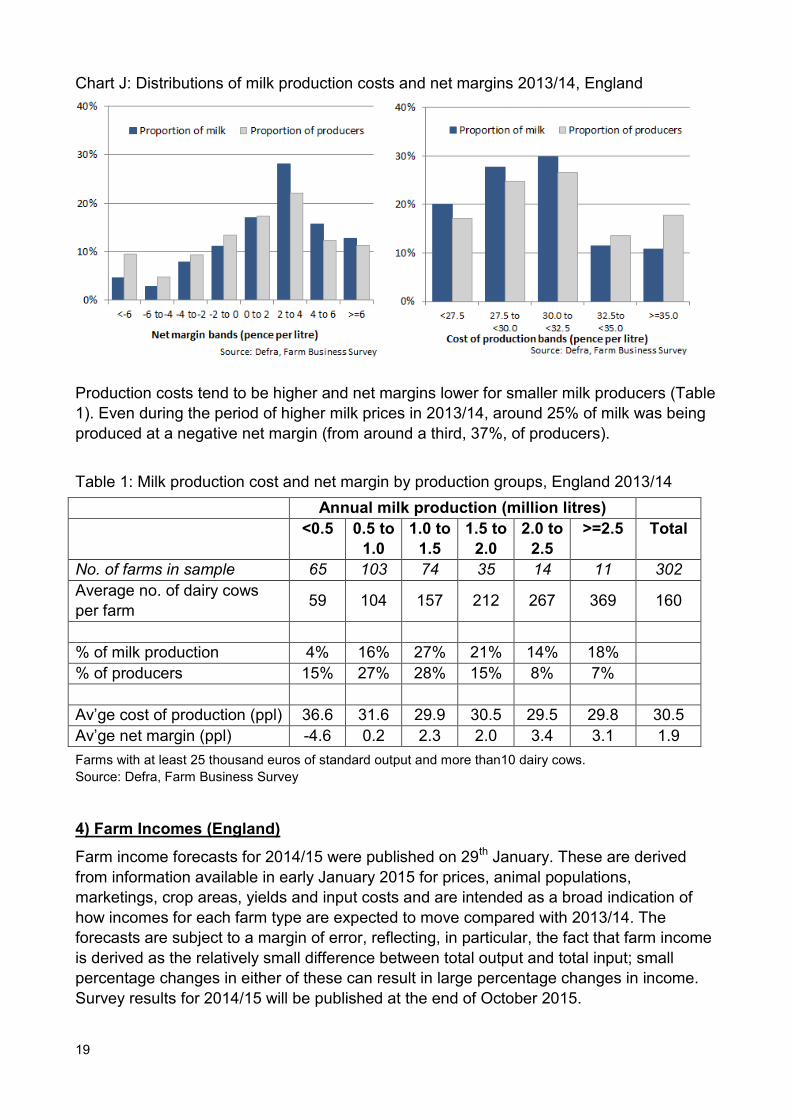
Chart J: Distributions of milk production costs and net margins 2013/14, England
Production costs tend to be higher and net margins lower for smaller milk producers (Table
1). Even during the period of higher milk prices in 2013/14, around 25% of milk was being
produced at a negative net margin (from around a third, 37%, of producers).
Table 1: Milk production cost and net margin by production groups, England 2013/14
Annual milk production (million litres)
<0.5 0.5 to
1.0
1.0 to
1.5
1.5 to
2.0
2.0 to
2.5
>=2.5 Total
No. of farms in sample 65 103 74 35 14 11 302
Average no. of dairy cows
per farm 59 104 157 212 267 369 160
% of milk production 4% 16% 27% 21% 14% 18%
% of producers 15% 27% 28% 15% 8% 7%
Av’ge cost of production (ppl) 36.6 31.6 29.9 30.5 29.5 29.8 30.5
Av’ge net margin (ppl) -4.6 0.2 2.3 2.0 3.4 3.1 1.9
Farms with at least 25 thousand euros of standard output and more than10 dairy cows.
Source: Defra, Farm Business Survey
4) Farm Incomes (England)
Farm income forecasts for 2014/15 were published on 29th January. These are derived
from information available in early January 2015 for prices, animal populations,
marketings, crop areas, yields and input costs and are intended as a broad indication of
how incomes for each farm type are expected to move compared with 2013/14. The
forecasts are subject to a margin of error, reflecting, in particular, the fact that farm income
is derived as the relatively small difference between total output and total input; small
percentage changes in either of these can result in large percentage changes in income.
Survey results for 2014/15 will be published at the end of October 2015.
20
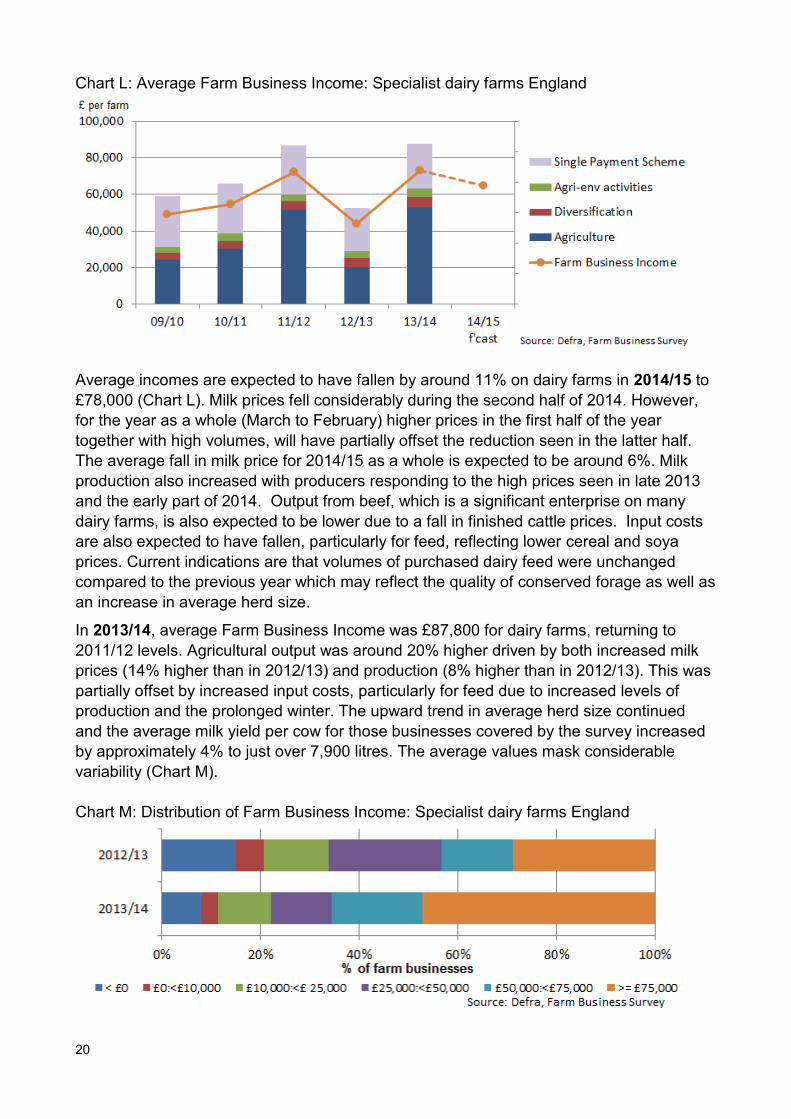
Chart L: Average Farm Business Income: Specialist dairy farms England
Average incomes are expected to have fallen by around 11% on dairy farms in 2014/15 to
£78,000 (Chart L). Milk prices fell considerably during the second half of 2014. However,
for the year as a whole (March to February) higher prices in the first half of the year
together with high volumes, will have partially offset the reduction seen in the latter half.
The average fall in milk price for 2014/15 as a whole is expected to be around 6%. Milk
production also increased with producers responding to the high prices seen in late 2013
and the early part of 2014. Output from beef, which is a significant enterprise on many
dairy farms, is also expected to be lower due to a fall in finished cattle prices. Input costs
are also expected to have fallen, particularly for feed, reflecting lower cereal and soya
prices. Current indications are that volumes of purchased dairy feed were unchanged
compared to the previous year which may reflect the quality of conserved forage as well as
an increase in average herd size.
In 2013/14, average Farm Business Income was £87,800 for dairy farms, returning to
2011/12 levels. Agricultural output was around 20% higher driven by both increased milk
prices (14% higher than in 2012/13) and production (8% higher than in 2012/13). This was
partially offset by increased input costs, particularly for feed due to increased levels of
production and the prolonged winter. The upward trend in average herd size continued
and the average milk yield per cow for those businesses covered by the survey increased
by approximately 4% to just over 7,900 litres. The average values mask considerable
variability (Chart M).
Chart M: Distribution of Farm Business Income: Specialist dairy farms England

21
5 Producer numbers
Data from the Food Standards Agency indicate that there were 7,945 registered dairy
production holdings in England at the beginning of August 2015, 4.4% less than a year
earlier (Chart N).
Chart N: Numbers of registered dairy production holdings: England
Contact: Lindsey Clothier, Farm Business Survey, [email protected]
0
4,000
8,000
12,000
16,000
Jan-04 Jan-05 Jan-06 Jan-07 Jan-08 Jan-09 Jan-10 Jan-11 Jan-12 Jan-13 Jan-14 Jan-15
Numbers of producers, England
Source: Dairyco Datum from Food Standards Agency