Embed Size (px)
Citation preview

68/69Annual Report 2011
Auditors’ Report &Audited Financial Statements ofGrameenphone Ltd.
Auditors’ Report to the shareholders ofGrameenphone Ltd.
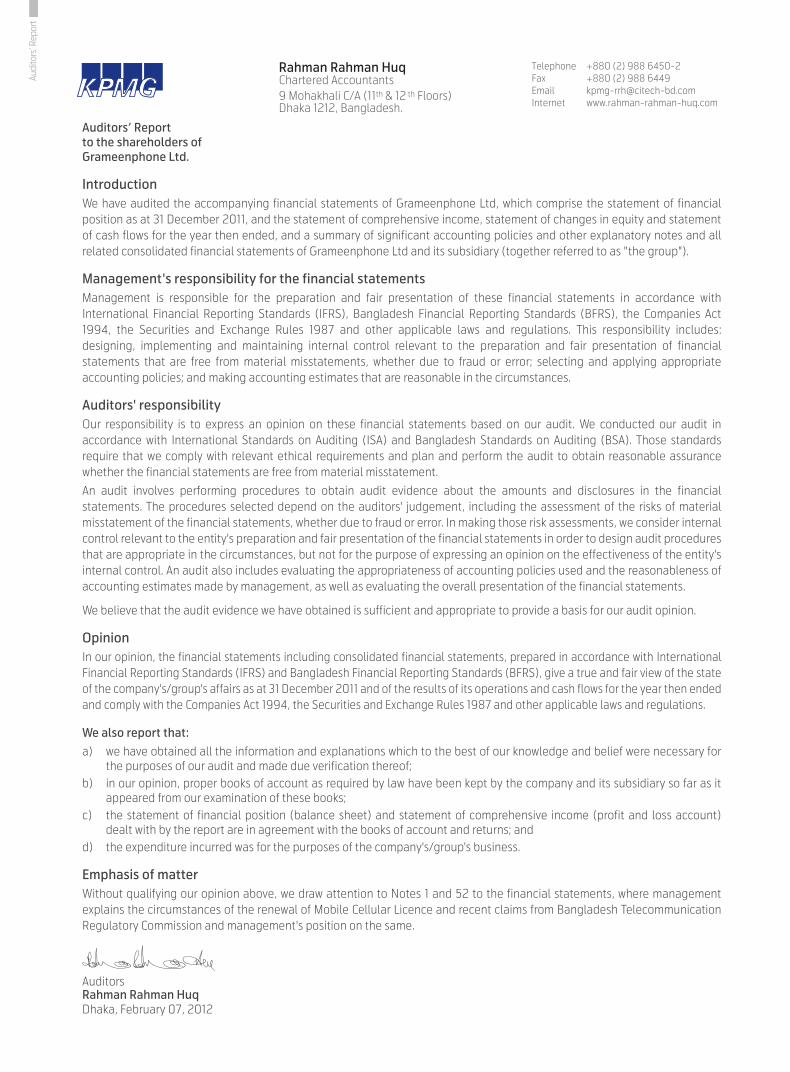
IntroductionWe have audited the accompanying financial statements of Grameenphone Ltd, which comprise the statement of financial position as at 31 December 2011, and the statement of comprehensive income, statement of changes in equity and statement of cash flows for the year then ended, and a summary of significant accounting policies and other explanatory notes and all related consolidated financial statements of Grameenphone Ltd and its subsidiary (together referred to as "the group").
Management's responsibility for the financial statementsManagement is responsible for the preparation and fair presentation of these financial statements in accordance with International Financial Reporting Standards (IFRS), Bangladesh Financial Reporting Standards (BFRS), the Companies Act 1994, the Securities and Exchange Rules 1987 and other applicable laws and regulations. This responsibility includes: designing, implementing and maintaining internal control relevant to the preparation and fair presentation of financial statements that are free from material misstatements, whether due to fraud or error; selecting and applying appropriate accounting policies; and making accounting estimates that are reasonable in the circumstances.
Auditors' responsibilityOur responsibility is to express an opinion on these financial statements based on our audit. We conducted our audit in accordance with International Standards on Auditing (ISA) and Bangladesh Standards on Auditing (BSA). Those standards require that we comply with relevant ethical requirements and plan and perform the audit to obtain reasonable assurance whether the financial statements are free from material misstatement.
An audit involves performing procedures to obtain audit evidence about the amounts and disclosures in the financial statements. The procedures selected depend on the auditors' judgement, including the assessment of the risks of material misstatement of the financial statements, whether due to fraud or error. In making those risk assessments, we consider internal control relevant to the entity's preparation and fair presentation of the financial statements in order to design audit procedures that are appropriate in the circumstances, but not for the purpose of expressing an opinion on the effectiveness of the entity's internal control. An audit also includes evaluating the appropriateness of accounting policies used and the reasonableness of accounting estimates made by management, as well as evaluating the overall presentation of the financial statements.
We believe that the audit evidence we have obtained is sufficient and appropriate to provide a basis for our audit opinion.
OpinionIn our opinion, the financial statements including consolidated financial statements, prepared in accordance with International Financial Reporting Standards (IFRS) and Bangladesh Financial Reporting Standards (BFRS), give a true and fair view of the state of the company's/group's affairs as at 31 December 2011 and of the results of its operations and cash flows for the year then ended and comply with the Companies Act 1994, the Securities and Exchange Rules 1987 and other applicable laws and regulations.
We also report that:a) we have obtained all the information and explanations which to the best of our knowledge and belief were necessary for
the purposes of our audit and made due verification thereof;b) in our opinion, proper books of account as required by law have been kept by the company and its subsidiary so far as it
appeared from our examination of these books;c) the statement of financial position (balance sheet) and statement of comprehensive income (profit and loss account)
dealt with by the report are in agreement with the books of account and returns; andd) the expenditure incurred was for the purposes of the company's/group's business.
Emphasis of matterWithout qualifying our opinion above, we draw attention to Notes 1 and 52 to the financial statements, where management explains the circumstances of the renewal of Mobile Cellular Licence and recent claims from Bangladesh Telecommunication Regulatory Commission and management's position on the same.
AuditorsRahman Rahman HuqDhaka, February 07, 2012
Audi
tors
’ Rep
ort

70/71Annual Report 2011
1 January 2010Taka
31 December 2010Taka
31 December 2011Taka
Grameenphone Ltd.Consolidated Statement of Financial Positionas at 31 December 2011
Non current assets Property, plant and equipment, net 4 69,461,932,244 71,696,092,118 79,287,993,919 Intangible assets, net 5 7,021,940,747 6,991,416,098 7,681,126,893 Long term deposit 7 - 12,594,949 11,635,675 76,483,872,991 78,700,103,165 86,980,756,487Current assets Inventories 8 354,023,249 834,355,326 430,870,209 Deferred cost of connection revenue 9 422,857,544 484,842,481 483,550,116 Accounts receivable, net 10 5,361,944,431 5,247,945,772 4,697,066,162 Other receivables 11 916,325,024 928,020,269 762,323,315 Advances, deposits and prepayments 12 17,129,182,496 1,621,637,839 1,206,613,917 Short term investment 13 181,856,969 2,753,729,110 500,000,000 Cash and cash equivalents 14 8,054,596,992 18,931,502,552 14,101,313,087 32,420,786,705 30,802,033,349 22,181,736,806Total assets 108,904,659,696 109,502,136,514 109,162,493,293Equity and LiabilitiesEquity attributable to owners of the company Share capital 15 13,503,000,220 13,503,000,220 13,503,000,220 Share premium 16 7,840,225,942 7,840,225,942 7,840,225,942 Capital reserve 17 14,446,452 14,446,452 14,446,452 Deposit from shareholders 18 1,880,178 1,880,178 1,880,178 General reserve 19 2,139,729,365 2,139,729,365 2,139,729,365 Retained earnings 15,383,607,640 26,874,256,053 28,996,754,822 38,882,889,797 50,373,538,210 52,496,036,979Non controlling interest 20 80 268 -Total Equity 38,882,889,877 50,373,538,478 52,496,036,979Non current liabilities Loans and borrowings, net of current portion - - 917,924,127 Deposit from agents and subscribers 21 455,775,978 444,639,879 440,948,191 Finance lease obligation 22 5,019,805,838 5,019,805,838 5,019,805,838 Deferred tax liabilities 23 10,242,988,130 11,201,083,512 13,505,914,117 Long term provisions 24 104,716,420 162,876,392 171,487,489 15,823,286,366 16,828,405,621 20,056,079,762Current liabilities Accounts payable 25 10,840,334,043 5,296,447,777 4,865,966,538 Payable to government and autonomous bodies 26 4,814,105,945 4,860,343,669 4,161,431,025 Unearned revenue 27 2,486,767,295 2,248,977,889 1,679,152,352 Loans and borrowings - current portion - - 1,036,943,071 VAT payable 28 2,699,959,350 2,451,869,531 2,234,779,133 Income tax provision 29 17,806,349,160 13,396,693,877 9,887,067,874 Accrued interest 30 226,869,648 155,699,144 66,356,035 Other liabilities 31 98,549,866 57,641,141 126,480,541 Deferred connection revenue 32 542,973,536 581,904,397 541,731,927 Provisions 33 14,682,574,610 13,250,614,990 12,010,468,056 54,198,483,453 42,300,192,415 36,610,376,552Total equity and liabilities 108,904,659,696 109,502,136,514 109,162,493,293
The annexed notes 1 to 53 form an integral part of these financial statements.
NotesAssets
Director Director Chief Executive Officer Company Secretary
As per our report of same date
Auditors
Dhaka, February 07, 2012

2011Taka
2010Taka
Grameenphone Ltd.Consolidated Statement of Comprehensive Incomefor the year ended 31 December 2011
Revenue 34 89,059,616,926 74,733,076,434Cost of network operations Direct cost of network revenue 35 (17,652,504,844) (15,065,442,394) Network operation and maintenance expenses 36 (6,486,131,957) (5,605,681,662) Depreciation and amortisation 37 (13,700,217,335) (15,331,945,675) (37,838,854,136) (36,003,069,731)Gross profit 51,220,762,790 38,730,006,703
Other income, net 38 81,649,697 60,416,193
Operating expenses General and administrative expenses 39 (9,309,840,841) (8,634,334,234) Selling and distribution expenses 40 (8,082,356,764) (8,487,233,821) Depreciation and amortisation 37 (1,337,717,281) (1,461,626,378) (18,729,914,886) (18,583,194,433)Operating profit 32,572,497,601 20,207,228,463Finance income/(expense), net 41 989,596,123 593,473,110Foreign exchange gain/(loss) 42 (648,552,533) 99,963,540Gain on disposal of property, plant and equipment 43 92,720,963 12,091,065Profit before income tax 33,006,262,154 20,912,756,178
Income tax expenses 44 (14,115,160,260) (10,207,404,570)Profit for the year 18,891,101,894 10,705,351,608
Other comprehensive income - -Total comprehensive income for the year 18,891,101,894 10,705,351,608
Total comprehensive income attributable to Owners of the company 18,891,102,082 10,705,351,440 Non controlling interest (188) 168 18,891,101,894 10,705,351,608
Earnings per share Basic and diluted earnings per share (par value Tk 10 each) 45 13.99 7.93
The annexed notes 1 to 53 form an integral part of these financial statements.
Notes
Director Director Chief Executive Officer Company Secretary
As per our report of same date
Auditors
Dhaka, February 07, 2012

72/73Annual Report 2011
Gra
mee
npho
ne L
td.
Cons
olid
ated
Sta
tem
ent o
f Cha
nges
in E
quity
for t
he y
ear e
nded
31 D
ecem
ber 2
011
Bala
nce
as a
t 1 Ja
nuar
y 20
10
13,5
03,
00
0,2
20
7,84
0,2
25,9
42
14,4
46,4
52
1,880
,178
2,13
9,72
9,36
5 26
,655
,044
,251
-
50,15
4,32
6,40
8
Adju
stm
ent f
or re
vers
al o
f inc
ome
tax p
rovis
ion
(Not
e 29
) -
- -
- -
2,34
1,710
,571
-
2,34
1,710
,571
Adju
sted
bal
ance
as
at 1
Janu
ary
2010
13
,50
3,0
00
,220
7,
840
,225
,942
14
,446
,452
1,
880
,178
2,
139
,729
,36
5 28
,99
6,7
54,8
22
- 52
,49
6,0
36,9
79
Tran
sact
ions
with
the
shar
ehol
ders
:
I
ssua
nce
of s
hare
of G
ram
eenp
hone
IT L
td.
- -
- -
- -
100
10
0
F
inal
div
iden
d fo
r 20
09
- -
- -
- (8
,101,8
00
,132)
-
(8,10
1,80
0,13
2)
I
nter
im d
ivid
end
for 2
010
-
- -
- -
(4,7
26,0
50,0
77)
- (4
,726
,050
,077
)
Tota
l com
preh
ensi
ve in
com
e fo
r 20
10
P
rofit
for t
he y
ear
- -
- -
- 10
,70
5,35
1,440
16
8 10
,70
5,35
1,60
8
O
ther
com
preh
ensi
ve in
com
e -
- -
- -
- -
-
Bala
nce
as a
t 31 D
ecem
ber 2
010
13
,50
3,0
00
,220
7,
840
,225
,942
14
,446
,452
1,
880
,178
2,
139
,729
,36
5 26
,874
,256
,053
26
8 50
,373
,538
,478
Tran
sact
ions
with
the
shar
ehol
ders
:
F
inal
div
iden
d fo
r 20
10
- -
- -
- (1
1,477
,550
,187)
-
(11,4
77,5
50,18
7)
I
nter
im d
ivid
end
for 2
011
-
- -
- -
(18,
904,
200
,30
8)
- (1
8,90
4,20
0,3
08)
Tota
l com
preh
ensi
ve in
com
e fo
r 20
11
P
rofit
for t
he y
ear
- -
- -
- 18
,891
,102,
082
(1
88)
18,8
91,10
1,894
O
ther
com
preh
ensi
ve in
com
e -
- -
- -
- -
-
Bala
nce
as a
t 31 D
ecem
ber 2
011
13
,50
3,0
00
,220
7,
840
,225
,942
14
,446
,452
1,
880
,178
2,
139
,729
,36
5 15
,383
,60
7,6
40
80
38,8
82,8
89,8
77
The
anne
xed
note
s 1 t
o 53
form
an
inte
gral
par
t of t
hese
fina
ncia
l sta
tem
ents
.
Shar
e
capi
tal
Taka
Shar
e
prem
ium
Taka
Capi
tal
rese
rve
Taka
Dep
osit
from
shar
ehol
ders
Taka
Gen
eral
rese
rve
Taka
Reta
ined
earn
ings
Taka
Non
con
trol
ling
inte
rest
Taka
Tota
l
Taka

2011Taka
2010Taka
Grameenphone Ltd.Consolidated Statement of Cash Flowsfor the year ended 31 December 2011
Cash flows from operating activities
Cash receipts from performance of services/sales 89,180,282,352 74,646,490,419
Payroll and other payments to employees (5,786,478,150) (6,087,982,677)
Payments to suppliers, contractors and others (33,346,912,822) (28,986,804,748)
Finance income received 2,092,898,027 1,337,225,663
Finance expenses paid for short term loans (137,533,205) -
Other finance expenses paid (708,726,155) (630,004,573)
Income tax paid (10,663,600,361) (9,002,609,172)
(48,550,352,666) (43,370,175,507)
Net cash flow from operating activities 40,629,929,686 31,276,314,912
Cash flows from investing activities
Payment for acquisition of property, plant and equipment (9,405,803,195) (8,774,249,937)
Proceeds from sale of property, plant and equipment 45,346,713 59,884,296
Payment for acquisition of intangible assets (777,252,430) (648,524,052)
Payment of first instalment for 2G licence renewal (13,584,598,000) -
Proceeds from/(investment in) long term deposits 12,594,949 (959,274)
Short term investments 2,571,872,141 (2,253,729,110)
Net cash used in investing activities (21,137,839,822) (11,617,578,077)
Cash flows from financing activities
Payment of long term borrowings - (1,950,443,211)
Payment of dividend (30,365,699,043) (12,791,086,003)
Proceeds from issue of share to non controlling interest - 100
Amount refunded to IPO share applicants (3,296,381) (87,018,256)
Net cash used in financing activities (30,368,995,424) (14,828,547,370)
Net changes in cash and cash equivalents (10,876,905,560) 4,830,189,465
Cash and cash equivalents at 1 January 18,931,502,552 14,101,313,087
Cash and cash equivalents at 31 December 8,054,596,992 18,931,502,552
The annexed notes 1 to 53 form an integral part of these financial statements.
74/75Annual Report 2011
1 January 2010Taka
31 December 2010Taka
31 December 2011Taka
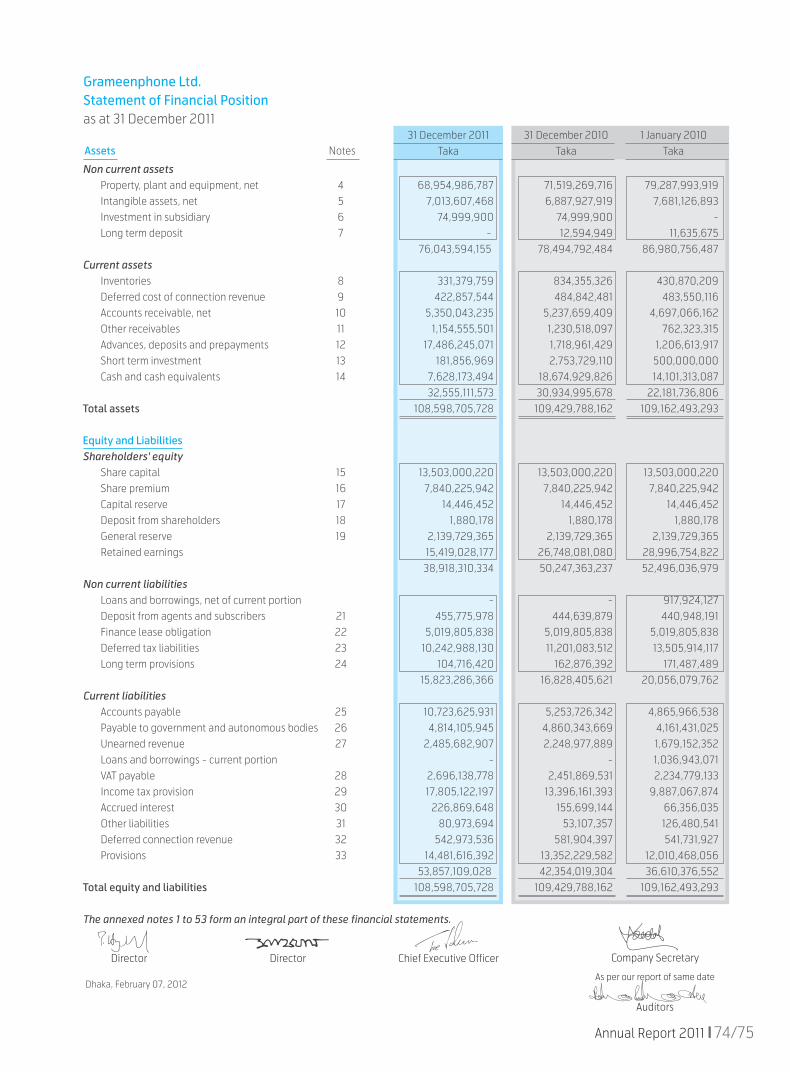
Grameenphone Ltd.Statement of Financial Positionas at 31 December 2011
Non current assets Property, plant and equipment, net 4 68,954,986,787 71,519,269,716 79,287,993,919 Intangible assets, net 5 7,013,607,468 6,887,927,919 7,681,126,893 Investment in subsidiary 6 74,999,900 74,999,900 - Long term deposit 7 - 12,594,949 11,635,675 76,043,594,155 78,494,792,484 86,980,756,487Current assets Inventories 8 331,379,759 834,355,326 430,870,209 Deferred cost of connection revenue 9 422,857,544 484,842,481 483,550,116 Accounts receivable, net 10 5,350,043,235 5,237,659,409 4,697,066,162 Other receivables 11 1,154,555,501 1,230,518,097 762,323,315 Advances, deposits and prepayments 12 17,486,245,071 1,718,961,429 1,206,613,917 Short term investment 13 181,856,969 2,753,729,110 500,000,000 Cash and cash equivalents 14 7,628,173,494 18,674,929,826 14,101,313,087 32,555,111,573 30,934,995,678 22,181,736,806Total assets 108,598,705,728 109,429,788,162 109,162,493,293
Equity and LiabilitiesShareholders' equity Share capital 15 13,503,000,220 13,503,000,220 13,503,000,220 Share premium 16 7,840,225,942 7,840,225,942 7,840,225,942 Capital reserve 17 14,446,452 14,446,452 14,446,452 Deposit from shareholders 18 1,880,178 1,880,178 1,880,178 General reserve 19 2,139,729,365 2,139,729,365 2,139,729,365 Retained earnings 15,419,028,177 26,748,081,080 28,996,754,822 38,918,310,334 50,247,363,237 52,496,036,979Non current liabilities Loans and borrowings, net of current portion - - 917,924,127 Deposit from agents and subscribers 21 455,775,978 444,639,879 440,948,191 Finance lease obligation 22 5,019,805,838 5,019,805,838 5,019,805,838 Deferred tax liabilities 23 10,242,988,130 11,201,083,512 13,505,914,117 Long term provisions 24 104,716,420 162,876,392 171,487,489 15,823,286,366 16,828,405,621 20,056,079,762Current liabilities Accounts payable 25 10,723,625,931 5,253,726,342 4,865,966,538 Payable to government and autonomous bodies 26 4,814,105,945 4,860,343,669 4,161,431,025 Unearned revenue 27 2,485,682,907 2,248,977,889 1,679,152,352 Loans and borrowings - current portion - - 1,036,943,071 VAT payable 28 2,696,138,778 2,451,869,531 2,234,779,133 Income tax provision 29 17,805,122,197 13,396,161,393 9,887,067,874 Accrued interest 30 226,869,648 155,699,144 66,356,035 Other liabilities 31 80,973,694 53,107,357 126,480,541 Deferred connection revenue 32 542,973,536 581,904,397 541,731,927 Provisions 33 14,481,616,392 13,352,229,582 12,010,468,056 53,857,109,028 42,354,019,304 36,610,376,552Total equity and liabilities 108,598,705,728 109,429,788,162 109,162,493,293
The annexed notes 1 to 53 form an integral part of these financial statements.
NotesAssets
Director Director Chief Executive Officer Company Secretary
As per our report of same date
Auditors
Dhaka, February 07, 2012
2011Taka
2010Taka
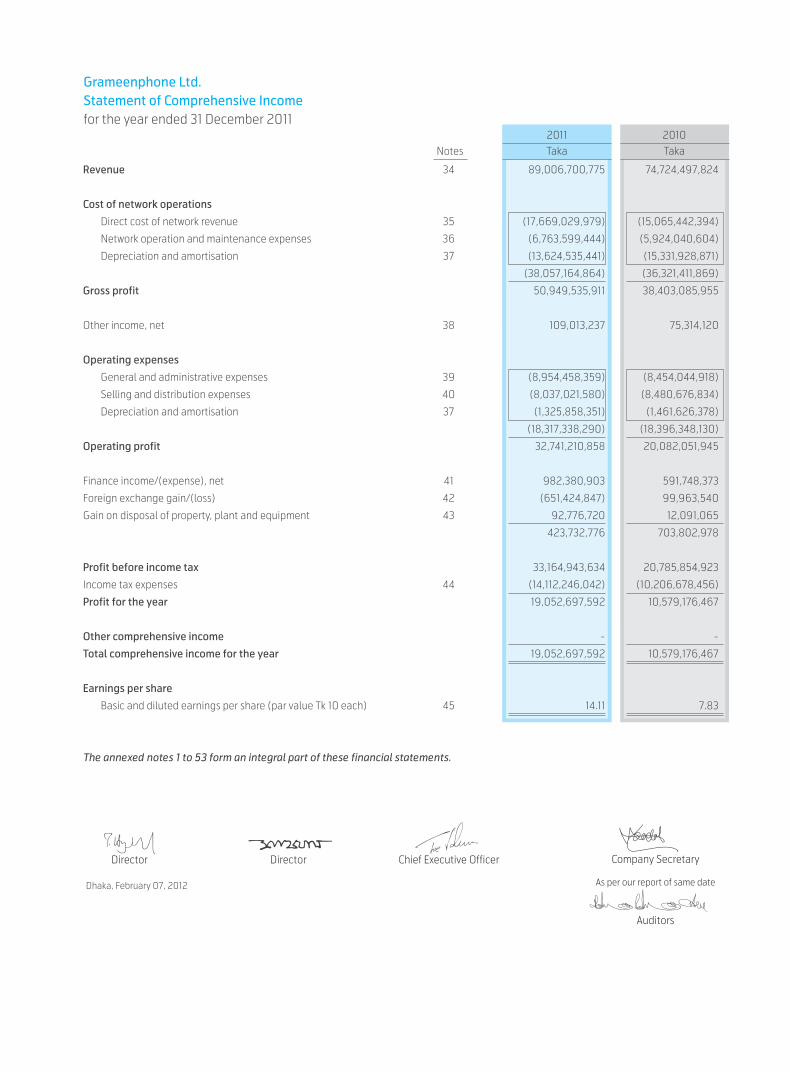
Grameenphone Ltd.Statement of Comprehensive Incomefor the year ended 31 December 2011
Revenue 34 89,006,700,775 74,724,497,824
Cost of network operations
Direct cost of network revenue 35 (17,669,029,979) (15,065,442,394)
Network operation and maintenance expenses 36 (6,763,599,444) (5,924,040,604)
Depreciation and amortisation 37 (13,624,535,441) (15,331,928,871)
(38,057,164,864) (36,321,411,869)
Gross profit 50,949,535,911 38,403,085,955
Other income, net 38 109,013,237 75,314,120
Operating expenses
General and administrative expenses 39 (8,954,458,359) (8,454,044,918)
Selling and distribution expenses 40 (8,037,021,580) (8,480,676,834)
Depreciation and amortisation 37 (1,325,858,351) (1,461,626,378)
(18,317,338,290) (18,396,348,130)
Operating profit 32,741,210,858 20,082,051,945
Finance income/(expense), net 41 982,380,903 591,748,373
Foreign exchange gain/(loss) 42 (651,424,847) 99,963,540
Gain on disposal of property, plant and equipment 43 92,776,720 12,091,065
423,732,776 703,802,978
Profit before income tax 33,164,943,634 20,785,854,923
Income tax expenses 44 (14,112,246,042) (10,206,678,456)
Profit for the year 19,052,697,592 10,579,176,467
Other comprehensive income - -
Total comprehensive income for the year 19,052,697,592 10,579,176,467
Earnings per share
Basic and diluted earnings per share (par value Tk 10 each) 45 14.11 7.83
The annexed notes 1 to 53 form an integral part of these financial statements.
Notes
Director Director Chief Executive Officer Company Secretary
As per our report of same date
Auditors
Dhaka, February 07, 2012
76/77Annual Report 2011
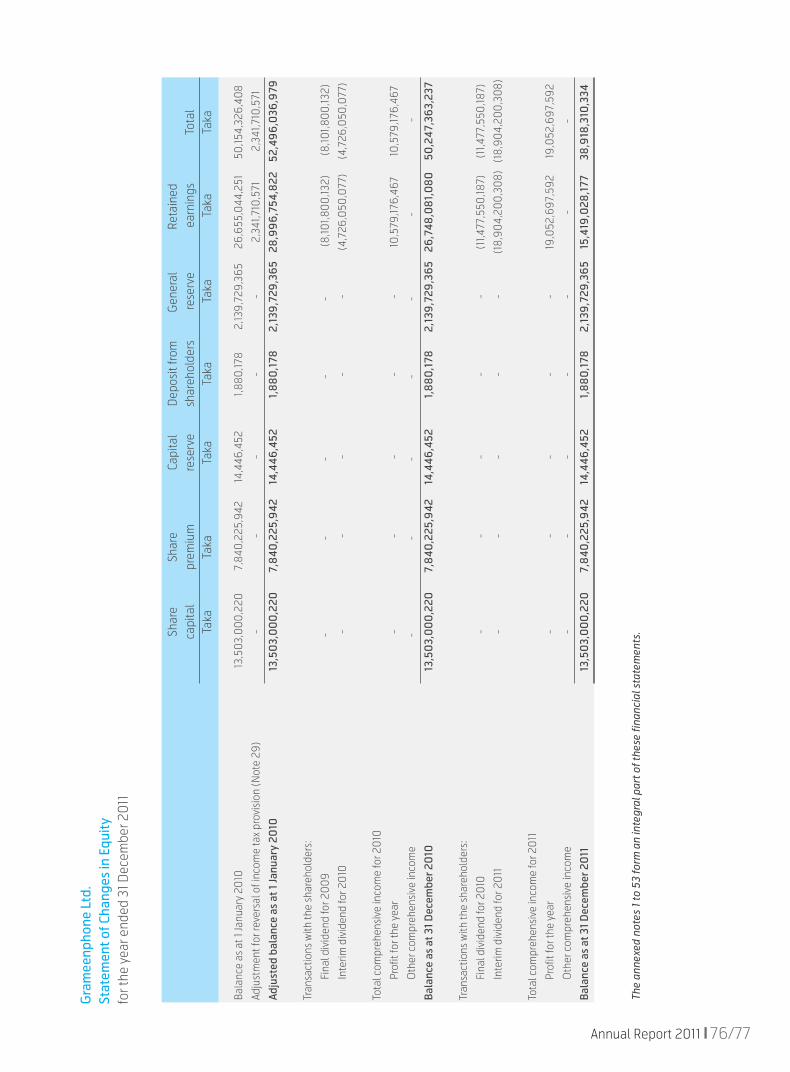
Gra
mee
npho
ne L
td.
Stat
emen
t of C
hang
es in
Equ
ityfo
r the
yea
r end
ed 3
1 Dec
embe
r 20
11
Bala
nce
as a
t 1 Ja
nuar
y 20
10
13
,50
3,0
00
,220
7,
840
,225
,942
14
,446
,452
1,8
80,17
8 2,
139,
729,
365
26,6
55,0
44,2
51
50,15
4,32
6,40
8
Adju
stm
ent f
or re
vers
al o
f inc
ome
tax
prov
isio
n (N
ote
29)
-
- -
- -
2,34
1,710
,571
2,
341,7
10,5
71
Adju
sted
bal
ance
as
at 1
Janu
ary
2010
13,5
03,
00
0,2
20
7,84
0,2
25,9
42
14,4
46,4
52
1,88
0,1
78
2,13
9,7
29,3
65
28,9
96
,754
,822
52
,49
6,0
36,9
79
Tran
sact
ions
with
the
shar
ehol
ders
:
Fi
nal d
ivid
end
for 2
00
9
-
-
-
-
-
(8,10
1,80
0,13
2)
(8,10
1,80
0,13
2)
In
terim
div
iden
d fo
r 20
10
-
- -
- -
(4,7
26,0
50,0
77)
(4,7
26,0
50,0
77)
Tota
l com
preh
ensi
ve in
com
e fo
r 20
10
Pr
ofit
for t
he y
ear
-
- -
- -
10,5
79,17
6,46
7 10
,579
,176,
467
O
ther
com
preh
ensi
ve in
com
e
-
-
-
-
-
-
-
Bala
nce
as a
t 31 D
ecem
ber 2
010
13,5
03,
00
0,2
20
7,84
0,2
25,9
42
14,4
46,4
52
1,88
0,1
78
2,13
9,7
29,3
65
26,7
48,0
81,0
80
50,2
47,3
63,
237
Tran
sact
ions
with
the
shar
ehol
ders
:
Fi
nal d
ivid
end
for 2
010
- -
- -
- (1
1,477
,550
,187)
(1
1,477
,550
,187)
In
terim
div
iden
d fo
r 20
11
-
- -
- -
(18,
904,
200
,30
8)
(18,
904,
200
,30
8)
Tota
l com
preh
ensi
ve in
com
e fo
r 20
11
Pr
ofit
for t
he y
ear
-
- -
- -
19,0
52,6
97,5
92
19,0
52,6
97,5
92
O
ther
com
preh
ensi
ve in
com
e
- -
- -
- -
-
Bala
nce
as a
t 31 D
ecem
ber 2
011
13,5
03,
00
0,2
20
7,84
0,2
25,9
42
14,4
46,4
52
1,88
0,1
78
2,13
9,7
29,3
65
15,4
19,0
28,1
77
38,9
18,3
10,3
34
The
anne
xed
note
s 1 t
o 53
form
an
inte
gral
par
t of t
hese
fina
ncia
l sta
tem
ents
.
Sh
are
Shar
e Ca
pita
l D
epos
it fro
m
Gen
eral
Re
tain
ed
ca
pita
l pr
emiu
m
rese
rve
shar
ehol
ders
re
serv
e ea
rnin
gs
Tota
l
Taka
Ta
ka
Taka
Ta
ka
Taka
Ta
ka
Taka

2011Taka
2010Taka
Grameenphone Ltd.Statement of Cash Flowsfor the year ended 31 December 2011
Cash flows from operating activities
Cash receipts from performance of services/sales 89,140,210,778 74,646,490,419
Payroll and other payments to employees (5,196,283,125) (5,827,353,840)
Payments to suppliers, contractors and others (34,329,207,490) (29,366,578,247)
Finance income received 2,085,126,783 1,335,500,926
Finance expenses paid for short term loans (137,533,205) -
Other finance expenses paid (708,170,131) (630,004,573)
Income tax paid (10,661,380,622) (9,002,415,542)
(48,947,447,790) (43,490,851,276)
Net cash flow from operating activities 40,192,762,988 31,155,639,143
Cash flows from investing activities
Payment for acquisition of property, plant and equipment (9,151,452,165) (8,835,146,894)
Proceeds from sale of property, plant and equipment 45,307,859 59,884,296
Payment for acquisition of intangible assets (764,248,680) (648,524,052)
Payment of first instalment for 2G licence renewal (13,584,598,000) -
Investment in subsidiary - (74,999,900)
Proceeds from/(investment in) long term deposits 12,594,949 (959,274)
Short term investments 2,571,872,141 (2,253,729,110)
Net cash used in investing activities (20,870,523,896) (11,753,474,934)
Cash flows from financing activities
Payment of long term borrowings - (1,950,443,211)
Payment of dividend (30,365,699,043) (12,791,086,003)
Amount refunded to IPO share applicants (3,296,381) (87,018,256)
Net cash used in financing activities (30,368,995,424) (14,828,547,470)
Net changes in cash and cash equivalents (11,046,756,332) 4,573,616,739
Cash and cash equivalents at 1 January 18,674,929,826 14,101,313,087
Cash and cash equivalents at 31 December 7,628,173,494 18,674,929,826
The annexed notes 1 to 53 form an integral part of these financial statements.

78/79Annual Report 2011
1. Corporate information
Grameenphone Ltd (hereinafter referred to as "GP"/"Grameenphone"/"the company") is a public limited company incorporated in Bangladesh in 1996 under the Companies Act 1994 and has its registered address at GPHOUSE, Bashundhara, Baridhara, Dhaka 1229. GP was initially registered as a private limited company and subsequently converted into a public limited company on 25 June 2007. During November 2009, GP listed its shares with both Dhaka and Chittagong Stock Exchanges. The immediate parent of GP is Telenor Mobile Communications AS and the ultimate parent is Telenor ASA; both the companies are incorporated in Norway. On 28 January 2010, Grameenphone formed a wholly owned subsidiary namely Grameenphone IT Ltd (hereinafter referred to as "GPIT"/ "the subsidiary company"), to provide IT services to GP and to external customers. GPIT launched its commercial operation on 1 April 2010.
These financial statements as at and for the year ended 31 December 2011 include consolidated and separate financial statements. The consolidated financial statements comprise the company and its subsidiary (together referred to as "GP group"/"the group"). The separate financial statements present the financial position and performance of Grameenphone Ltd. Statement of financial position as at the beginning of 1 January 2010 represents individual financial statement of Grameenphone Ltd as it had no subsidiary at that date.
The group is primarily involved in providing mobile telecommunication services (voice, data and other related services) in Bangladesh and IT related services. The company also provides international roaming services through international roaming agreements with various operators of different countries across the world.
The Mobile Cellular License of Grameenphone, which was acquired in 1996, expired on 10 November 2011 and is due for renewal immediately thereafter. As per the License Renewal Guidelines issued by MoPT (Ministry of Posts and Telecommunications), Grameenphone has made necessary applications and also made payment of all requisite fees in regard to the said application. However, disagreements arose between Bangladesh Telecommunication Regulatory Commission (BTRC) and the renewing operators on the issues of applicable VAT deduction on license fees and application of Market Competition Factor (MCF) to spectrum acquired in 2008. Grameenphone, among other operators, referred these two issues to Supreme Court for clarification, on which the license renewal process became pending. However, the Supreme Court has made it clear that GP operation is to continue without any hindrance or obstruction whatsoever. Following from the Supreme Court instruction, BTRC also issued letter to GP assuring that our operation will continue as is until these two issues are sorted out by the Court, upon which renewed license will be forthcoming. GP management believes that the license will definitely be renewed in course of time, because both BTRC and Grameenphone have interest in renewing the licence and license renewal per se is not the issue in contention. On 18 January 2012, the hearing of this case in High Court commenced with the participation of both GP and BTRC counsels, which is expected to be concluded within a very short time. Management therefore does not believe that there is any significant uncertainty about the entity’s ability to continue as a going concern. These financial statements accordingly have been prepared on the basis of going concern assumption.
2. Basis of preparation
2.1 Statement of compliance
These financial statements (including consolidated and separate financial statements) have been prepared in accordance with International Financial Reporting Standards (IFRS), Bangladesh Financial Reporting Standards (BFRS), the Companies Act 1994, the Securities and Exchange Rules 1987 and other applicable laws in Bangladesh.
The Articles of Association of Grameenphone require that the financial statements be prepared in accordance with International Accounting Standards (IAS)/IFRS. The requirements of IFRS and BFRS, to the extent relevant to these financial statements, do not vary from each other.
Authorisation for issue
These financial statements have been authorised for issue by the Board of Directors of the company on 07 February, 2012
Grameenphone Ltd.Notes to the Financial Statementsas at and for the year ended 31 December 2011

2.2 Basis of measurement
These financial statements have been prepared on historical cost basis except for the following items in the statement of financial position:
(a) Employee benefit plan is measured based on actuarial valuation.
(b) Finance lease obligation and assets under finance lease are measured at present value of minimum lease payments.
(c) Asset Retirement Obligations (ARO) are measured at present value of expected future expenditure.
2.3 Functional and presentation currency
Items included in these financial statements are measured using the currency of the primary economic environment in which the group operates (‘the functional currency’). These financial statements are presented in Bangladesh Taka (Taka/Tk/BDT) which is also the functional currency of the group. The amounts in these financial statements have been rounded off to the nearest Taka.
2.4 Use of estimates and judgements
The preparation of financial statements requires management to make judgements, estimates and assumptions that affect the application of accounting policies and the reported amounts of assets, liabilities, income and expenses. Actual results may differ from these estimates.
Estimates and underlying assumptions are reviewed on an ongoing basis. Revision to accounting estimates is recognised in the period in which the estimate is revised if the revision affects only that period, or in the period of revision and future periods if the revision affects both current and future periods.
In particular, information about significant areas of estimation uncertainty and critical judgments in applying accounting policies that have the most significant effect on the amount recognised in the financial statements are described in the following notes:
Note 9: Deferred cost of connection revenue (estimation of subscribers' relationship period)
Note 22: Finance lease obligations (classification and measurement)
Note 23: Deferred tax liabilities (manner of recovery of temporary differences for determination of deferred tax liabilities)
Note 24 Long term provisions (estimation of future cash outflow and determination of appropriate discount rate)
Note 32: Deferred connection revenue (estimation of subscribers' relationship period)
Note 33 Provisions
Note 34 Revenue (allocation of revenue among multiple elements, determination of percentage of completion for services rendered)
Note 44 Income tax expenses
In addition to the above, determination of the group's liability for gratuity involves the use of estimates regarding demographic variables (such as employee turnover and mortality) and financial variables (such as future increases in salaries and discount rate).
3. Significant accounting policies
Accounting policies set out below have been applied consistently to all periods presented in these financial statements:
3.1 Basis of consolidation
(a) Subsidiaries
Subsidiaries are entities controlled by the group. Control is achieved where the company has the power to govern the financial and operating policies so as to obtain benefits from its activities. The existence and effect of potential voting rights that are currently exercisable or convertible are considered when assessing whether the group controls another entity. Subsidiaries are fully consolidated from the date on which control is transferred to the group. They are de-consolidated from the date on which control ceases.
(b) Consolidation procedure
Intra-group balances and transactions, and any unrealised gains or losses arising from intra-group transactions, are eliminated in preparing the consolidated financial statements. Total comprehensive income of subsidiary is attributed to owners of the company and to the non-controlling interest even if this results in the non-controlling interest having a deficit balance. Financial statements of subsidiary are adjusted where necessary to ensure consistency with the policies adopted by the group.
Not
es to
the
Fina
ncia
l Sta
tem
ents

80/81Annual Report 2011
3.2 Property, plant and equipment
(a) Recognition and measurement
Items of property, plant and equipment are measured at cost less accumulated depreciation and accumulated impairment losses, if any.
The cost of an item of property, plant and equipment comprises its purchase price, import duties and non-refundable taxes, after deducting trade discount and rebates, and any costs directly attributable to bringing the asset to the location and condition necessary for it to be capable of operating in the intended manner. Cost also includes initial estimate of the costs of dismantling and removing the item and restoring the site on which it is located and capitalised borrowing costs. The costs of obligations for dismantling and removing the item and restoring the site (generally called 'asset retirement obligation') are recognised and measured in accordance with IAS/BAS 37: Provisions, Contingent Liabilities and Contingent Assets. Purchased software that is integral to the functionality of the related equipment is capitalised as part of that equipment.
When parts of an item of property, plant and equipment have different useful lives, they are accounted for as separate items (major components) of property, plant and equipment.
(b) Subsequent costs
The cost of replacing or upgrading of an item of property, plant and equipment is recognised in the carrying amount of the item if it is probable that the future economic benefits embodied within the item will flow to the group and its cost can be measured reliably. The carrying amount of the replaced component is derecognised. The costs of the day to day servicing of property, plant and equipment are recognised in profit or loss as incurred.
(c) Depreciation
No depreciation is charged on land and capital work in progress (CWIP) as the land has unlimited useful life and CWIP is not yet available for use.
Depreciation on other items of property, plant and equipment is recognized on a straight-line basis over the estimated useful lives of each item of property, plant and equipment. Leased assets are depreciated over the shorter of the lease term and their useful lives unless it is reasonably certain that the group will obtain ownership by the end of the lease term. For addition to property, plant and equipment, depreciation is charged from the date of capitalisation up to the month immediately preceding the month of disposal. Depreciation method, useful lives and residual values are reviewed at each reporting date and adjusted if appropriate. The estimated useful lives of the items of property, plant and equipment for the current and comparative periods are as follows:
2011 2010 Year Year Own assets Building 10 -50 10 -50 Base station - equipments 3-10 3-10 Base station - tower, fibre optic network and related assets 7- 20 7- 20 Transmission equipment 5-10 5-10 Computers and other IT equipment 4 4 Furniture and fixtures (including office equipment) 3-5 3-5 Vehicles 4 4 Leased asset Fibre Optic Network 22.5 22.5
(d) Gains or losses on disposal
An item of property, plant and equipment is derecognised upon disposal or when no future economic benefits are expected to arise from the continued use of the asset. Any gain or loss on disposal or retirement of an item of property, plant and equipment is determined as the difference between sales proceed and the carrying amount of the asset and is recognized in profit or loss.
(e) Capital work in progress
Capital work in progress consists of acquisition costs of network plant and machinery, capital components and related installation cost until the date placed in service. In case of import of components, capital work in progress is recognised when risks and rewards associated with such assets are transferred to the group, i.e. at the time shipment is confirmed by the supplier.
Not
es to
the
Fina
ncia
l Sta
tem
ents
(f) Capitalisation of borrowing costs
As per the requirements of IAS/BAS 23: Borrowing Costs, directly attributable borrowing costs are capitalised during construction period for all qualifying assets. A qualifying asset is an asset that necessarily takes a substantial period of time to get ready for its intended use or sale. The borrowing costs that are directly attributable to the acquisition, construction or production of a qualifying asset are those borrowing costs that would have been avoided if the expenditure on the qualifying asset had not been made. All other borrowing costs are recognized in profit or loss in the period in which they are incurred.
3.3 Intangible assets
(a) Recognition and measurement
Intangible assets that are acquired by the group and have finite useful lives are measured at cost less accumulated amortisation and accumulated impairment loss, if any. Intangible assets are recognised when all the conditions for recognition as per IAS/BAS 38: Intangible assets are met. The cost of an intangible asset comprises its purchase price, import duties and non-refundable taxes and any directly attributable cost of preparing the asset for its intended use.
Expenditure on research activities, undertaken with the prospect of gaining new scientific or technical knowledge and understanding, is recognized in the profit or loss as incurred.
Development activities involve a plan or design for the production of new and substantially improved products and processes. Development expenditures, on an individual project, are recognised as an intangible asset when the group can demonstrate:
- The technical feasibility of completing the intangible asset so that it will be available for use or sale
- Its intention to complete and its ability to use or sell the asset
- How the asset will generate future economic benefits
- The availability of resources to complete the asset
- The ability to measure reliably the expenditure during development.
Other development expenditure is recognized in profit or loss as incurred. Development costs previously recognised as an expense are not recognised as an asset in a subsequent period. Following initial recognition of the development expenditure as an asset, the cost model is applied requiring the asset to be carried at cost less any accumulated amortisation and accumulated impairment losses. Amortisation of the asset begins when development is complete and the asset is available for use. It is amortised over the period of expected future benefit. During the period of development, the asset is tested for impairment annually.
Internally generated intangible assets, excluding capitalised development costs, are not capitalised and expenditure is reflected in profit or loss in the year in which the expenditure is incurred.
(b) Subsequent costs
Subsequent costs are capitalised only when they increase the future economic benefits embodied in the specific asset to which they relate. All other costs are recognised in profit or loss as incurred.
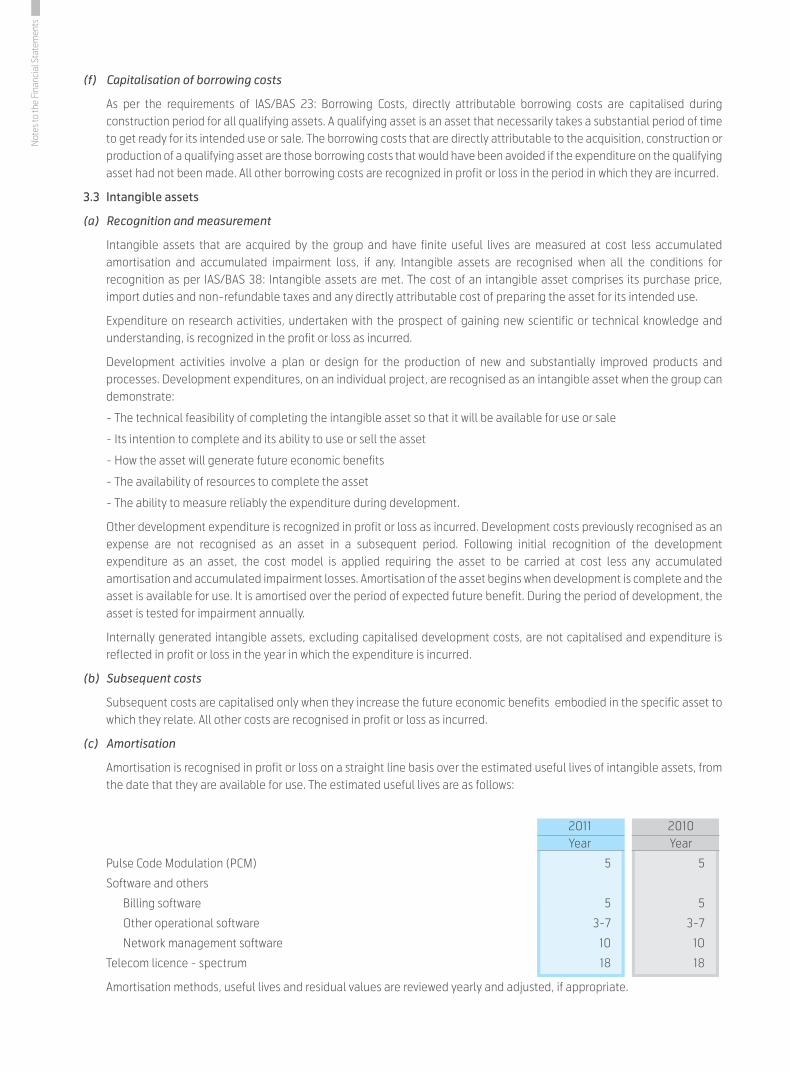
(c) Amortisation
Amortisation is recognised in profit or loss on a straight line basis over the estimated useful lives of intangible assets, from the date that they are available for use. The estimated useful lives are as follows:
2011 2010 Year Year
Pulse Code Modulation (PCM) 5 5
Software and others
Billing software 5 5
Other operational software 3-7 3-7
Network management software 10 10
Telecom licence - spectrum 18 18
Amortisation methods, useful lives and residual values are reviewed yearly and adjusted, if appropriate.
Not
es to
the
Fina
ncia
l Sta
tem
ents
82/83Annual Report 2011
(c) Derecognition
An intangible asset is derecognized on disposal, or when no future economic benefits are expected from use or disposal. Gains or losses arising from derecognition of a intangible asset, measured as the difference between the net disposal proceeds and the carrying amount of the assets, are recognized in profit or loss.
3.4 Financial instruments
3.4.1 Financial assets
The group initially recognises receivables and deposits on the date that they are originated. All other financial assets are recognised initially on the date at which the group becomes a party to the contractual provisions of the transaction.
The group derecognises a financial asset when the contractual rights or probabilities of receiving the cash flows from the asset expire, or it transfers the rights to receive the contractual cash flows on the financial asset in a transaction in which substantially all the risks and rewards of ownership of the financial asset are transferred.
Financial assets include cash and cash equivalents, short term investments, accounts receivable, other receivables and deposits.
(a) Accounts receivable
Accounts receivable represent the amounts due from mobile telephony subscribers for telecom services, other operators for interconnection services and infrastructure sharing, customers for FON connectivity and receivables for IT related services and includes both billed and unbilled portion of such services at the date of statement of financial position. Accounts receivables are stated net of provision for doubtful debts.
(b) Short term investments
Short term investments comprise investment in Fixed Deposit Receipts (FDR) with original maturity of more than three months. Short term investments assets are recognised initially at cost. Subsequent to initial recognition they are measured at amortised cost using the effective interest method, less any impairment losses.
(c) Other receivables
Other receivables comprise other non-mobile receivables and interest receivables. Other receivables are stated net of provision for doubtful debts, if any.
(d) Cash and cash equivalents
Cash and cash equivalents comprise cash balances and call deposits with original maturities of less than three months. Bank overdrafts that are repayable on demand and form an integral part of the group’s cash management are included as a component of cash and cash equivalents.
3.4.2 Financial liabilities
The group initially recognises financial liabilities on the transaction date at which the group becomes a party to the contractual provisions of the liability.
The group derecognises a financial liability when its contractual obligations are discharged or cancelled or expired.
Financial liabilities include finance lease obligation, accounts payable, payable to government and autonomous bodies, deposits from agents and subscribers, VAT payables, accrued interests and other payables.
(a) Finance lease obligations
Leases in terms of which the entity assumes substantially all the risks and rewards of ownership are classified as finance leases. Upon initial recognition the leased asset is measured at an amount equal to the lower of its fair value and the present value of minimum lease payments. The discount rate used in calculating the present value of the minimum lease payments is the interest rate implicit in the lease, if this is practicable to determine; if not, the lessee’s incremental borrowing rate is used.
(b) Accounts payable and other financial liabilities
Accounts payable and other financial liabilities (payable to government and autonomous bodies, accrued interest, VAT payables and other liabilities) are recognised when its contractual obligations arising from past events are certain and the settlement of which is expected to result in an outflow from the group of resources embodying economic benefits.
Not
es to
the
Fina
ncia
l Sta
tem
ents

3.5 Impairment
(a) Financial assets
The group considers evidence of impairment for financial assets (loans and receivables and held-to-maturity investment securities) at both a specific asset and collective asset level. All individually significant receivables and held-to-maturity investment securities are assessed for specific impairment. All individually significant loans and receivables and held-to-maturity investment securities found not to be specifically impaired are then collectively assessed for any impairment that has been incurred but not yet identified. Loans and receivables and held-to-maturity investment securities that are not individually significant are collectively assessed for impairment by grouping together loans and receivables and held-to-maturity investment securities with similar risk characteristics.
Financial assets are impaired if objective evidence indicates that a loss event has occurred after the initial recognition of the asset, and that the loss event had a negative effect on the estimated future cash flows of that asset that can be estimated reliably. Objective evidence that financial assets (including equity securities) are impaired can include default or delinquency by a debtor, indications that a debtor or issuer will enter bankruptcy etc. Accordingly, 100% provision is made over the amount outstanding (after considering security deposits) from churned post paid subscribers.
As per the existing credit policy, provisions for doubtful debt is recognized on receivables for post paid mobile services when a subscriber is barred if his usage exceeds approved credit limit or any non-payment of invoice. A subscriber is considered churned after three months of barring. For the other classes of financial assets, provision for doubtful debts is made after analysing the recoverability of the amount from the concerned parties. The provision for doubtful debts is written off as bad debts after one year from the date of recognition.
(b) Non-financial assets
The carrying amounts of the group’s non-financial assets, other than inventories and deferred tax assets, are reviewed at each reporting date to determine whether there is any indication of impairment. If any such indication exists, then the asset’s recoverable amount is estimated in order to determine the extent of impairment loss (if any). Where it is not possible to determine the recoverable amount of an individual asset, the group estimates the recoverable amount of the cash generating unit (CGU) to which the asset belongs. An impairment loss is recognised if the carrying amount of an asset or its CGU exceeds its estimated recoverable amount.
The recoverable amount of an asset or CGU is the greater of its value in use and its fair value less costs to sell. In assessing value in use, the estimated future cash flows are discounted to their present value using a pre-tax discount rate that reflects current market assessments of the time value of money and the risks specific to the asset or CGU. For the purpose of impairment testing, assets that cannot be tested individually are grouped together into the smallest group of assets that generates cash inflows from continuing use that are largely independent of the cash inflows of other assets or CGU.
Impairment losses are recognised in profit or loss. Impairment losses recognised in respect of CGUs are allocated to reduce the carrying amounts of the other assets in the CGU (group of CGUs) on a pro rata basis.
Impairment losses recognised in prior periods are assessed at each reporting date for any indications that the loss has decreased or no longer exists. An impairment loss is reversed if there has been a change in the estimates used to determine the recoverable amount. An impairment loss is reversed only to the extent that the asset’s carrying amount does not exceed the carrying amount that would have been determined, net of depreciation or amortisation, if no impairment loss had been recognised.
3.6 Inventories
Inventories consisting of scratch cards, SIM cards, mobile handsets, data cards, other devices and IT accessories are valued at lower of cost and net realisable value. Costs of inventories include expenditure incurred in acquiring the inventories, production or conversion costs and other costs incurred in bringing them to their existing location and condition. Cost of inventories is determined by using the weighted average cost formula. Where necessary, allowance is provided for damaged, obsolete and slow moving items to adjust the carrying value of inventories to the lower of cost and net realisable value. Net realisable value is based on estimated selling price in the ordinary course of business less the estimated costs of completion and the estimated costs necessary to make the sale.
3.7 Employee benefits
The group maintains both defined contribution plan and defined benefit plan for its eligible permanent employees. The eligibility is determined according to the terms and conditions set forth in the respective deeds. Both of the plans are supported by separate registered funds.
Not
es to
the
Fina
ncia
l Sta
tem
ents

84/85Annual Report 2011
(a) Defined contribution plan (provident fund)
A defined contribution plan is a post-employment benefit plan under which an entity pays fixed contributions into a separate entity and has no legal or constructive obligation to pay further amounts. Obligations for contribution to defined contribution plans are recognized as an employee benefit expense in profit or loss in the period during which related services are rendered by employees. Prepaid contributions are recognized as an asset to the extent that a cash refund or a reduction in future payment is available. Contributions to a defined contribution plan that are due more than 12 months after the end of the period in which employee render the services are discounted to the present value.
The group contributes to a registered provident fund scheme (defined contribution plan) for employees of the group eligible to be members of the fund in accordance with the rules of the provident fund constituted under an irrevocable trust. All permanent employees contribute 10% of their basic salary to the provident fund and the group also makes equal contribution.
The group recognises contribution to defined contribution plan as an expense when an employee has rendered services in exchange for such contribution. The legal and constructive obligation is limited to the amount it agrees to contribute to the fund.
(b) Defined benefit plan (gratuity)
A defined benefit is a post-employment benefit plan other than a defined contribution plan. The group's net obligation in respect of defined benefit plan is calculated separately for each plan by estimating the amount of future benefit that employees have earned in return for their services in the current and prior periods; that benefit is discounted to determine its present value. Any unrecognized past service cost and the fair value of any plan assets are deducted. The rate used to discount post employment benefit obligations is determined by reference to market yields at the date of statement of financial position on treasury bills.
The employees gratuity fund is considered as defined benefit plan as it meets the recognition criteria. The group's obligation is to provide the agreed benefits to current and former employees as per condition of the fund.
Present value of defined benefit obligation and the fair value of the plan assets are determined by professional actuary. Projected Unit Credit method is used to measure the present value of defined benefit obligations and related current and past service cost by using mutually compatible actuarial assumptions about demographic and financial variables. The difference between fair value of the plan assets and present value of obligation is recognised as a liability or an asset in the statement of financial position. When the calculation results in a benefit to the group, the recognized asset is limited to the total of any unrecognized past service cost and the present value of economic benefit available in the form of any future refunds from the plan or reductions in future contribution to the plan. In order to calculate the present value of economic benefits, consideration is given to any minimum funding requirements that apply to any plan in the group. An economic benefit is available to the group if it is realizable during the life of the plan, or on settlement of the plan liabilities.
The expected return on plan assets is based on market expectation and is one of the components of expenses recognised in profit or loss. Total expenses recognised in profit or loss comprise of current service cost, interest cost and expected return on plan assets.
Past-service costs are recognised immediately in profit or loss, unless the changes to the plan are conditional on the employees remaining in service for a specified period of time (the vesting period). In this case, the past-service costs are amortised on a straight-line basis over the vesting period.
The group recognises gains or loss on the curtailment or settlement of a defined benefit plan when the curtailment or settlement occurs. The gain or loss on curtailment or settlement comprises any resulting change in the fair value of plan assets, any changes in the present value of defined benefit obligation, any related actuarial gains or losses and past service cost that had not previously been recognized.
Actuarial gains and losses are recognised as income or expense when the net cumulative unrecognised actuarial gains and losses for each individual plan at the end of the previous reporting period exceed 10% of the higher of the defined benefit obligation and the fair value of plan assets at that date. These gains or losses are recognised over the expected average remaining working lives of the employees participating in the plans.
(c) Short term employee benefits
Short term employee benefit obligations are measured on an undiscounted basis and are expensed as the related service is provided. Provision is created for the amount of annual leave encashment based on the latest basic salary.
3.8 Income tax
Income tax expenses comprise current and deferred taxes. Income tax expenses are recognised in profit or loss except to the extent that it relates to items recognised directly in equity, in which case it is recognised in equity.
Not
es to
the
Fina
ncia
l Sta
tem
ents
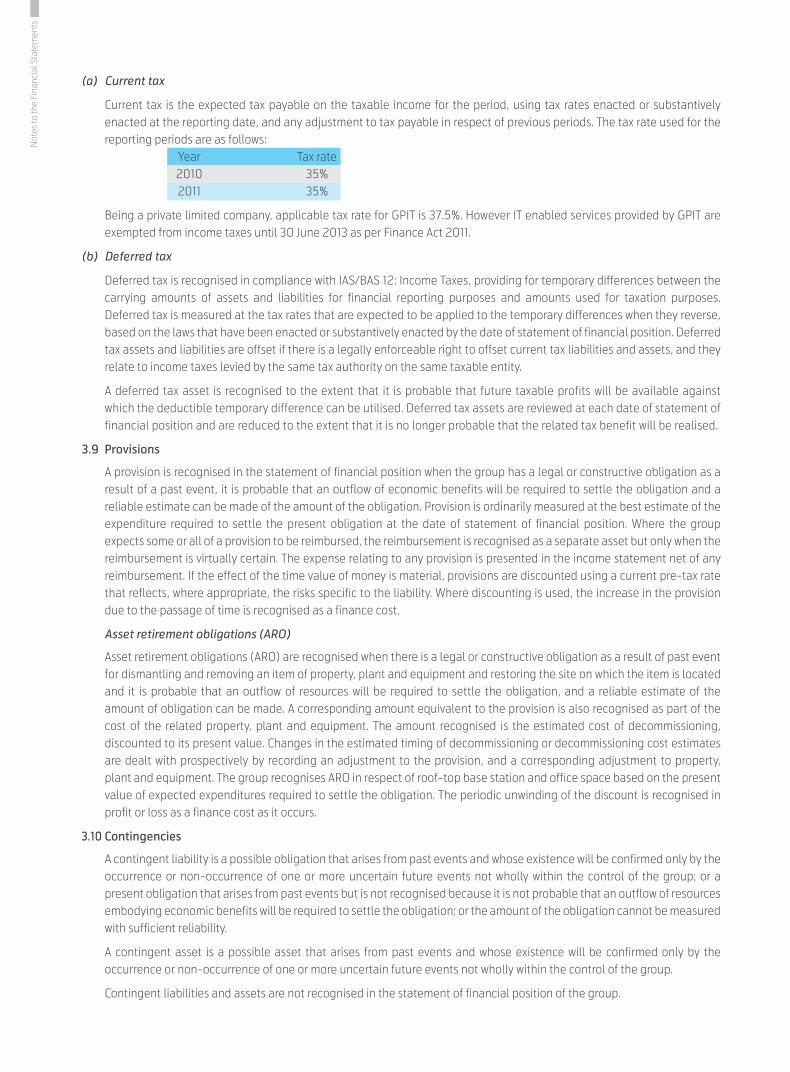
(a) Current tax
Current tax is the expected tax payable on the taxable income for the period, using tax rates enacted or substantively enacted at the reporting date, and any adjustment to tax payable in respect of previous periods. The tax rate used for the reporting periods are as follows:
Year Tax rate 2010 35% 2011 35%
Being a private limited company, applicable tax rate for GPIT is 37.5%. However IT enabled services provided by GPIT are exempted from income taxes until 30 June 2013 as per Finance Act 2011.
(b) Deferred tax
Deferred tax is recognised in compliance with IAS/BAS 12: Income Taxes, providing for temporary differences between the carrying amounts of assets and liabilities for financial reporting purposes and amounts used for taxation purposes. Deferred tax is measured at the tax rates that are expected to be applied to the temporary differences when they reverse, based on the laws that have been enacted or substantively enacted by the date of statement of financial position. Deferred tax assets and liabilities are offset if there is a legally enforceable right to offset current tax liabilities and assets, and they relate to income taxes levied by the same tax authority on the same taxable entity.
A deferred tax asset is recognised to the extent that it is probable that future taxable profits will be available against which the deductible temporary difference can be utilised. Deferred tax assets are reviewed at each date of statement of financial position and are reduced to the extent that it is no longer probable that the related tax benefit will be realised.
3.9 Provisions
A provision is recognised in the statement of financial position when the group has a legal or constructive obligation as a result of a past event, it is probable that an outflow of economic benefits will be required to settle the obligation and a reliable estimate can be made of the amount of the obligation. Provision is ordinarily measured at the best estimate of the expenditure required to settle the present obligation at the date of statement of financial position. Where the group expects some or all of a provision to be reimbursed, the reimbursement is recognised as a separate asset but only when the reimbursement is virtually certain. The expense relating to any provision is presented in the income statement net of any reimbursement. If the effect of the time value of money is material, provisions are discounted using a current pre-tax rate that reflects, where appropriate, the risks specific to the liability. Where discounting is used, the increase in the provision due to the passage of time is recognised as a finance cost.
Asset retirement obligations (ARO)
Asset retirement obligations (ARO) are recognised when there is a legal or constructive obligation as a result of past event for dismantling and removing an item of property, plant and equipment and restoring the site on which the item is located and it is probable that an outflow of resources will be required to settle the obligation, and a reliable estimate of the amount of obligation can be made. A corresponding amount equivalent to the provision is also recognised as part of the cost of the related property, plant and equipment. The amount recognised is the estimated cost of decommissioning, discounted to its present value. Changes in the estimated timing of decommissioning or decommissioning cost estimates are dealt with prospectively by recording an adjustment to the provision, and a corresponding adjustment to property, plant and equipment. The group recognises ARO in respect of roof-top base station and office space based on the present value of expected expenditures required to settle the obligation. The periodic unwinding of the discount is recognised in profit or loss as a finance cost as it occurs.
3.10 Contingencies
A contingent liability is a possible obligation that arises from past events and whose existence will be confirmed only by the occurrence or non-occurrence of one or more uncertain future events not wholly within the control of the group; or a present obligation that arises from past events but is not recognised because it is not probable that an outflow of resources embodying economic benefits will be required to settle the obligation; or the amount of the obligation cannot be measured with sufficient reliability.
A contingent asset is a possible asset that arises from past events and whose existence will be confirmed only by the occurrence or non-occurrence of one or more uncertain future events not wholly within the control of the group.
Contingent liabilities and assets are not recognised in the statement of financial position of the group.
Not
es to
the
Fina
ncia
l Sta
tem
ents

86/87Annual Report 2011
3.11 Revenue recognition
Revenues are measured at fair value of the consideration received or receivable, net of discount and sales related taxes and VAT. Revenues are reported gross with separate recording of expenses to vendors of products or services. However, when the group acts only as an agent or broker on behalf of suppliers of products or services, revenues are reported on a net basis. Revenues of the group comprise:
(i) Sale of goods:
The group sells handset, data card and other device, and software to its customers. Revenue from sale of goods is recognized when the persuasive evidence exists that the significant risk and reward has been transferred to the customer, recovery of consideration is probable, the associated cost and the possible return of goods can be estimated reliably, there is no continuing management involvement with the goods and the amount of revenue can be measured reliably.
(ii) Rendering of services:
Revenue from rendering of services includes traffic fees, subscription and connection fees, interconnection fees, various customer support revenues, value added service revenues, infrastructure sharing and IT related services. Revenue from services rendered is recognized in profit or loss in proportion to the stage of completion of the transaction at the reporting date.
(a) Traffic revenue -Postpaid
Post paid traffic revenue is recognised on accrual basis and recorded as income (exclusive of VAT) as services are rendered.
(b) Traffic revenue -Prepaid
Prepaid traffic revenue is recognised (exclusive of VAT) as per the actual usage from the prepaid cards and electronic recharge system (ERS). The unused portion of the prepaid cards and ERS remains as unearned revenue (exclusive of VAT) and is reported as liability.
(c) Subscription revenue
Subscription revenue represents fixed line rent charged to post paid customers for voice, content and other communication services. It is billed in advance and recognised evenly over the subscription period.
(d) Connection revenue
Connection revenue represents the revenue arising from sale of connection to the subscribers through new SIM which is recognised over the estimated period of customer relationship. The estimated period of customer relationship is based on past history of subscriber being churned and expected development of relationship period. Expected development reflects the recent development in customer churn in the industry as well as in other group entities.
(e) Roaming revenue
International roaming revenue is recognised on accrual basis as services are rendered.
(f) Interconnection revenue
Interconnection revenue from other operators is recognised when GP subscribers receive calls from other operators' subscribers.
(g) Other mobile revenue
Other mobile revenue comprises revenue from customers support services, VAS (Value Added Services), SMS (Short Message Services), MMS (Multimedia Message Services) and revenue from content providers and is recognised in the same manner as corresponding prepaid traffic revenue and post-paid traffic revenue recognition policy.
(h) Non mobile revenue
Non mobile revenue includes revenue earned from services like bill pay services, fund remittance, etc, in addition to revenue earned from sale of device, infrastructure sharing and commission income. Revenue from such non-mobile services is recognised when services are rendered.
(i) Infrastructure sharing
Revenue from infrastructure sharing comprises revenue from lease of telecom infrastructure, including base station shelter, generators, and charges for fuel and power support. Leases are recognised as per IAS/BAS 17: Leases. Other revenues are recognised on accrual basis based on actual usage/consumption by the customers.
Not
es to
the
Fina
ncia
l Sta
tem
ents
(j) Sub lease of optical fibre network
Rental income from sub-lease of optical fibre network is recognised on accrual basis in accordance with the provisions of relevant agreements.
(k) Rendering IT service
Revenue from IT service is recognised on a percentage of completion basis. Percentage of completion of service is determined upon periodic review and usually evidenced by work completion certificate. Revenue is recognised only when it is probable that the economic benefits associated with the transaction will flow to the entity.
(l) Commissions
When the group acts in capacity of an agent rather than the principal in a transaction, the revenue recognized is the net amount of commission made by the group.
(iii) Revenue from construction contracts
When the outcome of a construction contract can be estimated reliably, revenue from construction contracts is recognized by reference to the stage of completion of the contract activity at the end of the reporting period. The stage of completion of a contract is determined in a variety of ways depending on the nature of the contract. The entity uses the method that measures reliably the work performed. The methods include cost-to-cost, survey of work performed and completion of physical proportion of the contract work.
If circumstances arise that may change the original estimates of revenues, costs or extent of progress toward completion, estimates are revised. These revisions may result in increases or decreases in estimated revenues or costs and are reflected in income in the period in which the circumstances that give rise to the revision become known by management.
When the outcome of a construction contract cannot be estimated reliably, revenue is recognized only to the extent of recoverable contract costs incurred and contract costs are recognized as an expense in the period in which they are incurred. An expected loss on the construction contract is recognized as an expense immediately.
3.12 Deferred connection revenue
Deferred connection revenue represents the portion of connection revenue which is deferred over the remaining period of estimated customer relationship.
3.13 Deferred cost of connection revenue
Connection costs in excess of connection revenue are charged as expenses when incurred. Connection costs up to connection revenue are deferred and amortised over the period of estimated customer relationship.
3.14 Leases
The determination of whether an arrangement is, or contains a lease is based on the substance of the arrangement at inception date: whether fulfilment of the arrangement is dependent on the use of a specific asset or assets or the arrangement conveys a right to use the asset, even if that right is not explicitly specified in an arrangement. Leases are classified as finance leases whenever the terms of lease transfer substantially all the risk and rewards of the ownership to the lessee. All other leases are classified as operating leases.
(a) The group as lessee
Asset held under finance leases are initially recognized as asset of the group at their fair value at the inception of the lease or, if lower, at the present value of minimum lease payments. The corresponding liability to the lessor is included in the statement of financial position as a finance lease obligation.
Lease payments are apportioned between finance expenses and reduction of lease obligation so as to achieve a constant rate of interest on the remaining balance of liability. Finance expenses are immediately recognized in profit or loss, unless they are directly attributable to qualifying assets, in which case they are capitalized. Contingent rentals are recognised as expenses in the period in which they incur.
Operating lease payments are recognized as an expense on straight line basis over the lease term, except where another systemic basis is more representative of the time pattern in which economic benefits from the leased assets are consumed. Contingent rentals arising under operating leases are recognized as an expense in the period in which they incurred.
Not
es to
the
Fina
ncia
l Sta
tem
ents

88/89Annual Report 2011
In the event that lease incentives are received to enter into operating leases, such incentives are recognized as liability. The aggregate benefit of incentives is recognized as a reduction of rental expenses on a straight line basis, except where another systematic basis is more representative of the time pattern in which economic benefits from the leased assets are consumed.
(b) The group as lessor
Amounts due from lessees under finance leases are recognized as receivables at the amount of group's net investment in the leases. Finance lease income is allocated to accounting period so as to reflect a constant periodic rate of return on the group's net investment outstanding in respect of the leases.
Rental income from operating lease is recognised on straight line basis over the term of relevant lease. Initial direct cost incurred in negotiating and arranging an operating lease are added to carrying amount of leased assets and recognised on a straight line basis over the lease term.
3.15 Foreign currency transactions
Transactions in foreign currencies are recorded in the books at the rate of exchange prevailing on the date of the transaction. Monetary assets and liabilities in foreign currencies at the date of statement of financial position are translated into Bangladesh taka at the rate of exchange prevailing at that date. Non-monetary items that are measured in terms of historical cost in a foreign currency are translated using the exchange rates as at the dates of the initial transactions. Non-monetary items measured at fair value in a foreign currency are translated using the exchange rates at the date when the fair value was determined. Exchange differences arising on the settlement of monetary items or on translating monetary items at the end of the reporting period are recognised in profit or loss as per IAS/BAS 21: The Effects of Changes in Foreign Exchange Rates.
3.16 Earnings per share
The group/company presents basic and diluted (when dilution is applicable) earnings per share (EPS) for its ordinary shares. Basic EPS is calculated by dividing the profit or loss attributable to ordinary shareholders of the group/company by the weighted average number of ordinary shares outstanding during the period, adjusted for the effect of change in number of shares for bonus issue, share split and reverse split. Diluted EPS is determined by adjusting the profit or loss attributable to ordinary shareholders and the weighted average number of ordinary shares outstanding, for the effects of all dilutive potential ordinary shares. However, dilution of EPS is not applicable for these financial statements as there was no dilutive potential ordinary shares during the relevant periods.
3.17 Events after the reporting period
Events after the reporting period that provide additional information about the group's/company's position at the date of statement of financial position or those that indicate the going concern assumption is not appropriate are reflected in the financial statements. Events after the reporting period that are not adjusting events are disclosed in the notes when material.
Not
es to
the
Fina
ncia
l Sta
tem
ents
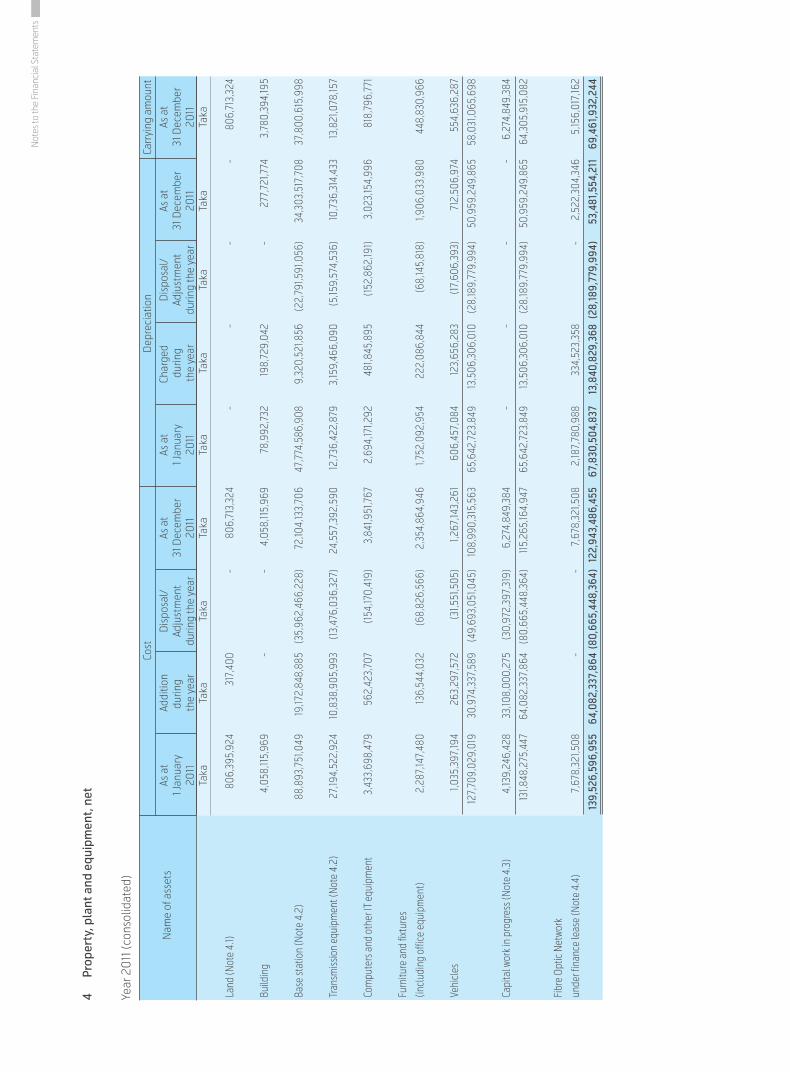
4 Pr
oper
ty, p
lant
and
equ
ipm
ent,
net
Year
20
11 (c
onso
lidat
ed)
As a
t1 J
anua
ry20
11Ta
ka
Addi
tion
durin
g th
e ye
arTa
ka
Dis
posa
l/Ad
just
men
tdu
ring
the
year
Taka
As a
t31
Dec
embe
r20
11Ta
ka
As a
t1 J
anua
ry20
11Ta
ka
Char
ged
durin
gth
e ye
arTa
ka
Dis
posa
l/Ad
just
men
tdu
ring
the
year
Taka
As a
t31
Dec
embe
r20
11Ta
ka
As
at
31 D
ecem
ber
2011
Tak
a
Carr
ying
am
ount
Dep
reci
atio
nCo
st
Not
es to
the
Fina
ncia
l Sta
tem
ents
Land
(Not
e 4.
1)
806,
395,
924
317,
400
- 80
6,71
3,32
4 -
- -
- 80
6,71
3,32
4
Build
ing
4,05
8,11
5,96
9 -
- 4,
058,
115,
969
78,9
92,7
32
198,
729,
042
- 27
7,72
1,774
3,
780,
394,
195
Base
stat
ion
(Not
e 4.
2)
88,8
93,7
51,0
49
19,17
2,84
8,88
5 (3
5,96
2,46
6,22
8)
72,10
4,13
3,70
6 47
,774
,586
,908
9,
320,
521,8
56
(22,
791,5
91,0
56)
34,3
03,5
17,7
08
37,8
00,6
15,9
98
Tran
smiss
ion
equi
pmen
t (No
te 4
.2)
27,19
4,52
2,92
4 10
,838
,905
,993
(1
3,47
6,03
6,32
7)
24,5
57,3
92,5
90
12,7
36,4
22,8
79
3,15
9,46
6,09
0 (5
,159,
574,
536)
10
,736
,314
,433
13
,821
,078
,157
Com
pute
rs a
nd o
ther
IT e
quip
men
t 3,
433,
698,
479
562,
423,
707
(154
,170,
419)
3,
841,9
51,7
67
2,69
4,17
1,292
48
1,845
,895
(1
52,8
62,19
1)
3,02
3,15
4,99
6 81
8,79
6,77
1
Furn
iture
and
fixt
ures
(incl
udin
g of
fice
equi
pmen
t) 2,
287,
147,
480
136,
544,
032
(68,
826,
566)
2,
354,
864,
946
1,752
,092
,954
22
2,08
6,84
4 (6
8,14
5,81
8)
1,906
,033
,980
44
8,83
0,96
6
Vehi
cles
1,0
35,3
97,19
4 26
3,29
7,57
2 (3
1,551
,505
) 1,2
67,14
3,26
1 60
6,45
7,08
4 12
3,65
6,28
3 (1
7,60
6,39
3)
712,
506,
974
554,
636,
287
127,
709,
029,
019
30,9
74,3
37,5
89
(49,
693,
051,0
45)
108,
990,
315,
563
65,6
42,7
23,8
49
13,5
06,3
06,0
10
(28,
189,
779,
994)
50
,959
,249
,865
58
,031
,065
,698
Capi
tal w
ork i
n pr
ogre
ss (N
ote
4.3)
4,
139,
246,
428
33,10
8,00
0,27
5 (3
0,97
2,39
7,31
9)
6,27
4,84
9,38
4 -
- -
- 6,
274,
849,
384
131,8
48,2
75,4
47
64,0
82,3
37,8
64
(80,
665,
448,
364)
11
5,26
5,16
4,94
7 65
,642
,723
,849
13
,506
,306
,010
(2
8,18
9,77
9,99
4)
50,9
59,2
49,8
65
64,3
05,9
15,0
82
Fibr
e Op
tic N
etwo
rk
unde
r fin
ance
leas
e (N
ote
4.4)
7,
678,
321,5
08
- -
7,67
8,32
1,508
2,
187,
780,
988
334,
523,
358
- 2,
522,
304,
346
5,15
6,01
7,16
2
139,
526,
596,
955
64,0
82,3
37,8
64 (
80,6
65,4
48,3
64)
122,
943,
486,
455
67,8
30,5
04,8
37
13,8
40,8
29,3
68 (
28,18
9,77
9,99
4)
53,4
81,5
54,2
11
69,4
61,9
32,2
44
Nam
e of
ass
ets

90/91Annual Report 2011
Prop
erty
, pla
nt a
nd e
quip
men
t (co
ntd.
.)
Year
20
10 (C
onso
lidat
ed)
Land
(Not
e 4.
1)
806,
395,
924
- -
806,
395,
924
- -
- -
806,
395,
924
Build
ing
39,4
95,7
38
4,01
8,62
0,23
1 -
4,05
8,11
5,96
9 11
,253
,642
67
,739
,090
-
78,9
92,7
32
3,97
9,12
3,23
7
Base
stat
ion
(Not
e 4.
2)
86,2
07,2
12,9
38
2,82
9,90
4,34
9 (1
43,3
66,2
38)
88,8
93,7
51,0
49
37,0
00,2
62,8
25
10,8
93,6
90,0
46
(119
,365
,963
) 47
,774
,586
,908
41
,119,
164,
141
Tran
smiss
ion
equi
pmen
t (No
te 4
.2)
24,9
36,6
37,0
35
2,25
7,88
5,88
9 -
27,19
4,52
2,92
4 9,
325,
226,
987
3,41
1,195
,892
-
12,7
36,4
22,8
79
14,4
58,10
0,04
5
Com
pute
rs a
nd o
ther
IT e
quip
men
t 3,
243,
271,8
28
315,
331,4
60
(124
,904
,809
) 3,
433,
698,
479
2,24
8,60
2,19
5 56
8,80
4,22
3 (1
23,2
35,12
6)
2,69
4,17
1,292
7
39,5
27,18
7
Furn
iture
and
fixt
ures
(incl
udin
g of
fice
equi
pmen
t) 2,
044,
818,
734
463,
486,
552
(221
,157,
806)
2,
287,
147,
480
1,761
,079
,790
20
8,37
3,40
6 (2
17,3
60,2
42)
1,752
,092
,954
53
5,05
4,52
6
Vehi
cles
88
3,00
8,53
1 19
6,67
5,01
9 (4
4,28
6,35
6)
1,035
,397
,194
543,
331,2
35
89,10
9,58
4 (2
5,98
3,73
5)
606,
457,
084
428,
940,
110
118,
160,
840,
728
10,0
81,9
03,5
00
(533
,715
,209
) 12
7,70
9,02
9,01
9 50
,889
,756
,674
15
,238
,912
,241
(4
85,9
45,0
66)
65,6
42,7
23,8
49
62,0
66,3
05,17
0
Capi
tal w
ork i
n pr
ogre
ss (N
ote
4.3)
6,
191,8
45,9
87
8,01
2,45
9,71
8 (1
0,06
5,05
9,27
7)
4,13
9,24
6,42
8 -
- -
- 4,
139,
246,
428
124,
352,
686,
715
18,0
94,3
63,2
18
(10,
598,
774,
486)
13
1,848
,275
,447
50
,889
,756
,674
15
,238
,912
,241
(4
85,9
45,0
66)
65,6
42,7
23,8
49
66,2
05,5
51,5
98
Fibr
e Op
tic N
etwo
rk
unde
r fin
ance
leas
e (N
ote
4.4)
7,
678,
321,5
08
- -
7,67
8,32
1,508
1,8
53,2
57,6
30
334,
523,
358
- 2,
187,
780,
988
5,49
0,54
0,52
0
132,
031,0
08,2
23
18,0
94,3
63,2
18 (
10,5
98,7
74,4
86)
139,
526,
596,
955
52,7
43,0
14,3
04
15,5
73,4
35,5
99
(485
,945
,066
) 67
,830
,504
,837
71
,696
,092
,118
As a
t1 J
anua
ry20
10Ta
ka
Addi
tion
durin
g th
e ye
arTa
ka
Dis
posa
l/Ad
just
men
tdu
ring
the
year
Taka
As a
t31
Dec
embe
r 20
10Ta
ka
As a
t1 J
anua
ry20
10Ta
ka
Char
ged
durin
g th
e ye
arTa
ka
Dis
posa
l/Ad
just
men
tdu
ring
the
year
Taka
As a
t31
Dec
embe
r 20
10Ta
ka
As
at
31 D
ecem
ber
2010
Tak
a
Carr
ying
am
ount
Dep
reci
atio
nCo
st
Not
es to
the
Fina
ncia
l Sta
tem
ents
Nam
e of
ass
ets
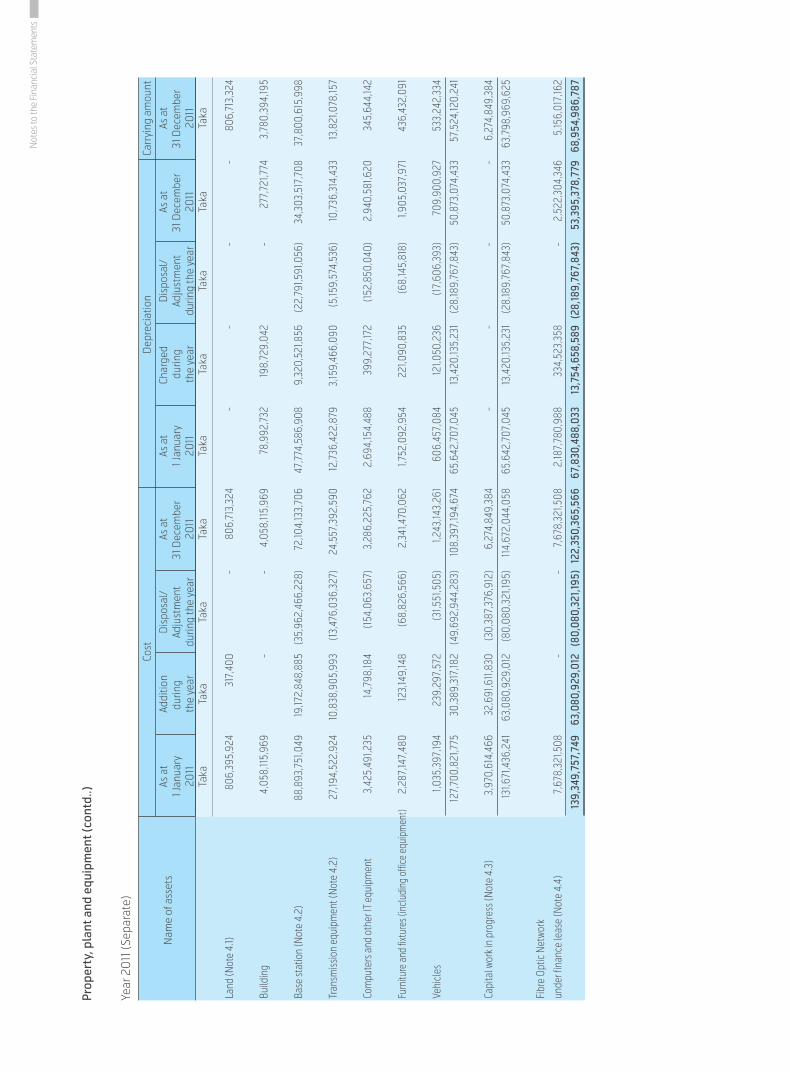
Prop
erty
, pla
nt a
nd e
quip
men
t (co
ntd.
.)
Year
20
11 (S
epar
ate)
Land
(Not
e 4.
1)
806,
395,
924
317,
400
- 80
6,71
3,32
4 -
- -
- 80
6,71
3,32
4
Build
ing
4,05
8,11
5,96
9 -
- 4,
058,
115,
969
78,9
92,7
32
198,
729,
042
- 27
7,72
1,774
3,
780,
394,
195
Base
stat
ion
(Not
e 4.
2)
88,8
93,7
51,0
49
19,17
2,84
8,88
5 (3
5,96
2,46
6,22
8)
72,10
4,13
3,70
6 47
,774
,586
,908
9,
320,
521,8
56
(22,
791,5
91,0
56)
34,3
03,5
17,7
08
37,8
00,6
15,9
98
Tran
smiss
ion
equi
pmen
t (No
te 4
.2)
27,19
4,52
2,92
4 10
,838
,905
,993
(1
3,47
6,03
6,32
7)
24,5
57,3
92,5
90
12,7
36,4
22,8
79
3,15
9,46
6,09
0 (5
,159,
574,
536)
10
,736
,314
,433
13
,821
,078
,157
Com
pute
rs a
nd o
ther
IT e
quip
men
t 3,
425,
491,2
35
14,7
98,18
4 (1
54,0
63,6
57)
3,28
6,22
5,76
2 2,
694,
154,
488
399,
277,
172
(152
,850
,040
) 2,
940,
581,6
20
345,
644,
142
Furn
iture
and
fixtu
res (
inclu
ding
offi
ce eq
uipm
ent)
2,28
7,14
7,48
0 12
3,14
9,14
8 (6
8,82
6,56
6)
2,34
1,470
,062
1,7
52,0
92,9
54
221,0
90,8
35
(68,
145,
818)
1,9
05,0
37,9
71
436,
432,
091
Vehi
cles
1,0
35,3
97,19
4 23
9,29
7,57
2 (3
1,551
,505
) 1,2
43,14
3,26
1 60
6,45
7,08
4 12
1,050
,236
(1
7,60
6,39
3)
709,
900,
927
533,
242,
334
127,
700,
821,7
75
30,3
89,3
17,18
2 (4
9,69
2,94
4,28
3)
108,
397,
194,
674
65,6
42,7
07,0
45
13,4
20,13
5,23
1 (2
8,18
9,76
7,84
3)
50,8
73,0
74,4
33
57,5
24,12
0,24
1
Capi
tal w
ork i
n pr
ogre
ss (N
ote
4.3)
3,
970,
614,
466
32,6
91,6
11,8
30
(30,
387,
376,
912)
6,
274,
849,
384
- -
- -
6,27
4,84
9,38
4
131,6
71,4
36,2
41
63,0
80,9
29,0
12
(80,
080,
321,1
95)
114,
672,
044,
058
65,6
42,7
07,0
45
13,4
20,13
5,23
1 (2
8,18
9,76
7,84
3)
50,8
73,0
74,4
33
63,7
98,9
69,6
25
Fibr
e Op
tic N
etwo
rk
unde
r fin
ance
leas
e (N
ote
4.4)
7,
678,
321,5
08
- -
7,67
8,32
1,508
2,
187,
780,
988
334,
523,
358
- 2,
522,
304,
346
5,15
6,01
7,16
2
139,
349,
757,
749
63,0
80,9
29,0
12
(80,
080,
321,1
95)
122,
350,
365,
566
67,8
30,4
88,0
33
13,7
54,6
58,5
89 (
28,18
9,76
7,84
3)
53,3
95,3
78,7
79
68,9
54,9
86,7
87
As a
t1 J
anua
ry20
11Ta
ka
Addi
tion
durin
g th
e ye
arTa
ka
Dis
posa
l/Ad
just
men
tdu
ring
the
year
Taka
As a
t31
Dec
embe
r 20
11Ta
ka
As a
t1 J
anua
ry20
11Ta
ka
Char
ged
durin
gth
e ye
arTa
ka
Dis
posa
l/Ad
just
men
tdu
ring
the
year
Taka
As a
t31
Dec
embe
r 20
11Ta
ka
As
at
31 D
ecem
ber
2011
Tak
a
Carr
ying
am
ount
Dep
reci
atio
nCo
st
Not
es to
the
Fina
ncia
l Sta
tem
ents
Nam
e of
ass
ets

92/93Annual Report 2011
Prop
erty
, pla
nt a
nd e
quip
men
t, ne
t (Co
ntd…
)
Year
20
10 (S
epar
ate)
Land
(Not
e 4.
1)
806,
395,
924
- -
806,
395,
924
- -
- -
806,
395,
924
Build
ing
39,4
95,7
38
4,01
8,62
0,23
1 -
4,05
8,11
5,96
9 11
,253
,642
67
,739
,090
-
78,9
92,7
32
3,97
9,12
3,23
7
Base
stat
ion
(Not
e 4.
2)
86,2
07,2
12,9
38
2,82
9,90
4,34
9 (1
43,3
66,2
38)
88,8
93,7
51,0
49
37,0
00,2
62,8
25
10,8
93,6
90,0
46
(119
,365
,963
) 47
,774
,586
,908
41
,119,
164,
141
Tran
smiss
ion
equi
pmen
t (No
te 4
.2)
24,9
36,6
37,0
35
2,25
7,88
5,88
9 -
27,19
4,52
2,92
4 9,
325,
226,
987
3,41
1,195
,892
-
12,7
36,4
22,8
79
14,4
58,10
0,04
5
Com
pute
rs a
nd o
ther
IT e
quip
men
t 3,
243,
271,8
28
307,
124,
216
(124
,904
,809
) 3,
425,
491,2
35
2,24
8,60
2,19
5 56
8,78
7,41
9 (1
23,2
35,12
6)
2,69
4,15
4,48
8 73
1,336
,747
Furn
iture
and
fixt
ures
(incl
udin
g of
fice
equi
pmen
t) 2,
044,
818,
734
463,
486,
552
(221
,157,
806)
2,
287,
147,
480
1,761
,079
,790
20
8,37
3,40
6 (2
17,3
60,2
42)
1,752
,092
,954
53
5,05
4,52
6
Vehi
cles
88
3,00
8,53
1 19
6,67
5,01
9 (4
4,28
6,35
6)
1,035
,397
,194
543,
331,2
35
89,10
9,58
4 (2
5,98
3,73
5)
606,
457,
084
428,
940,
110
118,
160,
840,
728
10,0
73,6
96,2
56
(533
,715
,209
) 12
7,70
0,82
1,775
50
,889
,756
,674
15
,238
,895
,437
(4
85,9
45,0
66)
65,6
42,7
07,0
45
62,0
58,11
4,73
0
Capi
tal w
ork i
n pr
ogre
ss (N
ote
4.3)
6,
191,8
45,9
87
7,83
5,62
0,51
2 (1
0,05
6,85
2,03
3)
3,97
0,61
4,46
6 -
- -
- 3,
970,
614,
466
124,
352,
686,
715
17,9
09,3
16,7
68
(10,
590,
567,
242)
13
1,671
,436
,241
50
,889
,756
,674
15
,238
,895
,437
(4
85,9
45,0
66)
65,6
42,7
07,0
45
66,0
28,7
29,19
6
Fibr
e Op
tic N
etwo
rk
unde
r fin
ance
leas
e (N
ote
4.4)
7,
678,
321,5
08
- -
7,67
8,32
1,508
1,8
53,2
57,6
30
334,
523,
358
- 2,
187,
780,
988
5,49
0,54
0,52
0
132,
031,0
08,2
23
17,9
09,3
16,7
68 (
10,5
90,5
67,2
42)
139,
349,
757,
749
52,7
43,0
14,3
04
15,5
73,4
18,7
95
(485
,945
,066
) 67
,830
,488
,033
71
,519
,269
,716
As a
t1 J
anua
ry20
10Ta
ka
Addi
tion
durin
g th
e ye
arTa
ka
Dis
posa
l/Ad
just
men
tdu
ring
the
year
Taka
As a
t31
Dec
embe
r20
10Ta
ka
As a
t1 J
anua
ry20
10Ta
ka
Char
ged
durin
gth
e ye
arTa
ka
Dis
posa
l/Ad
just
men
tdu
ring
the
year
Taka
As a
t31
Dec
embe
r20
10Ta
ka
As
at
31 D
ecem
ber
2010
Tak
a
Carr
ying
am
ount
Dep
reci
atio
nCo
st
Not
es to
the
Fina
ncia
l Sta
tem
ents
Nam
e of
ass
ets

4.1 Land
Land represents freehold land acquired for office premises and base stations.
4.2 Base station and transmission equipment
Base station and transmission equipment which form the major part of the telecommunication network include Radio Base Station (RBS) and related accessories, Base Station Controllers (BSC), Trans-Receiver Unit (TRU), GSM antenna, tower, site infrastructure, civil works, microwave links, Mobile Switching Centres (MSC), Home Location Register (HLR) and other equipment and accessories.
In September 2010, an agreement was signed between Grameenphone and Huawei for supply of network equipment and related maintenance services. Under the agreement, existing base stations and transmission equipment of Grameenphone were replaced by new equipment supplied by Huawei. The above transaction has commercial substance in terms of its impact on configuration of future cash flows. However in absence of reliable information regarding fair value of the assets acquired or the assets given up, cost of the assets acquired were measured at the carrying amount of the assets given up plus any cash consideration paid.
Exchange of assets under the contract started in February 2011 and completed in December 2011.
4.3 Capital work in progress (CWIP)
This represents primarily the cost of network equipment under construction and capital inventories. The components of network equipment were procured mostly from Ericsson and Huawei.
4.3.1 Capital work in progress transferred
The amount of CWIP completed and transferred during the year to the corresponding items of property, plant and equipment was as follows:
Consolidated Separate Name of assets 2011 2010 2011 2010 Taka Taka Taka Taka Land 317,400 - 317,400 - Building - 4,018,620,231 - 4,018,620,231 Base station 19,172,340,529 2,814,553,658 19,172,340,529 2,814,553,658 Transmission equipment 10,838,905,993 2,257,885,889 10,838,905,993 2,257,885,889 Computers and other IT equipment 562,423,707 315,331,460 14,798,184 307,124,216 Furniture and fixtures 135,112,118 461,969,932 121,717,234 461,969,932 Vehicles 263,297,572 196,675,019 239,297,572 196,675,019 CWIP transferred 30,972,397,319 10,065,036,189 30,387,376,912 10,056,828,945 Adjustment/write off - 23,088 - 23,088 Total transfer/adjustment of CWIP 30,972,397,319 10,065,059,277 30,387,376,912 10,056,852,033
4.3.2 Capital work in progress - components
Capital work in progress as at 31 December 2011 for separate and consolidated figures includes capital inventory of Tk 2,443,958,253 (2010: Consolidated Tk 1,647,029,014 and Separate Tk 1,478,397,052), and base station, transmission and other telecom equipment, and civil works of Tk 3,808,736,758 (2010: Tk 2,492,217,414).
4.4 Fibre Optic Network under finance lease
This represents the fibre optic network acquired under finance lease from Bangladesh Railway (BR). The lease agreement with BR is valid until June 2027.
4.5 Allocation of depreciation charged during the year Consolidated Separate 2011 2010 2011 2010 Taka Taka Taka Taka Cost of network operation (Note 37) 13,113,781,076 14,736,928,488 13,039,469,227 14,736,911,684 Operating expenses (Note 37) 727,048,292 836,507,111 715,189,362 836,507,111 13,840,829,368 15,573,435,599 13,754,658,589 15,573,418,795
Not
es to
the
Fina
ncia
l Sta
tem
ents

94/95Annual Report 2011
5 In
tang
ible
ass
ets,
net
Year
20
11 (C
onso
lidat
ed)
Pulse
Cod
e M
odul
atio
n (P
CM)
73,6
98,0
00
- -
73,6
98,0
00
60,9
73,3
07
7,13
9,30
3 -
68,11
2,61
0 5,
585,
390
Softw
are
and
othe
rs (N
ote
5.1)
4,
937,
813,
847
810,
447,
610
- 5,
748,
261,4
57
3,51
3,87
9,52
2 86
1,077
,057
-
4,37
4,95
6,57
9 1,3
73,3
04,8
78
Tele
com
lice
nce
- Spe
ctru
m (N
ote
5.2)
5,
920,
000,
000
- -
5,92
0,00
0,00
0 71
3,49
1,195
32
8,88
8,88
8 -
1,042
,380
,083
4,
877,
619,
917
10,9
31,5
11,8
47
810,
447,
610
- 11
,741
,959
,457
4,
288,
344,
024
1,197
,105,
248
- 5,
485,
449,
272
6,25
6,51
0,18
5
Capi
tal w
ork i
n pr
ogre
ss (N
ote
5.3)
34
8,24
8,27
5 1,2
27,6
29,8
97
(810
,447
,610
) 76
5,43
0,56
2 -
- -
- 76
5,43
0,56
2
11,2
79,7
60,12
2 2,
038,
077,
507
(810
,447
,610
) 12
,507
,390
,019
4,
288,
344,
024
1,197
,105,
248
- 5,
485,
449,
272
7,02
1,940
,747
As a
t1 J
anua
ry20
11Ta
ka
Addi
tion
durin
g th
e ye
arTa
ka
Dis
posa
l/Ad
just
men
tdu
ring
the
year
Taka
As a
t31
Dec
embe
r20
11Ta
ka
As a
t1 J
anua
ry20
11Ta
ka
Char
ged
durin
g th
e ye
arTa
ka
Dis
posa
l/Ad
just
men
tdu
ring
the
year
Taka
As a
t31
Dec
embe
r20
11Ta
ka
As
at
31 D
ecem
ber
2011
Tak
a
Carr
ying
am
ount
Dep
reci
atio
nCo
st
Year
20
10 (C
onso
lidat
ed)
Pulse
Cod
e M
odul
atio
n (P
CM)
64,5
50,0
00
9,14
8,00
0 -
73,6
98,0
00
50,5
17,4
42
10,4
55,8
65
- 60
,973
,307
12
,724
,693
Softw
are
and
othe
rs (N
ote
5.1)
4,
438,
938,
377
501,6
05,19
0 (2
,729
,720
) 4,
937,
813,
847
2,63
5,81
7,54
1 88
0,79
1,701
(2
,729
,720
) 3,
513,
879,
522
1,423
,934
,325
Tele
com
lice
nce
- Spe
ctru
m (N
ote
5.2)
5,
920,
000,
000
- -
5,92
0,00
0,00
0 38
4,60
2,30
7 32
8,88
8,88
8 -
713,
491,1
95
5,20
6,50
8,80
5
10,4
23,4
88,3
77
510,
753,
190
(2,7
29,7
20)
10,9
31,5
11,8
47
3,07
0,93
7,29
0 1,2
20,13
6,45
4 (2
,729
,720
) 4,
288,
344,
024
6,64
3,16
7,82
3
Capi
tal w
ork i
n pr
ogre
ss (N
ote
5.3)
32
8,57
5,80
6 53
0,42
5,65
9 (5
10,7
53,19
0)
348,
248,
275
- -
- -
348,
248,
275
10,7
52,0
64,18
3 1,0
41,17
8,84
9 (5
13,4
82,9
10)
11,2
79,7
60,12
2 3,
070,
937,
290
1,220
,136,
454
(2,7
29,7
20)
4,28
8,34
4,02
4 6,
991,4
16,0
98
As a
t1 J
anua
ry20
10Ta
ka
Addi
tion
durin
g th
e ye
arTa
ka
Dis
posa
l/Ad
just
men
tdu
ring
the
year
Taka
As a
t31
Dec
embe
r20
10Ta
ka
As a
t1 J
anua
ry20
10Ta
ka
Char
ged
durin
gth
e ye
arTa
ka
Dis
posa
l/Ad
just
men
tdu
ring
the
year
Taka
As a
t31
Dec
embe
r20
10Ta
ka
As a
t31
Dec
embe
r20
10Ta
ka
Carr
ying
am
ount
Dep
reci
atio
nCo
st
Nam
e of
ass
ets
Nam
e of
ass
ets
Not
es to
the
Fina
ncia
l Sta
tem
ents
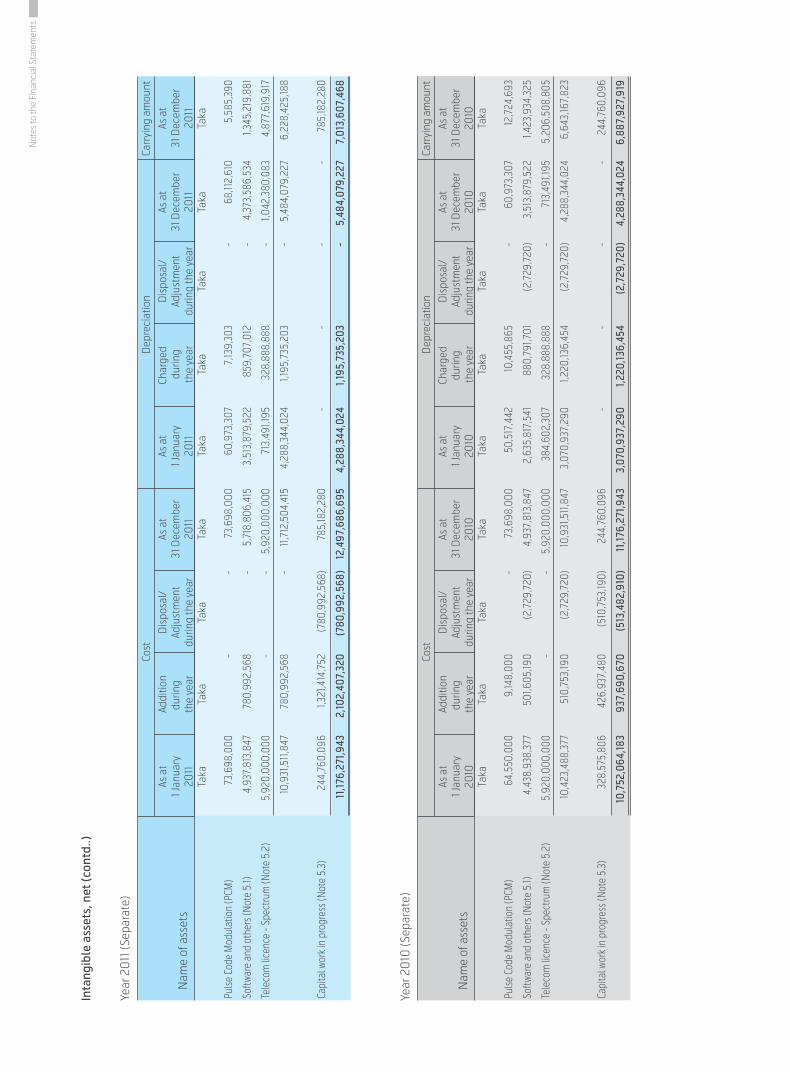
Inta
ngib
le a
sset
s, n
et (c
ontd
..)
Year
20
11 (S
epar
ate)
Pulse
Cod
e M
odul
atio
n (P
CM)
73,6
98,0
00
- -
73,6
98,0
00
60,9
73,3
07
7,13
9,30
3 -
68,11
2,61
0 5,
585,
390
Softw
are
and
othe
rs (N
ote
5.1)
4,
937,
813,
847
780,
992,
568
- 5,
718,
806,
415
3,51
3,87
9,52
2 85
9,70
7,01
2 -
4,37
3,58
6,53
4 1,3
45,2
19,8
81
Tele
com
lice
nce
- Spe
ctru
m (N
ote
5.2)
5,
920,
000,
000
- -
5,92
0,00
0,00
0 71
3,49
1,195
32
8,88
8,88
8 -
1,042
,380
,083
4,
877,
619,
917
10,9
31,5
11,8
47
780,
992,
568
- 11
,712
,504
,415
4,
288,
344,
024
1,195
,735
,203
-
5,48
4,07
9,22
7 6,
228,
425,
188
Capi
tal w
ork i
n pr
ogre
ss (N
ote
5.3)
24
4,76
0,09
6 1,3
21,4
14,7
52
(780
,992
,568
) 78
5,18
2,28
0 -
- -
- 78
5,18
2,28
0
11,17
6,27
1,943
2,
102,
407,
320
(780
,992
,568
) 12
,497
,686
,695
4,
288,
344,
024
1,195
,735
,203
-
5,48
4,07
9,22
7 7,
013,
607,
468
As a
t1 J
anua
ry20
11Ta
ka
Addi
tion
durin
g th
e ye
arTa
ka
Dis
posa
l/Ad
just
men
tdu
ring
the
year
Taka
As a
t31
Dec
embe
r20
11Ta
ka
As a
t1 J
anua
ry20
11Ta
ka
Char
ged
durin
gth
e ye
arTa
ka
Dis
posa
l/Ad
just
men
tdu
ring
the
year
Taka
As a
t31
Dec
embe
r20
11Ta
ka
As
at
31 D
ecem
ber
2011
Tak
a
Carr
ying
am
ount
Dep
reci
atio
nCo
st
Year
20
10 (S
epar
ate)
Pulse
Cod
e M
odul
atio
n (P
CM)
64,5
50,0
00
9,14
8,00
0 -
73,6
98,0
00
50,5
17,4
42
10,4
55,8
65
- 60
,973
,307
12
,724
,693
Softw
are
and
othe
rs (N
ote
5.1)
4,
438,
938,
377
501,6
05,19
0 (2
,729
,720
) 4,
937,
813,
847
2,63
5,81
7,54
1 88
0,79
1,701
(2
,729
,720
) 3,
513,
879,
522
1,423
,934
,325
Tele
com
lice
nce
- Spe
ctru
m (N
ote
5.2)
5,
920,
000,
000
- -
5,92
0,00
0,00
0 38
4,60
2,30
7 32
8,88
8,88
8 -
713,
491,1
95
5,20
6,50
8,80
5
10,4
23,4
88,3
77
510,
753,
190
(2,7
29,7
20)
10,9
31,5
11,8
47
3,07
0,93
7,29
0 1,2
20,13
6,45
4 (2
,729
,720
) 4,
288,
344,
024
6,64
3,16
7,82
3
Capi
tal w
ork i
n pr
ogre
ss (N
ote
5.3)
32
8,57
5,80
6 42
6,93
7,48
0 (5
10,7
53,19
0)
244,
760,
096
- -
- -
244,
760,
096
10,7
52,0
64,18
3 93
7,69
0,67
0 (5
13,4
82,9
10)
11,17
6,27
1,943
3,
070,
937,
290
1,220
,136,
454
(2,7
29,7
20)
4,28
8,34
4,02
4 6,
887,
927,
919
As a
t1 J
anua
ry20
10Ta
ka
Addi
tion
durin
g th
e ye
arTa
ka
Dis
posa
l/Ad
just
men
tdu
ring
the
year
Taka
As a
t31
Dec
embe
r20
10Ta
ka
As a
t1 J
anua
ry20
10Ta
ka
Char
ged
durin
g th
e ye
arTa
ka
Dis
posa
l/Ad
just
men
tdu
ring
the
year
Taka
As a
t31
Dec
embe
r20
10Ta
ka
As a
t31
Dec
embe
r20
10Ta
ka
Carr
ying
am
ount
Dep
reci
atio
nCo
st
Nam
e of
ass
ets
Nam
e of
ass
ets
Not
es to
the
Fina
ncia
l Sta
tem
ents
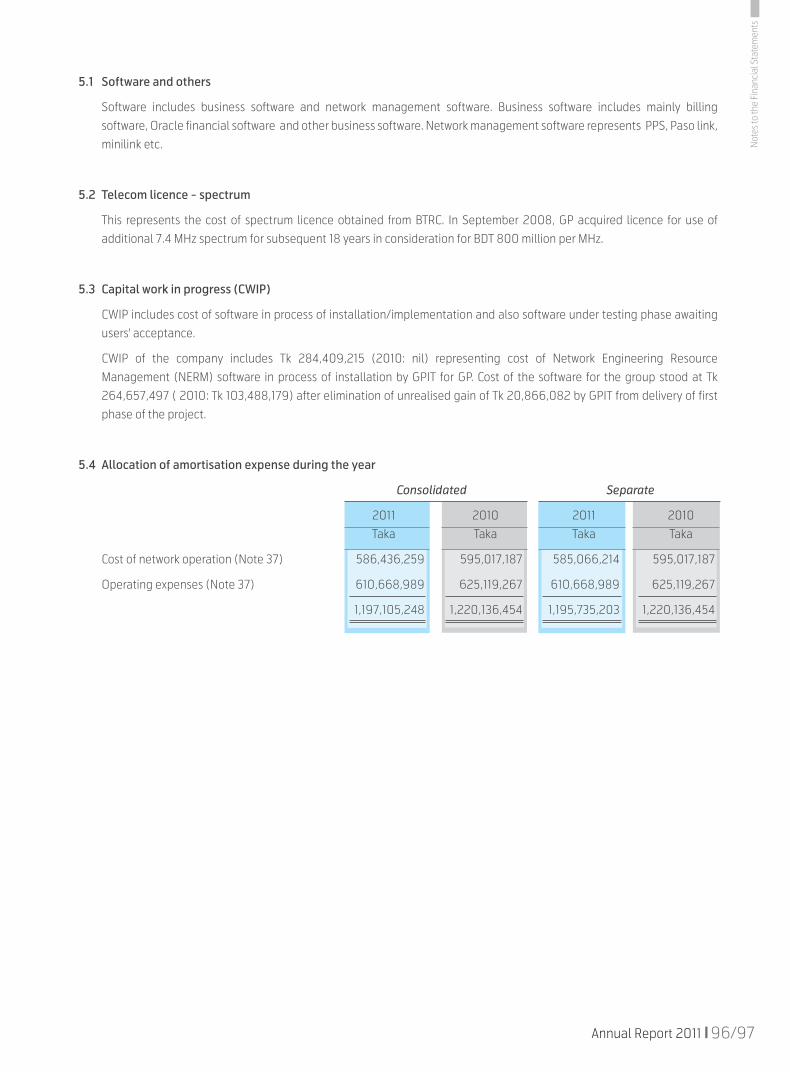
96/97Annual Report 2011
5.1 Software and others
Software includes business software and network management software. Business software includes mainly billing
software, Oracle financial software and other business software. Network management software represents PPS, Paso link,
minilink etc.
5.2 Telecom licence - spectrum
This represents the cost of spectrum licence obtained from BTRC. In September 2008, GP acquired licence for use of
additional 7.4 MHz spectrum for subsequent 18 years in consideration for BDT 800 million per MHz.
5.3 Capital work in progress (CWIP)
CWIP includes cost of software in process of installation/implementation and also software under testing phase awaiting
users' acceptance.
CWIP of the company includes Tk 284,409,215 (2010: nil) representing cost of Network Engineering Resource
Management (NERM) software in process of installation by GPIT for GP. Cost of the software for the group stood at Tk
264,657,497 ( 2010: Tk 103,488,179) after elimination of unrealised gain of Tk 20,866,082 by GPIT from delivery of first
phase of the project.
5.4 Allocation of amortisation expense during the year
Consolidated Separate
2011 2010 2011 2010
Taka Taka Taka Taka
Cost of network operation (Note 37) 586,436,259 595,017,187 585,066,214 595,017,187
Operating expenses (Note 37) 610,668,989 625,119,267 610,668,989 625,119,267
1,197,105,248 1,220,136,454 1,195,735,203 1,220,136,454
Not
es to
the
Fina
ncia
l Sta
tem
ents

6 Investment in subsidiary This represents GP's investment in GPIT, a subsidiary of GP. GPIT was incorporated on 28 January 2010 with the objective of
providing IT related services to GP and other external parties. GPIT was registered as a private limited company with an authorised share capital of Tk 7,500,000,000 divided into 75,000,000 shares of Tk 100 each. As at 31 December 2011, paid up capital of GPIT was Tk. 75,000,000 representing 750,000 shares, out of which 749,999 shares (99.99% of total share capital) were subscribed by GP at face value.
7 Long term deposit This represented the deposit maintained with Southeast Bank Limited as lien against bank guarantees issued in favour of
Bangladesh Railway for lease of optical fibre network. This amount was refundable upon cancellation of guarantee. The guarantee was cancelled on 28 March 2011, and the deposit was consequently released.
8 Inventories Consolidated Separate 2011 2010 2011 2010 Taka Taka Taka Taka Handset, data card and other device 50,293,444 133,374,666 50,293,444 133,374,666 SIM card 247,653,281 633,598,995 247,653,281 633,598,995 Scratch card 33,433,034 67,381,665 33,433,034 67,381,665 IT accessories and services 22,643,490 - - - 354,023,249 834,355,326 331,379,759 834,355,326
8.1 Movement of inventories Handset, data card IT accessories and other device SIM card Scratch card Taka Taka Taka
Balance as at 1 January 2010 - 55,362,359 363,659,067 11,848,783 Purchase during 2010 - 1,187,172,203 805,866,013 72,949,983 Issue during 2010 - (1,058,734,515) (532,711,300) (17,376,328) - 183,800,047 636,813,780 67,422,438 Adjustment/write-off - (50,425,381) (3,214,785) (40,773) Balance as at 31 December 2010 - 133,374,666 633,598,995 67,381,665
Purchase/addition during 2011 48,550,100 1,067,056,791 747,608,518 155,826,699 Issue during 2011 (25,906,610) (1,064,955,334) (1,130,416,634) (189,775,330) 22,643,490 135,476,123 250,790,879 33,433,034 Adjustment/write-off - (85,182,679) (3,137,598) - Balance as at 31 December 2011 22,643,490 50,293,444 247,653,281 33,433,034
8.2 Number of inventories Consolidated Separate 2011 2010 2011 2010 Units Units Units Units Handset, data card and other device 34,238 136,081 34,238 136,081 SIM card 4,342,348 6,221,301 4,342,348 6,221,301 Scratch card 52,583,288 44,681,581 52,583,288 44,681,581
8.3 SIM card As at 31 December 2011, GP had 4,342,348 SIM cards (2010: 6,221,301 SIM cards) out of which 1,231,296 SIM cards (2010:
1,505,220 SIM cards) were intended to be issued with new connection to subscribers. Each new connection currently attracts Tk 605 as VAT and Supplementary Duty to be paid to Govt. exchequer.
9 Deferred cost of connection revenue Balance as at 1 January 484,842,481 483,550,116 484,842,481 483,550,116 Addition during the year 155,771,288 210,567,585 155,771,288 210,567,585 640,613,769 694,117,701 640,613,769 694,117,701 Amortisation during the year (217,756,225) (209,275,220) (217,756,225) (209,275,220) Balance as at 31 December 422,857,544 484,842,481 422,857,544 484,842,481
Not
es to
the
Fina
ncia
l Sta
tem
ents

98/99Annual Report 2011
10 Accounts receivable, net Consolidated Separate 2011 2010 2011 2010 Taka Taka Taka Taka
Receivables for interconnection ( Note 10.1) 4,573,833,235 4,877,394,453 4,573,833,235 4,877,394,453
Receivables for post paid and others (Note 10.2) 430,164,458 180,435,548 430,164,458 180,435,548
Receivables for infrastructure sharing (Note 10.3) 311,685,379 153,522,463 311,685,379 153,522,463
Receivables for sub lease of fibre optic network(Note 10.4) 29,062,072 22,995,771 29,062,072 22,995,771
Other receivables for non-mobile service (Note 10.5) 17,199,287 13,597,537 5,298,091 3,311,174
5,361,944,431 5,247,945,772 5,350,043,235 5,237,659,409
10.1 Receivables for interconnection
Accounts receivable 4,791,993,644 5,095,844,311 4,791,993,644 5,095,844,311
Provision for doubtful debts (218,160,409) (218,449,858) (218,160,409) (218,449,858)
4,573,833,235 4,877,394,453 4,573,833,235 4,877,394,453
10.2 Receivables for post paid and others
Accounts receivable 474,547,063 234,980,149 474,547,063 234,980,149
Provision for doubtful debts (44,382,605) (54,544,601) (44,382,605) (54,544,601)
430,164,458 180,435,548 430,164,458 180,435,548
Receivables for post paid and others include receivables from post paid subscribers, content providers, and channel partners.
10.3 Receivables for infrastructure sharing
Accounts receivable 311,685,379 153,522,463 311,685,379 153,522,463
Provision for doubtful debts - - - -
311,685,379 153,522,463 311,685,379 153,522,463
10.4 Receivables for sub lease of fibre optic network
Accounts receivable- sublease 34,947,224 30,351,110 34,947,224 30,351,110
Provision for doubtful debt (5,885,152) (7,355,339) (5,885,152) (7,355,339)
29,062,072 22,995,771 29,062,072 22,995,771
10.5 Other receivables for non-mobile service
Other receivables for non-mobile service include receivables against broadband internet service, bill pay service of GP and receivables against IT services provided by GPIT.
10.6 Provision for doubtful debts
Balance as at 1 January 280,349,798 145,360,821 280,349,798 145,360,821
Provision made during the year 42,622,969 251,991,051 42,622,969 251,991,051
322,972,767 397,351,872 322,972,767 397,351,872
Written off during the year (54,544,601) (117,002,074) (54,544,601) (117,002,074)
Balance as at 31 December 268,428,166 280,349,798 268,428,166 280,349,798
10.7 Security against accounts receivable
Good and secured 410,160,978 402,024,879 410,160,978 402,024,879
Good with personal security 4,951,783,453 4,845,920,893 4,939,882,257 4,835,634,530
Doubtful and bad 268,428,166 280,349,798 268,428,166 280,349,798
Gross accounts receivable 5,630,372,597 5,528,295,570 5,618,471,401 5,518,009,207
Provision for bad and doubtful debts (268,428,166) (280,349,798) (268,428,166) (280,349,798)
Accounts receivable, net 5,361,944,431 5,247,945,772 5,350,043,235 5,237,659,409
Not
es to
the
Fina
ncia
l Sta
tem
ents
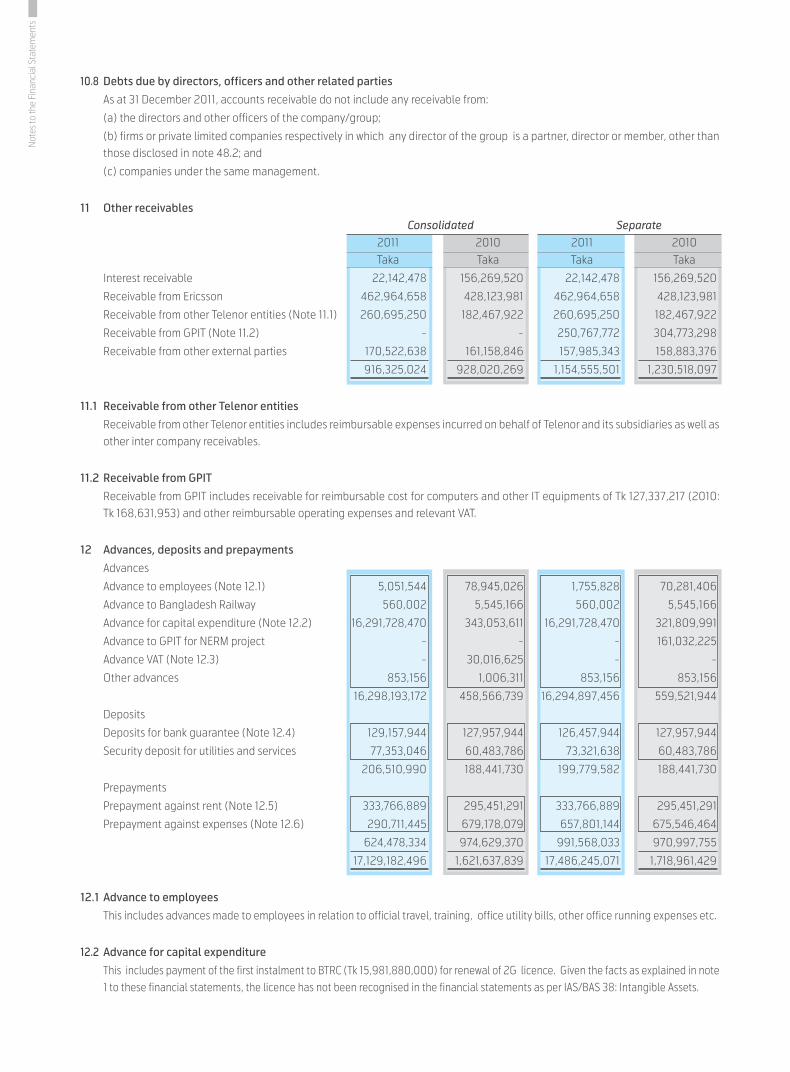
10.8 Debts due by directors, officers and other related parties
As at 31 December 2011, accounts receivable do not include any receivable from:
(a) the directors and other officers of the company/group;
(b) firms or private limited companies respectively in which any director of the group is a partner, director or member, other than those disclosed in note 48.2; and
(c) companies under the same management.
11 Other receivables Consolidated Separate 2011 2010 2011 2010 Taka Taka Taka Taka
Interest receivable 22,142,478 156,269,520 22,142,478 156,269,520
Receivable from Ericsson 462,964,658 428,123,981 462,964,658 428,123,981
Receivable from other Telenor entities (Note 11.1) 260,695,250 182,467,922 260,695,250 182,467,922
Receivable from GPIT (Note 11.2) - - 250,767,772 304,773,298
Receivable from other external parties 170,522,638 161,158,846 157,985,343 158,883,376
916,325,024 928,020,269 1,154,555,501 1,230,518,097
11.1 Receivable from other Telenor entities
Receivable from other Telenor entities includes reimbursable expenses incurred on behalf of Telenor and its subsidiaries as well as other inter company receivables.
11.2 Receivable from GPIT
Receivable from GPIT includes receivable for reimbursable cost for computers and other IT equipments of Tk 127,337,217 (2010: Tk 168,631,953) and other reimbursable operating expenses and relevant VAT.
12 Advances, deposits and prepayments
Advances
Advance to employees (Note 12.1) 5,051,544 78,945,026 1,755,828 70,281,406
Advance to Bangladesh Railway 560,002 5,545,166 560,002 5,545,166
Advance for capital expenditure (Note 12.2) 16,291,728,470 343,053,611 16,291,728,470 321,809,991
Advance to GPIT for NERM project - - - 161,032,225
Advance VAT (Note 12.3) - 30,016,625 - -
Other advances 853,156 1,006,311 853,156 853,156
16,298,193,172 458,566,739 16,294,897,456 559,521,944
Deposits
Deposits for bank guarantee (Note 12.4) 129,157,944 127,957,944 126,457,944 127,957,944
Security deposit for utilities and services 77,353,046 60,483,786 73,321,638 60,483,786
206,510,990 188,441,730 199,779,582 188,441,730
Prepayments
Prepayment against rent (Note 12.5) 333,766,889 295,451,291 333,766,889 295,451,291
Prepayment against expenses (Note 12.6) 290,711,445 679,178,079 657,801,144 675,546,464
624,478,334 974,629,370 991,568,033 970,997,755
17,129,182,496 1,621,637,839 17,486,245,071 1,718,961,429
12.1 Advance to employees This includes advances made to employees in relation to official travel, training, office utility bills, other office running expenses etc.
12.2 Advance for capital expenditure
This includes payment of the first instalment to BTRC (Tk 15,981,880,000) for renewal of 2G licence. Given the facts as explained in note 1 to these financial statements, the licence has not been recognised in the financial statements as per IAS/BAS 38: Intangible Assets.
Not
es to
the
Fina
ncia
l Sta
tem
ents

100/101Annual Report 2011
12.3 Advance VAT
This represents advance VAT of GPIT and includes debit balance of VAT current account, and VAT deducted at source (which can be claimed as rebate) by customers from GPIT's bills against which VAT deduction certificates and/or copy of treasury challans are yet to be received.
12.4 Deposits for bank guarantee
This represents the guarantee margins with different banks against guarantee provided by them favouring Commissioner of Customs and other parties.
12.5 Prepayment against rent
This represents payment of rent in advance for base stations and office locations.
12.6 Prepayment against expenses
This includes prepaid insurance premium, payment to suppliers for operating inventories, spare parts, software support maintenance and others.
12.7 Security against advances Consolidated Separate 2011 2010 2011 2010 Taka Taka Taka Taka
Good and secured 309,848,470 343,053,611 309,848,470 321,809,991
Good with personal security 15,988,344,702 115,513,128 15,985,048,986 237,711,953
Doubtful and bad - - - -
16,298,193,172 458,566,739 16,294,897,456 559,521,944
Provision for bad and doubtful amount - - - -
Total advances 16,298,193,172 458,566,739 16,294,897,456 559,521,944
12.8 Loans and advances to subsidiaries, directors, officers and other related parties
Other than those mentioned in note 12.1 and 48.2, there were no loans or advances to-
(a) Directors of the company/group;
(b) Firms or private limited companies respectively in which any director of Grameenphone Ltd. is a partner, director or member;
and
(c) Subsidiaries or companies under the same management.
13 Short term investment This includes the amount of Fixed Deposits Receipts (FDR) of Tk. 98,897,594 (2010: Tk 1,161,620) with Southeast Bank Limited, Tk.
46,132,500 (2010: nil) with One Bank Ltd and Tk. 36,826,875 (2010: Tk 2,752,567,490) with other banks as at the statement of financial position date having original maturity of three months or more. The interest rates on these FDRs range from 8.25% to 13.75% (2010: 8.25% to 11%). Out of this total amount, Tk 135,459,375 (2010: Tk 135,459,375) is restricted to the settlement of bills pay liabilities.
14 Cash and cash equivalents
Cash in hand 4,424,850 3,737,483 4,424,850 3,697,741
Cash at bank (Note 14.1) 8,050,172,142 18,927,765,069 7,623,748,644 18,671,232,085
8,054,596,992 18,931,502,552 7,628,173,494 18,674,929,826
14.1 Cash at bank
Consolidated cash at bank includes cash of Tk 3,196,335,960 (2010: Tk 1,790,754,085) at Citibank N.A. , Tk 444,441,720 (2010: Tk 260,262,726) at The City Bank Limited , Tk 2,493,754 (2010: Tk 1,141,777,137) at Shahjalal Islami Bank Limited , Tk 479,586,146 (2010: Tk 1,355,012,298) at Southeast Bank Limited and cash at other banks.
Cash at bank also includes utility bill pay service collection accounts amounting to Tk. 416,563,884 (2010: Tk. 418,184,172). Use of this amount is restricted to settlement of payable for bills pay receipts as mentioned in note 26.
Not
es to
the
Fina
ncia
l Sta
tem
ents
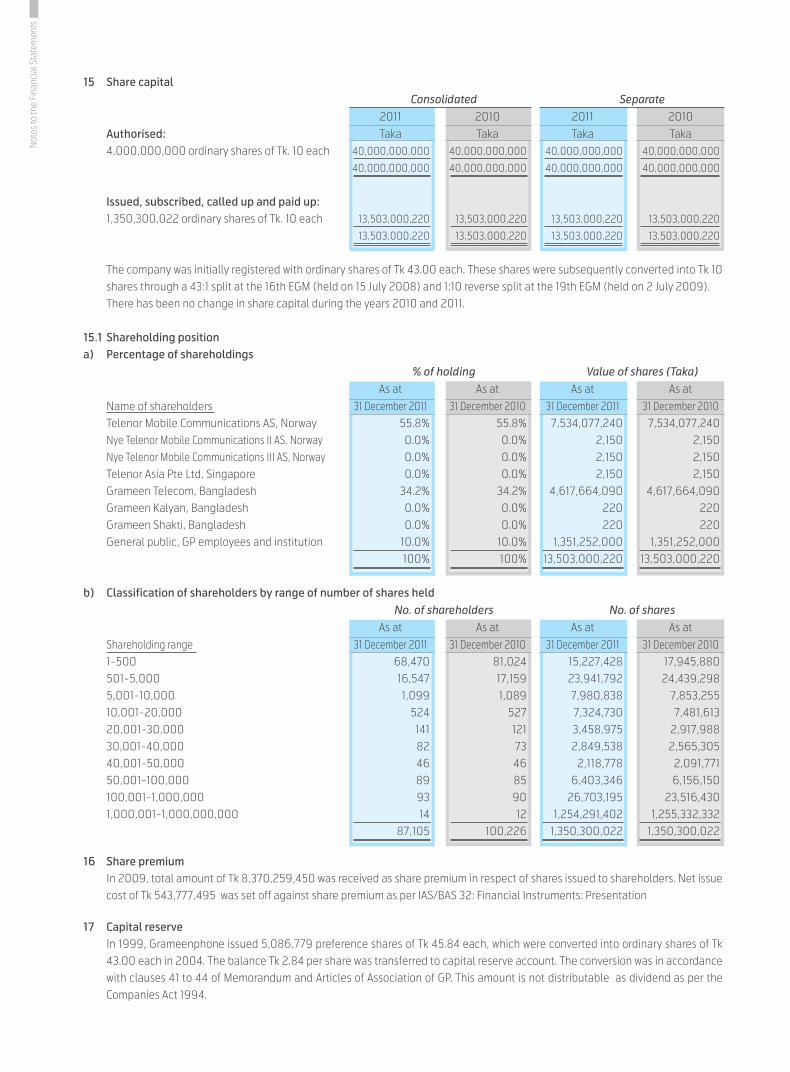
15 Share capital Consolidated Separate 2011 2010 2011 2010 Authorised: Taka Taka Taka Taka 4,000,000,000 ordinary shares of Tk. 10 each 40,000,000,000 40,000,000,000 40,000,000,000 40,000,000,000
40,000,000,000 40,000,000,000 40,000,000,000 40,000,000,000
Issued, subscribed, called up and paid up: 1,350,300,022 ordinary shares of Tk. 10 each 13,503,000,220 13,503,000,220 13,503,000,220 13,503,000,220
13,503,000,220 13,503,000,220 13,503,000,220 13,503,000,220
The company was initially registered with ordinary shares of Tk 43.00 each. These shares were subsequently converted into Tk 10 shares through a 43:1 split at the 16th EGM (held on 15 July 2008) and 1:10 reverse split at the 19th EGM (held on 2 July 2009).
There has been no change in share capital during the years 2010 and 2011.
15.1 Shareholding positiona) Percentage of shareholdings % of holding Value of shares (Taka) As at As at As at As at Name of shareholders 31 December 2011 31 December 2010 31 December 2011 31 December 2010 Telenor Mobile Communications AS, Norway 55.8% 55.8% 7,534,077,240 7,534,077,240 Nye Telenor Mobile Communications II AS, Norway 0.0% 0.0% 2,150 2,150 Nye Telenor Mobile Communications III AS, Norway 0.0% 0.0% 2,150 2,150 Telenor Asia Pte Ltd, Singapore 0.0% 0.0% 2,150 2,150 Grameen Telecom, Bangladesh 34.2% 34.2% 4,617,664,090 4,617,664,090 Grameen Kalyan, Bangladesh 0.0% 0.0% 220 220 Grameen Shakti, Bangladesh 0.0% 0.0% 220 220 General public, GP employees and institution 10.0% 10.0% 1,351,252,000 1,351,252,000 100% 100% 13,503,000,220 13,503,000,220
b) Classification of shareholders by range of number of shares held No. of shareholders No. of shares As at As at As at As at Shareholding range 31 December 2011 31 December 2010 31 December 2011 31 December 2010 1-500 68,470 81,024 15,227,428 17,945,880 501-5,000 16,547 17,159 23,941,792 24,439,298 5,001-10,000 1,099 1,089 7,980,838 7,853,255 10,001-20,000 524 527 7,324,730 7,481,613 20,001-30,000 141 121 3,458,975 2,917,988 30,001-40,000 82 73 2,849,538 2,565,305 40,001-50,000 46 46 2,118,778 2,091,771 50,001-100,000 89 85 6,403,346 6,156,150 100,001-1,000,000 93 90 26,703,195 23,516,430 1,000,001-1,000,000,000 14 12 1,254,291,402 1,255,332,332 87,105 100,226 1,350,300,022 1,350,300,022
16 Share premium In 2009, total amount of Tk 8,370,259,450 was received as share premium in respect of shares issued to shareholders. Net issue
cost of Tk 543,777,495 was set off against share premium as per IAS/BAS 32: Financial Instruments: Presentation
17 Capital reserve In 1999, Grameenphone issued 5,086,779 preference shares of Tk 45.84 each, which were converted into ordinary shares of Tk
43.00 each in 2004. The balance Tk 2.84 per share was transferred to capital reserve account. The conversion was in accordance with clauses 41 to 44 of Memorandum and Articles of Association of GP. This amount is not distributable as dividend as per the Companies Act 1994.
Not
es to
the
Fina
ncia
l Sta
tem
ents

102/103Annual Report 2011
18 Deposit from shareholders Deposit from shareholders as at the statement of financial position date represents balance of the share money received from
Telenor Mobile Communications AS, Norway, which has not been used against issuance of shares.
19 General reserve Grameenphone availed tax holiday benefits from 1 June 2001 to 31 May 2006 as per the provisions of Income Tax Ordinance 1984.
A tax holiday reserve was created during the Tax Holiday period to ensure investment in compliance with the said ordinance. The reserve was subsequently transferred to general reserve upon fulfilment of necessary conditions.
20 Non controlling interest Non controlling interest is the equity in GPIT not attributable, directly or indirectly, to GP. This includes the amount of paid up
capital and proportionate share of accumulated profit/loss of GPIT attributable to shareholders of GPIT other than GP.
21 Deposit from agents and subscribers Consolidated Separate 2011 2010 2011 2010 Taka Taka Taka Taka Security deposits from subscribers (Note 21.1) 410,160,978 402,024,879 410,160,978 402,024,879 Security deposits from dealers and agents (Note 21.2) 45,615,000 42,615,000 45,615,000 42,615,000 455,775,978 444,639,879 455,775,978 444,639,879
21.1 Security deposits from subscribers This represents security money obtained from post paid subscribers against their dues and can be used in full or in part to adjust
any unpaid portion of such dues. Any unadjusted amount of security deposits is refundable to subscribers on termination of customer relationship or on demand.
21.2 Security deposits from dealers and agents Security deposits from dealers and agents represent security money obtained from channel partners (i.e. dealer, distributor, outlet
agent). These deposits can be used in full or in part to adjust any amount due and are refundable at the termination of contract.
22 Finance lease obligation Grameenphone entered into a lease agreement with Bangladesh Railway (BR) in 1997 for the right to use the optical fibre network
along with its ancillary facilities. The lease was treated as operating lease until the end of 2004. Following an amendment to the lease agreement in 2004, it has been reclassified as finance lease and has been treated as such since 1 January 2005. The lease agreement was further amended on 13 June 2007 with Guaranteed Annual Rental (GAR) being revised and lease term being extended up to June 2027.
Obligation under finance lease was initially measured at an amount equal to the present value of minimum lease payments. The effect of change in lease agreement in 2007 was accounted for as an adjustment of the leased asset and obligation by the amount equal to the difference between the present value of revised minimum lease payments and the carrying amount of lease obligation at that date. GP's incremental borrowing rate, which was 15% at the inception of the lease, was used to calculate the present value of minimum lease payments, as it was impracticable to determine the implicit interest rate at that time.
Finance lease obligation 5,019,805,838 5,019,805,838 5,019,805,838 5,019,805,838 Less: Current portion (Note 22.1) - - - - 5,019,805,838 5,019,805,838 5,019,805,838 5,019,805,838
Finance lease obligation as at 31 December 2011 is payable as follows: Present value of Future minimum minimum lease lease payments Interest payments Taka Taka Taka (i) Not later than one year 738,296,891 738,296,891 - (ii) Later than one year but not later than five years 3,254,533,236 3,254,533,236 - (iii) Later than five years 10,833,376,835 5,813,570,997 5,019,805,838 14,826,206,962 9,806,401,124 5,019,805,838
Not
es to
the
Fina
ncia
l Sta
tem
ents
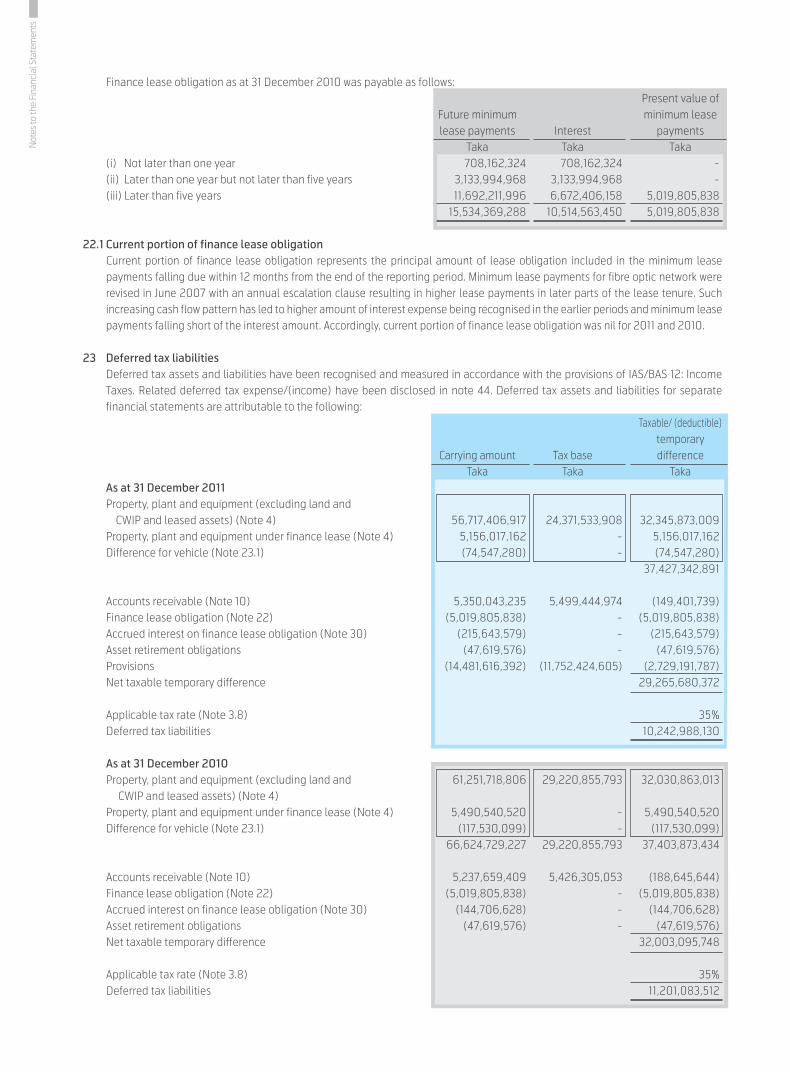
Finance lease obligation as at 31 December 2010 was payable as follows: Present value of Future minimum minimum lease lease payments Interest payments Taka Taka Taka (i) Not later than one year 708,162,324 708,162,324 - (ii) Later than one year but not later than five years 3,133,994,968 3,133,994,968 - (iii) Later than five years 11,692,211,996 6,672,406,158 5,019,805,838 15,534,369,288 10,514,563,450 5,019,805,838
22.1 Current portion of finance lease obligation Current portion of finance lease obligation represents the principal amount of lease obligation included in the minimum lease
payments falling due within 12 months from the end of the reporting period. Minimum lease payments for fibre optic network were revised in June 2007 with an annual escalation clause resulting in higher lease payments in later parts of the lease tenure. Such increasing cash flow pattern has led to higher amount of interest expense being recognised in the earlier periods and minimum lease payments falling short of the interest amount. Accordingly, current portion of finance lease obligation was nil for 2011 and 2010.
23 Deferred tax liabilities Deferred tax assets and liabilities have been recognised and measured in accordance with the provisions of IAS/BAS 12: Income
Taxes. Related deferred tax expense/(income) have been disclosed in note 44. Deferred tax assets and liabilities for separate financial statements are attributable to the following:
Taxable/ (deductible) temporary Carrying amount Tax base difference Taka Taka Taka As at 31 December 2011 Property, plant and equipment (excluding land and CWIP and leased assets) (Note 4) 56,717,406,917 24,371,533,908 32,345,873,009 Property, plant and equipment under finance lease (Note 4) 5,156,017,162 - 5,156,017,162 Difference for vehicle (Note 23.1) (74,547,280) - (74,547,280) 37,427,342,891
Accounts receivable (Note 10) 5,350,043,235 5,499,444,974 (149,401,739) Finance lease obligation (Note 22) (5,019,805,838) - (5,019,805,838) Accrued interest on finance lease obligation (Note 30) (215,643,579) - (215,643,579) Asset retirement obligations (47,619,576) - (47,619,576) Provisions (14,481,616,392) (11,752,424,605) (2,729,191,787) Net taxable temporary difference 29,265,680,372
Applicable tax rate (Note 3.8) 35% Deferred tax liabilities 10,242,988,130
As at 31 December 2010 Property, plant and equipment (excluding land and 61,251,718,806 29,220,855,793 32,030,863,013 CWIP and leased assets) (Note 4) Property, plant and equipment under finance lease (Note 4) 5,490,540,520 - 5,490,540,520 Difference for vehicle (Note 23.1) (117,530,099) - (117,530,099) 66,624,729,227 29,220,855,793 37,403,873,434
Accounts receivable (Note 10) 5,237,659,409 5,426,305,053 (188,645,644) Finance lease obligation (Note 22) (5,019,805,838) - (5,019,805,838) Accrued interest on finance lease obligation (Note 30) (144,706,628) - (144,706,628) Asset retirement obligations (47,619,576) - (47,619,576) Net taxable temporary difference 32,003,095,748
Applicable tax rate (Note 3.8) 35% Deferred tax liabilities 11,201,083,512
Not
es to
the
Fina
ncia
l Sta
tem
ents

104/105Annual Report 2011
As per the provisions of Income Tax Ordinance 1984 (ITO), any income derived from the business of software development and Information Technology Enabled Services (ITES) is subject to tax exemption until 30 June 2013 and hence deferred tax liability for GPIT is not considered.
23.1 Difference for vehicle This represents the permanent difference related to sedan cars, not plying for hire, owned by GP. As per the provisions of Income
Tax Ordinance 1984, depreciation on such cars is allowed only up to certain limit of cost (currently Tk. 2 million per car) of such cars for tax purpose. Difference for vehicle represents the amount of cost exceeding such limits.
24 Long term provisions Consolidated Separate 2011 2010 2011 2010 Taka Taka Taka Taka Asset retirement obligations (Note 24.1) 104,716,420 162,876,392 104,716,420 162,876,392 Employee benefits - provision for gratuity (Note 24.2) - - - - 104,716,420 162,876,392 104,716,420 162,876,392
24.1 Asset retirement obligations (ARO) Balance as at 1 January 162,876,392 160,033,350 162,876,392 160,033,350 Provision made during the year 24,189,972 18,105,501 24,189,972 18,105,501 187,066,364 178,138,851 187,066,364 178,138,851 Adjustment/payment made during the year (82,349,944) (15,262,459) (82,349,944) (15,262,459) Balance as at 31 December 104,716,420 162,876,392 104,716,420 162,876,392
Grameenphone Ltd. recognises asset retirement obligations (ARO) in respect of roof-top base stations and office space for any constructive and/or legal obligations for dismantlement, removal or restoration incurred by the company as a consequence of installing or constructing the sites. ARO is measured at the present value of expected cash out flows required to settle such obligations. Unwinding of the discount is charged as financial expense in the profit or loss.
24.2 Employee benefits - provision for gratuity Balance as at 1 January - 11,454,139 - 11,454,139 Provisions made during the year 365,599,706 361,074,926 345,240,164 342,551,685 365,599,706 372,529,065 345,240,164 354,005,824 Transfer to fund during the year (365,599,706) (372,529,065) (345,240,164) (354,005,824) Balance as at 31 December - - - -
25 Accounts payable Liability for capital expenditure 5,666,817,629 2,254,497,329 5,645,629,609 2,246,290,076 Payable for expenses: Interconnection charges (Note 25.1) 32,468,286 28,402,068 32,468,286 28,402,068 Revenue sharing with content providers 211,002,698 113,692,440 233,864,396 113,692,440 International roaming services 69,331,739 63,481,362 69,331,739 63,481,362 Training and travel expenses 38,141,067 28,761,409 36,481,195 27,387,721 Sales and promotional expenses 151,785,409 96,973,807 150,195,815 96,973,807 Consultancy and professional fees 3,381,308,109 1,671,648,455 3,278,699,664 1,671,648,455 Cost of SIM card, scratch card, handsets etc. 249,980,238 217,699,901 249,980,238 217,699,901 Office and general expenses 203,824,590 101,903,913 194,689,584 79,932,199 PCM related expenses 56,996,185 48,764,725 56,996,185 48,764,725 Network operations and maintenance 364,378,386 325,338,658 360,989,513 314,169,878 4,759,216,707 2,696,666,738 4,663,696,615 2,662,152,556 Payable for others: Tax deducted at source from suppliers 244,368,578 190,429,664 244,368,578 190,429,664 VAT deducted at source from suppliers 105,660,831 95,765,284 105,660,831 95,765,284 Payables for bills pay receipt 21,236,584 33,631,522 21,236,584 33,631,522 Retention money from suppliers 43,033,714 25,457,240 43,033,714 25,457,240 414,299,707 345,283,710 414,299,707 345,283,710 10,840,334,043 5,296,447,777 10,723,625,931 5,253,726,342
Not
es to
the
Fina
ncia
l Sta
tem
ents
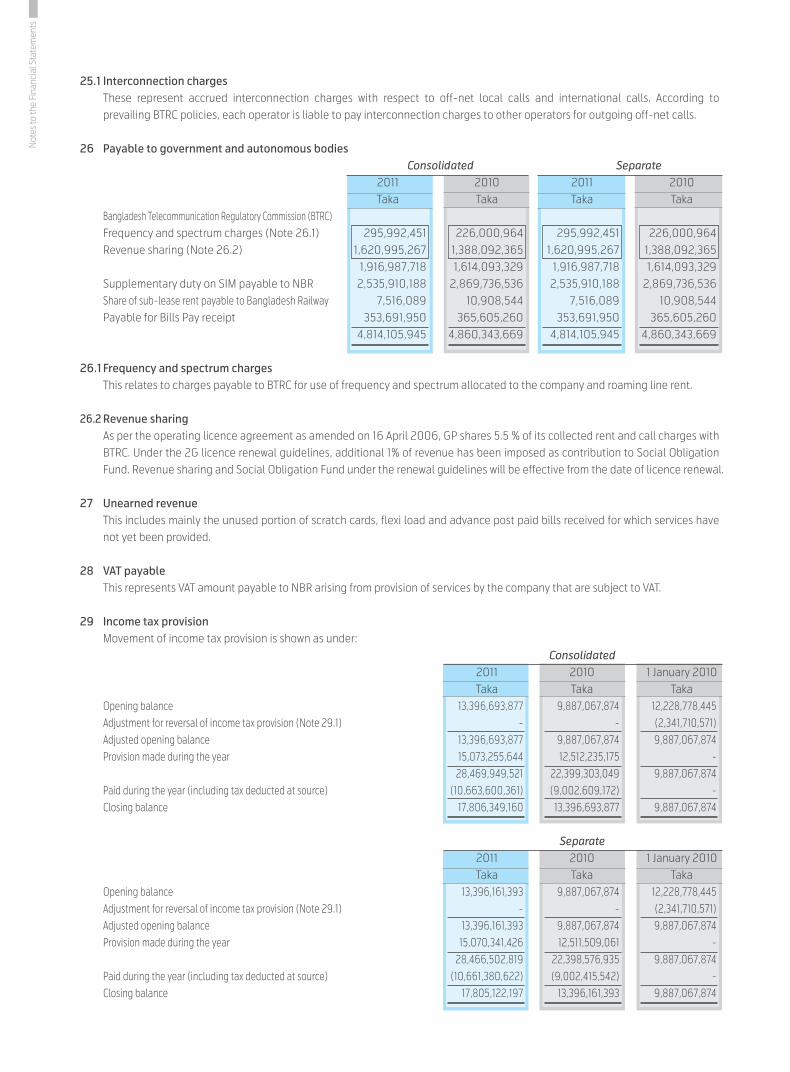
25.1 Interconnection charges These represent accrued interconnection charges with respect to off-net local calls and international calls. According to
prevailing BTRC policies, each operator is liable to pay interconnection charges to other operators for outgoing off-net calls.
26 Payable to government and autonomous bodies Consolidated Separate 2011 2010 2011 2010 Taka Taka Taka Taka Bangladesh Telecommunication Regulatory Commission (BTRC) Frequency and spectrum charges (Note 26.1) 295,992,451 226,000,964 295,992,451 226,000,964 Revenue sharing (Note 26.2) 1,620,995,267 1,388,092,365 1,620,995,267 1,388,092,365 1,916,987,718 1,614,093,329 1,916,987,718 1,614,093,329 Supplementary duty on SIM payable to NBR 2,535,910,188 2,869,736,536 2,535,910,188 2,869,736,536 Share of sub-lease rent payable to Bangladesh Railway 7,516,089 10,908,544 7,516,089 10,908,544 Payable for Bills Pay receipt 353,691,950 365,605,260 353,691,950 365,605,260 4,814,105,945 4,860,343,669 4,814,105,945 4,860,343,669
26.1 Frequency and spectrum charges This relates to charges payable to BTRC for use of frequency and spectrum allocated to the company and roaming line rent.
26.2 Revenue sharing As per the operating licence agreement as amended on 16 April 2006, GP shares 5.5 % of its collected rent and call charges with
BTRC. Under the 2G licence renewal guidelines, additional 1% of revenue has been imposed as contribution to Social Obligation Fund. Revenue sharing and Social Obligation Fund under the renewal guidelines will be effective from the date of licence renewal.
27 Unearned revenue This includes mainly the unused portion of scratch cards, flexi load and advance post paid bills received for which services have
not yet been provided.
28 VAT payable This represents VAT amount payable to NBR arising from provision of services by the company that are subject to VAT.
29 Income tax provision Movement of income tax provision is shown as under: Consolidated 2011 2010 1 January 2010 Taka Taka Taka Opening balance 13,396,693,877 9,887,067,874 12,228,778,445 Adjustment for reversal of income tax provision (Note 29.1) - - (2,341,710,571) Adjusted opening balance 13,396,693,877 9,887,067,874 9,887,067,874 Provision made during the year 15,073,255,644 12,512,235,175 - 28,469,949,521 22,399,303,049 9,887,067,874 Paid during the year (including tax deducted at source) (10,663,600,361) (9,002,609,172) - Closing balance 17,806,349,160 13,396,693,877 9,887,067,874
Separate 2011 2010 1 January 2010 Taka Taka Taka Opening balance 13,396,161,393 9,887,067,874 12,228,778,445 Adjustment for reversal of income tax provision (Note 29.1) - - (2,341,710,571) Adjusted opening balance 13,396,161,393 9,887,067,874 9,887,067,874 Provision made during the year 15,070,341,426 12,511,509,061 - 28,466,502,819 22,398,576,935 9,887,067,874 Paid during the year (including tax deducted at source) (10,661,380,622) (9,002,415,542) - Closing balance 17,805,122,197 13,396,161,393 9,887,067,874
Not
es to
the
Fina
ncia
l Sta
tem
ents
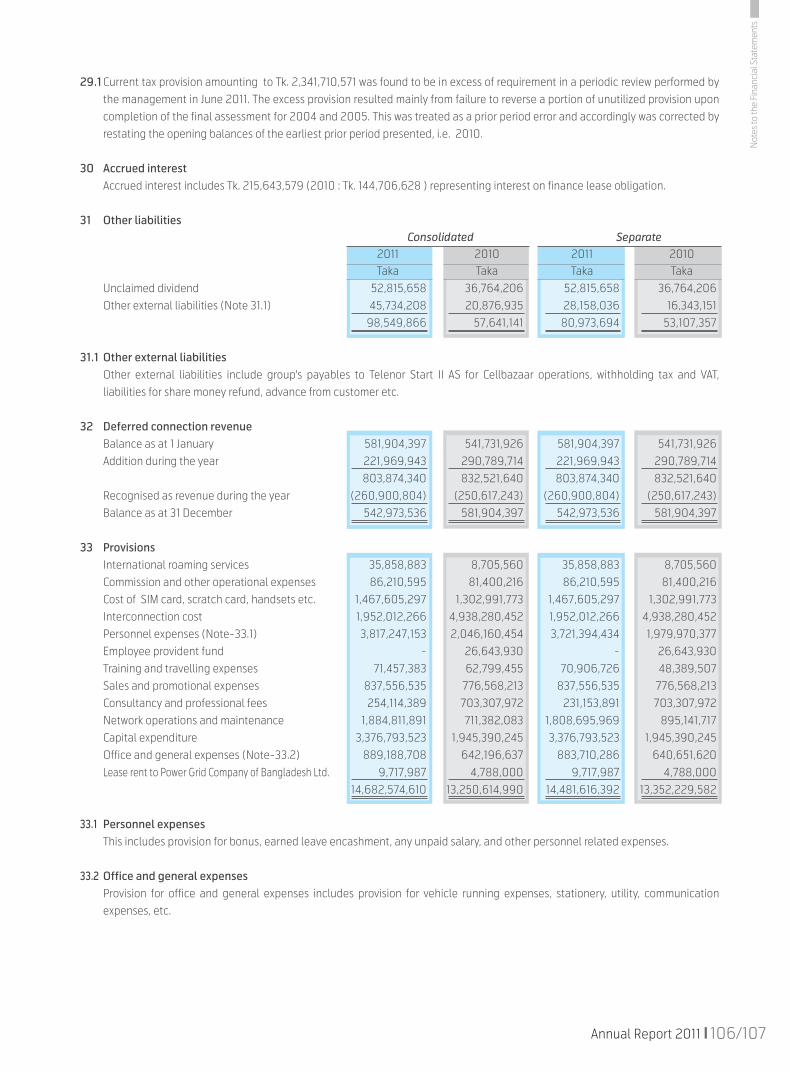
106/107Annual Report 2011
29.1 Current tax provision amounting to Tk. 2,341,710,571 was found to be in excess of requirement in a periodic review performed by the management in June 2011. The excess provision resulted mainly from failure to reverse a portion of unutilized provision upon completion of the final assessment for 2004 and 2005. This was treated as a prior period error and accordingly was corrected by restating the opening balances of the earliest prior period presented, i.e. 2010.
30 Accrued interest Accrued interest includes Tk. 215,643,579 (2010 : Tk. 144,706,628 ) representing interest on finance lease obligation.
31 Other liabilities Consolidated Separate 2011 2010 2011 2010 Taka Taka Taka Taka Unclaimed dividend 52,815,658 36,764,206 52,815,658 36,764,206 Other external liabilities (Note 31.1) 45,734,208 20,876,935 28,158,036 16,343,151 98,549,866 57,641,141 80,973,694 53,107,357
31.1 Other external liabilities Other external liabilities include group's payables to Telenor Start II AS for Cellbazaar operations, withholding tax and VAT,
liabilities for share money refund, advance from customer etc.
32 Deferred connection revenue Balance as at 1 January 581,904,397 541,731,926 581,904,397 541,731,926 Addition during the year 221,969,943 290,789,714 221,969,943 290,789,714 803,874,340 832,521,640 803,874,340 832,521,640 Recognised as revenue during the year (260,900,804) (250,617,243) (260,900,804) (250,617,243) Balance as at 31 December 542,973,536 581,904,397 542,973,536 581,904,397
33 Provisions International roaming services 35,858,883 8,705,560 35,858,883 8,705,560 Commission and other operational expenses 86,210,595 81,400,216 86,210,595 81,400,216 Cost of SIM card, scratch card, handsets etc. 1,467,605,297 1,302,991,773 1,467,605,297 1,302,991,773 Interconnection cost 1,952,012,266 4,938,280,452 1,952,012,266 4,938,280,452 Personnel expenses (Note-33.1) 3,817,247,153 2,046,160,454 3,721,394,434 1,979,970,377 Employee provident fund - 26,643,930 - 26,643,930 Training and travelling expenses 71,457,383 62,799,455 70,906,726 48,389,507 Sales and promotional expenses 837,556,535 776,568,213 837,556,535 776,568,213 Consultancy and professional fees 254,114,389 703,307,972 231,153,891 703,307,972 Network operations and maintenance 1,884,811,891 711,382,083 1,808,695,969 895,141,717 Capital expenditure 3,376,793,523 1,945,390,245 3,376,793,523 1,945,390,245 Office and general expenses (Note-33.2) 889,188,708 642,196,637 883,710,286 640,651,620 Lease rent to Power Grid Company of Bangladesh Ltd. 9,717,987 4,788,000 9,717,987 4,788,000 14,682,574,610 13,250,614,990 14,481,616,392 13,352,229,582
33.1 Personnel expenses This includes provision for bonus, earned leave encashment, any unpaid salary, and other personnel related expenses.
33.2 Office and general expenses Provision for office and general expenses includes provision for vehicle running expenses, stationery, utility, communication
expenses, etc.
Not
es to
the
Fina
ncia
l Sta
tem
ents

34 Revenue Consolidated Separate 2011 2010 2011 2010 Taka Taka Taka Taka Traffic revenue -Post paid 2,671,896,715 2,601,806,772 2,671,896,715 2,601,806,772 -Prepaid 69,746,817,670 58,804,470,026 69,746,817,670 58,804,470,026 72,418,714,385 61,406,276,798 72,418,714,385 61,406,276,798 Subscription revenue -Post paid 566,479,749 632,968,125 566,479,749 632,968,125 Connection revenue -Post paid 3,902,385 11,215,442 3,902,385 11,215,442 -Prepaid 262,344,039 235,311,520 262,344,039 235,311,520 266,246,424 246,526,962 266,246,424 246,526,962 Roaming revenue -Inbound 417,108,357 211,251,659 417,108,357 211,251,659 -Outbound 321,584,002 253,026,794 321,584,002 253,026,794 738,692,359 464,278,453 738,692,359 464,278,453 Interconnection revenue -Post paid 132,963,093 130,314,299 132,963,093 130,314,299 -Prepaid 8,543,517,399 7,292,825,149 8,543,517,399 7,292,825,149 8,676,480,492 7,423,139,448 8,676,480,492 7,423,139,448 Other mobile revenue -Customer support revenue 11,715,274 9,939,263 11,715,274 9,939,263 -SMS and MMS revenue 953,238,279 940,054,489 953,238,279 940,054,489 -Internet and data revenue 1,560,131,157 1,199,732,065 1,560,131,157 1,199,732,065 -VAS and other revenue (Note 34.1) 1,586,704,168 876,590,604 1,586,704,168 876,590,604 4,111,788,878 3,026,316,421 4,111,788,878 3,026,316,421 Non- mobile revenue -Sale of handset 826,107,532 720,457,284 826,107,532 720,457,284 -Sale of data card 279,900,439 417,901,222 279,900,439 417,901,222 -Sale of vehicle tracking systems 18,929,131 4,488,791 18,929,131 4,488,791 -Infrastructure sharing revenue 1,086,281,712 366,748,338 1,086,281,712 366,748,338 -Commissions 1,945,796 4,323,941 1,945,796 4,323,941 -Broadband internet revenue 387,996 291,005 387,996 291,005 -Bills pay service 14,745,882 10,781,036 14,745,882 10,781,036 -IT service maintenance fee (Note 34.2) 52,916,151 8,578,610 - - 2,281,214,639 1,533,570,227 2,228,298,488 1,524,991,617 89,059,616,926 74,733,076,434 89,006,700,775 74,724,497,824
34.1 VAS and other revenue Value Added Service (VAS) revenue includes revenue from content sale (e.g. medical services and music download services, news
services, and other contents), call block service, mobile back-up service etc.
34.2 IT service maintenance fee This represents revenue earned by the group on account of IT services provided to external customers, both foreign and local.
35 Direct cost of network revenue Cost of interconnection (Note 35.1) 3,816,501,489 3,220,716,202 3,816,501,489 3,220,716,202 Cost of SIM card, scratch card, handset etc. (Note 35.2) 2,362,735,807 2,313,553,976 2,362,735,807 2,313,553,976 International roaming cost (Note 35.3) 226,833,866 218,580,685 226,833,866 218,580,685 Licence fees and spectrum charges (Note 35.4) 775,692,609 713,715,145 775,692,609 713,715,145 Revenue sharing with BTRC (Note 35.5) 4,779,925,045 3,811,231,491 4,779,925,045 3,811,231,491 Dealers' and agents' commission 5,427,228,305 4,768,977,779 5,427,228,305 4,768,977,779 Revenue sharing with content providers and others 263,587,723 18,667,116 280,112,858 18,667,116 17,652,504,844 15,065,442,394 17,669,029,979 15,065,442,394
Not
es to
the
Fina
ncia
l Sta
tem
ents
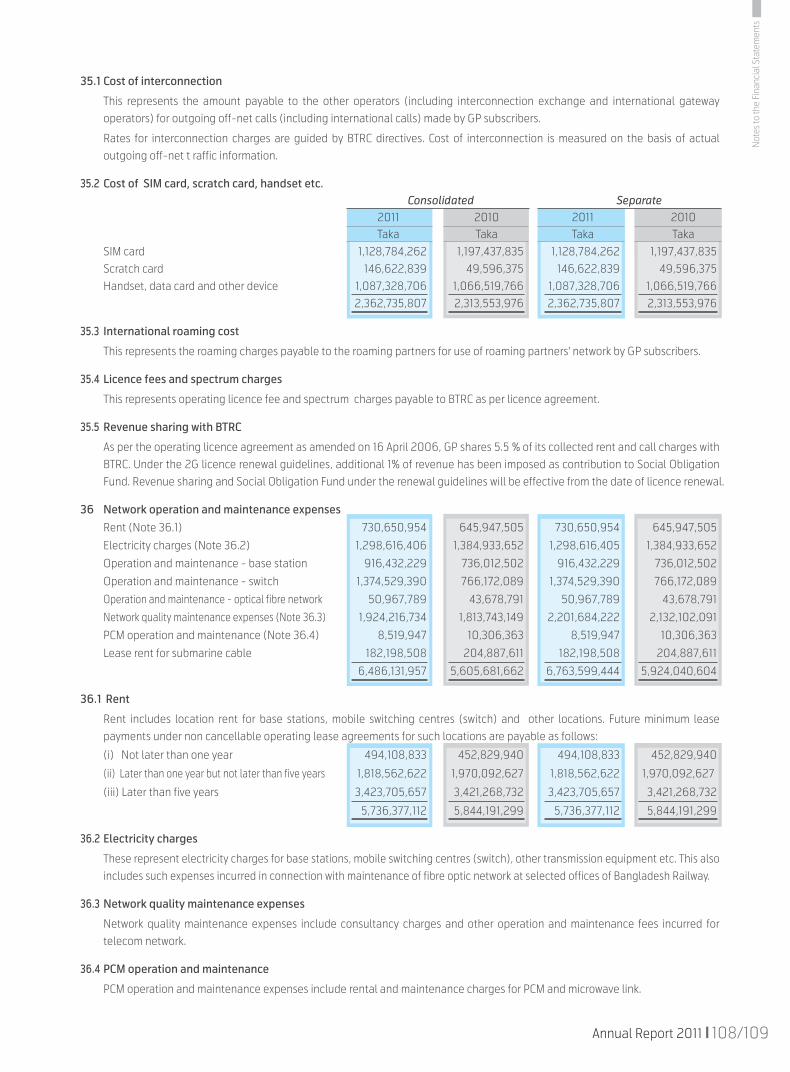
108/109Annual Report 2011
35.1 Cost of interconnection
This represents the amount payable to the other operators (including interconnection exchange and international gateway operators) for outgoing off-net calls (including international calls) made by GP subscribers.
Rates for interconnection charges are guided by BTRC directives. Cost of interconnection is measured on the basis of actual outgoing off-net t raffic information.
35.2 Cost of SIM card, scratch card, handset etc. Consolidated Separate 2011 2010 2011 2010 Taka Taka Taka Taka SIM card 1,128,784,262 1,197,437,835 1,128,784,262 1,197,437,835 Scratch card 146,622,839 49,596,375 146,622,839 49,596,375 Handset, data card and other device 1,087,328,706 1,066,519,766 1,087,328,706 1,066,519,766 2,362,735,807 2,313,553,976 2,362,735,807 2,313,553,976
35.3 International roaming cost
This represents the roaming charges payable to the roaming partners for use of roaming partners' network by GP subscribers.
35.4 Licence fees and spectrum charges
This represents operating licence fee and spectrum charges payable to BTRC as per licence agreement.
35.5 Revenue sharing with BTRC
As per the operating licence agreement as amended on 16 April 2006, GP shares 5.5 % of its collected rent and call charges with BTRC. Under the 2G licence renewal guidelines, additional 1% of revenue has been imposed as contribution to Social Obligation Fund. Revenue sharing and Social Obligation Fund under the renewal guidelines will be effective from the date of licence renewal.
36 Network operation and maintenance expenses Rent (Note 36.1) 730,650,954 645,947,505 730,650,954 645,947,505
Electricity charges (Note 36.2) 1,298,616,406 1,384,933,652 1,298,616,405 1,384,933,652
Operation and maintenance - base station 916,432,229 736,012,502 916,432,229 736,012,502
Operation and maintenance - switch 1,374,529,390 766,172,089 1,374,529,390 766,172,089
Operation and maintenance - optical fibre network 50,967,789 43,678,791 50,967,789 43,678,791
Network quality maintenance expenses (Note 36.3) 1,924,216,734 1,813,743,149 2,201,684,222 2,132,102,091
PCM operation and maintenance (Note 36.4) 8,519,947 10,306,363 8,519,947 10,306,363
Lease rent for submarine cable 182,198,508 204,887,611 182,198,508 204,887,611
6,486,131,957 5,605,681,662 6,763,599,444 5,924,040,604
36.1 Rent
Rent includes location rent for base stations, mobile switching centres (switch) and other locations. Future minimum lease payments under non cancellable operating lease agreements for such locations are payable as follows:
(i) Not later than one year 494,108,833 452,829,940 494,108,833 452,829,940
(ii) Later than one year but not later than five years 1,818,562,622 1,970,092,627 1,818,562,622 1,970,092,627
(iii) Later than five years 3,423,705,657 3,421,268,732 3,423,705,657 3,421,268,732
5,736,377,112 5,844,191,299 5,736,377,112 5,844,191,299
36.2 Electricity charges
These represent electricity charges for base stations, mobile switching centres (switch), other transmission equipment etc. This also includes such expenses incurred in connection with maintenance of fibre optic network at selected offices of Bangladesh Railway.
36.3 Network quality maintenance expenses
Network quality maintenance expenses include consultancy charges and other operation and maintenance fees incurred for telecom network.
36.4 PCM operation and maintenance
PCM operation and maintenance expenses include rental and maintenance charges for PCM and microwave link.
Not
es to
the
Fina
ncia
l Sta
tem
ents
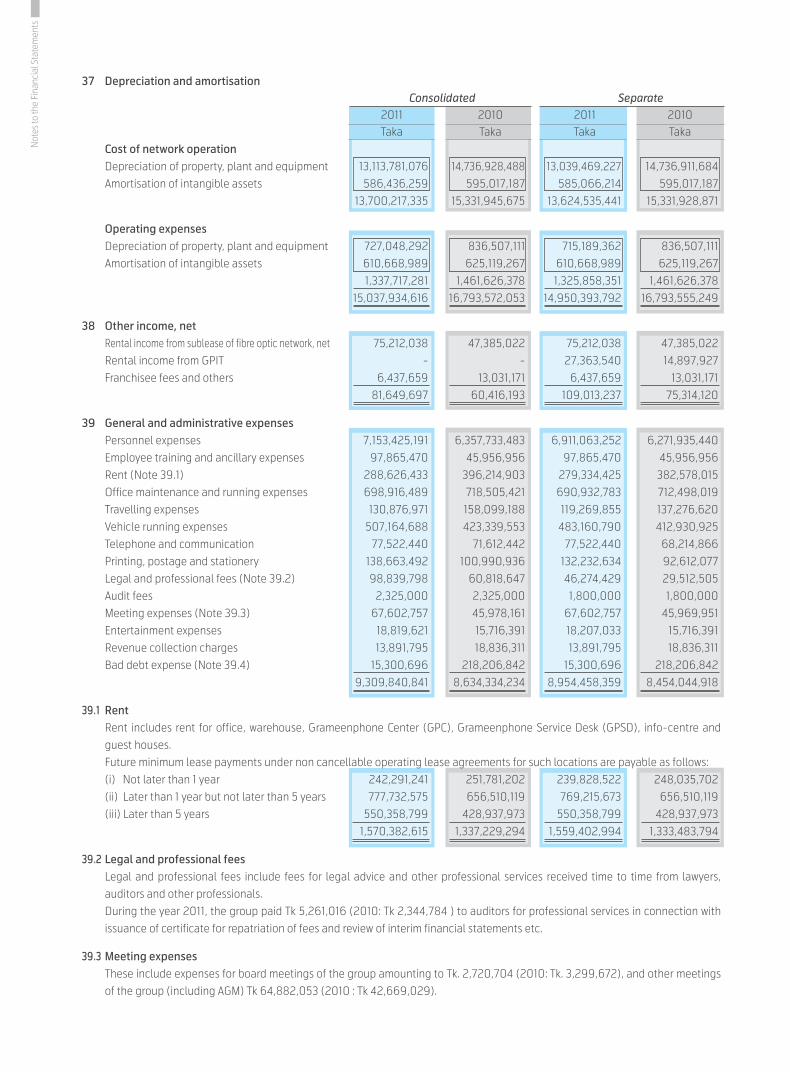
37 Depreciation and amortisation Consolidated Separate 2011 2010 2011 2010 Taka Taka Taka Taka Cost of network operation Depreciation of property, plant and equipment 13,113,781,076 14,736,928,488 13,039,469,227 14,736,911,684 Amortisation of intangible assets 586,436,259 595,017,187 585,066,214 595,017,187 13,700,217,335 15,331,945,675 13,624,535,441 15,331,928,871
Operating expenses Depreciation of property, plant and equipment 727,048,292 836,507,111 715,189,362 836,507,111 Amortisation of intangible assets 610,668,989 625,119,267 610,668,989 625,119,267 1,337,717,281 1,461,626,378 1,325,858,351 1,461,626,378 15,037,934,616 16,793,572,053 14,950,393,792 16,793,555,249
38 Other income, net Rental income from sublease of fibre optic network, net 75,212,038 47,385,022 75,212,038 47,385,022 Rental income from GPIT - - 27,363,540 14,897,927 Franchisee fees and others 6,437,659 13,031,171 6,437,659 13,031,171 81,649,697 60,416,193 109,013,237 75,314,120
39 General and administrative expenses Personnel expenses 7,153,425,191 6,357,733,483 6,911,063,252 6,271,935,440 Employee training and ancillary expenses 97,865,470 45,956,956 97,865,470 45,956,956 Rent (Note 39.1) 288,626,433 396,214,903 279,334,425 382,578,015 Office maintenance and running expenses 698,916,489 718,505,421 690,932,783 712,498,019 Travelling expenses 130,876,971 158,099,188 119,269,855 137,276,620 Vehicle running expenses 507,164,688 423,339,553 483,160,790 412,930,925 Telephone and communication 77,522,440 71,612,442 77,522,440 68,214,866 Printing, postage and stationery 138,663,492 100,990,936 132,232,634 92,612,077 Legal and professional fees (Note 39.2) 98,839,798 60,818,647 46,274,429 29,512,505 Audit fees 2,325,000 2,325,000 1,800,000 1,800,000 Meeting expenses (Note 39.3) 67,602,757 45,978,161 67,602,757 45,969,951 Entertainment expenses 18,819,621 15,716,391 18,207,033 15,716,391 Revenue collection charges 13,891,795 18,836,311 13,891,795 18,836,311 Bad debt expense (Note 39.4) 15,300,696 218,206,842 15,300,696 218,206,842 9,309,840,841 8,634,334,234 8,954,458,359 8,454,044,918
39.1 Rent Rent includes rent for office, warehouse, Grameenphone Center (GPC), Grameenphone Service Desk (GPSD), info-centre and
guest houses. Future minimum lease payments under non cancellable operating lease agreements for such locations are payable as follows: (i) Not later than 1 year 242,291,241 251,781,202 239,828,522 248,035,702 (ii) Later than 1 year but not later than 5 years 777,732,575 656,510,119 769,215,673 656,510,119 (iii) Later than 5 years 550,358,799 428,937,973 550,358,799 428,937,973 1,570,382,615 1,337,229,294 1,559,402,994 1,333,483,794
39.2 Legal and professional fees Legal and professional fees include fees for legal advice and other professional services received time to time from lawyers,
auditors and other professionals. During the year 2011, the group paid Tk 5,261,016 (2010: Tk 2,344,784 ) to auditors for professional services in connection with
issuance of certificate for repatriation of fees and review of interim financial statements etc.
39.3 Meeting expenses These include expenses for board meetings of the group amounting to Tk. 2,720,704 (2010: Tk. 3,299,672), and other meetings
of the group (including AGM) Tk 64,882,053 (2010 : Tk 42,669,029).
Not
es to
the
Fina
ncia
l Sta
tem
ents
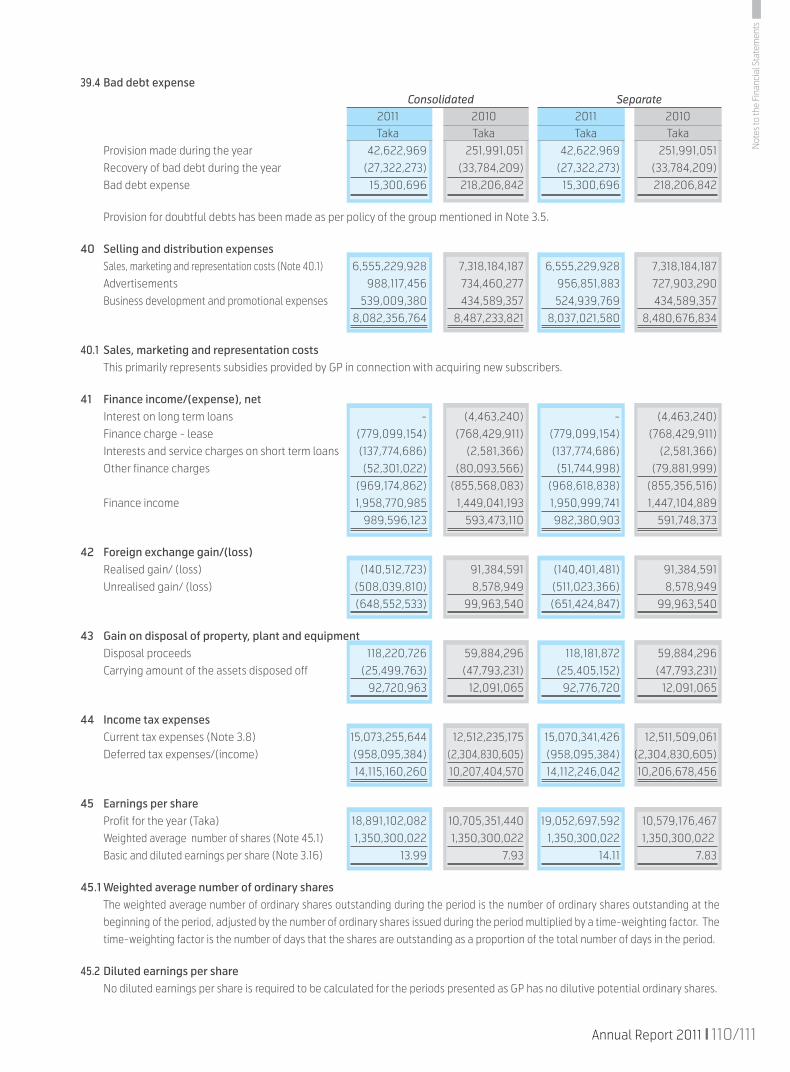
110/111Annual Report 2011
39.4 Bad debt expense Consolidated Separate 2011 2010 2011 2010 Taka Taka Taka Taka Provision made during the year 42,622,969 251,991,051 42,622,969 251,991,051 Recovery of bad debt during the year (27,322,273) (33,784,209) (27,322,273) (33,784,209) Bad debt expense 15,300,696 218,206,842 15,300,696 218,206,842
Provision for doubtful debts has been made as per policy of the group mentioned in Note 3.5.
40 Selling and distribution expenses Sales, marketing and representation costs (Note 40.1) 6,555,229,928 7,318,184,187 6,555,229,928 7,318,184,187 Advertisements 988,117,456 734,460,277 956,851,883 727,903,290 Business development and promotional expenses 539,009,380 434,589,357 524,939,769 434,589,357 8,082,356,764 8,487,233,821 8,037,021,580 8,480,676,834
40.1 Sales, marketing and representation costs This primarily represents subsidies provided by GP in connection with acquiring new subscribers.
41 Finance income/(expense), net Interest on long term loans - (4,463,240) - (4,463,240) Finance charge - lease (779,099,154) (768,429,911) (779,099,154) (768,429,911) Interests and service charges on short term loans (137,774,686) (2,581,366) (137,774,686) (2,581,366) Other finance charges (52,301,022) (80,093,566) (51,744,998) (79,881,999) (969,174,862) (855,568,083) (968,618,838) (855,356,516) Finance income 1,958,770,985 1,449,041,193 1,950,999,741 1,447,104,889 989,596,123 593,473,110 982,380,903 591,748,373
42 Foreign exchange gain/(loss) Realised gain/ (loss) (140,512,723) 91,384,591 (140,401,481) 91,384,591 Unrealised gain/ (loss) (508,039,810) 8,578,949 (511,023,366) 8,578,949 (648,552,533) 99,963,540 (651,424,847) 99,963,540
43 Gain on disposal of property, plant and equipment Disposal proceeds 118,220,726 59,884,296 118,181,872 59,884,296 Carrying amount of the assets disposed off (25,499,763) (47,793,231) (25,405,152) (47,793,231) 92,720,963 12,091,065 92,776,720 12,091,065
44 Income tax expenses Current tax expenses (Note 3.8) 15,073,255,644 12,512,235,175 15,070,341,426 12,511,509,061 Deferred tax expenses/(income) (958,095,384) (2,304,830,605) (958,095,384) (2,304,830,605) 14,115,160,260 10,207,404,570 14,112,246,042 10,206,678,456
45 Earnings per share Profit for the year (Taka) 18,891,102,082 10,705,351,440 19,052,697,592 10,579,176,467 Weighted average number of shares (Note 45.1) 1,350,300,022 1,350,300,022 1,350,300,022 1,350,300,022 Basic and diluted earnings per share (Note 3.16) 13.99 7.93 14.11 7.83
45.1 Weighted average number of ordinary shares The weighted average number of ordinary shares outstanding during the period is the number of ordinary shares outstanding at the
beginning of the period, adjusted by the number of ordinary shares issued during the period multiplied by a time-weighting factor. The time-weighting factor is the number of days that the shares are outstanding as a proportion of the total number of days in the period.
45.2 Diluted earnings per share No diluted earnings per share is required to be calculated for the periods presented as GP has no dilutive potential ordinary shares.
Not
es to
the
Fina
ncia
l Sta
tem
ents
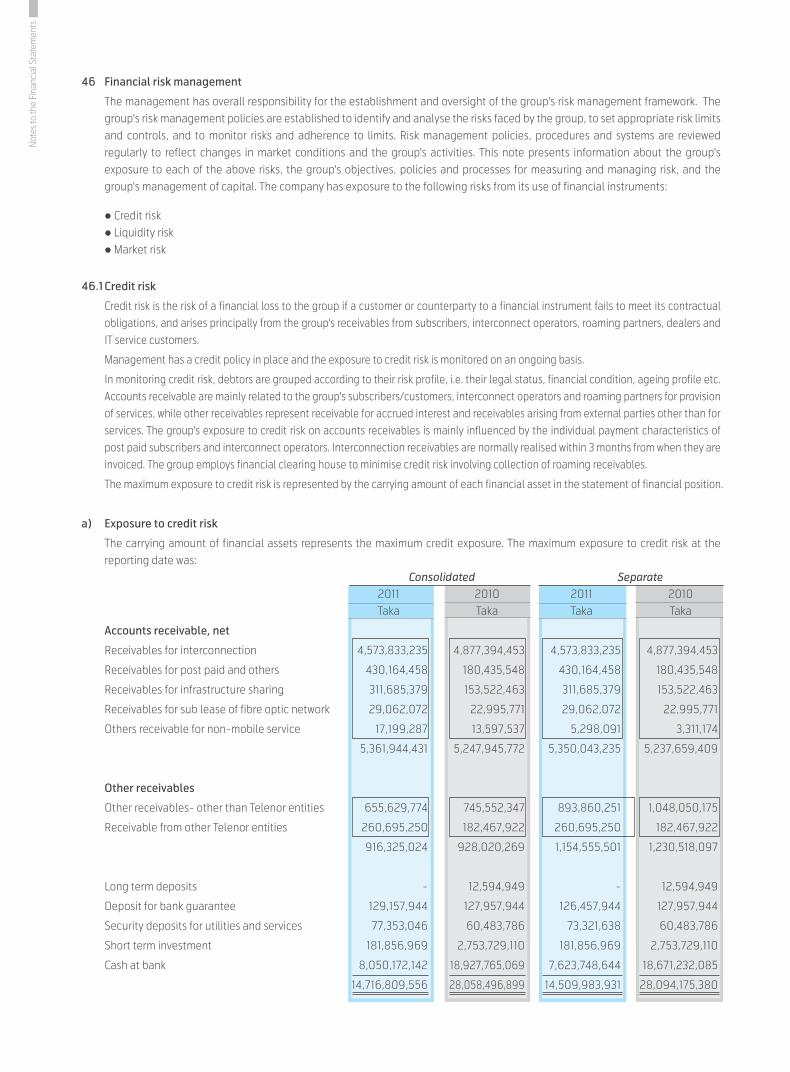
46 Financial risk management
The management has overall responsibility for the establishment and oversight of the group's risk management framework. The group's risk management policies are established to identify and analyse the risks faced by the group, to set appropriate risk limits and controls, and to monitor risks and adherence to limits. Risk management policies, procedures and systems are reviewed regularly to reflect changes in market conditions and the group's activities. This note presents information about the group's exposure to each of the above risks, the group's objectives, policies and processes for measuring and managing risk, and the group's management of capital. The company has exposure to the following risks from its use of financial instruments:
Credit risk Liquidity risk Market risk
46.1 Credit risk
Credit risk is the risk of a financial loss to the group if a customer or counterparty to a financial instrument fails to meet its contractual obligations, and arises principally from the group's receivables from subscribers, interconnect operators, roaming partners, dealers and IT service customers.
Management has a credit policy in place and the exposure to credit risk is monitored on an ongoing basis.
In monitoring credit risk, debtors are grouped according to their risk profile, i.e. their legal status, financial condition, ageing profile etc. Accounts receivable are mainly related to the group's subscribers/customers, interconnect operators and roaming partners for provision of services, while other receivables represent receivable for accrued interest and receivables arising from external parties other than for services. The group's exposure to credit risk on accounts receivables is mainly influenced by the individual payment characteristics of post paid subscribers and interconnect operators. Interconnection receivables are normally realised within 3 months from when they are invoiced. The group employs financial clearing house to minimise credit risk involving collection of roaming receivables.
The maximum exposure to credit risk is represented by the carrying amount of each financial asset in the statement of financial position.
a) Exposure to credit risk
The carrying amount of financial assets represents the maximum credit exposure. The maximum exposure to credit risk at the reporting date was:
Consolidated Separate 2011 2010 2011 2010 Taka Taka Taka Taka
Accounts receivable, net
Receivables for interconnection 4,573,833,235 4,877,394,453 4,573,833,235 4,877,394,453
Receivables for post paid and others 430,164,458 180,435,548 430,164,458 180,435,548
Receivables for infrastructure sharing 311,685,379 153,522,463 311,685,379 153,522,463
Receivables for sub lease of fibre optic network 29,062,072 22,995,771 29,062,072 22,995,771
Others receivable for non-mobile service 17,199,287 13,597,537 5,298,091 3,311,174
5,361,944,431 5,247,945,772 5,350,043,235 5,237,659,409
Other receivables
Other receivables- other than Telenor entities 655,629,774 745,552,347 893,860,251 1,048,050,175
Receivable from other Telenor entities 260,695,250 182,467,922 260,695,250 182,467,922
916,325,024 928,020,269 1,154,555,501 1,230,518,097
Long term deposits - 12,594,949 - 12,594,949
Deposit for bank guarantee 129,157,944 127,957,944 126,457,944 127,957,944
Security deposits for utilities and services 77,353,046 60,483,786 73,321,638 60,483,786
Short term investment 181,856,969 2,753,729,110 181,856,969 2,753,729,110
Cash at bank 8,050,172,142 18,927,765,069 7,623,748,644 18,671,232,085
14,716,809,556 28,058,496,899 14,509,983,931 28,094,175,380
Not
es to
the
Fina
ncia
l Sta
tem
ents
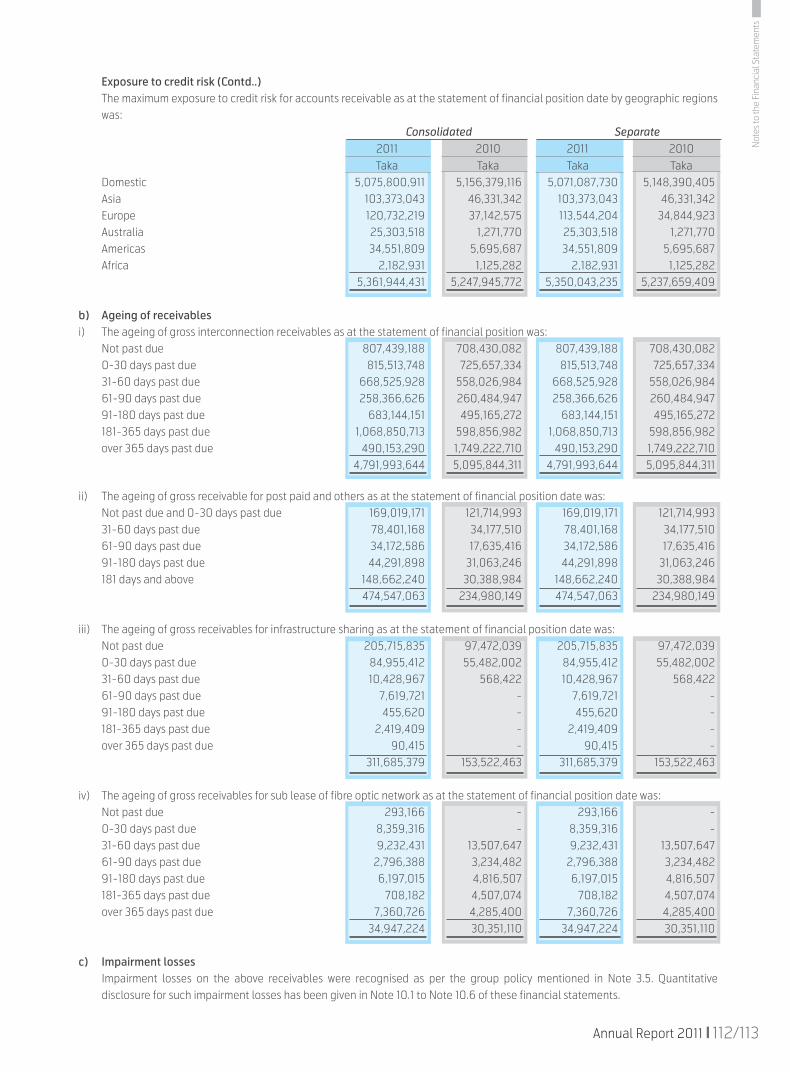
112/113Annual Report 2011
Exposure to credit risk (Contd..) The maximum exposure to credit risk for accounts receivable as at the statement of financial position date by geographic regions
was: Consolidated Separate 2011 2010 2011 2010 Taka Taka Taka Taka Domestic 5,075,800,911 5,156,379,116 5,071,087,730 5,148,390,405 Asia 103,373,043 46,331,342 103,373,043 46,331,342 Europe 120,732,219 37,142,575 113,544,204 34,844,923 Australia 25,303,518 1,271,770 25,303,518 1,271,770 Americas 34,551,809 5,695,687 34,551,809 5,695,687 Africa 2,182,931 1,125,282 2,182,931 1,125,282 5,361,944,431 5,247,945,772 5,350,043,235 5,237,659,409
b) Ageing of receivablesi) The ageing of gross interconnection receivables as at the statement of financial position was: Not past due 807,439,188 708,430,082 807,439,188 708,430,082 0-30 days past due 815,513,748 725,657,334 815,513,748 725,657,334 31-60 days past due 668,525,928 558,026,984 668,525,928 558,026,984 61-90 days past due 258,366,626 260,484,947 258,366,626 260,484,947 91-180 days past due 683,144,151 495,165,272 683,144,151 495,165,272 181-365 days past due 1,068,850,713 598,856,982 1,068,850,713 598,856,982 over 365 days past due 490,153,290 1,749,222,710 490,153,290 1,749,222,710 4,791,993,644 5,095,844,311 4,791,993,644 5,095,844,311
ii) The ageing of gross receivable for post paid and others as at the statement of financial position date was: Not past due and 0-30 days past due 169,019,171 121,714,993 169,019,171 121,714,993 31-60 days past due 78,401,168 34,177,510 78,401,168 34,177,510 61-90 days past due 34,172,586 17,635,416 34,172,586 17,635,416 91-180 days past due 44,291,898 31,063,246 44,291,898 31,063,246 181 days and above 148,662,240 30,388,984 148,662,240 30,388,984 474,547,063 234,980,149 474,547,063 234,980,149
iii) The ageing of gross receivables for infrastructure sharing as at the statement of financial position date was: Not past due 205,715,835 97,472,039 205,715,835 97,472,039 0-30 days past due 84,955,412 55,482,002 84,955,412 55,482,002 31-60 days past due 10,428,967 568,422 10,428,967 568,422 61-90 days past due 7,619,721 - 7,619,721 - 91-180 days past due 455,620 - 455,620 - 181-365 days past due 2,419,409 - 2,419,409 - over 365 days past due 90,415 - 90,415 - 311,685,379 153,522,463 311,685,379 153,522,463
iv) The ageing of gross receivables for sub lease of fibre optic network as at the statement of financial position date was: Not past due 293,166 - 293,166 - 0-30 days past due 8,359,316 - 8,359,316 - 31-60 days past due 9,232,431 13,507,647 9,232,431 13,507,647 61-90 days past due 2,796,388 3,234,482 2,796,388 3,234,482 91-180 days past due 6,197,015 4,816,507 6,197,015 4,816,507 181-365 days past due 708,182 4,507,074 708,182 4,507,074 over 365 days past due 7,360,726 4,285,400 7,360,726 4,285,400 34,947,224 30,351,110 34,947,224 30,351,110
c) Impairment losses Impairment losses on the above receivables were recognised as per the group policy mentioned in Note 3.5. Quantitative
disclosure for such impairment losses has been given in Note 10.1 to Note 10.6 of these financial statements.
Not
es to
the
Fina
ncia
l Sta
tem
ents

46.2
Liq
uidi
ty ri
sk
Li
quid
ity ri
sk is
the
risk t
hat t
he g
roup
will
not
be
able
to m
eet i
ts fi
nanc
ial o
blig
atio
ns a
s the
y fal
l due
. The
gro
up's
appr
oach
to m
anag
ing
liqui
dity
(cas
h an
d ca
sh e
quiva
lent
s) is
to e
nsur
e, a
s far
as p
ossib
le, t
hat i
t will
alw
ays
have
suffi
cien
t liq
uidi
ty to
mee
t its
liab
ilitie
s whe
n du
e, u
nder
bot
h no
rmal
and
stre
ssed
con
ditio
ns, w
ithou
t inc
urrin
g un
acce
ptab
le lo
sses
or r
iskin
g da
mag
e to
the
grou
p's r
eput
atio
n. Ty
pica
lly, t
he g
roup
ens
ures
that
it h
as
suffi
cien
t cas
h an
d ca
sh e
quiva
lent
s to
mee
t exp
ecte
d op
erat
iona
l exp
ense
s, in
clud
ing
finan
cial
obl
igat
ions
thro
ugh
prep
arat
ion
of th
e ca
sh fl
ow fo
reca
st. M
oreo
ver,
the
grou
p se
eks t
o m
aint
ain
shor
t ter
m lin
es o
f cre
dit w
ith
sche
dule
d co
mm
erci
al b
anks
(Not
e 50
) to
ensu
re p
aym
ent o
f obl
igat
ion
in th
e ev
ent t
hat t
here
is in
suffi
cien
t cas
h to
mak
e th
e re
quire
d pa
ymen
t. Th
e re
quire
men
t is d
eter
min
ed in
adv
ance
thro
ugh
cash
flow
pro
ject
ions
and
cred
it lin
es w
ith b
anks
are
neg
otia
ted
acco
rdin
gly.
In
ext
rem
e st
ress
ed co
nditi
ons,
the
grou
p m
ay g
et su
ppor
t fro
m th
e ul
timat
e pa
rent
com
pany
(Tel
enor
) in
the
form
of s
hare
hold
er's
loan
.
Th
e fo
llowi
ng a
re th
e co
ntra
ctua
l mat
uriti
es o
f fin
anci
al li
abili
ties o
f the
gro
up:
Fi
nanc
e le
ase
oblig
atio
ns
5,01
9,80
5,83
8 Ju
ne 2
027
15%
14
,826
,206
,962
36
1,614
,804
37
6,68
2,08
7 76
8,43
1,459
2,
486,
101,7
77
10,8
33,3
76,8
35
Ac
coun
ts p
ayab
le
Liab
ility
for c
apita
l exp
endi
ture
5,
666,
817,
629
Dece
mbe
r 201
2 N/
A 5,
666,
817,
629
3,73
6,45
6,88
4 1,9
30,3
60,7
45
- -
-
Paya
ble
for e
xpen
ses
4,75
9,21
6,70
7 De
cem
ber 2
012
N/A
4,75
9,21
6,70
7 2,
731,7
09,7
64
2,02
7,50
6,94
3 -
- -
Paya
ble
for o
ther
s 41
4,29
9,70
7 De
cem
ber 2
012
N/A
414,
299,
707
311,6
15,4
43
102,
684,
264
- -
-
Pa
yabl
e to
gov
ernm
ent a
nd a
uton
omou
s bod
ies
Paya
ble
to B
TRC
1,916
,987
,718
De
cem
ber 2
012
N/A
1,916
,987
,718
1,9
16,9
87,7
18
- -
- -
Paya
ble
to B
angl
ades
h Ra
ilway
7,
516,
089
Dece
mbe
r 201
2 N/
A 7,
516,
089
7,51
6,08
9 -
- -
-
Paya
ble
for B
ills P
ay re
ceip
t 35
3,69
1,950
De
cem
ber 2
012
N/A
353,
691,9
50
353,
691,9
50
- -
- -
VA
T pa
yabl
e 2,
699,
959,
350
Dece
mbe
r 201
2 N/
A 2,
699,
959,
350
2,69
9,95
9,35
0 -
- -
-
Ac
crue
d in
tere
st
226,
869,
648
Dece
mbe
r 201
2 N/
A 22
6,86
9,64
8 22
6,86
9,64
8 -
- -
-
Ot
her l
iabi
litie
s 98
,549
,866
De
cem
ber 2
012
N/A
98,5
49,8
65
98,5
49,8
65
- -
- -
21
,163,
714,
502
30,9
70,11
5,62
5 12
,444
,971
,515
4,
437,
234,
039
768,
431,4
59
2,48
6,10
1,777
10
,833
,376
,835
Expo
sure
to li
quid
ity ri
sk in
resp
ect o
f the
sepa
rate
fina
ncia
l sta
tem
ents
at 3
1 Dec
embe
r 201
1 doe
s not
vary
sign
ifica
ntly
from
abo
ve.
Carry
ing
amou
ntTa
ka6
mon
ths o
r les
sTa
ka6-
12 m
onth
sTa
ka1-
2 ye
ars
Taka
2-5
year
sTa
kaM
ore
than
5 ye
ars
Taka
Cont
ract
ual c
ash
flows
Taka
As a
t 31 D
ecem
ber 2
011
Mat
urity
dat
eNo
min
al In
tere
stra
te
Not
es to
the
Fina
ncia
l Sta
tem
ents
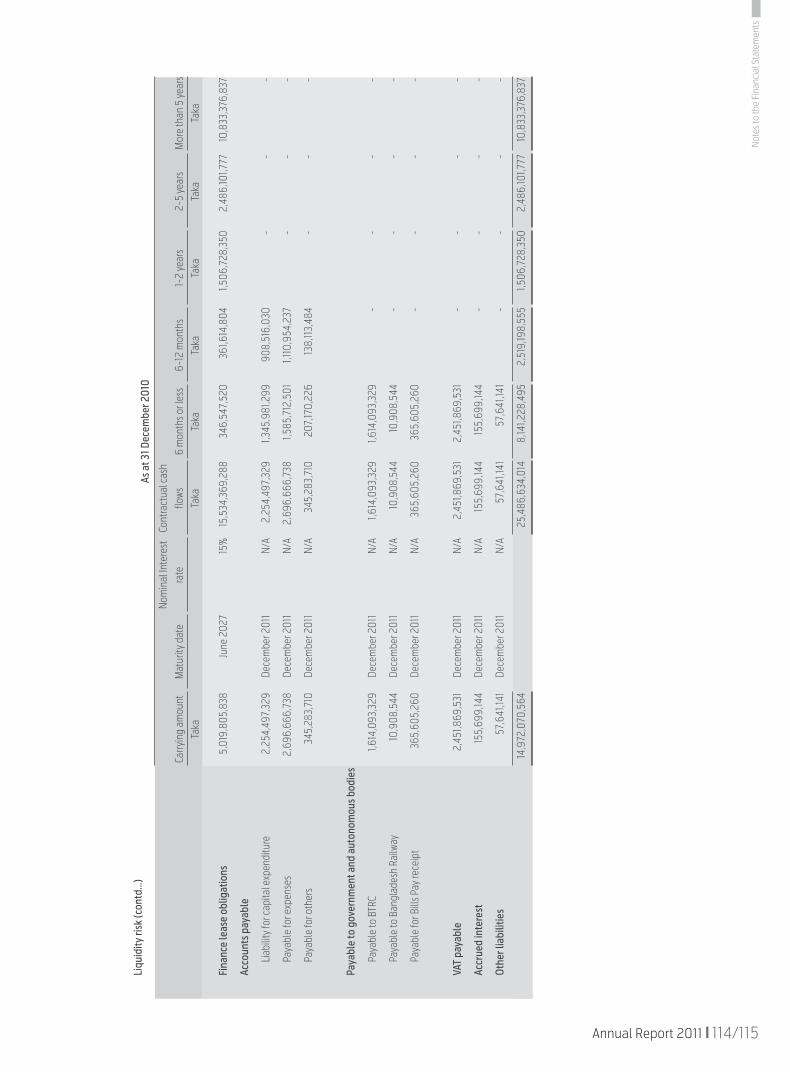
114/115Annual Report 2011
Li
quid
ity ri
sk (c
ontd
…)
Fi
nanc
e le
ase
oblig
atio
ns
5,01
9,80
5,83
8 Ju
ne 2
027
15%
15
,534
,369
,288
34
6,54
7,52
0 36
1,614
,804
1,5
06,7
28,3
50
2,48
6,10
1,777
10
,833
,376
,837
Ac
coun
ts p
ayab
le
Liab
ility
for c
apita
l exp
endi
ture
2,
254,
497,
329
Dece
mbe
r 201
1 N/
A 2,
254,
497,
329
1,345
,981
,299
90
8,51
6,03
0 -
- -
Paya
ble
for e
xpen
ses
2,69
6,66
6,73
8 De
cem
ber 2
011
N/A
2,69
6,66
6,73
8 1,5
85,7
12,5
01
1,110
,954
,237
-
- -
Paya
ble
for o
ther
s 34
5,28
3,71
0 De
cem
ber 2
011
N/A
345,
283,
710
207,
170,
226
138,
113,
484
- -
-
Pa
yabl
e to
gov
ernm
ent a
nd a
uton
omou
s bod
ies
Paya
ble
to B
TRC
1,614
,093
,329
De
cem
ber 2
011
N/A
1,614
,093
,329
1,6
14,0
93,3
29
- -
- -
Paya
ble
to B
angl
ades
h Ra
ilway
10
,908
,544
De
cem
ber 2
011
N/A
10,9
08,5
44
10,9
08,5
44
- -
- -
Paya
ble
for B
ills P
ay re
ceip
t 36
5,60
5,26
0 De
cem
ber 2
011
N/A
365,
605,
260
365,
605,
260
- -
- -
VA
T pa
yabl
e 2,
451,8
69,5
31
Dece
mbe
r 201
1 N/
A 2,
451,8
69,5
31
2,45
1,869
,531
-
- -
-
Ac
crue
d in
tere
st
155,
699,
144
Dece
mbe
r 201
1 N/
A 15
5,69
9,14
4 15
5,69
9,14
4 -
- -
-
Ot
her l
iabi
litie
s 57
,641
,141
Dece
mbe
r 201
1 N/
A 57
,641
,141
57,6
41,14
1 -
- -
-
14
,972
,070
,564
25
,486
,634
,014
8,
141,2
28,4
95
2,51
9,19
8,55
5 1,5
06,7
28,3
50
2,48
6,10
1,777
10
,833
,376
,837
Carry
ing
amou
ntTa
ka6
mon
ths o
r les
sTa
ka6-
12 m
onth
sTa
ka1-
2 ye
ars
Taka
2-5
year
sTa
kaM
ore
than
5 ye
ars
Taka
Cont
ract
ual c
ash
flows
Taka
As a
t 31 D
ecem
ber 2
010
Mat
urity
dat
eNo
min
al In
tere
stra
te
Not
es to
the
Fina
ncia
l Sta
tem
ents

46.3
Mar
ket r
isk
M
arke
t risk
is th
e ris
k tha
t any
cha
nge
in m
arke
t pric
es, s
uch
as fo
reig
n ex
chan
ge ra
tes a
nd in
tere
st ra
tes w
ill a
ffect
the
grou
p's i
ncom
e or
the
valu
e of
its h
oldi
ngs o
f fin
anci
al in
stru
men
ts. T
he o
bjec
tive
of m
arke
t risk
man
agem
ent i
s to
man
age
and
cont
rol
mar
ket r
isk e
xpos
ures
with
in a
ccep
tabl
e pa
ram
eter
s.
a)
Curr
ency
risk
Th
e gr
oup
is ex
pose
d to
cur
renc
y ris
k on
cer
tain
reve
nues
and
pur
chas
es su
ch a
s roa
min
g re
venu
es a
nd e
xpen
ses,
tele
com
equ
ipm
ent p
urch
ases
, net
work
rela
ted
cost
s and
inte
rest
exp
ense
and
repa
ymen
ts re
latin
g to
bor
rowi
ngs i
ncur
red
in fo
reig
n cu
rrenc
ies.
Maj
ority
of t
he c
ompa
ny's
fore
ign
curre
ncy
trans
actio
ns a
re d
enom
inat
ed in
USD
and
rel
ate
to p
rocu
rem
ent o
f cap
ital i
tem
s fro
m a
broa
d. T
he g
roup
als
o ha
s exp
osur
e in
NOK
rela
ting
to b
usin
ess s
ervi
ce c
osts
and
con
sulta
ncy
cost
s and
fo
reig
n cu
rrenc
y lo
ans.
The
grou
p m
aint
ains
a U
SD b
ank
acco
unt w
here
all
rece
ipts
from
inte
rnat
iona
l roa
min
g se
rvic
es a
re d
epos
ited
and
all c
orre
spon
ding
pay
men
ts a
re m
ade.
i)
Ex
posu
re to
curr
ency
risk
Th
e gr
oup'
s exp
osur
e to
fore
ign
curre
ncy r
isk w
as a
s fol
lows
bas
ed o
n no
tiona
l am
ount
s (in
Taka
):
As
at 3
1 Dec
embe
r 201
1 As
at 3
1 Dec
embe
r 201
0
US
D NO
K GB
P EU
R JP
Y US
D NO
K GB
P EU
R JP
Y
Fo
reig
n cu
rrenc
y den
omin
ated
ass
ets
Re
ceiva
ble
from
oth
er Te
leno
r ent
ities
33
5,25
8,71
0 -
- -
- 18
8,61
1,302
-
- -
-
Ac
coun
ts re
ceiva
ble
148,
271,7
73
- 5,
965,
707
2,38
8,01
9 -
107,
078,
115
- 5,
507,
509
3,78
2,44
7 -
Ca
sh a
t ban
k 37
8,19
9,40
8 -
- -
- 14
3,79
8,95
1 -
- -
86
1,729
,891
-
5,96
5,70
7 2,
388,
019
- 43
9,48
8,36
8 -
5,50
7,50
9 3,
782,
447
-
Fo
reig
n cur
renc
y den
omin
ated
liabi
litie
s
Pa
yabl
e to
oth
er Te
leno
r ent
ities
* (3
61,4
34,9
62)
(184
,432
,037
) -
- -
(2,0
04,0
50,19
6)
- -
- -
Tr
ade
and
othe
r pay
able
s for
exp
ense
s (2
,210
,062
,718
) -
- (7
3,17
4,26
4)
(6,3
26,8
57)
(1,7
91,9
72,0
54)
- -
(35,
965,
784)
(8
3,81
9,37
3)
(2
,571
,497
,680
) (1
84,4
32,0
37)
- (7
3,17
4,26
4)
(6,3
26,8
57)
(3,7
96,0
22,2
50)
- -
(35,
965,
784)
(8
3,81
9,37
3)
Ne
t exp
osur
e (1
,709
,767
,789
) (1
84,4
32,0
37)
5,96
5,70
7 (7
0,78
6,24
5)
(6,3
26,8
57)
(3,3
56,5
33,8
82)
- 5,
507,
509
(32,
183,
337)
(8
3,81
9,37
3)
* P
ayab
le to
oth
er Te
leno
r ent
ities
repr
esen
ts p
ayab
le fo
r bus
ines
s ser
vice
cost
s, co
nsul
tanc
y fee
s etc
. whi
ch a
re in
clud
ed m
ainl
y in
acco
unts
pay
able
.
Ex
posu
re to
cur
renc
y risk
as a
t 31 D
ecem
ber 2
011 i
n re
spec
t of t
he se
para
te fi
nanc
ial s
tate
men
ts d
oes n
ot va
ry si
gnifi
cant
ly fr
om a
bove
.
Th
e fo
llowi
ng si
gnifi
cant
exc
hang
e ra
tes h
ave
been
app
lied:
Ex
chan
ge ra
te a
s at
31
Dec
201
1 31
Dec
201
0
Ta
ka
Taka
US
Dol
lar (
USD)
82
.40
71.4
0
No
rweg
ian
Kron
er (N
OK)
15.6
4 13
.85
Gr
eat B
ritai
n Po
und
(GBP
) 12
8.83
11
3.23
EU
RO (E
UR)
108.
03
96.9
4
Ja
pane
se Y
en (J
PY)
1.11
0.93
Not
es to
the
Fina
ncia
l Sta
tem
ents

116/117Annual Report 2011
Market risk (Contd..)
ii) Foreign exchange rate sensitivity analysis for foreign currency expenditures
A change of 10 basis points in foreign currencies would have increased/ (decreased) equity and profit or loss of the group by the amounts shown below. This analysis assumes that all other variables, in particular interest rates remain constant.
Profit or loss Equity 10 bp increase 10 bp decrease 10 bp increase 10 bp decrease 2011 Taka Taka Taka Taka
Expenditures denominated in USD (1,709,768) 1,709,768 (1,709,768) 1,709,768
Expenditures denominated in NOK (184,432) 184,432 (184,432) 184,432
Expenditures denominated in GBP 5,966 (5,966) 5,966 (5,966)
Expenditures denominated in EURO (70,786) 70,786 (70,786) 70,786
Expenditures denominated in JPY (6,327) 6,327 (6,327) 6,327
Exchange rate sensitivity (1,965,347) 1,965,347 (1,965,347) 1,965,347
2010
Expenditures denominated in USD (3,356,534) 3,356,534 (3,356,534) 3,356,534
Expenditures denominated in NOK - - - -
Expenditures denominated in GBP 5,508 (5,508) 5,508 (5,508)
Expenditures denominated in EURO (32,183) 32,183 (32,183) 32,183
Expenditures denominated in JPY (83,819) 83,819 (83,819) 83,819
Exchange rate sensitivity (3,467,029) 3,467,029 (3,467,029) 3,467,029
b) Interest rate risk
Interest rate risk is the risk that arises due to changes in interest rates on borrowings. The group is not significantly exposed to fluctuation in interest rates as it has neither floating interest rate bearing financial liabilities nor entered into any type of derivative instrument in order to hedge interest rate risk as at the reporting date.
Profile
As at 31 December 2011, the interest rate profile of the group's interest bearing financial instruments was: Carrying amount As at As at 31 December 2011 31 December 2010 Taka Taka Fixed rate instruments
Financial assets
Long term deposits - 12,594,949
Short term investment 181,856,969 2,753,729,110
Cash at bank 7,623,748,644 18,927,765,069
Financial liabilities
Finance lease obligation 5,019,805,838 5,019,805,838
Accrued interest 226,869,648 155,699,144
Not
es to
the
Fina
ncia
l Sta
tem
ents

Fair value of financial assets and liabilities of the group together with carrying amount shown in the statement of financial position are as follows:
As at 31 December 2011 As at 31 December 2010 Carrying amount Fair value Carrying amount Fair value Taka Taka Taka Taka Financial assets Assets carried at fair value through profit or loss - - - -
Held to maturity assets Long term deposits - - 12,594,949 12,594,949 Short term investment 181,856,969 181,856,969 2,753,729,110 2,753,729,110
Loans and receivables Accounts receivable, net 5,361,944,431 5,361,944,431 5,247,945,772 5,247,945,772 Other receivables 916,325,024 916,325,024 928,020,269 928,020,269
Available for sale financial assets Deposit for bank guarantee 129,157,944 129,157,944 127,957,944 127,957,944 Security deposit for utilities and services 77,353,046 77,353,046 60,483,786 60,483,786
Financial liabilities Liabilities carried at fair value through profit or loss - - - -
Liabilities carried at amortised costs Loans and borrowings - - - - Finance lease obligation 5,019,805,838 5,019,805,838 5,019,805,838 5,019,805,838 Accounts payable 10,840,334,043 N/A* 5,296,447,777 N/A* Payable to government and autonomous bodies 4,814,105,945 N/A* 1,944,753,714 N/A* VAT payable 2,699,959,350 N/A* 2,451,869,531 N/A* Accrued interest 226,869,648 N/A* 155,699,144 N/A* Deposit from agents and subscribers 455,775,978 N/A* 444,639,879 N/A* Other liabilities 98,549,866 N/A* 57,641,141 N/A*
Interest rates used for determining amortised cost The interest rates used to discount estimated cash flows, when applicable were as follows: Consolidated Separate 2011 2010 2011 2010 Finance lease obligations 15.00% 15.00% 15.00% 15.00% Short term investment 8.50%-13.75% 8.25%-11% 8.50%-13.75% 8.25%-11% * Determination of fair value is not required as per the requirements of IFRS/BFRS 7 : Financial Instruments: Disclosures (ref: Para
29). However, fair value of such instruments is not likely to be significantly different from the carrying amounts of such instruments.
47 Capital management
Group’s policy is to maintain a strong capital base so as to maintain investor, creditor and market confidence and to sustain future development of the business. Capital consists of total equity attributable to the equity holders of the parent. The Board of Directors monitors the level of capital as well as the level of dividend to the ordinary shareholders.
In order to maintain or adjust the capital structure, the group may adjust the amount of dividend, return capital to shareholders, issue new shares or obtain long-term debt.
No changes were made in the objectives, policies or processes for managing capital during the years ended 31 December 2011 and 31 December 2010.
The group is not subject to any externally imposed capital requirement.
Not
es to
the
Fina
ncia
l Sta
tem
ents
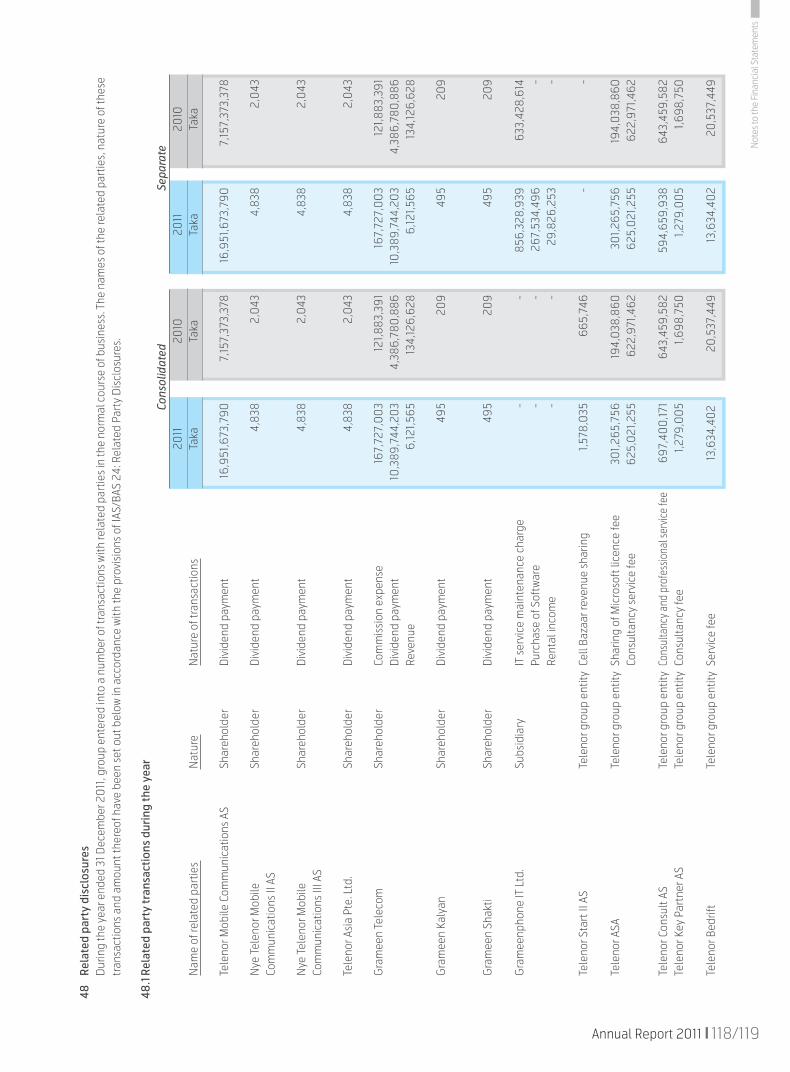
118/119Annual Report 2011
48
Rela
ted
part
y di
sclo
sure
s
Dur
ing
the
year
end
ed 3
1 Dec
embe
r 20
11, g
roup
ent
ered
into
a n
umbe
r of t
rans
actio
ns w
ith re
late
d pa
rtie
s in
the
norm
al c
ours
e of
bus
ines
s. T
he n
ames
of t
he re
late
d pa
rtie
s, n
atur
e of
thes
e tr
ansa
ctio
ns a
nd a
mou
nt th
ereo
f hav
e be
en s
et o
ut b
elow
in a
ccor
danc
e w
ith th
e pr
ovis
ions
of I
AS/B
AS 2
4: R
elat
ed P
arty
Dis
clos
ures
.
48.1
Rel
ated
par
ty tr
ansa
ctio
ns d
urin
g th
e ye
ar
Co
nsol
idat
ed
Sepa
rate
2011
20
10
2011
20
10
Nam
e of
rela
ted
part
ies
Nat
ure
Nat
ure
of tr
ansa
ctio
ns
Taka
Ta
ka
Taka
Ta
ka
Te
leno
r Mob
ile C
omm
unic
atio
ns A
S Sh
areh
olde
r D
ivid
end
paym
ent
16,9
51,6
73,7
90
7,15
7,37
3,37
8 16
,951
,673
,790
7,
157,
373,
378
N
ye T
elen
or M
obile
Sh
areh
olde
r D
ivid
end
paym
ent
4,83
8 2,
043
4,
838
2,0
43
Com
mun
icat
ions
II A
S
N
ye T
elen
or M
obile
Sh
areh
olde
r D
ivid
end
paym
ent
4,83
8 2,
043
4,
838
2,0
43
Com
mun
icat
ions
III A
S
Te
leno
r Asi
a Pt
e. L
td.
Shar
ehol
der
Div
iden
d pa
ymen
t 4,
838
2,0
43
4,83
8 2,
043
G
ram
een
Tele
com
Sh
areh
olde
r Co
mm
issi
on e
xpen
se
167,
727,
00
3 12
1,883
,391
16
7,72
7,0
03
121,8
83,3
91
Div
iden
d pa
ymen
t 10
,389
,744
,20
3 4,
386,
780
,886
10
,389
,744
,20
3 4,
386,
780
,886
Re
venu
e 6,
121,5
65
134,
126,
628
6,12
1,565
13
4,12
6,62
8
G
ram
een
Kaly
an
Shar
ehol
der
Div
iden
d pa
ymen
t 49
5 20
9 49
5 20
9
G
ram
een
Shak
ti Sh
areh
olde
r D
ivid
end
paym
ent
495
209
495
209
G
ram
eenp
hone
IT L
td.
Subs
idia
ry
IT s
ervi
ce m
aint
enan
ce c
harg
e -
- 85
6,32
8,93
9 63
3,42
8,61
4
Purc
hase
of S
oftw
are
- -
267,
534,
496
-
Rent
al in
com
e -
- 29
,826
,253
-
Te
leno
r Sta
rt II
AS
Tele
nor g
roup
ent
ity C
ell B
azaa
r rev
enue
sha
ring
1,578
,035
66
5,74
6 -
-
Te
leno
r ASA
Te
leno
r gro
up e
ntity
Sha
ring
of M
icro
soft
lice
nce
fee
301,2
65,7
56
194,
038
,860
30
1,265
,756
19
4,0
38,8
60
Cons
ulta
ncy
serv
ice
fee
625,
021
,255
62
2,97
1,462
62
5,0
21,2
55
622,
971,4
62
Te
leno
r Con
sult
AS
Tele
nor g
roup
ent
ity C
onsu
ltanc
y and
pro
fess
iona
l ser
vice
fee
697,
400
,171
643,
459,
582
594,
659,
938
643,
459,
582
Te
leno
r Key
Par
tner
AS
Tele
nor g
roup
ent
ity C
onsu
ltanc
y fe
e 1,2
79,0
05
1,698
,750
1,2
79,0
05
1,698
,750
Te
leno
r Bed
rift
Tele
nor g
roup
ent
ity S
ervi
ce fe
e 13
,634
,40
2
20,5
37,4
49
13,6
34,4
02
20,5
37,4
49
Not
es to
the
Fina
ncia
l Sta
tem
ents

Cons
olid
ated
Se
para
te
20
11
2010
20
11
2010
N
ame
of re
late
d pa
rtie
s N
atur
e N
atur
e of
tran
sact
ions
Ta
ka
Taka
Ta
ka
Taka
D
igi T
elec
omm
unic
atio
n Te
leno
r gro
up e
ntity
Roa
min
g re
venu
e 2,
637,
333
1,251
,786
2,
637,
333
1,251
,786
Ro
amin
g ex
pens
es
7,0
51,6
14
3,11
9,82
7 7,
051
,614
3,
119,
827
Ky
ivst
ar G
SM -
Ukr
aine
Te
leno
r gro
up e
ntity
Roa
min
g re
venu
e 22
3,81
0
154,
199
223,
810
15
4,19
9
Roam
ing
expe
nses
15
5,62
4 20
,857
15
5,62
4 20
,857
Te
leno
r d.o
.o (Y
UG
MT)
Te
leno
r gro
up e
ntity
Roa
min
g re
venu
e 33
4,30
2 61
,112
334,
302
61,11
2
Roam
ing
expe
nses
59
,086
34
8,92
6 59
,086
34
8,92
6
Pa
nnon
- G
SM
Tele
nor g
roup
ent
ity R
oam
ing
reve
nue
403,
161
51,8
37
403,
161
51,8
37
Roam
ing
expe
nses
32
9,23
4 10
3,67
4 32
9,23
4 10
3,67
4
So
nofo
ne
Tele
nor g
roup
ent
ity R
oam
ing
reve
nue
2,56
8,78
9 1,2
72,6
95
2,56
8,78
9 1,2
72,6
95
Roam
ing
expe
nses
52
4,56
9 48
3,10
8 52
4,56
9 48
3,10
8
Te
leno
r Mob
il AS
Te
leno
r gro
up e
ntity
Roa
min
g re
venu
e 10
,980
,261
3,
752,
207
10,9
80,2
61
3,75
2,20
7
Roam
ing
expe
nses
1,0
76,6
52
1,116
,690
1,0
76,6
52
1,116
,690
Te
leno
r Pak
ista
n Te
leno
r gro
up e
ntity
Roa
min
g re
venu
e 66
0,5
90
180
,957
66
0,5
90
180
,957
Ro
amin
g ex
pens
es
311,9
37
265,
219
311
,937
26
5,21
9
TA
C (T
otal
Acc
ess
Com
mun
icat
ion)
Te
leno
r gro
up e
ntity
Roa
min
g re
venu
e 7
12,5
72
1,40
3,52
0
712
,572
1,4
03,
520
Ro
amin
g ex
pens
es
2,0
05,
959
9,80
0,6
18
2,0
05,
959
9,80
0,6
18
Te
leno
r Sve
rige
(Eur
opol
itan
AB)
Tele
nor g
roup
ent
ity R
oam
ing
reve
nue
2,0
60,6
33
1,037
,783
2,
060
,633
1,0
37,7
83
Roam
ing
expe
nses
63
0,5
60
252,
155
630
,560
25
2,15
5
Pr
oMon
te G
SM, S
erbi
a an
d
Tele
nor g
roup
ent
ity R
oam
ing
reve
nue
40,3
08
11,8
59
40,3
08
11,8
59
Mon
tene
gro
YUG
PM
Ro
amin
g ex
pens
es
9,80
8 88
9,
808
88
So
nofo
n D
NKT
2 Te
leno
r gro
up e
ntity
Roa
min
g re
venu
e 62
64
4 62
64
4
U
nite
ch W
irele
ss
Tele
nor g
roup
ent
ity R
oam
ing
reve
nue
901,9
86
920
,790
90
1,986
92
0,7
90
Roam
ing
expe
nses
7
56,4
58
99,7
81
756,
458
99,7
81
Te
leno
r Bro
adca
st H
oldi
ng A
S Te
leno
r gro
up e
ntity
IT
serv
ice
reve
nue
6,0
68,5
58
- -
-
Te
leno
r Ser
bia
Tele
nor g
roup
ent
ity I
T se
rvic
e re
venu
e 9,
327,
210
-
- -
Not
es to
the
Fina
ncia
l Sta
tem
ents

120/121Annual Report 2011
48.2
Rec
eiva
bles
/(pa
yabl
es) w
ith re
late
d pa
rtie
s
Co
nsol
idat
ed
Sepa
rate
2011
20
10
2011
20
10
Nam
e of
rela
ted
part
ies
Nat
ure
Nat
ure
of tr
ansa
ctio
ns
Taka
Ta
ka
Taka
Ta
ka
Gra
mee
n Te
leco
m
Shar
ehol
der
Acco
unts
rece
ivab
le
9,67
4,39
0
10,9
70,0
99
9,67
4,39
0
10,9
70,0
99
Acco
unts
pay
able
(1
4,59
7,35
4)
(11,5
91,5
10)
(14,
597,
354)
(1
1,591
,510
)
G
ram
eenp
hone
IT L
td.
Subs
idia
ry
Rece
ivab
le fo
r IT
equi
pmen
t -
- 12
7,33
7,21
7 16
8,63
1,962
Re
ceiva
ble
for r
ent,
offic
e ru
nnin
g ex
pens
e,
mai
nten
ance
and
oth
ers
- -
123,
430
,555
13
6,14
1,336
Ad
vanc
e fo
r NER
M/o
ther
s -
- 39
1,114
,950
16
1,032
,225
Pa
yabl
e fo
r IT
serv
ice
- -
(161
,674
,105)
(2
10,9
35,5
80)
Pa
yabl
e fo
r rei
mbu
rsab
le e
xpen
se
- -
(3,9
99,11
0)
-
Te
leno
r ASA
Te
leno
r gro
up e
ntity
Acc
ount
s pa
yabl
e (2
,317
,511
,40
2)
(1,2
88,4
57,8
24)
(2,3
17,5
11,4
02)
(1
,288
,457
,824
)
Acco
unts
rece
ivab
le
1,565
,499
1,9
05,
281
1,464
,289
1,9
05,
281
Te
leno
r Con
sult
AS
Tele
nor g
roup
ent
ity A
ccou
nts
paya
ble
(70
3,40
9,23
8)
(462
,764
,109)
(6
00
,80
4,23
7)
(462
,764
,109)
Ac
coun
ts re
ceiv
able
24
7,60
4,77
3 17
2,22
7,0
93
237,
00
9,72
2 17
2,22
7,0
93
Te
leno
r Int
erna
tiona
l Cen
ter
Tele
nor g
roup
ent
ity A
ccou
nts
rece
ivab
le
13,4
47,2
37
6,0
37,0
58
13,4
47,2
37
6,0
37,0
58
Te
leno
r Key
Par
tner
AS
Tele
nor g
roup
ent
ity A
ccou
nts
paya
ble
(3,19
7,51
2)
(2,5
57,5
60)
(3,19
7,51
2)
(2,5
57,5
60)
Te
leno
r Bed
rift
Tele
nor g
roup
ent
ity A
ccou
nts
paya
ble
(32,
326,
637)
(2
0,7
04,
411)
(3
2,32
6,63
7)
(20
,70
4,41
1)
D
igi T
elec
omm
unic
atio
n Te
leno
r gro
up e
ntity
Acc
ount
s pa
yabl
e (2
,30
1,481
) (3
80,5
25)
(2,3
01,4
81)
(380
,525
)
Acco
unts
rece
ivab
le
1,613
,410
26
9,0
47
1,613
,410
26
9,0
47
Ky
ivst
ar G
SM -
Ukr
aine
Te
leno
r gro
up e
ntity
Acc
ount
s pa
yabl
e (6
,560
) (2
,034
) (6
,560
) (2
,034
)
Acco
unts
rece
ivab
le
98,6
98
10,9
74
98,6
98
10,9
74
Te
leno
r d.o
.o (Y
UG
MT)
Te
leno
r gro
up e
ntity
Acc
ount
s pa
yabl
e (1
,60
0)
34,3
40
(1,6
00
) 34
,340
Ac
coun
ts re
ceiv
able
41
,823
-
41,8
23
-
Pa
nnon
- G
SM
Tele
nor g
roup
ent
ity A
ccou
nts
paya
ble
(81,5
54)
(19,
809)
(8
1,554
) (1
9,80
9)
Acco
unts
rece
ivab
le
347,
261
28,6
22
347,
261
28,6
22
So
nofo
ne
Tele
nor g
roup
ent
ity A
ccou
nts
paya
ble
(243
,483
) (1
5,12
2)
(243
,483
) (1
5,12
2)
Acco
unts
rece
ivab
le
835,
050
15
6,49
7 83
5,0
50
156,
497
Tele
nor N
orge
AS
Bedr
ift
Tele
nor g
roup
ent
ity A
ccou
nts
paya
ble
(399
,638
) (1
03,
349)
(3
99,6
38)
(10
3,34
9)
Acco
unts
rece
ivab
le
2,25
1,838
68
2,88
1 2,
251,8
38
682,
881
Not
es to
the
Fina
ncia
l Sta
tem
ents
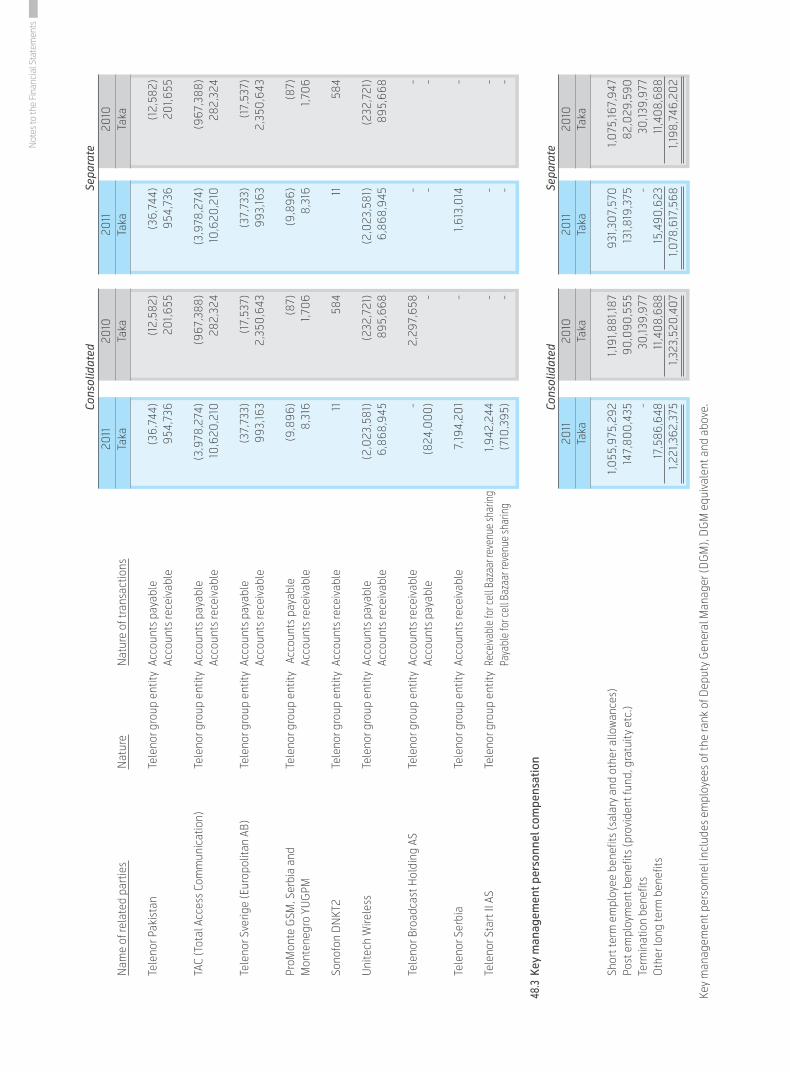
Cons
olid
ated
Se
para
te
20
11
2010
20
11
2010
N
ame
of re
late
d pa
rtie
s N
atur
e N
atur
e of
tran
sact
ions
Ta
ka
Taka
Ta
ka
Taka
Te
leno
r Pak
ista
n Te
leno
r gro
up e
ntity
Acc
ount
s pa
yabl
e (3
6,74
4)
(12,
582)
(3
6,74
4)
(12,
582)
Ac
coun
ts re
ceiv
able
95
4,73
6 20
1,655
95
4,73
6 20
1,655
TA
C (T
otal
Acc
ess
Com
mun
icat
ion)
Te
leno
r gro
up e
ntity
Acc
ount
s pa
yabl
e (3
,978
,274
) (9
67,3
88)
(3,9
78,2
74)
(967
,388
)
Acco
unts
rece
ivab
le
10,6
20,2
10
282,
324
10,6
20,2
10
282,
324
Te
leno
r Sve
rige
(Eur
opol
itan
AB)
Tele
nor g
roup
ent
ity A
ccou
nts
paya
ble
(37,
733)
(1
7,53
7)
(37,
733)
(1
7,53
7)
Acco
unts
rece
ivab
le
993,
163
2,35
0,6
43
993,
163
2,35
0,6
43
Pr
oMon
te G
SM, S
erbi
a an
d
Tele
nor g
roup
ent
ity
Acco
unts
pay
able
(9
,896
) (8
7)
(9,8
96)
(87)
M
onte
negr
o YU
GPM
Acco
unts
rece
ivab
le
8,31
6 1,7
06
8,31
6 1,7
06
So
nofo
n D
NKT
2 Te
leno
r gro
up e
ntity
Acc
ount
s re
ceiv
able
11
58
4 11
58
4
U
nite
ch W
irele
ss
Tele
nor g
roup
ent
ity A
ccou
nts
paya
ble
(2,0
23,5
81)
(232
,721
) (2
,023
,581
) (2
32,7
21)
Ac
coun
ts re
ceiv
able
6,
868,
945
895,
668
6,86
8,94
5 89
5,66
8
Te
leno
r Bro
adca
st H
oldi
ng A
S Te
leno
r gro
up e
ntity
Acc
ount
s re
ceiv
able
-
2,29
7,65
8 -
-
Acco
unts
pay
able
(8
24,0
00
) -
- -
Te
leno
r Ser
bia
Tele
nor g
roup
ent
ity A
ccou
nts
rece
ivab
le
7,19
4,20
1 -
1,613
,014
-
Te
leno
r Sta
rt II
AS
Tele
nor g
roup
ent
ity R
ecei
vabl
e fo
r cel
l Baz
aar r
even
ue sh
arin
g 1,9
42,2
44
- -
-
Paya
ble
for c
ell B
azaa
r rev
enue
shar
ing
(710
,395
) -
- -
48.3
Key
man
agem
ent p
erso
nnel
com
pens
atio
n
Co
nsol
idat
ed
Sepa
rate
2011
20
10
2011
20
10
Ta
ka
Taka
Ta
ka
Taka
Sh
ort t
erm
em
ploy
ee b
enef
its (s
alar
y an
d ot
her a
llow
ance
s)
1,0
55,9
75,2
92
1,191
,881
,187
931,3
07,
570
1,0
75,16
7,94
7
Post
em
ploy
men
t ben
efits
(pro
vide
nt fu
nd, g
ratu
ity e
tc.)
14
7,80
0,4
35
90,0
90,5
55
131,8
19,3
75
82,0
29,5
90
Term
inat
ion
bene
fits
- 30
,139,
977
- 30
,139,
977
O
ther
long
term
ben
efits
17
,586
,648
11
,40
8,68
8 15
,490
,623
11
,40
8,68
8
1,2
21,3
62,3
75
1,323
,520
,40
7 1,0
78,6
17,5
68
1,198
,746
,20
2
Key
man
agem
ent p
erso
nnel
incl
udes
em
ploy
ees
of th
e ra
nk o
f Dep
uty
Gen
eral
Man
ager
(DG
M),
DG
M e
quiv
alen
t and
abo
ve.
Not
es to
the
Fina
ncia
l Sta
tem
ents

122/123Annual Report 2011
49 Expense/expenditure and revenue in foreign currency during the year Consolidated Separate 2011 2010 2011 2010 Taka Taka Taka Taka CIF value of imports SIM card and scratch card 564,982,116 268,734,995 564,982,116 268,734,995 Telecommunication equipment 6,100,542,456 4,795,853,024 6,100,542,456 4,795,853,024 NERM software and other equipment 58,951,028 96,164,211 - -
Expenditure in foreign currency Consultancy fee 949,647,478 1,029,465,734 817,259,881 1,029,465,734 Consultancy fee - expatriate 594,659,938 613,259,692 594,659,938 613,259,692 Other fee (travel and training) 33,212,941 33,184,341 33,212,941 33,184,341 Technical know how 566,933,450 379,757,774 566,933,450 379,757,774 International roaming cost 275,719,219 218,580,685 275,719,219 218,580,685 Software (NERM) implementation support - 21,243,620 - -
Foreign earnings Revenue from roaming partners 432,180,316 209,779,078 432,180,316 209,779,078 IT service revenue 19,092,656 2,297,652 - -
50 Credit facilities available as at 31 December 2011 The group enjoys both funded and non funded short term working capital facilities with 15 banks (2010: 16 banks). The non funded
facilities include Letters of Credit (LC), Letters of Guarantee and foreign exchange forward contracts (FX Forward). The funded facilities include overdraft facility, short term loan and import loan. The aggregate amount of available short term working capital facilities is Tk 26,085 million (Mn) (2010: Tk 27,565 Mn) of which non funded limit is Tk 23,097 Mn (2010: Tk 22,039 Mn) and funded limit is Tk 11,978 Mn (2010: Tk 13,236 Mn).
A detail of the total facilities is enumerated below:
(a) Standard Chartered Bank i) L/C facility - Tk 1,500 Mn (2010: Tk 1,500 Mn) ii) Overdraft / short term loan facility - Tk 1,500 Mn (2010: Tk 1,500 Mn).
(b) Citibank, N.A. i) Sight/usance LC facility - Tk 3,000 Mn (2010: Tk 2,800 Mn). ii) Overdraft/ short term loan facility -Tk 1,035 Mn (2010: Tk 2,100 Mn) with inner limit of LC Tk 3,000 Mn (2010: Tk 2,800 Mn).
The short term loan and the overdraft limits are interchangeable. Total funded exposure under the short-term loan and the overdraft facility, however, may not exceed Tk 3,000 Mn (2010: Tk 2,100 Mn) at any point of time.
(c) The Hongkong and Shanghai Banking Corporation Limited i) Sight/usance LC facility -Tk 1,600 Mn (2010: Tk 1,600 Mn). ii) Short term loan facility - Tk 700 Mn (2010: Tk 700 Mn) with inner limit of LC Tk 1,600 Mn (2010: Tk 1,600 Mn). iii) Overdraft facility - Tk 150 Mn (2010: Tk 150 Mn) with inner limit of LC Tk 1,600 Mn (2010: Tk 1,600 Mn). iv) Foreign exchange line - Tk 10 Mn (2010: Tk 10 Mn).
However, combined funded exposure is limited to Tk 700 Mn (2010: Tk 700 Mn) at any point of time.
(d) Eastern Bank Limited i) Sight/usance LC facility - Tk 2,700 Mn (2010: Tk 2,000 Mn). ii) Short term loan/LTR facility - Tk 1,000 Mn. (2010: Tk 1,000 Mn) with inner limit of LC Tk 2,000 Mn (2010: Tk 2,000 Mn). iii) Overdraft facility - Tk 100 Mn (2010: Tk 100 Mn) with inner limit of LC Tk 2,000 Mn (2010: Tk 2,000 Mn). iv) Bank guarantee - Tk 800 Mn (2010: Tk 800 Mn) with inner limit of LC Tk 2,000 Mn (2010: Tk 2,000 Mn). However, combined funded exposure is limited to Tk 1,100 Mn at any point of time.
Not
es to
the
Fina
ncia
l Sta
tem
ents

(e) BRAC Bank Limited i) Sight/usance LC facility - Tk 1,300 Mn (2010: Tk 1,300 Mn). ii) Overdraft/short term loan facility - Tk 900 Mn (2010: Tk 900 Mn) with inner limit of L/C Tk 1,300 Mn (2010: Tk 1,300 Mn). iii) Bank guarantee - Tk 1,300 Mn (2010: Tk 1,300 Mn) with inner limit of LC Tk 1,300 Mn (2010: Tk 1,300 Mn).
(f) Dutch-Bangla Bank Limited i) Sight/usance LC facility - Tk 1,600 Mn (2010: Tk 1600 Mn). ii) Short term loan/LTR/overdraft facility - Tk 685 Mn (2010: Tk 685 Mn) with inner limit of LC Tk 1,600 Mn (2010: Tk 1,600 Mn).
(g) Woori Bank i) Sight/usance LC facility - Tk 504 Mn (2010: Tk 414 Mn). ii) Overdraft facility for Tk 288 Mn (2010: Tk 206 Mn).
(h) The City Bank Limited i) Sight/usance LC facility - Tk 2,800 Mn (2010: Tk 660 Mn). ii) Overdraft/ short term loan facility - Tk 1,200 Mn ( 2010: Tk 420 Mn). iii) Bank guarantee facility - Tk 1,080 Mn (2010: Tk 660 Mn) with inner limit of LC Tk 2,800 Mn (2010: Tk 660 Mn).
(i) Pubali Bank Ltd. i) Sight/usance LC facility - Tk 1,000 Mn (2010: Tk 1,000 Mn). ii) Overdraft facility - Tk 1,000 Mn (2010: Tk 1,000 Mn).
(j) Mutual Trust Bank Ltd. i) Sight/usance LC facility - Tk 890 Mn (2010: Tk 890 Mn). ii) Overdraft facility - Tk 400 Mn (2010: Tk 650 Mn). iii) Bank guarantee facility - Tk. 890 Mn (2010: Tk 890 Mn) with inner limit of LC Tk 890 Mn (2010: Tk 890 Mn).
(k) Southeast Bank Limited i) Sight/usance LC facility - Tk 1,400 Mn (2010: Tk 1,400 Mn). ii) Overdraft facility - Tk 1,400 Mn (2010: Tk 1,400 Mn). iii) Bank guarantee facility - Tk 1,400 Mn (2010: Tk 1,400 Mn) with inner limit of LC Tk 1,400 Mn (2010: Tk 1,400 Mn).
(l) United Commercial Bank Ltd. i) Sight/usance LC facility -Tk 2,100 Mn (2010: Tk 2,100 Mn). ii) Overdraft/LTR facility - Tk 900 Mn (2010: Tk 900 Mn) with inner limit of LC Tk 2,100 Mn (2010: Tk 2,100 Mn). iii) Bank guarantee facility - Tk 2,100 Mn (2010: Tk 2,100 Mn) with inner limit of LC Tk 2,100 Mn (2010: Tk 2,100 Mn).
(m) Bank Alfalah Ltd. i) Sight/usance LC facility - Tk 525 Mn (2010: Tk 525 Mn) ii) Cash finance facility - Tk 150 Mn (2010: Tk 225 Mn) with inner limit of LC Tk 525 Mn (2010: Tk 525 Mn). iii) Bank guarantee facility - Tk 300 Mn (2010: Tk 300 Mn) with inner limit of LC Tk 525 Mn (2010: Tk 525 Mn).
(n) Trust Bank Limited i) Sight/usance LC facility - Tk 1,200 Mn ii) Overdraft facility - Tk 300 Mn
(o) Premier Bank Limited i) Sight/usance LC facility - Tk 977.6 Mn ii) Overdraft facility - Tk 420 Mn (2010: Tk 660 Mn) with inner Limit of Non Funded Limit for Tk 977.6 Mn (2010: Tk 910 Mn)
As per the approval of Board of Directors of GP, the total amount of short term credit facilities from the above banks is limited to a maximum outstanding limit of USD 210 million equivalent.
Not
es to
the
Fina
ncia
l Sta
tem
ents
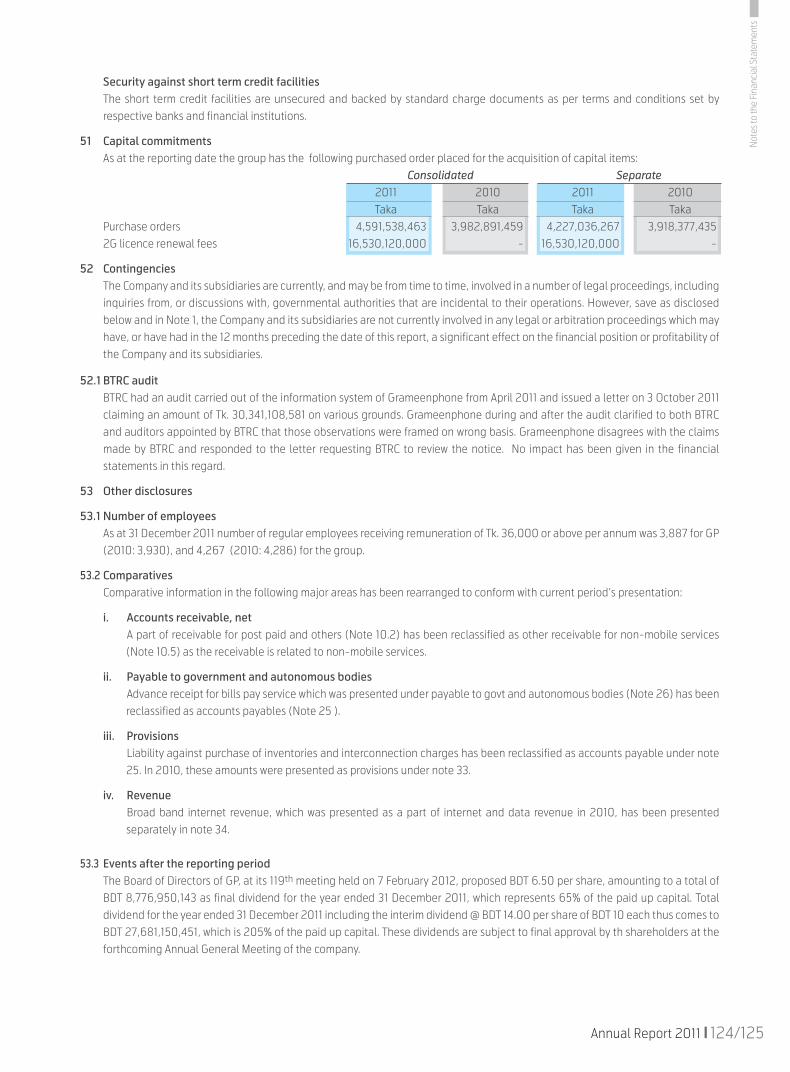
124/125Annual Report 2011
Security against short term credit facilities The short term credit facilities are unsecured and backed by standard charge documents as per terms and conditions set by
respective banks and financial institutions.
51 Capital commitments As at the reporting date the group has the following purchased order placed for the acquisition of capital items: Consolidated Separate 2011 2010 2011 2010 Taka Taka Taka Taka Purchase orders 4,591,538,463 3,982,891,459 4,227,036,267 3,918,377,435 2G licence renewal fees 16,530,120,000 - 16,530,120,000 -
52 Contingencies The Company and its subsidiaries are currently, and may be from time to time, involved in a number of legal proceedings, including
inquiries from, or discussions with, governmental authorities that are incidental to their operations. However, save as disclosed below and in Note 1, the Company and its subsidiaries are not currently involved in any legal or arbitration proceedings which may have, or have had in the 12 months preceding the date of this report, a significant effect on the financial position or profitability of the Company and its subsidiaries.
52.1 BTRC audit BTRC had an audit carried out of the information system of Grameenphone from April 2011 and issued a letter on 3 October 2011
claiming an amount of Tk. 30,341,108,581 on various grounds. Grameenphone during and after the audit clarified to both BTRC and auditors appointed by BTRC that those observations were framed on wrong basis. Grameenphone disagrees with the claims made by BTRC and responded to the letter requesting BTRC to review the notice. No impact has been given in the financial statements in this regard.
53 Other disclosures
53.1 Number of employees As at 31 December 2011 number of regular employees receiving remuneration of Tk. 36,000 or above per annum was 3,887 for GP
(2010: 3,930), and 4,267 (2010: 4,286) for the group.
53.2 Comparatives Comparative information in the following major areas has been rearranged to conform with current period’s presentation:
i. Accounts receivable, net A part of receivable for post paid and others (Note 10.2) has been reclassified as other receivable for non-mobile services
(Note 10.5) as the receivable is related to non-mobile services.
ii. Payable to government and autonomous bodies Advance receipt for bills pay service which was presented under payable to govt and autonomous bodies (Note 26) has been
reclassified as accounts payables (Note 25 ).
iii. Provisions Liability against purchase of inventories and interconnection charges has been reclassified as accounts payable under note
25. In 2010, these amounts were presented as provisions under note 33.
iv. Revenue Broad band internet revenue, which was presented as a part of internet and data revenue in 2010, has been presented
separately in note 34.
53.3 Events after the reporting period The Board of Directors of GP, at its 119th meeting held on 7 February 2012, proposed BDT 6.50 per share, amounting to a total of
BDT 8,776,950,143 as final dividend for the year ended 31 December 2011, which represents 65% of the paid up capital. Total dividend for the year ended 31 December 2011 including the interim dividend @ BDT 14.00 per share of BDT 10 each thus comes to BDT 27,681,150,451, which is 205% of the paid up capital. These dividends are subject to final approval by th shareholders at the forthcoming Annual General Meeting of the company.
Not
es to
the
Fina
ncia
l Sta
tem
ents