Embed Size (px)
Citation preview
Earth Syst. Dynam., 6, 583–589, 2015
www.earth-syst-dynam.net/6/583/2015/
doi:10.5194/esd-6-583-2015
© Author(s) 2015. CC Attribution 3.0 License.
Atmospheric moisture transport: the bridge between
ocean evaporation and Arctic ice melting
L. Gimeno1, M. Vázquez1, R. Nieto1, and R. M. Trigo2
1EPhysLab (Environmental Physics Laboratory), Universidad de Vigo, Facultad de Ciencias, Ourense, Spain2University of Lisbon, CGUL, IDL, Lisbon, Portugal
Correspondence to: L. Gimeno ([email protected])
Abstract. Changes in the atmospheric moisture transport have been proposed as a vehicle for interpreting some
of the most significant changes in the Arctic region. The increasing moisture over the Arctic during the last
decades is not strongly associated with the evaporation that takes place within the Arctic area itself, despite the
fact that the sea ice cover is decreasing. Such an increment is consistent and is more dependent on the transport
of moisture from the extratropical regions to the Arctic that has increased in recent decades and is expected to
increase within a warming climate. This increase could be due either to changes in circulation patterns which
have altered the moisture sources, or to changes in the intensity of the moisture sources because of enhanced
evaporation, or a combination of these two mechanisms. In this short communication we focus on the more
objective assessment of the strong link between ocean evaporation trends and Arctic Sea ice melting. We will
critically analyse several recent results suggesting links between moisture transport and the extent of sea ice in
the Arctic, this being one of the most distinct indicators of continuous climate change both in the Arctic and on a
global scale. To do this we will use a sophisticated Lagrangian approach to develop a more robust framework on
some of these previous disconnecting results, using new information and insights. Results reached in this study
stress the connection between two climate change indicators, namely an increase in evaporation over source
regions (mainly the Mediterranean Sea, the North Atlantic Ocean and the North Pacific Ocean in the paths of the
global western boundary currents and their extensions) and Arctic ice melting precursors.
1 The outstanding role of Arctic climate within the
global climate system
The last IPCC Assessment Report has confirmed that the
main components of the climate system have been warm-
ing (atmosphere, oceans) or shrinking (cryosphere) since the
1970s, as a result of global warming induced by the signif-
icant increment in concentration of greenhouse gases of an-
thropogenic origin (AR5, IPCC, 2013). The so-called hiatus
in the rise of global air temperature since the late 1990s is
observed neither in the relentless decadal shift of tempera-
ture distributions in both hemispheres (Hansen et al., 2012)
nor in the frequency of extreme hot events over the conti-
nents (Seneviratne et al., 2014). The much larger capacity of
the oceans to store heat, with respect to the atmosphere, has
played a fundamental role in storing the excessive heat re-
tained in the climate system in the Pacific (Kosaka and Xie,
2013) and the Atlantic (Chen and Tung, 2014) oceans.
However, global warming is a very uneven phenomenon
impossible to be encapsulated by a single indicator relative to
one subsystem, such as the global average of near-surface at-
mospheric temperature. The spatial pattern of observed tem-
perature trends is very asymmetrical and regionalized, with
continents warming more than oceans, and with high lati-
tudes also presenting considerably higher warming rates than
midlatitude and tropical regions. In particular, several au-
thors have shown that the rise in Arctic near-surface tem-
perature (AST) has been twice as large as the global aver-
age throughout most of the year (e.g. Screen and Simmonds,
2010; Tang et al., 2014; Cohen et al., 2014). Additionally, the
evolution of the climate in the Arctic region is often associ-
ated with two important indicators – the summer and autumn
sea ice extent (SIE) and the spring and summer snow cover
extent (SCE) – both characterized by a very significant de-
cline since the 1970s and widely recognized as some of the
Published by Copernicus Publications on behalf of the European Geosciences Union.
584 L. Gimeno et al.: Atmospheric moisture transport
most undeniable indicators of continuous climate change af-
fecting the climate system (Tang et al., 2014; IPCC, 2013).
Nevertheless, the opposite evolution of AST and SIE in-
dices in recent decades emphasizes that both phenomena are
not independent and, actually, are known to reinforce each
other (Tang et al., 2014), as changes in surface albedo (as-
sociated with melting snow and ice) tend to enhance warm-
ing in the Arctic (Serreze and Francis, 2006) as shown in
the recent review paper by Cohen et al. (2014). Neverthe-
less both indicators (AST and SIE) may also respond to
other mechanisms including changes in atmospheric circu-
lation patterns (Graversen et al., 2008), ocean circulation
(Comiso et al., 2008), and changes in radiative fluxes as-
sociated with cloud cover and water vapour content in the
atmosphere (Schweiger et al., 2008; Kapsch et al., 2013),
through the absorption of the outgoing long-wave radiation
from the surface by the increased atmospheric moisture and
then remitted toward the Arctic surface, resulting in the sur-
face warming and sea ice decline (Kapsch et al., 2013). In
particular, changes in the atmospheric moisture have been
proposed as a vehicle for interpreting the most significant
changes in the Arctic region either due to increased transport
from middle latitudes (Lucarini and Ragone, 2011; Zanhg et
al., 2012) or via enhanced local evaporation (Bintanja and
Selten, 2014). However, some recent studies have shown that
the evaporation from the Arctic surface appears not to be an
important moisture source (e.g. Graversen et al., 2008; Park
et al., 2015).
According to some authors, the recent rise on the in-
cidence of summer extreme weather events over Northern
Hemisphere continental land masses (Coumou and Rahm-
storf, 2012; Seneviratne et al., 2014) is probably driven by
the accelerated decline of summer SIE and SCE observed
in recent decades (Francis and Vavrus, 2012; Tang et al.,
2014). According to this hypothesis, the observed weaken-
ing of poleward temperature gradient triggered changes in at-
mospheric circulation, namely slower progression of Rossby
waves (Francis and Vavrus, 2012) and the existence of a
planetary-scale wave life cycle (Bagget and Lee, 2015) that
is highly amplified (blocking) despite a reduced meridional
temperature gradient (consistent with Francis and Vavrus,
2012). These mechanisms have favoured more persistent
weather conditions that are often associated with extreme
weather events, such as the mega heatwave in Russia in
2010 (Barriopedro et al., 2011) or the long drought in cen-
tral USA (Coumou and Rahmstorf, 2012). However, there is
currently much debate on the nature of mechanism(s) respon-
sible for this increment of persistent weather patterns associ-
ated with such extreme climatic events (Cohen et al., 2014),
with some authors suggesting other drivers (albeit equally ex-
acerbated by global warming), such as the role of drying soils
associated with earlier SCE melting (Tang et al., 2014) or
simply related to tropical extratropical interactions (Palmer,
2014). According to Cohen et al. (2014) there are three ma-
jor dynamical frameworks to propagate the anomalous cli-
mate signals originating in the Arctic (namely changes in
SIE and SCE) toward midlatitudes: (1) changes in storm
tracks, (2) changes in the characteristics of the jet stream,
and (3) anomalous planetary wave configurations triggered
by regional changes in the tropospheric circulation. Tang et
al. (2014) compared the role played by both SIE and SCE
in what concerns their capacity to change atmospheric cir-
culation and inducing extreme summer extremes in north-
ern midlatitudes. These authors have found that despite the
stronger decrease in SCE compared to SIE, the latter pro-
vides a stronger response in terms of atmospheric circula-
tion anomalies. Often related with climatic extremes, Tang
et al. (2014) provide evidence that the combined reductions
of SIE and SCE are associated with “widespread upper-level
height increases, weaker upper-level zonal winds at high lat-
itudes, a more amplified upper-level pattern, and a general
northward shift in the jet stream”.
Considering all the above reasons the Arctic sector
emerges as the most sensitive region of the climate system
to the effects of global warming, but it also represents an
area where current and future changes are bound to affect the
climate at a much larger scale (Screen and Simmonds, 2010;
Tang et al., 2014; Cohen et al., 2014).
2 Main mechanisms relating sea ice decline and
increased moisture transport
The atmospheric branch of the hydrological cycle plays a
fundamental role in establishing the link between the Arc-
tic system and the global climate. However, to the best of
our knowledge, this role has not been fully accounted for ob-
jectively, although the transport of moisture from the extrat-
ropical regions to the Arctic has increased in recent decades
(Zhang et al., 2012), and it is expected to further increase
under global warming, independently of the climate change
scenario considered (Kattsov et al., 2007). Some works try
to explain extreme events of atmospheric moisture transport
to the Arctic through the occurrence of atmospheric rivers
(Woods et al., 2013) and Rossby wave breaking events (Liu
and Barnes, 2015). The general increase of moisture could
be due to changes in circulation patterns, which have altered
the location of the most important moisture sources, or it
could be the result of changes in the magnitude of the ex-
isting moisture sources as a consequence of enhanced evap-
oration, or a combination of these two mechanisms (Gimeno
et al., 2012, 2013).
Most studies of changes on moisture transport towards the
Arctic climate make use of one of three possible techniques,
namely (1) Eulerian approaches (e.g. Jakobson and Vihma,
2010), which can be used to estimate the ratio of advected-
to-recycled moisture and to calculate the moisture transport
between predetermined source and sink regions; (2) isotope
analysis (e.g. Kurita, 2011), but neither this nor the Eulerian
techniques are capable of a proper geographical identifica-
Earth Syst. Dynam., 6, 583–589, 2015 www.earth-syst-dynam.net/6/583/2015/
L. Gimeno et al.: Atmospheric moisture transport 585
tion of the sources; or (3) more complex Lagrangian com-
putational techniques that are able to infer the sources of the
precipitation that falls in a target region and thus overcome
the limitations of (1) and (2). An analysis of the performance
of these Lagrangian techniques and their advantages over Eu-
lerian and isotope analysis was recently given by Gimeno et
al. (2012). Here we will critically analyse some of the previ-
ous assessments that have established the link between mois-
ture transport from midlatitudes towards the Arctic region
and changes in Arctic SIE. In addition, we will use a sophis-
ticated Lagrangian approach to contrast these existing results
using new information and insights.
In recent years a number of mechanisms have been put
forward relating the strength of moisture transport and Arc-
tic SIE. These mechanisms vary significantly in the nature
of their main driver, including the following: (i) hydrological
drivers, such as increments in Arctic river discharges (Zhang
et al., 2012) or increments in precipitation due to enhanced
local evaporation due to less SIE (Bintanja and Selten, 2014);
(ii) radiative drivers, particularly through rises in cloud cover
and water vapour (Kapsch et al., 2013); and (iii) dynamical
drivers, namely more summer storms with unusual charac-
teristics crossing the Arctic (Simmonds and Rudeva, 2012).
Most likely these different mechanisms coexist to a certain
extent and are not necessarily mutually exclusive. For in-
stance the autumn and early positive trend is SCE (Estilow
et al., 2015), which can be closely related to positive trends
in Eurasian rivers (Yang et al., 2007). In particular, two of
these works (Zhang et al., 2012; Kapsch et al., 2013) provide
novel insight on the role played by the transport of moisture
and the melting of sea ice or snow cover. Their main findings
are summarized below:
1. According to Zhang et al. (2012) in their work entitled
“Enhanced poleward moisture transport and amplified
northern high-latitude wetting trend”, the authors pro-
vide strong evidence to support (i) that there is a trend in
the net poleward atmospheric moisture transport (AMT)
towards the Eurasian Arctic river basins, (ii) that this
net AMT is captured in 98 % of the gauged climatolog-
ical river discharges, and (iii) that the upward trend of
2.6 % net AMT per decade is in good agreement with
the 1.8 % increase per decade in the gauged discharges.
The increase in Arctic river discharge is a possible cause
of sea ice melting in agreement with several studies real-
ized over the Canadian Arctic region that support these
results (e.g. Dean et al., 1994; Nghiem et al., 2014).
Thus, AMT can be seen to have an important role to
play in this process. Nevertheless, Zhang et al. (2012)
used a very simple analysis of integrated moisture
fluxes, in which they calculated moisture transport from
predetermined source and sink regions, and they were
unable to identify the moisture source regions directly.
2. Using a very different methodology Kapsch et
al. (2013), in the paper entitled “Springtime atmo-
spheric energy transport and the control of Arctic sum-
mer sea-ice extent”, demonstrated that in areas of sum-
mer ice retreat, a significantly enhanced transport of hu-
mid air is evident during spring, producing increased
cloudiness and humidity resulting in an enhanced green-
house effect.
As for Kapsch et al. (2013), global balances of atmo-
spheric moisture flux were used, which allowed neither
the identification of the moisture sources nor any assess-
ment of their role in the variability of the moisture trans-
port.
3 Identifying objectively the main sources of
moisture for large Eurasian river basins
The analysis adopted here to discuss existing results is
mostly based on the Lagrangian particle dispersion model
FLEXPART (Bintanja and Selten, 2014; Stohl and James,
2004), using data from 1979 to 2013 obtained from the ERA-
Interim reanalysis of the ECMWF (Dee et al., 2011), which
can be considered the state-of-the-art reanalysis in terms of
the hydrological cycle (Trenberth et al., 2011; Lorenz and
Kunstmann, 2012). The analysis will be restricted to years af-
ter 1979 in order to avoid working with results obtained prior
to the incorporation of satellite data in the reanalysis. Using a
horizontal resolution of 1◦ in latitude and longitude and a res-
olution of 61 vertical levels, the algorithm tracks atmospheric
moisture along trajectories. A 3-D wind field moves a large
number of so-called particles (air parcels) resulting from the
homogeneous division of the atmosphere. The specific hu-
midity (q) and the position (latitude, longitude and altitude)
of all the particles are recorded at 6 h intervals. The model
then calculates increases (e) and decreases (p) in moisture
along each trajectory at each time step by means of varia-
tions in q with respect to time (i.e. e−p=m dq/dt). The
quantity (E−P ) is calculated for a given area of interest by
summing e−p for all particles crossing a 1◦ grid column of
the atmosphere, where E and P are the rates of evaporation
and precipitation, respectively. The particles are tracked and
a database is created with values of E−P averaged and in-
tegrated over 10 days of transport, this being the average res-
idence time of water vapour in the atmosphere (Numaguti,
1999). The main sources of moisture for the target area (in
terms of when and where the air masses that reach the target
area acquire or lose moisture) are shown through the analy-
sis of the 10-day integrated E−P field. For a comprehen-
sive review see Gimeno et al. (2012), which provides de-
tails of the limitations of this Lagrangian approach, its un-
certainty and significance, and its advantages and disadvan-
tages with respect to other methods of estimating moisture
sources. For further information on FLEXPART model see
Stohl et al. (2004).
www.earth-syst-dynam.net/6/583/2015/ Earth Syst. Dynam., 6, 583–589, 2015
586 L. Gimeno et al.: Atmospheric moisture transport
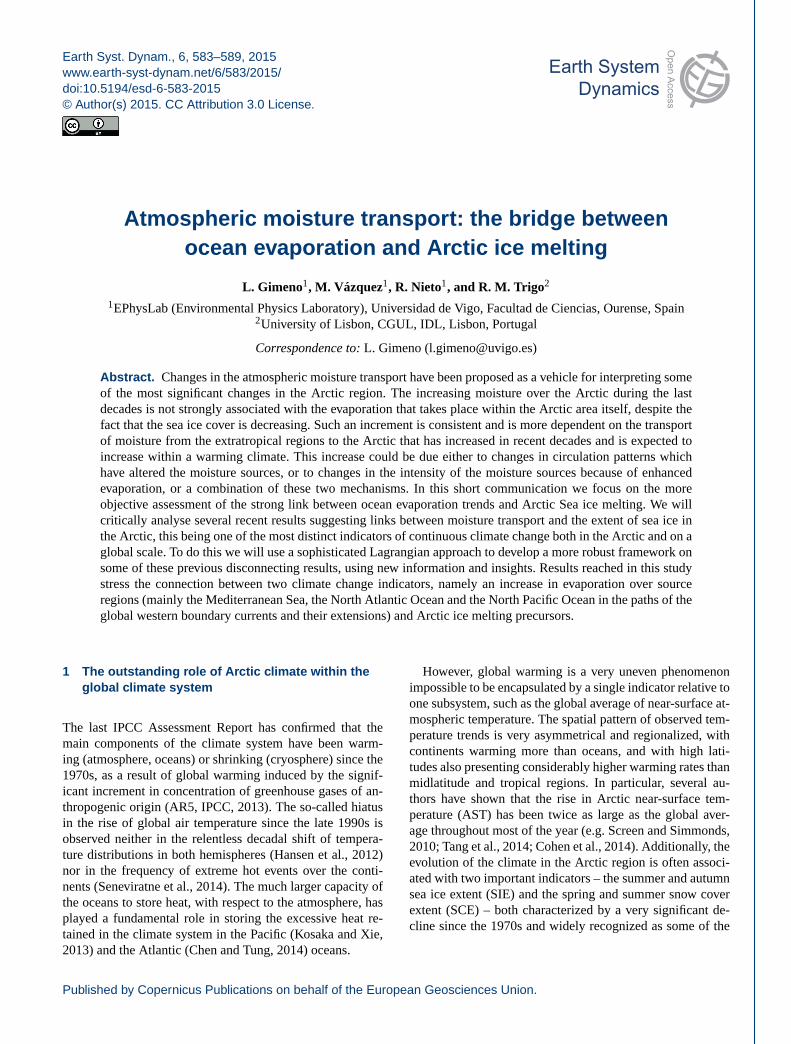
Figure 1. Centre panel: climatological October–March 10-day integrated (E−P ) values observed for the period 1979–2012, for all the
particles bound for the Ob, Yenisei and Lena river basins (green, purple and pink areas respectively indicate the basin area), determined from
backward tracking. Warm colours represent regions acting as moisture sources for the tracked particles. Plots in green show the significant
positive differences at the 95 % level after bootstrap test (1000 interactions) in the composites of the moisture sources of the Arctic river
basins between the decades 2001–2010 and 1981–1990. Temporal series show the evolution of the average evaporation derived from OAFlux
data set for the main moisture sources for the Arctic river basins (the Atlantic and Pacific sources, those circled with a blue line in the central
figure, and for the whole Mediterranean Sea basin). The blue lines are the linear trend and the red ones denote the 10-year periods used on
composites.
According to Zhang et al. (2012), temporal lags must be
considered when linking AMT from lower latitudes with
snowpack accumulation and also between this and Arctic
river discharges. Thus, summer Arctic river discharge can
be related to the result of the melting of the snowpack that
accumulated during the preceding months, while the AMT
most related to the summer river discharge corresponds to
that resulting from snowpack accumulation during the pe-
riod October–March. We therefore choose this period to esti-
mate the moisture sources for the target region formed by the
Ob, Yenisei and Lena river basins, as in the work of Zhang
et al. (2012). The central panel of Fig. 1 shows that the main
moisture sources are located over the Mediterranean Sea, and
the smaller Caspian and Black seas, as well as the North
Atlantic Ocean and to a somewhat lesser degree the North
Pacific Ocean in the paths of the global western boundary
currents and their extensions. This result is striking because
these source regions seem to match those areas with the high-
est trends in terms of evaporation in the past few decades.
4 Trends in evaporation from main sources:
possible consequences
Using some of the best estimates of evaporation, namely
those derived from the OAFlux data (Yu and Weller, 2007),
strong increasing trends can be seen in evaporation from the
oceans since 1978, with the upward trend being most pro-
nounced during the 1990s. The spatial distribution of these
trends (Yu, 2007) shows that while the increase in evapo-
ration has occurred globally, it has primarily been observed
during the hemispheric winter and is strongest along the
paths of the global western boundary currents and any in-
ner seas with wind forcing playing a dominant role. Accord-
ing to Yu (2007) and after performing an empirical orthog-
onal function (EOF) analysis of evaporation and its related
variables (wind speed and air–sea humidity differences), the
wind forcing is mainly responsible for the decadal change
through two mechanisms: one direct – “greater wind speed
induces more evaporation by carrying water vapour away
from the evaporating surface to allow the air–sea humid-
ity gradients to be reestablished at a faster pace” – and a
Earth Syst. Dynam., 6, 583–589, 2015 www.earth-syst-dynam.net/6/583/2015/
L. Gimeno et al.: Atmospheric moisture transport 587
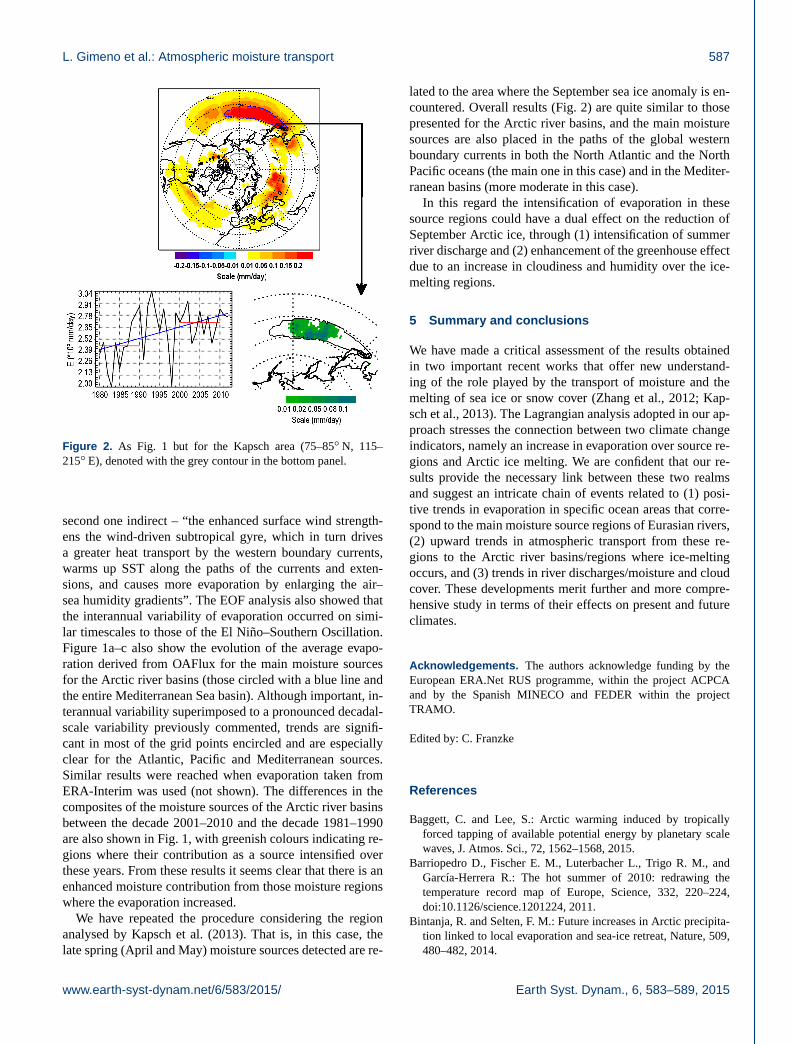
Figure 2. As Fig. 1 but for the Kapsch area (75–85◦ N, 115–
215◦ E), denoted with the grey contour in the bottom panel.
second one indirect – “the enhanced surface wind strength-
ens the wind-driven subtropical gyre, which in turn drives
a greater heat transport by the western boundary currents,
warms up SST along the paths of the currents and exten-
sions, and causes more evaporation by enlarging the air–
sea humidity gradients”. The EOF analysis also showed that
the interannual variability of evaporation occurred on simi-
lar timescales to those of the El Niño–Southern Oscillation.
Figure 1a–c also show the evolution of the average evapo-
ration derived from OAFlux for the main moisture sources
for the Arctic river basins (those circled with a blue line and
the entire Mediterranean Sea basin). Although important, in-
terannual variability superimposed to a pronounced decadal-
scale variability previously commented, trends are signifi-
cant in most of the grid points encircled and are especially
clear for the Atlantic, Pacific and Mediterranean sources.
Similar results were reached when evaporation taken from
ERA-Interim was used (not shown). The differences in the
composites of the moisture sources of the Arctic river basins
between the decade 2001–2010 and the decade 1981–1990
are also shown in Fig. 1, with greenish colours indicating re-
gions where their contribution as a source intensified over
these years. From these results it seems clear that there is an
enhanced moisture contribution from those moisture regions
where the evaporation increased.
We have repeated the procedure considering the region
analysed by Kapsch et al. (2013). That is, in this case, the
late spring (April and May) moisture sources detected are re-
lated to the area where the September sea ice anomaly is en-
countered. Overall results (Fig. 2) are quite similar to those
presented for the Arctic river basins, and the main moisture
sources are also placed in the paths of the global western
boundary currents in both the North Atlantic and the North
Pacific oceans (the main one in this case) and in the Mediter-
ranean basins (more moderate in this case).
In this regard the intensification of evaporation in these
source regions could have a dual effect on the reduction of
September Arctic ice, through (1) intensification of summer
river discharge and (2) enhancement of the greenhouse effect
due to an increase in cloudiness and humidity over the ice-
melting regions.
5 Summary and conclusions
We have made a critical assessment of the results obtained
in two important recent works that offer new understand-
ing of the role played by the transport of moisture and the
melting of sea ice or snow cover (Zhang et al., 2012; Kap-
sch et al., 2013). The Lagrangian analysis adopted in our ap-
proach stresses the connection between two climate change
indicators, namely an increase in evaporation over source re-
gions and Arctic ice melting. We are confident that our re-
sults provide the necessary link between these two realms
and suggest an intricate chain of events related to (1) posi-
tive trends in evaporation in specific ocean areas that corre-
spond to the main moisture source regions of Eurasian rivers,
(2) upward trends in atmospheric transport from these re-
gions to the Arctic river basins/regions where ice-melting
occurs, and (3) trends in river discharges/moisture and cloud
cover. These developments merit further and more compre-
hensive study in terms of their effects on present and future
climates.
Acknowledgements. The authors acknowledge funding by the
European ERA.Net RUS programme, within the project ACPCA
and by the Spanish MINECO and FEDER within the project
TRAMO.
Edited by: C. Franzke
References
Baggett, C. and Lee, S.: Arctic warming induced by tropically
forced tapping of available potential energy by planetary scale
waves, J. Atmos. Sci., 72, 1562–1568, 2015.
Barriopedro D., Fischer E. M., Luterbacher L., Trigo R. M., and
García-Herrera R.: The hot summer of 2010: redrawing the
temperature record map of Europe, Science, 332, 220–224,
doi:10.1126/science.1201224, 2011.
Bintanja, R. and Selten, F. M.: Future increases in Arctic precipita-
tion linked to local evaporation and sea-ice retreat, Nature, 509,
480–482, 2014.
www.earth-syst-dynam.net/6/583/2015/ Earth Syst. Dynam., 6, 583–589, 2015
588 L. Gimeno et al.: Atmospheric moisture transport
Chen, X. and Tung, K. K.: Varying planetary heat sink led to global-
warming slowdown and acceleration, Science, 345, 897–903,
doi:10.1126/science.1254937, 2014.
Cohen, J., Screen, J. A., Furtado, J. C., Barlow, M., Whittle-
ston, D., Coumou, D., Francis, J., Dethloff, K., Entekhabi,
D., Overland, J., and Jones, J.: Recent Arctic amplification
and extreme mid-latitude weather, Nat. Geosci., 7, 627–637,
doi:10.1038/ngeo2234, 2014.
Comiso, J. C., Parkinson, C. L., Gersten, R., and Stock, L.: Acceler-
ated decline in the Arctic sea ice cover, Geophys. Res. Lett., 35,
L01703, doi:10.1029/2007GL031972, 2008.
Coumou, D. and Rahmstorf, S.: A decade of weather extremes, Nat.
Clim. Chang., 2, 491–496, 2012.
Dean, K. G., Stringer, W. J., Ahlnas, K., Searcy, C., and Weingart-
ner, T.: The influence of river discharge on the thawing of sea ice,
Mackenzie River Delta: albedo and temperature analyses, Polar
Res., 13, 83–94, doi:10.1111/j.1751-8369.1994.tb00439.x, 1994.
Dee, D, Uppala, S. M., Simmons, A. J., Berrisford, P., Poli, P.,
Kobayashi, S., Andrae, U., Balmaseda, M. A., Balsamo, G.,
Bauer, P., Bechtold, P., Beljaars, A. C. M., van de Berg, L., Bid-
lot, J., Bormann, N., Delsol, C., Dragani, R., Fuentes, M., Geer,
A. J., Haimberger, L., Healy, S. B., Hersbach, H., Hólm, E. V.,
Isaksen, L., Kållberg, P., Köhler, M., Matricardi, M., McNally,
A. P., Monge-Sanz, B. M., Morcrette, J. J., Park, B. K., Peubey,
C., de Rosnay, P., Tavolato, C., Thépaut, N., and Vitart, F.: The
ERA Interim reanalysis: Configuration and performance of the
data assimilation system, Q. J. Roy. Meteorol. Soc., 137, 553–
597, doi:10.1002/qj.828, 2011.
Estilow, T. W., Young, A. H., and Robinson, D. A.: A long-term
Northern Hemisphere snow cover extent data record for cli-
mate studies and monitoring, Earth Syst. Sci. Data, 7, 137-142,
doi:10.5194/essd-7-137-2015, 2015.
Francis, J. A. and Vavrus, S. J.: Evidence linking Arctic amplifica-
tion to extreme weather in mid-latitudes, Geophys. Res. Lett., 39,
L06801, doi:10.1029/2012GL051000, 2012.
Gimeno, L., Stohl, A., Trigo, R. M., Dominguez, F., Yoshimura,
K., Yu, L., Drumond, A., Duran-Quesada, A. M., and Nieto,
R.: Oceanic and Terrestrial Sources of Continental Precipitation,
Rev. Geophys., 50, RG4003, doi:10.1029/2012RG000389, 2012.
Gimeno, L., Nieto, R., Drumond, A., Castillo, R., and Trigo, R.
M.: Influence of the intensification of the major oceanic mois-
ture sources on continental precipitation, Geophys. Res. Lett.,
40, 1443–1450, doi:10.1002/grl.50338, 2013.
Graversen, R. G., Mauritsen, T., Tjernstrom, M., Källen, E., and
Svensson, G.: Vertical structure of recent Arctic warming, Na-
ture, 451, 53–56, doi:10.1038/nature06502, 2008.
Hansen, J., Sato, M., and Ruedy, R.: Perception of cli-
mate change, P. Natl. Acad. Sci., 109, 14726–14727,
doi:10.1073/pnas.1205276109, 2012.
IPCC: Climate Change 2013: The physical science basis, in: Con-
tribution of working group 1 to the fifth assessment report of the
intergovernmental panel on climate change, edited by: Stocker, T.
F., Qin, D., Planttner, G. K., Tignor, M., Allen, S. K., Boschung,
J., Nauels, A., Xia, Y., Bex, V., and Midgley, P. M., Cambridge
University Press, Cambridge, UK and New York, NY, USA,
2013.
Jakobson, E. and Vihma, T.: Atmospheric moisture budget in the
Arctic based on the ERA-40 reanalysis, Int. J. Climatol., 30,
2175–2194, doi:10.1002/joc.2039, 2010.
Kapsch, M. L., Graversen, R. G., and Tjernström, M.: Spring-
time atmospheric energy transport and the control of Arc-
tic summer sea-ice extent, Nat. Clim. Change, 3, 744–748,
doi:10.1038/nclimate1884, 2013.
Kattsov, V. M., Walsh, J. E., Chapman, W. L., Govorkova, V. A.,
Pavlova, T. V., and Zhang, X.: Simulation and projection of Arc-
tic freshwater bedget components by the IPCC AR4 global cli-
mate models, J. Hydrometeorol., 8, 571–589, 2007.
Kosaka, Y. and Xie, S. P.: Recent global-warming hiatus tied
to equatorial Pacific surface cooling, Nature, 501, 403–407,
doi:10.1038/nature12534, 2013.
Kurita, N.: Origin of Arctic water vapor during the
ice-growth season, Geophys. Res. Lett., 38, L02709,
doi:10.1029/2010GL046064, 2011.
Liu, C. and Barnes, E. A.: Extreme moisture transport into the Arc-
tic linked to Rossby wave breaking, J. Geophys. Res.-Atmos.,
120, 3774–3788, doi:10.1002/2014JD022796, 2015.
Lorenz, C. and Kunstmann, H.: The hydrological cycle in three
state-of-the-art reanalyses: Intercomparison and performance
analysis, J. Hydrometeorol., 13, 1397–1420, 2012.
Lucarini, V. and Ragone, F.: Energetics of climate models: Net en-
ergy balance and meridional enthalpy transport, Rev. Geophys.,
49, RG1001, doi:10.1029/2009RG000323, 2011.
Nghiem, S. V., Hall, D. K., Rigor, I. G., Li, P., and Neumann,
G.: Effects of Mackenzie River discharge and bathymetry on
sea ice in the Beaufort Sea, Geophys. Res. Lett., 41, 873–879,
doi:10.1002/2013GL058956, 2014.
Numaguti, A.: Origin and recycling processes of precipitating water
over the Eurasian continent: Experiments using an atmospheric
general circulation model, J. Geophys. Res., 104, 1957–1972,
1999.
Palmer T.: Record-breaking winters and global climate change, Sci-
ence, 344, 803–804, doi:10.1126/science.1255147, 2014.
Park, D. S. R., Lee, S., and Feldstein, S. B.: Attribution of the Re-
cent Winter Sea Ice Decline over the Atlantic Sector of the Arctic
Ocean, J. Climate, 28, 4027–4033, 2015.
Schweiger, A. J., Lindsay, R. W., Vavrus, S., and Francis, J. A.:
Relationships between Arctic sea ice and clouds during autumn,
J. Climate, 21, 4799–4810, 2008.
Screen, J. A. and Simmonds, I.: The central role of diminishing
sea ice in recent Arctic temperature amplification, Nature, 464,
1334-1337, doi:10.1038/nature09051, 2010.
Seneviratne, S., Donat, M. G., Mueller, B., and Alexander, L. V.:
No pause in the increase of hot temperature extremes, Nat. Clim.
Change, 4, 161–163, 2014.
Serreze, M. C. and Francis, J. A.: The Arctic amplification debate,
Climatic Change, 76, 241–264, 2006.
Simmonds, I. and Rudeva, I.: The great Arctic cyclone
of August 2012, Geophys. Res. Lett., 39, L23709,
doi:10.1029/2012GL054259, 2012.
Stohl, A. and James, P. A.: Lagrangian analysis of the atmospheric
branch of the global water cycle: Part I. Method description, vali-
dation, and demonstration for the August 2002 flooding in central
Europe, J. Hydrometeorol., 5, 656–678, 2004.
Tang, Q., Zhang, X., and Francis, J. A.: Extreme summer weather
in northern mid-latitudes linked to a vanishing cryosphere, Nat.
Clim. Change, 4, 45–50, doi:10.1038/nclimate2065, 2014.
Earth Syst. Dynam., 6, 583–589, 2015 www.earth-syst-dynam.net/6/583/2015/
L. Gimeno et al.: Atmospheric moisture transport 589
Trenberth, K. E., Fasullo, J. T., and Mackaro, J.: Atmospheric mois-
ture transports from ocean to land and global energy flows in re-
analyses, J. Climate, 24, 4907–4924, 2011.
Woods, C., Caballero, R., and Svensson, G.: Large-scale circulation
associated with moisture intrusions into the Arctic during win-
ter, Geophys. Res. Lett., 40, 4717–4721, doi:10.1002/grl.50912,
2013.
Yang, D., Zhao, Y., Armstrong, R., Robinson, D., and Brodzik, M.-
J.: Streamflow response to seasonal snow cover mass changes
over large Siberian watersheds, J. Geophys. Res., 112, F02S22,
doi:10.1029/2006JF000518, 2007.
Yu, L.: Global variations in oceanic evaporation (1958–2005): The
role of the changing wind speed, J. Climate, 20, 5376–5390,
2007.
Yu, L. and Weller, R. A.: Objectively analyzed air–sea heat fluxes
for the global ice-free oceans (1981–2005), B. Am. Meteorol.
Soc., 88, 527–539, 2007.
Zhang, X., He, J., Zhang, J., Polyakov, I., Gerdes, R., Inoue, J.,
and Wu, P.: Enhanced poleward moisture transport and ampli-
fied northern high-latitude wetting trend, Nat. Clim. Change, 3,
47–51, doi:10.1038/nclimate1631, 2012.
www.earth-syst-dynam.net/6/583/2015/ Earth Syst. Dynam., 6, 583–589, 2015