Embed Size (px)
Citation preview

ATENTO S.A. AND SUBSIDIARIES(FORMERLY ATENTO FLOATCO S.A. AND SUBSIDIARIES)
CONSOLIDATED FINANCIAL STATEMENTS AND CONSOLIDATEDMANAGEMENT REPORT FOR THE YEAR ENDED
DECEMBER 31, 2013 AND 2014

Financial InformationFor the Year Ended December 31, 2014
SUMMARY
PART I - FINANCIAL INFORMATION .................................................................................................................................. 3
Report of Independent Registered Public Accounting Firm ........................................................................................................ 4
CONSOLIDATED STATEMENTS OF FINANCIAL POSITION ............................................................................................. 6
SELECTED HISTORICAL FINANCIAL INFORMATION .................................................................................................... 71
SELECTED FINANCIAL DATA ........................................................................................................................................... 72
MANAGEMENT’S DISCUSSION AND ANALYSIS OF FINANCIAL CONDITION AND RESULTS OF OPERATIONS .. 77
QUANTITATIVE AND QUALITATIVE DISCLOSURES ABOUT MARKET RISK ............................................................ 94

3
PART I - FINANCIAL INFORMATION
CONSOLIDATED FINANCIAL STATEMENTS FOR YEAR ENDED DECEMBER 31, 2014


6
ATENTO S.A. AND SUBSIDIARIES(FORMERLY ATENTO FLOATCO S.A., AND SUBSIDIARIES)
CONSOLIDATED STATEMENTS OF FINANCIAL POSITIONAs at December 31, 2013 and 2014
(In thousands of U.S. Dollars, unless otherwise indicated)
December 31,ASSETS Notes 2013 2014
NON-CURRENT ASSETS 1,071,381 942,140Intangible assets Note 6 392,777 293,078Goodwill Note 7 197,739 169,471Property, plant and equipment Note 9 231,603 237,196Non-current financial assets 69,323 92,258Trade and other receivables Note 13 72 10,503Other receivables from public administrations Note 20 - 4,851Other non-current financial assets Note 12 53,812 44,639Derivative financial instruments Note 14 15,439 32,265Deferred tax assets Note 20 179,939 150,137CURRENT ASSETS 770,799 715,761Trade and other receivables 553,026 475,759Trade and other receivables Note 13 521,286 451,394Current income tax receivables Note 20 12,962 13,603Other receivables from public administrations Note 20 18,778 10,762Other current financial assets 4,282 28,562Other financial assets Note 12 1,425 28,562Derivative financial instruments Note 14 2,857 -Cash and cash equivalents Note 15 213,491 211,440TOTAL ASSETS 1,842,180 1,657,901
The accompanying Notes 1 to 29 are an integral part of the consolidated financial statements.

7
ATENTO S.A. AND SUBSIDIARIES(FORMERLY ATENTO FLOATCO S.A., AND SUBSIDIARIES)
CONSOLIDATED STATEMENTS OF FINANCIAL POSITIONAs at December 31, 2013 and 2014
(In thousands of U.S. Dollars, unless otherwise indicated)
December 31,EQUITY AND LIABILITIES Notes 2013 2014
EQUITY ATTRIBUTABLE TO EQUITY HOLDERS OF THE PARENT (133,966) 464,866Share capital Note 19 - 48Net investment/ Share premium Note 19 2,579 639,435Retained earnings Note 19 (60,659) (102,811)Translation differences Note 19 (77,513) (71,750)Cash flow hedge Note 19 1,627 (640)Stock-based compensation Note 19 - 584NON-CURRENT LIABILITIES 1,591,287 818,205Deferred tax liabilities Note 20 119,282 83,132Interest-bearing debt Note 17 833,984 636,549Non-current payables to Group companies Notes 17 and 26 519,607 -Derivative financial instruments Note 14 15,962 1,193Non-current provisions Note 21 99,062 94,774Non-current non trade payables Note 18 1,441 961Other non-current payables to public administrations Note 20 1,949 1,596CURRENT LIABILITIES 384,859 374,830Interest-bearing debt Note 17 17,128 16,761Trade and other payables 353,213 339,560Trade payables Note 18 109,897 105,766Current income tax payable Note 20 7,582 7,351Other current payables to public administrations Note 20 74,983 74,516Other non-trade payables Note 18 160,751 151,927Current provisions Note 21 14,518 18,509TOTAL EQUITY AND LIABILITIES 1,842,180 1,657,901
The accompanying Notes 1 to 29 are an integral part of the consolidated financial statements.

8
ATENTO S.A. AND SUBSIDIARIES(FORMERLY ATENTO FLOATCO S.A., AND SUBSIDIARIES)
CONSOLIDATED INCOME STATEMENTSFor the years ended December 31, 2013 and 2014
(In thousands of U.S. Dollars, unless otherwise indicated)
For the year endedDecember 31,
Notes 2013 2014Revenue Note 22a) 2,341,115 2,298,324Other operating income Note 22b) 4,367 4,579Own work capitalized 948 475Supplies Note 22c) (115,340) (104,808)Employee benefit expenses Note 22d) (1,643,497) (1,636,373)Depreciation and amortization Note 22e) (128,975) (119,820)Changes in trade provisions 2,026 1,665Other operating expenses Note 22f) (355,670) (360,192)Other gains Note 8 - 35,092Impairment charges Notes 6 and 7 - (31,792)OPERATING PROFIT/(LOSS) 104,974 87,150Finance income Note 22 g) 17,793 58,288Finance costs Note 22 g) (135,074) (135,694)Net foreign exchange gains/(loss) Note 22 g) 16,614 (33,363)NET FINANCE EXPENSE (100,667) (110,769)PROFIT/(LOSS) BEFORE TAX 4,307 (23,619)Income tax expenses Note 20 (8,346) (18,533)
LOSS FOR THE PERIOD ATTRIBUTABLE TO EQUITYHOLDERS OF THE PARENT (4,039) (42,152)Basic result per share (per U.S. dollars) Note 24 (0.06) (0.61)Diluted result per share (per U.S. dollars) Note 24 (0.06) (0.61)
The accompanying Notes 1 to 29 are an integral part of the consolidated financial statements.

9
ATENTO S.A. AND SUBSIDIARIES(FORMERLY ATENTO FLOATCO S.A., AND SUBSIDIARIES)
CONSOLIDATED STATEMENTS OF COMPREHENSIVE INCOMEFor the years ended December 31, 2013 and 2014
(In thousands of U.S. Dollars, unless otherwise indicated)
For the year endedDecember 31,
2013 2014Loss for the period (4,039) (42,152)Other comprehensive income/(loss):Items that will not be reclassified to profit and loss - -Items that may subsequently be reclassified to profit and lossCash flow hedges 4,628 (3,863)Tax effect (Note 20) (3,001) 1,596Translation differences (98,841) 5,763Other comprehensive income/(loss), net of taxes (97,214) 3,496Total consolidated comprehensive loss (101,253) (38,656)
The accompanying Notes 1 to 29 are an integral part of the consolidated financial statements.

10
ATENTO S.A. AND SUBSIDIARIES(FORMERLY ATENTO FLOATCO S.A., AND SUBSIDIARIES)
CONSOLIDATED STATEMENTS OF CHANGES IN EQUITYAs at December 31, 2013 and 2014
(In thousands of U.S. Dollars, unless otherwise indicated)
Sharecapital
Netinvestment/
Sharepremium
Retainedearnings
Translationdifferences
Cashflow
hedgeStock-based
compensation Total equity
Balance as at January 1, 2013 - 2,579 (56,620) 21,328 - - (32,713)
Comprehensive income/(loss) for theperiod - - (4,039) (98,841) 1,627 - (101,253) Loss for the period - - (4,039) - - - (4,039) Other comprehensive income/(loss) - - - (98,841) 1,627 - (97,214)
Balance as at December 31, 2013 - 2,579 (60,659) (77,513) 1,627 - (133,966)
Balance as at January 1, 2014 - 2,579 (60,659) (77,513) 1,627 - (133,966)
Capital Increase 45 - - - - - 45Comprehensive income/(loss) for theperiod - - (42,152) 5,763 (2,267) - (38,656) Loss for the period - - (42,152) - - - (42,152) Other comprehensive income/(loss) - - - 5,763 (2,267) - 3,496Capitalization of PECs (Note 1 and 26) - 576,224 - - - - 576,224Stock-based compensation (Note 19d) - - - - - 584 584IPO Proceeds, gross 3 72,290 - - - - 72,293IPO costs - (1,288) - - - - (1,288)Other movements - (10,370) - - - - (10,370)Balance as at December 31, 2014ATENTO S.A. 48 639,435 (102,811) (71,750) (640) 584 464,866
The accompanying Notes 1 to 29 are an integral part of the consolidated financial statements.

11
ATENTO S.A. AND SUBSIDIARIES(FORMERLY ATENTO FLOATCO S.A., AND SUBSIDIARIES)
CONSOLIDATED STATEMENTS OF CASH FLOWFor the years ended December 31, 2013 and 2014
(In thousands of U.S. Dollars, unless otherwise indicated)
For the year endedDecember 31,
For the year endedDecember 31,
Note 2013 2014Operating activitiesProfit/(loss) before tax 4,307 (23,619)Adjustments to profit/(loss):Amortization and depreciation Note 22e) 128,976 119,820Impairment allowances (2,026) 30,127Change in provisions 23,638 30,728Grants released to income (1,702) -Gains/(losses) on disposal of fixed assets 1,160 828Gains/(losses) on disposal of financial assets - (60)Finance income Note 22g) (10,832) (17,326)Finance expenses 116,474 122,063Net exchange differences Note 22g) (16,614) 33,363Changes in fair value of financial instruments 11,579 (27,272)Own work capitalized - (475)Other (gains)/losses - (36,380)
250,653 255,416Changes in working capital:Changes in trade and other receivables 41,628 82,576Changes in trade and other payables (67,909) (15,661)Other assets (payables) Note 21 (20,742) (43,837)
(47,023) 23,078Other cash flow from operating activitiesInterest paid (63,269) (96,497)Interest received 5,476 23,991Income tax paid (30,750) (18,986)Other payments (19,795) (28,088)
(108,338) (119,580)Net cash flow from/(used in) operating activities 99,599 135,295Investment activitiesPayments for acquisition of intangible assets (13,551) (21,835)Payments for acquisition of property, plant and equipment (115,223) (96,017)Acquisition of subsidiaries Note 5 (13,284) (7,460)Payments for financial instruments (14,829) (93,192)Disposals of intangible assets 755 93Disposals of property, plant and equipment - 774Proceeds from sale of financial instruments 32,731 66,562Proceeds from sale of subsidiaries - 1,237Net cash flow from/(used in) investment activities (123,401) (149,838)Financing activitiesProceeds from common stock Note 1 - 72,293Proceeds from borrowing from third parties 280,709 68,630Proceeds from borrowing from group companies - 85,080Repayment of borrowing from third parties (200,723) (187,167)Repayment of borrowing from group companies (48,765) -Net cash flow from/(used in) financing activities 31,221 38,836Exchange differences 5,761 (26,344)Net increase/(decrease) in cash and cash equivalents 13,180 (2,051)Cash and cash equivalents at beginning of period 200,311 213,491Cash and cash equivalents at end of period 213,491 211,440
The accompanying Notes 1 to 29 are part of the consolidated financial statements.

12
ATENTO S.A. AND SUBSIDIARIES(FORMERLY ATENTO FLOATCO S.A., AND SUBSIDIARIES)
NOTES TO THE CONSOLIDATED FINANCIAL STATEMENTSFor the years ended December 31, 2013 and 2014
(In thousands of U.S. Dollars, unless otherwise indicated)
1) ACTIVITY OF ATENTO S.A. AND CORPORATE INFORMATION
(a) Description of business
Atento S.A., formerly Atento Floatco S.A. (hereinafter the “Company”), and its subsidiaries (hereinafter “Atento Group”) are agroup of companies that offer contact management services to their clients throughout the entire contract life cycle, through contactcenters or multichannel platforms.
The Company was incorporated on March 5, 2014 under the laws of the Grand-Duchy of Luxembourg, with its registered officein Luxembourg at 4, Rue Lou Hemmer.
The Atento Group was acquired in 2012 by Bain Capital Partners, LLC (hereinafter “Bain Capital”). Bain Capital is a privateinvestment fund that invests in companies with a high growth potential. Notable among its investments in the Customer RelationshipManagement (hereinafter “CRM”) sector is its holding in Bellsystem 24, a leader in customer service in Japan, and Genpact, thelargest business management services company in the world.
In December 2012, Bain Capital reached a definitive agreement with Telefónica, S.A. for the transfer of nearly 100% of theCRM business carried out by Atento Group companies (hereinafter the “Acquisition”), the parent company of which was AtentoInversiones y Teleservicios, S.A. (hereinafter “AIT”). The Venezuela based subsidiaries of the group headed by AIT, and AIT, exceptfor some specific assets and liabilities were not included in the Acquisition. Control was transferred for the purposes of creating theconsolidated Atento Group on December 1, 2012. Until that time, the Company had been idle and the consolidated Atento Group didnot exist. For this reason, these consolidated financial statements are presented since December 1, 2012, date the Atento Group wasincorporated.
Note 3t contains a list of the companies which make up the Atento Group, as well as pertinent information thereon.
The majority direct shareholder of the Company is a firm incorporated under the laws of the Grand-Duchy of Luxembourg,ATALAYA Luxco PIKCo, S.C.A. (Luxembourg).
The Company’s corporate purpose is to hold business stakes of any kind in companies in Luxembourg and abroad, purchase andsell, subscribe or any other format, and transfer through sale, swap or otherwise of securities of any kind, and administration,management, control and development of the investment portfolio.
The Company may also act as the guarantor of loans and securities, as well as assisting companies in which it holds direct orindirect interests or that form part of its group. The Company may secure funds, with the exception of public offerings, through anykind of lending, or through the issuance of bonds, securities or debt instruments in general.
The Company may also carry on any commercial, industrial, financial, real estate business or intellectual property relatedactivity that it deems necessary to meet the aforementioned corporate purposes.
The corporate purpose of its subsidiaries, with the exception of the intermediate holding companies, is to establish, manage andoperate Customer Relationship Management (“CRM”) centers through multichannel platforms; provide telemarketing, marketing and“call center” services through service agencies or in any other format currently existing or which may be developed in the future bythe Atento Group; provide telecommunications, logistics, telecommunications system management, data transmission, processing andinternet services and to promote new technologies in these areas; offer consultancy and advisory services to customers in all areas inconnection with telecommunications, processing, integration systems and new technologies, and other services related to the above.Atento S.A. trades (under “ATTO”) on NYSE since October 3, 2014.
(b) Atento S.A. reorganization transaction
Atento S.A. was formed as a direct subsidiary of Atalaya Luxco Topco S.C.A. (“Topco”). In April 2014, Topco alsoincorporated Atalaya Luxco PIKCo S.C.A. (“PikCo”) and on May 15, 2014 Topco contributed to PikCo: (i) all of its equity interestsin its then direct subsidiary, Atalaya Luxco Midco S.à.r.l. (“Midco”), the consideration for which was an allocation to PikCo’s account“capital contributions not remunerated by shares” (the “Reserve Account”) equal to €2 million, resulting in Midco becoming a directsubsidiary of PikCo; and (ii) all of its debt interests in Midco (comprising three series of Preferred Equity Certificates (the “OriginalLuxco PECs”)), the consideration for which was the issuance by PikCo to Topco of Preferred Equity Certificates having an equivalent

13
value. On May 30, 2014, Midco authorized the issuance of, and PikCo subscribed for, a fourth series of Preferred Equity Certificates(referred to, together with the Original Luxco PECs, as the “Luxco PECs”.
In October 2014, in connection with the completion of Atento S.A.’s initial public offering (the “IPO”), Topco transferred itsentire interest in Midco (being €31,000 of share capital) to PikCo, the consideration for which was an allocation to PikCo’s ReserveAccount equal to €31,000. PikCo then contributed (the “Contribution”) all of the Luxco PECs to Midco, the consideration for whichwas an allocation to Midco’s Reserve Account equal to the value of the Luxco PECs immediately prior to the Contribution. The LuxcoPECs amounted to €460.0 million (approx. 576.2 million of U.S. dollars as at the capitalization date on October 3). Upon completionof the Contribution, the Luxco PECs were capitalized by Midco. PikCo then transferred the remainder of its interest in Midco (being€12,500 of share capital) to Atento S.A., in consideration for which Atento S.A. issued two new shares of its capital stock to PikCo.The difference between the nominal value of these shares and the value of Midco’s net equity was allocated to Atento S.A.’s sharepremium account. As a result of this transfer, Midco became a direct subsidiary of Atento S.A. A share split was also carried out,whereby Atento S.A. issued 2,219.212 ordinary shares for each 1 ordinary share outstanding. This entire process is collectivelyreferred to as the “Reorganization Transaction”.
On October 7, 2014, upon the closing of the IPO, Atento S.A. issued 4,819,511 new ordinary shares at a price to the public of$15.00 per share, representing proceeds of 72,293 thousand U.S. dollars. Giving effect to the completion of the IPO, Atento S.A. has73,619,511 ordinary shares outstanding and owns 100% of the issued and outstanding share capital of Midco, without nominl value.
Pursuant to the Reorganization Transaction, Midco became a wholly-owned subsidiary of Atento S.A., a newly-formedcompany incorporated under the laws of Luxembourg with assets and liabilities for the purpose of facilitating the IPO, and which didnot conduct any operations prior to the completion of the IPO. Following the Reorganization Transaction and the IPO, the financialstatements present the consolidated results of Midco’s operations. The consolidated financial statements of Midco are substantially thesame as the consolidated financial statements of the Atento S.A. prior to the IPO, adjusted to reflect the Reorganization Transaction.Upon consummation, the Reorganization Transaction was retroactively reflected in Atento’s earnings per share calculations.
The net proceeds of the IPO, together with cash on hand, were used to repay the entire outstanding amount due under theVendor Loan Note issued to an affiliate of Telefónica in connection with the Acquisition, of which €23.3 million (29.5 million U.S.dollars at the exchange rate prevailing as at October 7, 2014) and to pay fees and expenses incurred in connection with the IPO,including fees payable to Bain Capital Partners, LLC (“Bain”), totaling 24.5 million U.S. dollars.
(c) Divestment transaction
On December 9, 2014, Atento S.A. through its indirect subsidiary, Atento Spain Holdco, S.L.U., a sole-shareholder subsidiaryof Atento Luxco 1, S.A. has entered into an agreement for the sale of the 100% of the share capital of ATENTO CESKÁREPUBLIKA A.S., which owns its operations in the Czech Republic, with the Italian company COMDATA S.P.A., the impacts of thetransaction were immaterials. This divestment was not considered as a discontinued operation under the IFRS 5 because it is not arelevant geographical area. The consolidation of this operation was until November 30, 2014.
2) BASIS OF PRESENTATION OF THE CONSOLIDATED FINANCIAL STATEMENTS
a) True and fair view
As described in Note 1, Atento S.A. was incorporated as legal entity and as Group (Atento S.A. and subsidiaries) in 2014 due tothe Reorganization Transaction and the IPO described in Note 1. Pursuant to the Reorganization Transaction, Midco became a wholly-owned subsidiary of Atento S.A., a newly-formed company incorporated under the laws of Luxembourg with nominal assets andliabilities for the purpose of facilitating the IPO, and which did not conduct any operations prior to the completion of the IPO.Following the Reorganization Transaction and the IPO, the financial statements present the consolidated results of Midco’s operationsas if Atento S.A. always would have been operating. The consolidated financial statements of Midco were substantially the same asthe consolidated financial statements of the Atento S.A. prior to the IPO, adjusted to reflect the Reorganization Transaction.Incorporation of Atento S.A. (Floatco) has been considered a common control transaction, applying the pooling of interest method andtherefore:
a) Assets and liabilities of the combining entities (Atento S.A. and the Consolidated FS of Midco) have been reflected attheir carrying amounts.
b) No adjustments are made to reflect fair values, or recognize any new assets or liabilities, at the date of the combination.
c) No new goodwill has been recognized as a result of the combination.
d) The income statement reflects the results of the combining entities for the full year (Atento S.A. and Midco Consolidatedfinancials), irrespective of when the combination took place.

14
e) Impacts equity as long as the share capital of Atento S.A. shall be reflected.
Upon consummation, the Reorganization Transaction was retroactively reflected in Atento’s earnings per share calculations.
The consolidated financial statements have been prepared by Management on the basis of the accounting records of Atento S.A.and its Group companies.
The consolidated financial statements were prepared in accordance with the International Financial Reporting Standards asendorsed by the European Union (“EU-IFRS”) prevailing at December 31, 2014. The consolidated financial statements have beenprepared on a historical costs basis, with the exception of derivative financial instruments and Contingent Value Instruments, whichhave been measured at fair value.
The consolidated financial statements have been issued by the Board and Audit Committee of the Company, Atento S.A. inLuxembourg on March 24, 2015. These consolidated financial statements of Atento S.A. for the year ended December 31, 2014 wereauthorized for issue in accordance with a resolution of the Board of Directors on March 24, 2015. Under Luxembourg law thefinancials are approved by the Shareholders at the annual general meeting.
The preparation of financial statements under EU-IFRS requires the use of certain key accounting estimates. EU-IFRS alsorequires Management to exercise judgment throughout the process of applying the Atento Group’s accounting policies. Note 3sdiscloses the areas requiring a more significant degree of judgment or complexity and the areas where assumptions and estimates aremore relevant to the consolidated financial statements.
Note 3 contains a detailed description of the most significant accounting policies used to prepare these consolidated financialstatements.
The figures in these consolidated financial statements, comprising the consolidated statements of financial position, theconsolidated income statement, the consolidated statements of comprehensive income, the consolidated statements of changes inequity, the consolidated statements of cash flow, and the notes thereto are expressed in thousands of U.S. dollars, unless otherwiseindicated.
These consolidated financial statements reflect the classification of companies in the TOPCO and subsidiaries group as Groupcompanies, while separately identifying the pertinent balances and transactions of these companies from the remaining receivables,payables, income, expenses, proceeds and payments.
b) Comparative information
Although the figures for the years ended December 31, 2013 and 2014 correspond to a full year of activity for the Atento Group.
c) Consolidated statement of cash flow
The consolidated statement of cash flow has been prepared using the indirect method pursuant to IAS 7 “Statement of CashFlow”. Foreign currency transactions are translated at the average exchange rate for the period, in those cases where the currencydiffers from the presentation currency of Atento Group (U.S. dollar), as indicated in Note 3 b. The effect of exchange rate fluctuationson cash and cash equivalents, maintained or owed, in foreign currency, is presented in the statement of cash flow to reconcile cash andcash equivalents at the beginning of the period and at period-end.
3) ACCOUNTING POLICIES
The main accounting policies used to prepare the accompanying consolidated financial statements are set out below. Exceptwhere otherwise indicated, these policies have been applied on a consistent basis for all periods shown in the statements.
a) Subsidiaries, business combinations and goodwill
Subsidiaries include all companies in which Atento Group is able to control financial and operating policies, a position which isgenerally accompanied by an ownership interest entitling it to more than half of the voting rights. To determine whether Atento Groupcontrols another company, the existence and effect of potential voting rights that are currently exercisable or convertible are taken intoaccount. In cases where Atento Group does not hold more than 50% of the voting rights, but is able to guide the financial andoperating policies of a given investee, an assessment is carried out to determine whether control exists.

15
Subsidiaries are consolidated from the date in which their control is transferred to Atento Group, and they are desconsolidatedfrom the date in that control ceases.
Atento Group applies the acquisition method when recognizing business combinations. The consideration given for theacquisition of a subsidiary is understood to correspond to the fair value of the assets transferred, the liabilities assumed vis-à-vis theformer owners of the acquiree, and any equity instruments therein issued by Atento Group. The consideration given includes the fairvalue of any asset or liability resulting from any contingent consideration agreement.
Any contingent consideration to be transferred by Atento Group is recognized at its fair value as at the acquisition date.Subsequent changes in the fair value of any contingent consideration deemed an asset or a liability are recognized in the incomestatement or as a change in other comprehensive income, in accordance with IAS 39, “Financial Instruments: Recognition andMeasurement”. Contingent consideration classified as equity is not remeasured, and any subsequent settlement thereof is alsorecognized in equity. Costs related to the acquisition are recognized as expenses in the year in which they are incurred.
Identifiable assets acquired and identifiable liabilities and contingent liabilities assumed in a business combination are initiallymeasured at fair value as at the acquisition date.
Goodwill is initially measured as any excess of the total consideration received over the net identifiable assets acquired andliabilities assumed. If the fair value of the net assets acquired is greater than the aggregate consideration transferred, the difference isrecognized in the income statement.
Goodwill is tested for impairment annually or more frequently if there are certain events or changes in circumstances indicatingpotential impairment.
As part of this impairment testing, the goodwill acquired in a business combination is assigned to each cash-generating unit, orgroup of cash-generating units, that is expected to benefit from the synergies arising in the business combination.
The carrying amount of the assets allocated to each cash generating unit is then compared with its recoverable amount, which isthe greater of its value in use or fair value less costs to sell. Any impairment loss is immediately taken to the income statement, andmay not be reversed (see Section h).
b) Functional and presentation currency
Items included in the financial statements of each of the group’s entities are measured using the currency of the primaryeconomic environment in which the entities operate (‘the functional currency’). The consolidated financial statements are presented inthousands of U.S. dollars, which is the presentation currency of the Atento Group.
c) Foreign currency translation
The results and financial position of all Atento Group entities (none of which uses the currency of an inflationary economy)whose functional currency is different from the presentation currency are translated into the presentation currency as follow:
• Statement of financial position assets and liabilities are translated at the exchange rate prevailing at the reporting date
• Income statement items are translated at average exchange rates for the year (unless this average is not a reasonableapproximation of the cumulative effect of the rates prevailing on the transaction dates, in which case income and expensesare translated at the rate on the dates of the transactions)
• Proceeds and payments shown on the statement of cash flow are translated at the average exchange rates for the period(unless this average is not a reasonable approximation of the cumulative effect of the rates prevailing on the transactiondates, in which case income and expenses are translated at the rate on the dates of the transactions)
• Retained earnings are translated at historical exchange rates
• All resulting exchange differences are recognized in other comprehensive income
Goodwill and fair value adjustments to net assets arising from the acquisition of a foreign company are considered to be assetsand liabilities of the foreign company and are translated at year-end exchange rates. Exchange differences arising are recognized inother comprehensive income.
16
d) Foreign currency transactions
Transactions in foreign currency are translated into the functional currency using the exchange rates prevailing at the date of thetransactions or valuation date, in the case of items being re-measured. Foreign exchange gains and losses resulting from the settlementof these transactions and from the translation at reporting date exchange rates of monetary assets and liabilities denominated in foreigncurrencies are recognized in the income statement, except when deferred in other comprehensive income, such as qualifying as cashflow hedges.
e) Segment information
Segment information is presented in accordance with the internal information provided to the chief operating decision maker.The chief operating decision maker, responsible for allocating resources and assessing performance of operational segments, has beenidentified as the Chief Executive Officer (“CEO”) responsible for strategic decisions.
The chief operating decision maker considers the business from a geographical perspective and analyzes it across threeoperational segments—EMEA, Americas and Brazil. Note 23 shows detailed information by segment.
f) Intangible assets
Intangible assets are stated at acquisition cost, less any accumulated amortization and any accumulated impairment losses.
The intangible assets acquired in a business combination are initially measured at their fair value as at the acquisition date.
The acquisition cost comprises the purchase price, import duties and non-refundable taxes, after deducting trade discounts andrebates, and directly attributable costs of readying the asset for its intended use.
The useful lives of intangible assets are assessed on a case-by-case basis to be either finite or indefinite. Intangible assets withfinite lives are amortized on a straight line basis over their estimated useful life and assessed for impairment whenever events orchanges indicate that their carrying amount may not be recoverable. Intangible assets that have an indefinite useful life are not subjectto amortization and are tested annually for impairment.
The amortization charge on intangible assets is recognized in the consolidated income statement under “Depreciation andamortization”.
Amortization methods and schedules are revised annually at the end of each reporting period and, where appropriate, adjustedprospectively.
Customer base
The customer base is stated at cost and amortized on a straight line basis over its useful life, which has been estimated to bebetween seven and twelve years. The customer base relates to all agreements, tacit or explicit, entered into between the Atento Groupand the former owner of the Atento Group and between the Atento Group and other customers, in relation to the provision of services,and that were acquired as part of the business combinations indicated in Note 5.
Software
Software is measured at cost and amortized on a straight line basis over its useful life, generally estimated to be between threeand five years. The cost of maintaining software is expensed as incurred.
Development costs directly attributable to the design and creation of software trails that are identifiable and unique, and thatmay be controlled by the Group, are recognized as an intangible asset providing the following conditions are met:
• It is technically feasible for the intangible asset to be completed so that it will be available for use or sale.
• Management intends to complete the asset for use or sale.
• The Group has the capacity to use or sell the asset.
• It is possible to show evidence of how the intangible asset will generate probable future economic benefits.
• Adequate technical, financial and other resources are available to complete the development and to use or sell the intangible

17
asset.
• The outlay attributable to the intangible asset during its development can be reliably determined.
Directly attributable costs capitalized in the value of the software include the cost of personnel developing the programs and anappropriate percentage of overheads.
Costs that do not meet the criteria listed above are recognized as an expense as incurred. Expenditure for an intangible asset thatis initially recognized within expenses for the period may not be subsequently recognized as intangible assets.
Capitalized software development costs are amortized over their estimated useful lives, which normally does not exceed threeyears.
Intellectual property
Amounts paid to acquire or use intellectual property are recognized under “Intellectual property”. Intellectual property isamortized on a straight line basis over its useful life, estimated at ten years.
Other intangible assets
Other intangible assets are amortized on a straight line basis over their useful lives, which range from four to ten years.
g) Property, plant and equipment
Property, plant and equipment are measured at cost, less accumulated depreciation and any impairment losses. Land is notdepreciated.
Property, plant and equipment acquired in a business combination are initially measured at their fair value as at the acquisitiondate.
The acquisition costs comprise the purchase price, import duties and non-refundable taxes, after deducting trade discounts andrebates, and directly attributable costs of readying the asset for its intended use.
Acquisition costs also include, where appropriate, the initial estimates of decommissioning, withdrawal and site reconditioningcosts when the Atento Group is obliged to bear this expenditure as a condition of using the assets. Repairs that do not prolong theuseful life of the assets and maintenance costs are recognized directly in the income statement. Costs that prolong or improve the lifeof the asset are capitalized as an increase in the cost of the asset.
The Atento Group assesses the need to write down, if appropriate, the carrying amount of each item of property, plant andequipment to its period-end recoverable amount whenever there are indications that the assets’ carrying amount may not be fullyrecoverable through the generation of sufficient future revenue. The impairment allowance is reversed if the factors giving rise to theimpairment cease to exist (see Section h).
The depreciation charge for items of property, plant and equipment is recognized in the consolidated income statement under“Depreciation and amortization”.
Depreciation is calculated on a straight line basis over the useful life of the asset applying individual rates to each asset, whichare reviewed at the end of each reporting period. For assets acquired through a business combination, the Atento Group decided tomaintain their previous useful lives.
The useful lives generally used by the Atento Group are as follow:Years of useful life
Owned buildings and leasehold improvements............................................................................................................ 5 – 40Plant and equipment................................................................................................................................................... 3 – 6Furniture................................................................................................................................................................ 4 – 10Data processing equipment......................................................................................................................................... 1 – 5Vehicles................................................................................................................................................................ 7Other property, plant and equipment........................................................................................................................... 5 – 8
18
h) Impairment of non-current assets
The Atento Group assesses as at each reporting date whether there is an indicator that a non-current asset may be impaired. Ifany such indicator exists, or when annual impairment testing for an asset is required (e.g. goodwill), the Atento Group estimates theasset’s recoverable amount. An asset’s recoverable amount is the higher of its fair value less costs to sell or its value in use. Inassessing the value in use, the estimated future cash flow is discounted to its present value using a pre-tax discount rate that reflectscurrent market assessments of the time value of money and the risks specific to the asset. Where the carrying amount of an assetexceeds its recoverable amount, the asset is considered to be impaired. In this case, the carrying amount is written down to itsrecoverable amount, and the resulting loss is recognized in the income statement. Future depreciation/amortization charges areadjusted to reflect the asset’s new carrying amount over its remaining useful life. Management analyzes the impairment of each assetindividually, except in the case of assets that generate cash flow which are interdependent on those generated by other assets (cashgenerating units).
The Atento Group bases the calculation of impairment on the business plans of the various cash generating units to which theassets are allocated. These business plans cover five years, and the projections in year five and beyond are modeled based on anestimated constant or decreasing growth rate.
When there are new events or changes in circumstances that indicate that a previously recognized impairment loss no longerexists or has been decreased, a new estimate of the asset’s recoverable amount is made. A previously recognized impairment loss isreversed only if there has been a change in the estimates used to determine the asset’s recoverable amount since the last impairmentloss was recognized. If that is the case, the carrying amount of the asset is increased to its recoverable amount. The reversal is limitedto the carrying amount that would have been determined had no impairment loss been recognized for the asset in prior years. Thisreversal is recognized in the income statement and the depreciation charge is adjusted in future periods to reflect the asset’s revisedcarrying amount. Impairment losses relating to goodwill cannot be reversed in future periods.
i) Financial assets and liabilities
Financial assets
Upon initial recognition, the Atento Group classifies its financial assets into one of four categories: financial assets at fair valuethrough profit or loss, loans and receivables, held-to-maturity investments and available-for-sale financial assets. These classificationsare reviewed at the end of each reporting period and modified where applicable.
The Atento Group has classified all of its financial assets as loans and receivables, except for derivative financial instruments.
All purchases and sales of financial assets are recognized on the statement of financial position on the transaction date, i.e. whenthe commitment is made to purchase or sell the asset.
A financial asset is fully or partially derecognized from the statement of financial position only when:
1. The rights to receive cash flow from the asset have expired.
2. The Atento Group has assumed an obligation to pay the cash flow received from the asset to a third party or
3. The Atento Group has transferred its rights to receive cash flow from the asset to a third party, thereby substantiallytransferring all of the risks and rewards of the asset.
Financial assets and financial liabilities are offset and presented on a net basis in the statement of financial position when alegally enforceable right exists to offset the amounts recognized and the Atento Group intends to settle the assets and liabilities net orto simultaneously realize the asset and cancel the liability.
Loans and receivables include fixed-maturity financial assets not listed in active markets and which are not derivatives. They areclassified as current assets, except for those maturing more than twelve months after the reporting date, which are classified as non-current assets. Loans and receivables are initially recognized at fair value plus any transaction costs, and are subsequently measured atamortized cost, using the effective interest method. Interest calculated using the effective interest method is recognized under financeincome in the income statement.
The Atento Group assesses at each reporting date whether a financial asset is impaired. Where there is objective evidence ofimpairment of a financial asset valued at amortized cost, the amount of the loss to be taken to the income statement is measured as the

19
difference between the carrying amount and the present value of estimated future cash flow (without taking into account future losses),discounted at the asset’s original effective interest rate. The carrying amount of the asset is reduced and the amount of the impairmentloss is expensed in the consolidated income statement.
Trade receivables
Trade receivables are amounts due from customers for the sale of goods or services in the normal course of business.Receivables slated for collection in twelve months or less are classified as current assets; otherwise, the balances are considered non-current assets.
Trade receivables are recognized at the original invoice amount. An impairment provision is recorded when there is objectiveevidence of collection risk. The amount of the impairment provision is calculated as the difference between the carrying amount of thedoubtful trade receivables and their recoverable amount. In general, cash flow relating to short term receivables is not discounted.
Cash and cash equivalents
Cash and cash equivalents in the consolidated statement of financial position comprise cash on hand and in banks, demanddeposits and other highly liquid investments with an original maturity of three months or less.
For the purpose of the consolidated statement of cash flow, cash and cash equivalents are shown net of any outstanding bankoverdrafts.
Financial liabilities
Interest-bearing debt (Borrowing)
Interest-bearing debt is initially recorded at the fair value of the consideration received, less any directly attributable transactioncosts. After initial recognition, these financial liabilities are measured at amortized cost using the effective interest method. Anydifference between the cash received (net of transaction costs) and the repayment value is recognized in the income statement over thelife of the debt. Interest-bearing debt is considered to be non-current when the maturity date is longer than twelve months from thereporting date, or when the Atento Group has full discretion to defer settlement for at least another twelve months from that date.
Financial liabilities are derecognized in the statement of financial position when the respective obligation is settled, cancelled ormatures.
When the conditions agreed for a financial liability or part thereof are substantially modified, this modification is treated as aderecognition of the original liability and the recognition of a new liability. Conditions are considered substantially different whenthere is more than a 10% difference between the present value of cash flows discounted under the new terms using the originaleffective interest rate, including any commission paid net of any commission received, and the present discounted value of the cashflows remaining on the original financial liability. When an exchange of debt instruments or a modification of the conditions thereof isrecorded as an extinction, the costs or commission incurred are recognized as part of the gains or losses on the extinction. When anexchange of debt instruments or a modification of conditions thereof is not recorded as an extinction, the costs and commission willadjust the carrying amount of the liability and be amortized throughout the remaining life of the modified liability.
Trade payables
Trade payables are payment obligations in respect of goods or services received from suppliers in the ordinary course ofbusiness. Trade payables falling due in twelve months or less are classified as current liabilities; otherwise, the balances areconsidered as non-current liabilities.
Trade payables are initially recognized at fair value and subsequently measured at amortized cost using the effective interestmethod.
j) Derivative financial instruments and hedging
Derivative financial instruments are initially recognized at their fair values as at the date on which they are contractuallyarranged. The fair value is reassessed at each reporting date.

20
The accounting treatment of any gains or losses resulting from changes in the fair value of a derivative instrument qualifies as ahedge and, where applicable, the nature of the hedge relationship.
The Atento Group designates certain derivatives as cash flow hedges.
At the inception of the hedge, the Atento Group documents the relationship between the hedging instruments and the hedgeditems, as well as the risk management objectives and the strategy for groups of hedges. The Atento Group also documents itsassessment, both at the inception of the hedge and throughout the term thereof, of whether the derivatives used are highly effective atoffsetting changes in the fair value or cash flow of the hedged items.
The fair value of a hedging derivative is classified as a non-current asset or liability, as applicable, if the remaining maturity ofthe hedged item exceeds twelve months, otherwise it is classified as a current asset or liability.
Cash flow hedges
The effective portion of the fair value of derivatives designated and classified as cash flow hedges is recognized in equity. Gainsor losses in respect of the ineffective portion are taken to the income statement as incurred.
Amounts accumulated in equity are reclassified to the income statement in the periods in which the hedged item affects profit orloss.
When a hedging instrument matures or is sold, or when the requirements for hedge accounting are no longer met, any gain orloss accumulated in equity up until that moment remains in equity until the forecast transaction is definitively recognized in theincome statement.
Derivatives which are not considered as hedging instruments
Variations in the fair value of derivative financial instruments that are not considered as hedging derivatives are recorded in theincome statement.
k) Share capital
The ordinary shares of the Company are classified in equity (Note 19).
Incremental costs directly attributable to the issuance of new shares or options are deducted from the proceeds raised in equity,net of the tax effect.
Whenever any Group company acquires shares in the Company (treasury shares), the consideration paid, including any directlyattributable incremental costs (net of income taxes) is deducted from the equity attributable to the equity holders of the Company untilthe shares are cancelled, newly issued or sold. When these shares are subsequently reissued, all amounts received, net of any directlyattributable incremental transaction costs and the corresponding income tax effects, are included in the equity attributable to the equityholders of the Company.
l) Grants received
Government grants are recognized as “Deferred income” under “Other non-trade payables” within the statement of financialposition when there is reasonable assurance that the grant will be received and all attaching conditions will be complied with. Thegrants are released to income as “Operating grants”, classified under “Other operating income,” in the income statement in equalamounts over the useful life of the assets financed. When the grant relates to an expense item, it is recognized as income over theperiod necessary to match the grant to the costs that it is intended to compensate.
m) Provisions
Provisions are recognized when the Atento Group has a present obligation (legal or constructive) as a result of a past event, it isprobable that an outflow of resources embodying economic benefits will be required to settle the obligation, and a reliable estimatecan be made of the amount of the obligation. Provisions for restructuring include penalties for the cancellation of leases and othercontracts, as well as employee termination payments. Provisions are not recognized for future operating losses.

21
When the Atento Group is virtually certain that some or all of a provision is to be reimbursed, for example under an insurancecontract, a separate asset is recognized in the statement of financial position, and the expense relating to the provision is taken to theincome statement, net of the expected reimbursement.
Provisions are measured at the present value of expenditure expected to be required to settle the obligation, using a pre-tax ratethat reflects current market assessments of the time value of money and the specific risks inherent to the obligation. Any increase inthe provision due to the passage of time is recognized as a finance cost.
Contingent liabilities represent possible obligations to third parties, and existing obligations that are not recognized, given that itis not likely that an outflow of economic resources will be required in order to settle the obligation or because the amount cannot bereliably estimated. Contingent liabilities are not recognized on the consolidated statement of financial position unless they are acquiredfor consideration as part of a business combination.
n) Employee benefits
Pension obligations
The Atento Group has arranged defined contribution pension plans for employees in Mexico and Brazil. Under definedcontribution plans, the Atento Group pays fixed contributions to pension insurance plans managed publically or privately, on anobligatory, contractual or voluntary basis. The Atento Group has no legal or implicit obligation to make further contributions if thefund fails to hold sufficient assets to pay all employees the benefits corresponding to the services rendered in the present year and inprior years. The contributions are recognized as employee benefits when accrued. Benefits paid in advance are recognized as an assetinsofar as they entail a cash reimbursement or a reduction in future payments.
Management Incentive Plan
In 2013, the shareholders of the Atento Group have established a management incentive plan as described in Note 26.
Share-based payments
Atento S.A. operates a share-based compensation plan, under which the subsidiaries of Atento S.A. receive services fromemployees as consideration for the equity instruments of Atento S.A. The subsidiaries themselves are not party to any of the contracts;Atento S.A. will settle these agreements. The plan offers various instruments (award agreements, stock options, restricted stock units,etc.), but so far only two types of restricted stock units (“RSUs”) have been granted to selected employees on December 3, 2014.
The fair value of the employee services received in exchange for the grant of the RSUs is recognized as an expense in theconsolidated financial statements of Atento S.A. The total amount to be expensed is determined with reference to the fair value of theRSUs granted:
- Including any market performance conditions (for example, an entity’s share price)- Excluding the impact of any service and non-market performance vesting conditions (for example, profitability, sales
growth targets and remaining an employee of the entity over a specified time period) and- Including the impact of any non-vesting conditions (for example, the requirement for employees to save or hold shares for a
specific period of time).
At the end of each reporting period, the group revises its estimates of the number of RSUs that are expected to vest based on thenon-market vesting conditions and service conditions. It recognizes the impact of the revisions to original estimates, if any, in theincome statement, with a corresponding adjustment to equity.
When the RSUs vest, Atento S.A. will issue new shares or buy them back in the market. The proceeds received, net of anydirectly attributable transaction costs, are credited to share capital (nominal value) and share premium.
The social security contributions payable in connection with the granting of the share options is considered an integral part ofthe grant itself, and the charge will be treated as a cash-settled transaction.
Termination benefits
Termination benefits are paid to employees when the Atento Group decides to terminate their employment contracts prior to theusual retirement age or when the employee agrees to resign voluntarily in exchange for these benefits. The Atento Group recognizesthese benefits as an expense for the year, at the earliest of the following dates: (a) when the Atento Group is no longer able towithdraw the offer for these benefits; or (b) when the Atento Group company recognizes the costs of a restructuring effort as per IAS37, “Provisions, Contingent Liabilities and Contingent Assets”, and when this restructuring entails the payment of termination

22
benefits. When benefits are offered in order to encourage the voluntary resignation of employees, termination benefits are measuredon the basis of the number of employees expected to accept the offer. Benefits to be paid in more than twelve months from thereporting date are discounted to their present value.
o) Income tax
The income tax expense includes all the expenses and credits arising from the corporate income tax levied on all the AtentoGroup companies.
Income tax expenses for each period represent the aggregate amounts of current and deferred taxes, if applicable.
Current tax assets and liabilities for the current and prior periods are measured at the amount expected to be recovered from orpaid to the taxation authorities. The tax rates and tax laws used to compute the amounts are those that are enacted at the reporting datein each country in which the Atento Group operates.
Deferred taxes are calculated based on an analysis of the statement of financial position, in consideration of temporarydifferences generated from differences between the tax bases of assets and liabilities and their carrying amounts for financial reportingpurposes.
The main temporary differences arise due to differences between the tax bases and carrying amounts of plant, property andequipment, intangible assets, goodwill and non-deductible provisions, as well as differences between the fair value and tax bases ofnet assets acquired from a business combination.
Furthermore, deferred tax assets arise from unused tax credits and tax loss carryforwards.
The Atento Group determines deferred tax assets and liabilities by applying the tax rates that will be effective when thecorresponding asset is received or the liability settled, based on tax rates and tax laws that are enacted (or substantively enacted) at thereporting date.
The carrying amounts of deferred income tax assets are reviewed at each reporting date and reduced to the extent that it is nolonger probable that sufficient taxable profits will be available to allow all or part of that deferred tax asset to be utilized.Unrecognized deferred income tax assets are reassessed at each reporting date and are recognized to the extent that it has becomeprobable that future taxable profits will allow the deferred tax asset to be recovered.
Deferred tax liabilities associated with investments in subsidiaries and branches are not recognized when the timing of thereversal can be controlled by the parent company, and it is probable that the temporary differences will not reverse in the foreseeablefuture.
Deferred income tax relating to items directly recognized in equity is also recognized in equity. Deferred tax assets andliabilities resulting from business combinations are added to or deducted from goodwill.
Deferred tax assets and liabilities are offset only if a legally enforceable right exists to set off current tax assets against currentincome tax liabilities and the deferred taxes relate to the same taxable entity and the same taxation authority.
p) Revenue and expenses
Revenue and expenses are recognized on the income statement on an accruals basis, i.e. when the goods or services representedby them take place, regardless of when actual payment or collection occurs.
Revenue is measured at the fair value of the consideration received or to be received, and represents the amounts to be collectedfor goods or services sold, net of discounts, returns and value added tax. Revenue is recognized when the income can be reliablymeasured, when it is probable that the Group will receive a future economic benefit, and when certain conditions are met for eachGroup activity carried out.
Sales of services are recognized in the accounting period in which the services are rendered, with reference to the percentagecompletion, when the revenue and costs of the services contract, as well as the stage of completion thereof, can be reliably estimated,and it is probable that the related receivables will be recovered. When one or more of these service contract elements cannot be

23
reliably estimated, revenue from the sale of services are recognized only up to the amount of contract costs incurred the recovery ofwhich is deemed to be probable.
The Atento Group obtains revenue mainly from the provision of customer services, recognizing the revenue when theteleoperation occurs (based on the stage of completion of the service provided) or when certain contact center consulting work iscarried out.
Expenses are recognized in the income statement on an accruals basis, i.e. when the goods or services represented by them takeplace, regardless of when actual payment or collection occurs.
The Atento Group’s incorporation, start-up and research expenses, as well as expenses that do not qualify for capitalizationunder EU-IFRS, are recognized in the consolidated income statement when incurred and classified in accordance with their nature.
q) Interest income and expenses
Interest expenses incurred in the construction of any qualified asset is capitalized during the time necessary to complete the assetand prepare it for the intended use. All other interest expenditure is expensed in the year in which it is incurred.
Interest income is recognized using the effective interest method. When a loan or a receivable has been impaired, the carryingamount is reduced to the recoverable amount, discounting the estimated future cash flow at the instrument’s original effective interestrate and recognizing the discount as a decrease in interest income. Interest income on impaired loans is recognized when the cash iscollected or on the basis of the recovery of the costs when the loan is secured.
r) Leases (as lessee)
Leases where the lessor does not transfer substantially all of the risks and benefits of ownership of the asset are classified asoperating leases. Operating lease payments are recognized as an expense in the income statement on a straight line basis over the leaseterm.
The Atento Group rents certain properties. Those lease arrangements under which the Atento Group holds the significant risksand benefits inherent in owning the leased item are treated as finance leases. Finance leases are capitalized as an asset at the inceptionof the lease period and classified according to their nature. The related debt is recorded at the lower of the present value of theminimum lease payments agreed, and the fair value of the leased asset. Lease payments are proportionally allocated to the principal ofthe lease liability and to finance charges. Finance charges are reflected in the income statement over the lease term so as to achieve aconstant rate of interest on the balance pending repayment in each period.
s) Critical accounting estimates and assumptions
The preparation of consolidated financial statements under EU-IFRS requires the use of certain assumptions and estimates thataffect the recognized amount of assets, liabilities, income and expenses, as well as the related breakdowns.
Some of the accounting policies applied in preparing the accompanying consolidated financial statements required Managementto apply significant judgments in order to select the most appropriate assumptions for determining these estimates. These assumptionsand estimates are based on Management experience, the advice of consultants and experts, forecasts and other circumstances andexpectations prevailing at year end. Management’s evaluation takes into account the global economic situation in the sector in whichthe Atento Group operates, as well as the future outlook for the business. By virtue of their nature, these judgments are inherentlysubject to uncertainty. Consequently, actual results could differ substantially from the estimates and assumptions used. Should thisoccur, the values of the related assets and liabilities would be adjusted accordingly.
At the date of preparation of these consolidated financial statements, no relevant changes are forecast in the estimates. As aresult, no significant adjustments in the values of the assets and liabilities recognized at December 31, 2013 and 2014 are expected.
Although these estimates were made on the basis of the best information available at each reporting date on the events analyzed,events that take place in the future might make it necessary to change these estimates in coming years. Changes in accountingestimates would be applied prospectively in accordance with the requirements of IAS 8, “Accounting Policies, Changes in AccountingEstimates and Errors”, recognizing the effects of the changes in estimates in the related consolidated income statement.
An explanation of the estimates and judgments that entail a significant risk of leading to a material adjustment in the carryingamounts of assets and liabilities in the coming financial year is as follow:

24
Revenue recognition
The Atento Group recognizes revenue on an accruals basis during the period in which the services are rendered, with referenceto the stage of completion of the specific transaction, and assessed on the basis of the actual service provided as a proportion of thetotal services to be provided, as described in Note 3p above. Recognizing service revenue with reference to the stage of completioninvolves the use of estimates in relation to certain key elements of the service contracts, such as contract costs, period of execution andallowances related to the contracts. As far as is practical, the Atento Group applies its past experience and specific quantitativeindicators in its estimates, considering the specific circumstances applicable to specific customers or contracts. If certaincircumstances have occurred that may have an impact the initially estimated revenue, costs or percentage of completion, estimates arereviewed based on such circumstances. Such reviews may result in adjustments to costs and revenue recognized for a period.
Useful lives of property, plant and equipment and intangible assets
The accounting treatment of items of property, plant and equipment and intangible assets entails the use of estimates todetermine their useful lives for depreciation and amortization purposes. In determining the useful life, it is necessary to estimate thelevel of use of assets as well as forecast technological trends in the assets. Assumptions regarding the level of use, the technologicalframework and the future development require a significant degree of judgment, bearing in mind that these aspects are rather difficultto foresee. Changes in the level of use of assets or in their technological development could result in a modification of their usefullives and, consequently, in the associated depreciation or amortization.
Estimated impairment of goodwill
The Atento Group tests goodwill for impairment annually, in accordance with the accounting principle described in Note 3h.Goodwill is subject to impairment testing as part of the cash-generating unit to which it has been allocated. The recoverable amountsof cash-generating units defined in order to identify potential impairment in goodwill are determined on the basis of value in use,applying five-year financial forecasts based on the Atento Group’s strategic plans, approved and reviewed by Management. Thesecalculations entail the use of assumptions and estimates, and require a significant degree of judgment. The main variables consideredin the sensitivity analyses are growth rates, discount rates using the Weighted Average Cost of Capital (“WACC”) and the keybusiness variables.
Deferred taxes
The Atento Group assesses the recoverability of deferred tax assets based on estimates of future earnings. The ability to recoverthese deferred amounts depends ultimately on the Atento Group’s ability to generate taxable earnings over the period in which thedeferred tax assets remain deductible. This analysis is based on the estimated timing of the reversal of deferred tax liabilities, as wellas estimates of taxable earnings, which are sourced from internal projections and are continuously updated to reflect the latest trends.
The appropriate classification of tax assets and liabilities depends on a series of factors, including estimates as to the timing andrealization of deferred tax assets and the projected tax payment schedule. Actual income tax receipts and payments could differ fromthe estimates made by the Atento Group as a result of changes in tax legislation or unforeseen transactions that could affect the taxbalances (see Note 20).
The Atento Group has recognized tax credits corresponding to losses carried forward since, based on internal projections, it isprobable there will be future taxable profits against which they may be utilized.
The carrying amount of deferred income tax assets is reviewed at each reporting date, and reduced to the extent that it is nolonger probable that sufficient taxable profits will be available to allow all or part of that deferred tax asset to be utilized.Unrecognized deferred income tax assets are reassessed at each reporting date and are recognized to the extent that it has becomeprobable that future taxable profits will allow the deferred tax asset to be recovered.
Provisions and contingencies
Provisions are recognized when the Atento Group has a present obligation as a result of a past event, it is probable that anoutflow of resources will be required to settle the obligation and a reliable estimate can be made of the amount of the obligation. Thisobligation may be legal or constructive, deriving from, inter alia, regulations, contracts, customary practice or public commitmentsthat would lead third parties to reasonably expect that the Atento Group will assume certain responsibilities. The amount of theprovision is determined based on the best estimate of the outlay required to settle the obligation, taking into account all availableinformation as at the reporting date, including the opinions of independent experts such as legal counsel or consultants.

25
No provision is recognized if the amount of liability cannot be estimated reliably. In such cases, the relevant information wouldbe provided in the notes to the consolidated financial statements.
Given the uncertainties inherent in the estimates used to determine the amount of provisions, actual outflows of resources maydiffer from the amounts recognized originally on the basis of these estimates (see Note 21).
Fair value of derivatives and contingent-value instruments
The Atento Group uses derivative financial instruments to mitigate risks, primarily derived from possible fluctuations in interestrates on loans received. Derivatives are recognized at the onset of the contract at fair value, subsequently re-measuring the fair valueand adjusting as necessary at each reporting date.
The fair values of derivative financial instruments are calculated on the basis of observable market data available, either in termsof market prices or through the application of valuation techniques. The valuation techniques used to calculate the fair value ofderivative financial instruments include the discounting of future cash flow associated with the instruments, applying assumptionsbased on market conditions at the valuation date or using prices established for similar instruments, among others. These estimates arebased on available market information and appropriate valuation techniques. The fair values calculated could differ significantly ifother market assumptions and/or estimation techniques were applied.
Discounted cash flow analyses are used to analyze the fair value of the contingent-value instruments (“CVIs”). The fair value ofthe CVIs is based upon discounted cash flow analyses, for which the determination of fair value requires significant managementjudgment or estimation and results in a higher degree of financial statement volatility.
t) Consolidation method
All subsidiaries are fully consolidated. Intra-group income and expenses are eliminated on consolidation, as are all receivablesand payables between Group companies. Gains and losses arising on intra-group transactions are also eliminated. Where necessary,the accounting policies of subsidiaries have been brought into line with those adopted in the Atento Group.
The details of Atento Group subsidiaries at December 31, 2013 and 2014 are as follow:

26
NameRegistered
address Line of businessFunctionalcurrency % interest Holding company
Atalaya Luxco Midco, S.à.r.l…………..... Luxembourg Holding company EUR 100 Atento S.A.
Atento Luxco 1 S.A……………………..... Luxembourg Holding company EUR 100Atalaya Luxco Midco,S.à.r.l
Atalaya Luxco 2. S.à.r.l………………….. Luxembourg Holding company EUR 100 Atento Luxco 1. S.A.
Atalaya Luxco 3. S.à.r.l………………….. Luxembourg Holding company EUR 100 Atento Luxco 1. S.A.
Atento Argentina. S.A(1)…………………...Buenos Aires(Argentina) Operation of call centers ARS
9010
Atalaya Luxco 2. S.à.r.l.Atalaya Luxco 3. S.à.r.l.
Global Rossolimo. S.L.U............................. Madrid (Spain) Holding company EUR 100Atento Spain Holdco.S.L.U.
Atento Spain Holdco. S.L.U……………… Madrid (Spain) Holding company EUR 100 Atento Luxco 1. S.A.
Atento Spain Holdco 6. S.L.U……………. Madrid (Spain) Holding company EUR 100Atento Spain Holdco.S.L.U.
Atento Spain Holdco 2. S.A.U (2)….……..... Madrid (Spain) Holding company EUR 100Atento Spain Holdco 6.S.L.U.
Atento Teleservicios España. S.A.U………. Madrid (Spain) Operation of call centers EUR 100Atento Spain Holdco 2.S.A.U.
Atento Servicios Técnicos y ConsultoríaS.A.U…………………………………….….
Madrid(Spain)
Execution of technologicalprojects and services, andconsultancy services EUR 100
Atento TeleserviciosEspaña S.A.U.
Atento Impulsa. S.A.U………………….… Barcelona (Spain)
Management of specializedemployment centers for disabledworkers EUR 100
Atento TeleserviciosEspaña S.A.U.
Atento Servicios Auxiliares de ContactCenter. S.A.U…………………………….... Madrid (Spain)
Execution of technologicalprojects and services, andconsultancy services EUR 100
Atento TeleserviciosEspaña. S.A.U.
Atento Maroc. S.A…………………….…...Casablanca(Morocco) Operation of call centers MAD 99,9991
Atento TeleserviciosEspaña S.A.U.
Atento B V…………………………….….…Amsterdam(Netherlands) Holding company EUR 100
Atento Spain Holdco 2.S.A.U.
Teleatento del Perú. S.A.C(3)………….…... Lima (Peru) Operation of call centers PEN
83,3333(Class A)16,6667
(Class B)
Atento B.V.
Atento Holding Chile. S.A.
Woknal. S.A………………………………...Montevideo(Uruguay) Operation of call centers UYU 100 Atento B.V.
Atento Colombia. S.A……………………....Bogotá DC(Colombia) Operation of call centers COP
94,97871 Atento B.V.
0,00424
Atento ServiciosAuxiliares de ContactCenter. S.L.U.
0,00854Atento Servicios Técnicosy Consultoría. S.L.U.
5,004270Atento TeleserviciosEspaña. S.A.U.
0,00424Atento TeleserviciosEspaña. S.A.U.
Atento Holding Chile. S.A………………….Santiago de Chile(Chile) Holding company CLP 99,9999 Atento B.V.
Atento Chile. S.A…………..……………….Santiago de Chile(Chile) Operation of call centers CLP 99,99 Atento Holding Chile. S.A.

27
Atento Educación Limitada……………..…Santiago de Chile(Chile) Operation of call centers CLP
991
Atento Chile. S.A.Atento Holding Chile. S.A.
Atento Centro de Formación TécnicaLimitada……………………………………..
Santiago de Chile(Chile) Operation of call centers CLP
991
Atento Chile. S.A.Atento Holding Chile. S.A.
Atento Spain Holdco 4. S.A.U……………... Madrid (Spain) Holding company EUR 100Atento Spain Holdco.S.L.U.
Atento Brasil. S.A………………………......São Paulo(Brazil) Operation of call centers BRL
99,999Atento Spain Holdco 4.S.A.U.
0,01 Atento Luxco 1, S.A.
Atento Brasil 1 Ltda(4)…..……………….…São Paulo(Brazil) Operation of call centers BRL 100 Atento Brasil. S.A.
Atento Spain Holdco 5. S.L.U……………... Madrid (Spain) Holding company EUR 100Atento Spain Holdco.S.L.U.
Atento Ceská Republika, a.s.(5) .…………...Praga (CzeckRepublic) Operation of call centers Euros 100
Atento Spain Holdco,S.L.U.
Atento Mexico Holdco S. de R.L. de C.V… Mexico Holding company MXN
99,9667
0,0333
Atento Spain Holdco 5.S.L.U.Atento Spain Holdco.S.L.U.
Atento Puerto Rico. Inc………………..…..Guaynabo(Puerto Rico) Operation of call centers USD 100
Atento Mexico Holdco S.de R.L. de C.V..
Contact US Teleservices Inc…………….…Houston, Texas(USA) Operation of call centers USD 100
Atento Mexicana. S.A. deC.V.
Atento Panamá. S.A……………………….. Panama City Operation of call centers USD
99
1
Atento Mexico Holdco S.de R.L. de C.V.Atento Mexicana. S.A. deC.V.
Atento Atención y Servicios. S.A. de C.V…Mexico City(Mexico)
Administrative, professional andconsultancy services MXN
99,998
0,002
Deutsche Bank México,S.A., IBM, DivisiónFiduciaria AtentoServicios. S.A. de C.V.
Atento Servicios. S.A. de C.V…………….Mexico City(Mexico) Sale of goods and services MXN
999995
0,0005
Deutsche Bank México,S.A., IBM, DivisiónFiduciaria Atento Atencióny Servicios. S.A. de C.V.
Atento Centroamérica. S.A……………….Guatemala(Guatemala) Holding company GTQ
99,9999
0,0001
Atento Mexicana. S.A. deC.V.Atento El Salvador S.A. deC.V.
Atento de Guatemala. S.A………………….Guatemala(Guatemala) Operation of call centers GTQ
99,99999
0,00001
Atento Centroamérica.S.A.Atento El Salvador S.A. deC.V.
Atento El Salvador. S.A. de C.V………….
City of SanSalvador (ElSalvador) Operation of call centers
USD7,4054
92,5946
Atento Centroamerica.S.A.Atento de Guatemala. S.A.
Atento Nicaragua S.A(6)……………….…... Nicaragua Operation of call centers
1%
99%
Atento Centroamerica.S.A.Atento Mexico Holdco S.de R.L. de C.V.
Atento Costa Rica S.A(7)…...………………. Costa Rica Operation of call centers
1%
99%
Atento Centroamerica.S.A.Atento Mexico Holdco S.de R.L. de C.V.
(1) At December 31, 2013, this company’s corporate name was Centros de Contacto Salta, S.A.(2) On April 9th, 2013, this company was transformed into a Public Limited Company.(3) Teleatento del Peru S.A.C. (Voting power held by each shareholder)

28
The distribution of profits will be made in the amount and at the time resolved by the Annual General Meeting, and dividends will be paid in different proportions. Thedividends will be distributed among the shareholders, following the agreed proportion, depending on the class of shares, in the following manner:
(i) Holders of Class “A” shares will have the right to receive 99% of the overall of distributable profits produced by the Company in each opportunity.(ii) Holders of Class “B” shares will have the right to receive one (1) per cent from the overall distributable profits produced by the Company in each opportunity.
(4) Incorporated to Atento Group on December 30, 2014.(5) Sold on December 9th, 2014.(6) Incorporated to Atento Group on the last quarter of 2014.(7) Please refer to footnote n. 5.
At December 31, 2013 and 2014, none of the Group´s subsidiaries is listed on a stock exchange and all use December 31 as theirreporting date, except for Atento Luxco 1 S.A. which has debt securities listed in the Global Exchange Market in Ireland.
All Group companies subject to statutory audit as per local legislation have been audited.
u) New and amended standards and interpretations
The new and amended standards and interpretations issued by the IASB that have entered into force and been applied during theyear are as follow:
Amendment to IAS 32, “Offsetting Financial Assets and Financial Liabilities” - effective for annual periods beginning on orafter January 1, 2014.
Amendment to IFRS 10, IFRS 12 and IAS 27, “Investment Entities’ - effective for annual periods beginning on or after January1, 2014.
IFRIC 21, “Levies” - effective for annual periods beginning on or after January 1, 2014.
Amendments to IAS 39, “Novation of Derivatives and Continuation of Hedge Accounting” -effective for annual periodsbeginning on or after January 1, 2014.
These standards have not had a significant effect on the Atento Group’s consolidated financial statements, with the exception ofmodifications in presentation and disclosures that have been included in the Atento Group’s consolidated financial statements.
New and amended standards and interpretations that have yet to enter into force and that have not been adopted early by theAtento Group.
At the date of publication of these consolidation financial statements, the IASB has issued the following new and amendedstandards and interpretations, which enter into force for accounting periods beginning on or after January 1, 2015 and that the AtentoGroup has not adopted early.
Amendments to IAS 16 and IAS 38, “Clarification of Acceptable Methods of Depreciation and Amortization” - effective forannual periods beginning on or after January 1, 2016.
Annual improvements to IFRS’s 2010-2012 Cycle – Effective for annual periods beginning on or after July 1, 2014.
Annual improvements to IFRS’s 2011-2013 Cycle – Effective for annual periods beginning on or after July 1, 2014.
Annual Improvements to IFRS 2012-2014 Cycle - effective for annual periods beginning on or after January 1, 2016.
IFRS 15, “Revenue from Contracts with Customers” - effective for annual periods beginning on or after July 1, 2017 (was notendorsed by EU for 2014).
IFRS 9, “Financial Instruments” - effective for annual periods beginning on or after January 1, 2018 (was not endorsed by EUfor 2014).
The Atento Group is currently assessing the impact of the application of these standards and amendments. Pursuant to theanalyses conducted to date, the Atento Group estimates that the application of these amendments will not have a material impact onthe Group consolidated financial statements during the period of its initial application.

29
4) FINANCIAL RISK MANAGEMENT
4.1 Financial risk factorsThe Atento Group’s activities expose it to various types of financial risk: market risk (including currency risk, interest rate risk
and country risk), credit risk and liquidity risk. The Atento Group’s global risk management policy aims to minimize the potentialadverse effects of these risks on the Atento Group’s financial returns. The Atento Group also uses derivative financial instruments tohedge certain risk exposures.
a) Market risk
Interest rate risk in respect of cash flow and fair value
Interest rate risk arises mainly as a result of changes in interest rates which affect: (i) finance costs of debt, bearing interest atvariable rates (or debt with short term maturity which is expected to be renewed), as a result of fluctuations in interest rates, and(ii) the value of non-current liabilities that bear interest at fixed rates.
At December 31, 2014 48.0% of financial debt with third parties (excluding CVIs and the effect of financial derivativeinstruments) bore interests at variable rates, while at December 31, 2013 this amount was 43.2%.
The Atento Group’s finance costs are exposed to fluctuations in interest rates. In 2013 and 2014, the rate to which the AtentoGroup had the greatest exposure was the Brazilian CDI rate.
As of December 31, 2014, the estimated fair value of the interest rate hedging instruments related to the Brazilian Debenturestotaled $10.9 million, which was recorded as a financial asset. Based on our total indebtedness of $653.3 million as of December 31,2014 and not taking into account the impact of our interest rate hedging instruments referred to above, a 1% change in interest rateswould impact our net interest expense by $3.2 million.
As of December 31, 2013, the estimated fair value of the interest rate hedging instruments related to the Brazilian Debenturestotaled $15.6 million, which was recorded as a financial asset. Based on our total indebtedness of $1,370.8 million as of December 31,2013 and not taking into account the impact of our interest rate hedging instruments referred to above, a 1% change in interest rateswould impact our net interest expense by $3.8 million.
The Atento Group’s policy is to monitor exposure to this risk. In that regard, as described in Note 14, the Atento Group hasarranged interest rate swaps that have the economic effect of converting floating-rate borrowing into loans at fixed interest rates.
The table below shows the impact on these value of derivatives of a +/-10 basis points variation in the CDI interest rate curves.
Thousands ofU.S. dollars
INTEREST RATE 12/31/2014FAIR VALUE............................................................................................................................................................. 10,9160.10%........................................................................................................................................................................... 10,434-0.10%......................................................................................................................................................................... 11,399
Also, as described in Note 14, the Atento Group has cross-currency swap hedging instruments with the economic effect ofcovering cash flow related to the Senior Secured Notes issued in U.S. dollars.
Additionally, the Atento Group holds derivatives which are not considered as hedging instruments related to the cash flowgenerated in Mexican Pesos, Colombian Pesos and Peruvian Nuevos Soles.
The table below shows the impact on the value of the rest of derivatives of a +/-10 basis points variation in the interest ratecurve.
Thousands of

30
U.S. dollarsCROSS CURRENCY 12/31/2014
FAIR VALUE……………………………………………………………………………………………………........ 20,1550.10%............................................................................................................................................................................ 18,939-0.10%................................................................................................................................................................................. 21,487
Foreign currency risk
As at December 31, 2013 and 2014, the Atento Group entities held several borrowing and cash equivalents in currencies otherthan their functional currency.
The most significant exposure to foreign currency risk is derived from the U.S. dollar denominated Senior Secured Notes issuedby the subsidiary Atento Luxco 1, S.A. in 2013 whose functional currency is the Euro. As indicated above, the Atento Group hascross-currency swap hedging instruments with the economic effect of covering cash flow related to the Senior Secured Notes issued inU.S. dollars.

31
Sensitivity analysis of foreign currency risk
The Atento Group has reasonable control over its foreign currency risks, as its financial assets and financial liabilities denominated in currencies other than their functionalare adequately matched. A sensitivity analysis based on the outstanding volume of financial assets and liabilities (applying a 10% appreciation of each asset/liability currencyversus the functional currency) highlights the limited impact that such an event would have on the income statement is U.S. dollars.
2013 Financial assets (*) Financial liabilities (*) Sensitivity analysis
Functional currency - financialasset/liability currency
Functionalcurrency
(thousands)
Assetcurrency
(thousands)U.S. Dollar(thousands)
Functionalcurrency
(thousands)
Liabilitycurrency
(thousands)U.S. Dollar(thousands)
Appreciation ofasset/liabilitycurrency vs
functional currency
Appreciationof financial
assets infunctionalcurrency
Incomestatement
profit/(loss)(thousands ofU.S. Dollar)
Appreciationof financialliabilities infunctionalcurrency
Incomestatement
profit/(loss)(thousands ofU.S. Dollar)
Euro - USD 2,909 4,011 4,011 215,852 297,681 297,681 10% 1.24118928 3,232 446 239,835 (33,075)Peruvian Nuevos Soles - USD 1,748 625 625 3,795 1,357 1,257 10% 0.32183086 1,943 69 4,217 (151)Uruguayan Pesos – USD 7,507 351 351 3,540 165 165 10% 0.0420777 8,341 39 3,921 (18)Argentinian Pesos – USD - - - 27 4 4 10% 0.13801564 - - 29 -Euro - Argentinian Pesos (CVI) - - - 31,446 282,798 43,367 10% 8.09381632 - - 34,940 (4,819)Mexican Pesos – Euro 56,724 3,144 4,335 - - - 10% 0.04987656 63,027 482 - -Mexican Pesos – USD 34,488 2,636 2,636 - - - 10% 0.068784727 38,320 293 - -Colombian pesos – USD 361,010 187 187 - - - 10% 0.000467088 401,122 21 - -Guatemalan Quetzal – USD 2,168 276 276 - - - 10% 0.114775862 2,409 31 - -Euro - Mexican Pesos 86 1,559 119 - - - 10% 16.24009354 96 13 - -
2014 Financial assets (*) Financial liabilities (*) Sensitivity analysis
Functional currency - financialasset/liability currency
Functionalcurrency
(thousands)
Assetcurrency
(thousands)U.S. Dollar(thousands)
Functionalcurrency
(thousands)
Liabilitycurrency
(thousands)U.S. Dollar(thousands)
Appreciation ofasset/liability currencyvs functional currency
Appreciationof financial
assets infunctionalcurrency
Incomestatement
profit/(loss)(thousands ofU.S. Dollar)
Appreciationof financialliabilities infunctionalcurrency
Incomestatement
profit/(loss)(thousands ofU.S. Dollar)
Euro - USD 8,642 10,492 10,492 247,317 300,269 300,269 10% 1.0926905 9,602 1,166 274,798 (33,365)Peruvian Nuevos Soles - USD 9,905 3,325 3,325 4,019 1,349 1,349 10% 0.3021047 11,006 369 4,465 (150)Euro - Argentinian Pesos (CVI) - - - 29,964 311,077 36,379 10% 9.3435965 - - 33,293 (4,042)Mexican Pesos – Euro 998 106 68 - - - 10% 0.0502862 2,100 75 - -Mexican Pesos – USD 10 1 1 - - - 10% 0.0610525 12 0 - -Colombian Pesos – USD 113,579 48 48 - - - 10% 0.0003765 126,199 5 - -Guatemalan Quetzal – USD 433 57 57 - - - 10% 0.1184717 481 6 - -Euro - Mexican Pesos 89 1,586 108 - - - 10% 16.1077878 98 1 - -Euro - Colombian Pesos 627 1,820,116 761 - - - 10% 2,612.0110134 697 85 - -Euro - Dirham Moroccan 335 3,690 407 - - - 10% 9.9101566 372 45 - -Euro - Peruvian Nuevos Soles 62 224 75 - - - 10% 3.2552343 69 8 - -Dirham Moroccan – Euro 246 22 27 - - - 10% 0.0817343 274 33 - -Brazilian Reais – USD 66,409 25,001 25,001 - - - 10% 0.3388299 73,788 2,778 - -Chilean Pesos – Euro 47 0 0 - - - 10% 0.0012217 38 (0) - -Chilean Pesos – USD 260 0 0 - - - 10% 0.0014833 175 (0) - -
(*) Financial liabilities correspond to borrowing in currencies other than functional currencies (Senior Secured Notes, Finance Leases and CVIs). Financial Assets correspond to cash and cash equivalents in currenciesother than functional currencies. Example of the income statement impact of appreciation of the asset/liability currency versus the functional currency. When conducting this sensitivity analysis, assuming depreciation,the income statement impact would be the same, but precisely reversed.
32
Country risk
To manage or mitigate country risk, the Atento Group repatriates the funds generated in the Americas and Brazil that are notrequired to pursue new, profitable business opportunities in the region. The capital structure of the Atento Group comprises twoseparate ring-fenced financings: (i) the Brazilian Debentures denominated in Brazilian Reais and (ii) the USD 300 million 7.375%Senior Secured Notes due 2020, together with the €50 million ($60.7 million) Revolving Credit Facility. The objective of combining aBrazilian term loan with a USD bond is to create a natural hedge for the interest payments on the Brazilian loan, which are servicedwith cash flow from Atento Brazil denominated in Brazilian Reais.
Argentinian subsidiary sit outside of these two separate ring-fenced financings, and as a result, we do not rely on cash flow fromthese operations to serve our Company’s debt commitments.
b) Credit risk
The Atento Group seeks to conduct all of its business with reputable national and international companies and institutions ofestablished solvency in their countries of origin, so as to minimize credit risk. As a result of this policy, the Atento Group has nomaterial adjustments to make to its trade accounts (see Note 13 on impairment allowances).
Accordingly, the Atento Group’s commercial credit risk management approach is based on continuous monitoring of the risksassumed and the financial resources necessary to manage the Group’s various units, in order to optimize the risk-reward relationshipin the development and implementation of business plans in the course of their regular business.
Credit risk arising from cash and cash equivalents is managed by placing cash surpluses in high quality and highly liquid moneymarket assets. These placements are regulated by a master agreement revised annually on the basis of the conditions prevailing in themarkets and the countries where Atento operates. The master agreement establishes: (i) the maximum amounts to be invested percounterparty, based on their ratings (long and short term debt ratings); (ii) the maximum period of the investment; and (iii) theinstruments in which the surpluses may be invested.
The Atento Group’s maximum exposure to credit risk is primarily limited to the carrying amounts of its financial assets (seeNotes 11, 12, 13, 14 and 15). The Atento Group holds no guarantees as collection insurance. As disclosed in Note 23, the AtentoGroup carries out significant transactions with the Telefónica Group. At December 31, 2014 the balance of accounts receivable withTelefónica Group amounted to 236,950 thousand U.S. dollars (302,234 the thousand U.S. dollars in 2013).
c) Liquidity risk
The Atento Group seeks to match its debt maturity schedule to its capacity to generate cash flow to meet the payments fallingdue, factoring in a comfortable cushion. In practice, this has meant that the Atento Group’s average debt maturity must be longer thanthe length of time required to pay its debt (assuming that internal projections are met). A maturity schedule for the Atento Group’sfinancial liabilities is provided in Note 16.
4.2 Capital Management
The Atento Group’s Finance Department, which is in charge of the capital management, takes various factors into considerationwhen determining the Group’s capital structure.
The Atento Group’s capital management goal is to determine the financial resources necessary both to continue its recurringactivities and to maintain a capital structure that optimizes own and borrowed funds.
The Atento Group sets an optimal debt level in order to maintain a flexible and comfortable medium term borrowing structure,in order to be able to carry out its routine activities under normal conditions and also address new opportunities for growth. Debtlevels are kept in line with forecast future cash flows and with quantitative restrictions imposed under financing contracts.
In addition to these general guidelines, other considerations and specifics are taken into account when determining the AtentoGroup’s financial structure, such as country risk in the broadest sense, tax efficiency and volatility in cash flow generation.

33
As indicated in Note 17, among the restrictions imposed under financing arrangements, the debentures contract lays out certaingeneral obligations and disclosures in respect of the lending institutions. Specifically, the borrower (BC Brazilco Participações, S.A.,which has now merged with Atento Brasil, S.A.) must comply with the quarterly net financial debt/EBITDA ratio set out in thecontract terms.
The contract also sets out additional restrictions, including limitations on dividends, payments and distributions to shareholdersand capacity to incur additional debt.
The Super Senior Revolving Credit Facility, also described in Note 17, carries no financial covenant obligations regarding debtlevels. However, the credit facility does impose limitations on the use of the funds, linked to compliance with a debt ratio. Thecontract also includes other restrictions, including: limitations on the distribution of dividends, payments or distributions toshareholders, the capacity to incur additional debt, and on investments and disposal of assets.
The Senior Secured Notes issued in 2013 carry no limitation covenant obligations regarding debt levels. However, the Notes doimpose limitations on the distributions on dividends, payments or distributions to the shareholders, the incurring of additional debt,and on investments and disposals of assets.
As at the date of these consolidated financial statements, the Atento Group was in compliance with all restrictions established inthe aforementioned financing contracts, and does not foresee any future non-compliance. To that end, the Atento Group regularlymonitors figures for net financial debt with third parties and EBITDA.
The reconciliation between EBITDA and the consolidated income statement is as follow:
Thousands of U.S. dollarsFor the year ended December 31,
2013 2014Loss for the period from continuing operations (4,039) (42,152)Income tax expense 8,346 18,533Net finance expense 100,667 110,769Depreciation and Amortization 128,975 119,820EBITDA 233,949 206,970
Net financial debt with third parties at December 31, 2013 and 2014 is as follow:Thousands of U.S. dollars
12/31/2013 12/31/2014Senior Secured Notes (Note 17) 297,681 300,269Brazilian bonds - Debentures (Note 17) 345,854 245,932Bank borrowing (Note 17) 632 61,720Finance lease payables (Note 17) 11,877 9,010CVIs (Note 17) 43,367 36,379Vendor Loans (Note 17) 151,701 -Derivative financial liabilities (Note 14) 15,962 1,193Less: Cash and cash equivalents (Note 15) (213,491) (211,440)Net financial debt with third parties 653,583 443,063
4.3 Fair value estimation
The table below shows an analysis of the financial instruments measured at fair value, classified according to the valuationmethod used. The following valuation levels are used:
Prices (unadjusted) quoted in active markets for identical assets and liabilities (Level 1).
Data other than the Level 1 quoted price that are observable for the asset or liability, either directly (i.e. prices) or indirectly (i.e.price derivatives) (Level 2).
Data for the asset or liability that are not based on observable market data (Level 3).

34
The Atento Group’s assets and liabilities measured at fair value at December 31, 2013 and 2014 are as follow:
Thousands of U.S. dollars2013 Level 1 Level 2 Level 3 Total balance
AssetsDerivatives (Note 14) - 18,296 - 18,296Total assets - 18,296 - 18,296LiabilitiesDerivatives (Note 14) - (15,962) - (15,962)CVIs (Note 17) - - (43,367) (43,367)Total liabilities - (15,962) (43,367) (59,329)
Thousands of U.S. dollars2014 Level 1 Level 2 Level 3 Total balance
AssetsDerivatives (Note 14) - 32,265 - 32,265Total assets - 32,265 - 32,265LiabilitiesDerivatives (Note 14) - (1,193) - (1,193)CVIs (Note 17) - - (36,379) (36,379)Total liabilities - (1,193) (36,379) (37,572)
No transfers were carried out between the different levels during the year.
The following table reflects the movements of the Atento Group’s Contingent Value Instruments (“CVIs”) described in Note 17measured at fair value using significant unobservable inputs as at December 31, 2013 and 2014:
December 31,2013 2014
Fair value at the beginning of the period (52,275) (43,367)Change in fair value (5,630) (6,187)Translation differences 14,538 13,175
Fair value at December 31 (Note 17) (43,367) (36,379)
a) Level 1 financial instruments:
The fair value of financial instruments traded on active markets is based on the quoted market price at the reporting date. Amarket is considered active when trading prices are easily and regularly available through a stock exchange, financial intermediary,industry institution, price service or regulatory body, and when these prices reflect actual routine arm’s length market transactions.The quoted market price used for the Atento Group’s financial assets is the current bid price. These instruments are classified in Level1, although as at the dates in question, the Atento Group had no Level 1 financial instruments.
b) Level 2 financial instruments:
The fair value of financial instruments not traded in an active market (i.e. OTC derivatives) is determined using valuationtechniques. Valuation techniques maximize the use of available observable market data, and place as little reliance as possible onspecific company estimates. If all of the significant inputs required to calculate the fair value of a financial instrument are observable,the instrument is classified in Level 2. The Atento Group’s Level 2 financial instruments comprise interest rate swaps used to hedgefloating rate loans and cross currency swaps.
c) Level 3 financial instruments:
If one or more significant inputs are not based on observable market data, the instrument is classified in Level 3.

35
The specific financial instrument valuation techniques used by the Atento Group include the following:
• Quoted market prices or prices established by financial intermediaries for similar instruments.
• The fair value of interest rate swaps is calculated as the present value of the future estimated cash flow based on estimatedinterest rate curves.
• The present value of foreign currency futures is determined using forward exchange rates at the reporting date,discounting the resulting amount from the present value.
• Discounted cash flow analyses are used to determine the fair value of the CVIs, as discussed in Note 17. The fair values ofthe CVIs are based upon discounted cash flow analyses for which the determination of fair value requires significantmanagement judgment or estimation and result in a higher degree of financial statement volatility. As observable marketactivity is often unavailable when estimating the fair value of the CVIs, we estimate the fair value using a modelingtechnique which includes the use of a variety of inputs/assumptions including interest rates or other relevant inputs.Changes in the significant underlying factors or assumptions (either an increase or a decrease) in any of these areasunderlying our estimates may not result in a significant increase/decrease in the fair value measurement of the CVIs. Forexample, an increase of 100 basis points in the discount rate would not result in a significant decrease in the fair value ofthe CVIs.
5) BUSINESS COMBINATIONS
a) Casa Bahia Contact Center Ltda.
As at December 30, 2014, the Company, through its wholly owned subsidiary Atento Brasil S.A. acquired 100% of the sharecapital of Casa Bahia Contact Center Ltda. (“CBCC”), a call center services provider located in Brazil, for a total acquisition price of20,343 thousand of reais (equivalent to 7,659 thousand U.S. dollars). As a result of the acquisition, the Atento group is expected toincrease its presence in these markets. At December 30, 2014, this company has been renamed as Atento Brasil 1, Ltda.
The goodwill of 4,061 thousand U.S. dollars arose from the acquisition, which is attributable to the synergies derived fromcombining the operations of the Atento and CBCC. None of the goodwill recognized is expected to be deductible for income taxpurposes.
If the combination had taken place at the beginning of the year, revenue from continuing operations would have been 26,966thousand U.S. dollars and loss before tax from continuing operations for the Group would have been 4,396 thousand U.S. dollars.
The table below sets out the fair values of the assets acquired and the liabilities undertaken, as well as the considerationtransferred:
Fair value recognized upon acquisition as at December 30, 2014 Thousands of U.S. dollarsRecognized amounts of identifiable assets acquired and liabilities assumedAssetsCash and cash equivalentes 199Property, plant and equipment (Note 9) 2,598Intangible assets (Note 6) 5,551Trade and other receivables 11,793LiabilitiesTrade and other payables 3,656Contingent liability (Note 21) 11,594Deferred tax liabilities (Note 20b) 1,873Total net identifiable assets at fair value 3,018Goodwill (Note 7) 4,061Translation differences 580Total consideration transferred 7,659Total 7,659
The main assets acquired and liabilities undertaken at fair value were as follow:

36
- Contractual relationship with customers other than CBCC. This intangible assets was valued using the income approach,through the MEEM, at 5,214 thousand U.S. dollars to be amortized over an estimated five-year useful life.
- The Atento Group recognized an additional of 1,873 thousand U.S. dollars (Fair value) in deferred tax liabilities, primarilydue to changes in the fair value of assets in customer base.
6) INTANGIBLE ASSETS
The following table presents the breakdown of intangible assets at December 31, 2013 and 2014 and respective changes in theyear:
Thousands of U.S. dollarsBalance as at
Additions Disposals Transfers
Balance as atDecember 31, Translation December 31,
2012 differences 2013CostsDevelopment - 1,671 (95) - (133) 1,443 Customer base 390,097 - - - (26,380) 363,717 Software 36,850 11,283 (4) - (1,112) 47,017 Other intangible assets 52,425 - - - (1,143) 51,282 Work in progress 888 981 (754) - 35 1,150Total costs 480,260 13,935 (853) - (28,733) 464,609Accumulated amortizationDevelopment - (5) - - - (5) Customer base (13) (40,668) 13 - 1,706 (38,962) Software (1,411) (16,074) 64 - 213 (17,208) Other intangible assets (1,018) (13,933) - - (706) (15,657)Total accumulated amortization (2,442) (70,680) 77 - 1,213 (71,832)Net intangible assets 477,818 (56,745) (776) - (27,520) 392,777
Thousands of U.S. dollarsBalance at
December 31,2013 Additions
Acquisition ofnew entities
(Note 5b) Disposals TransfersTranslationdifferences
Balance atDecember 31,
2014
Cost Development 1,443 2,024 - (76) (409) (388) 2,594 Customer base 363,717 - 5,214 - - (43,983) 324,948 Software 47,017 19,640 337 (185) 1,253 (7,849) 60,213 Other intangible assets 51,282 2,550 - - - (6,514) 47,318 Work in progress 1,150 754 - - (844) (120) 940Total cost 464,609 24,968 5,551 (261) - (58,854) 436,013Accumulated amortization Development (5) (115) - - - 9 (111) Customer base (38,962) (38,120) - - - 10,171 (66,911) Software (17,208) (12,899) - 108 - 2,136 (27,863) Other intangible assets (15,657) (9,685) - - - 2,064 (23,278)Total accumulatedamortization (71,832) (60,819) - 108 - 14,380 (118,163)Impairment - (27,375) - - - 2,603 (24,772)Net intangible assets 392,777 (63,226) 5,551 (153) - (41,871) 293,078
“Customer base” represents the fair value, within the business combination involving the acquisition of control of the AtentoGroup, of the intangible assets arising from service agreements (tacit or explicitly formulated in contracts) with Telefónica Group andwith other customers. The addition of new entity in the customer base is related of the acquisition of CBCC, as mentioned in Note 5b.
Of the total customer base in 2014, the fair value assigned to commercial relationships with Telefónica at the acquisition dateamounts to 186 million U.S. dollars, while the remaining amount relates to other customers. In terms of geographic distribution, thecustomer base corresponds to businesses in Brazil (143 million U.S. dollars), Spain (54 million U.S. dollars), Mexico (64 million U.S.dollars), Peru (18 million U.S. dollars), Colombia (4 million U.S. dollars), Chile (10 million U.S. dollars) and Argentina and Uruguay(7 million U.S. dollars).

37
“Other intangible assets” includes the intangible asset arising from the 11822 and 11825 directory services business, the“Atento” brand, and the domain names related therewith, as well as the intangible asset related with the customer analysis service forseveral Telefónica Group companies in Latin America.
Development costs capitalized in 2014 were mainly related to in-house software development. No research and developmentexpenses were recognized in the 2013 and 2014 income statement.
No impairment was recognized in respect of intangible assets in 2013, and Atento Group recognized 27.1 million U.S. dollars incustomer base costs in 2014 (Note 8).
7) GOODWILL
Goodwill was generated on December 1, 2012 from by the acquisition of the Customer Relationship Management (“CRM”)business from Telefónica, S.A. In December 30, 2014 an additional goodwill was generated from the acquisition of CBCC, a callcenter services provider in Brazil by Atento Brasil S.A., as described in Note 5.
The breakdown and changes in goodwill by cash generating units in 2013 and 2014 are as follow:
Thousands of U.S. dollars
12/31/2012Translationdifferences 12/31/2013
Acquisitionsof newentities
(Note 5b)Translationdifferences
Impairment(Note 8) 12/31/2014
Peru 37,467 (3,282) 34,185 - (1,385) - 32,800Chile 23,947 (2,037) 21,910 - (2,967) - 18,943Colombia 10,551 (870) 9,681 - (1,877) - 7,804Czech Republic 3,962 (165) 3,797 - (45) (3,752) -Mexico 2,842 (26) 2,816 - (316) - 2,500Spain 1,111 50 1,161 - (12) (1,149) -Brazil 89,325 (11,405) 77,920 4,061 (9,200) - 72,781Argentina 61,348 (15,079) 46,269 - (11,626) - 34,643Total 230,553 (32,814) 197,739 4,061 (27,428) (4,901) 169,471
Details of goodwill in local currency are as follow (in thousands of currency units):
Bain CapitalAcquisition
CBCCAcquisition Total
Peru Nuevo Sol 97,714 - 97,714Chile Peso 11,493,730 - 11,493,730Colombia Peso 18,654,963 - 18,654,963Mexico Peso 36,847 - 36,847Brazil Real 182,536 10,786 193,322Argentina Peso 294,178 - 294,178
No impairment was recognized in 2013. At December 31, 2014, 3.8 million U.S dollars was recognized in the Czech Republicand 1.1 million U.S. dollars in Spain (Note 8).
8) IMPAIRMENT OF ASSETS
With respect to IAS 36, as at December 31, 2014 the judgments and estimates used by the Atento Group’s directors to calculatethe recoverable amount of goodwill indicate that the carrying amount of each item of goodwill is recoverable at year end, based on theexpected future cash flow from the cash-generating units to which they are allocated. The level of analysis performed by the AtentoGroup at the cash-generating unit level coincides with that performed at a country level.
Atento has no assets with indefinite useful lives, and therefore carries out no impairment tests of this type.
The Atento Group carries out its goodwill impairment tests using the various cash-generating units’ five-year strategic plans andbudgets, approved by Management.

38
Cash flow is estimated using projected results before amortization/depreciation, finance costs, and taxes, based on the lastperiod, and using the expected growth rates obtained from studies published in the sector and assuming said growth to be constantfrom the fifth year. Estimated cash flow determined in this manner is discounted using the WACC. The discount rates used reflect thecurrent assessment of specific market risks in each of the cash-generating units, considering the time value of money and individualcountry risks not included in the cash flow estimates. WACC takes both the cost of debt and capital into account. The latter is obtainedbased on the profit expected by the shareholders of the Atento Group, while the former is obtained based on the Atento Group’sfinancing costs. In addition, the risks specific to each country were included in the WACC using corrective factors.
These tests are performed annually and whenever it is considered that the recoverable amount of goodwill may be impaired.
In May 2014, the Master Service Agreement (“MSA”) with Telefónica, which required the Telefónica Group companies to meetpre-agreed minimum annual revenue commitments to us through 2021, was amended to adjust these minimum revenue commitmentsin relation to Spain and Morocco, to reflect the expected lower level of activities in these territories. The provisions of the MSArequired Telefónica to compensate the Company in case of shortfalls in these revenue commitments. As such, Telefónica agreed tocompensate the Company with a non-cash penalty fee amounting to €25.4 million (equivalent to 35.1 million U.S. Dollars for the yearended December 31, 2014). This non-cash compensation was recorded in the consolidated income statement for the year endedDecember 31, 2014 as other gains. The Company, in turn, used this amount to partially reduce and compensate the Vendor Loan Noteto Telefónica which was paid off in 2014 (see Note 16).
Since the amendment to the MSA significantly affected the amount of expected revenue, this was considered as a triggeringevent for the purpose of evaluating the recoverable amount of the intangible assets recorded in relation to the MSA (as described inNote 5). Therefore, also considering the changes in expected revenue in other geographies, as at June 30, 2014 (second quarter)management performed an impairment test on the carrying amounts of customer relationship intangible assets, goodwill and property,plant and equipment using assumptions revised in accordance with the amendments to the MSA and with updated managementexpectations on cash flow generation from the different territories in which the company operates. The result of the testing performedwas an impairment charge of 27,965 thousand U.S. dollars as at June 30, 2014 (27,375 thousand U.S. dollars as at December 31,2014) of the intangible assets related to the customer relationships with Telefónica in connection with the MSA, an impairment chargeof 3,752 thousand U.S. dollars of goodwill in the Czech Republic and of 1,149 thousand U.S. dollars of goodwill in Spain, which havebeen recorded in the consolidated income statement as impairment charges.
At December 31, 2013 and 2014, the tests conducted did not reveal any impairment in the value of goodwill, since the relatedcash flows were in all cases higher than the carrying amount of the related cash-generating units, even after sensitivities were appliedto the variables used, except for 3.8 million U.S. dollars in Czech Republic and 1,1 million U.S. dollars in Spain.
The pre-tax discount rates, which factor in country and business risks, and the projected growth rates were as follow:
Discount rate
Brazil Mexico Spain Colombia Peru Chile ArgentinaDecember 2013 16.53% 12.21% 10.38% 12.50% 11.37% 11.27% 31.77%December 2014 17.96% 12.04% 9.20% 12.50% 11.71% 11.08% 42.25%
Growth rate
Brazil Mexico Spain Colombia Peru Chile ArgentinaDecember 2013 5.50% 3.10% 1.85% 3.00% 2.50% 3.00% 16.83%December 2014 5.80% 3.50% 0.95% 3.00% 2.70% 3.00% 23.35%

39
In the event of a 10% increase in the discount rate used to calculate the recoverable amount of the CGUs in each country, withthe other variables remaining unchanged, the recoverable amount would still be higher than the corresponding carrying amount.Management also considers that the appearance of potential competitors in the market in which the Atento Group operates couldnegatively affect the growth of its CGUs. In the event of a 10% decrease in the growth rate used to calculate the recoverable amountof the CGUs in each country, with all other variables remaining unchanged, the recoverable amount would also be higher than thecorresponding carrying amount. In addition, if as a result of a fall in demand or an increase in costs, results beforeamortization/depreciation, finance cost and taxes margin (EBITDA margin) used for estimating cash flow were to decrease by 1% ineach country, with all other variables remaining unchanged, the recoverable amount from each cash-generating unit would continue tobe higher than its corresponding carrying amount.
In addition to the above, specifically for certain countries, the following hypotheses were used:
For the Argentina CGU, the cash flow growth rate used was based on the country’s estimated inflation. In order to calculate theterminal value, a normalized conservative growth rate was assumed, taking into account a long term stabilization of macroeconomicvariables. Cash flow for the Brazil and Mexico CGUs were estimated based on growth projections considering past businessperformance, using predicted inflation levels taken from external sources. For calculations regarding the Spanish CGU, negative andpositive business forecasts were used which contemplate macroeconomic trends and changes in the environment.
As a result of amendments to IFRS 13, IAS 36 was modified to require disclosure of the recoverable amount of CGUs withcarrying amounts which were significant to the entity’s total carrying amount of goodwill. However, in May 2013 IAS 36 wasamended in order to eliminate this disclosures requirement. Recoverable amount disclosures will still be required for CGUs that havepresented impairment losses during the year. The amendment is effective for periods beginning on or after January 1, 2014, althoughearly adoption is allowed. The Atento Group has adopted the amendment in 2013 in advance of its effective date.
9) PROPERTY, PLANT AND EQUIPMENT (PP&E)
Details of property, plant and equipment at December 31, 2013 and 2014 and movements therein are as follow:
Thousands of U.S. dollarsBalance at
Additions Disposals Transfers
Balance atDecember 31, Translation December 31,
2012 differences 2013Costs Land and natural resources 44 - - - 2 46 Buildings 8,843 93 (121) 1,378 557 10,750 Plant and machinery 7,060 1,150 - 581 (380) 8,411 Furniture, tools and other tangible assets 204,698 68,505 (22,168) 4,685 (16,509) 239,211 PP&E under construction 8,261 19,346 - (6,644) (1,922) 19,041Total property, plant and equipment 228,906 89,094 (22,289) - (18,252) 277,459Accumulated depreciation Buildings (149) (1,921) - - (77) (2,147) Plant and machinery (250) (2,623) - - (24) (2,897) Furniture, tools and other tangible assets (4,045) (53,751) 17,168 - (184) (40,812)Total accumulated depreciation (4,444) (58,295) 17,168 - (285) (45,856)Net property, plant and equipment 224,462 30,799 (5,121) - (18,537) 231,603
Thousands of U.S. dollars
Balance atDecember 31,
2013 Additions
Acquisitionof newentities
(Note 5b) Disposals TransfersTransalationdifferences
Balance atDecember 31,
2014Cost Land and natural resources 46 - - - - (4) 42 Buildings 10,750 - - - 1,437 (1,365) 10,822 Plant and machinery 8,411 2,051 - (254) 121 (748) 9,581 Furniture, tools and other tangible assets 239,211 82,829 2,598 (8,973) 4,786 (37,975) 282,476 PP&E under construction 19,041 10,240 - - (4,905) (3,031) 21,345Total property, plant and equipment 277,459 95,120 2,598 (9,227) 1,439 (43,123) 324,266Accumulated depreciation Buildings (2,147) (661) - - (1,439) 428 (3,819)

40
Plant and machinery (2,897) (1,093) - 117 2 336 (3,535) Furniture, tools and other tangible assets (40,812) (57,247) - 6,949 (2) 11,396 (79,716)Total accumulated depreciation (45,856) (59,001) - 7,066 (1,439) 12,160 (87,070)Net property, plant and equipment 231,603 36,119 2,598 (2,161) - (30,963) 237,196
Additions for the year mainly represent investments made in Brazil in response to the growth of the business and the upgradingof existing infrastructure (60,226 thousand U.S. dollars), construction of a new call center and upgrading of the infrastructure in placein Mexico (10,572 thousand U.S. dollars), investment in the expansion of structure in Central America (8,680 thousand U.S. dollars),equipment acquired under finance leases in Colombia and upgrading of the infrastructure in that country (4,943 thousand U.S.dollars); to new equipment under finance leases and upgrading of the current infrastructure in Peru (4,432 thousand U.S. dollars); andupgrading of the infrastructure in Spain (2,223 thousand U.S. dollars).
“Furniture, tools and other tangible assets” primarily comprises net items of that description in Spain, Mexico and Brazilamounting to 11,145 thousand U.S. dollars, 21,193 thousand U.S. dollars and 129,415 thousand U.S. dollars, respectively (16,335thousand U.S. dollars, 22,303 thousand U.S. dollars and 119,298 thousand U.S. dollars, respectively in 2013) in connection withfurnishings and fixtures in customer service centers in those countries.
The acquisition of new entities recognized in the account “Furniture, tools and other tangible assets” is related to the CBCCacquisition, as described in Note 5b.
Property, plant and equipment totaled 237,196 thousand U.S. dollars at December 31, 2014 (231,603 thousand U.S. dollars atDecember 31, 2013) and are primarily on site in Mexico and Brazil (23,527 thousand U.S. dollars and 149,039 thousand U.S. dollars,respectively at December 31, 2014; 24,934 thousand U.S. dollars and 137,161 thousand U.S. dollars, respectively at December 31,2013).
All Atento Group companies have contracted insurance policies to cover potential risks to their items of PP&E. The directors ofthe Parent Company considered that coverage of these risks was sufficient at December 31, 2013 and 2014.
No impairment was recognized in respect of items of property, plant and equipment in 2013 or 2014.
No interest expense was capitalized in 2013 or 2014 in respect of these assets.
As at December 31, 2013 and 2014 there were no firm commitments to acquire items of PP&E.
10) LEASES AND SIMILAR ARRANGEMENTS
a) Finance leases
The Atento Group holds the following assets under finance leases:
Thousands of U.S. dollars12/31/2013 12/31/2014
Net carrying amountof asset
Net carrying amountof asset
Finance leasesFurniture, tools and other tangible assets 9,392 7,714Software 38 -
Total 9,430 7,714
The assets acquired under finance leases are located in Brazil, Uruguay, Colombia and Peru.

41
The present value of future finance lease payments is as follow:
Thousands of U.S. dollars2013 2014
Up to 1 year (Note 17) 5,341 4,747Between 1 and 5 years (Note 17) 6,536 4,263
Total 11,877 9,010
11) FINANCIAL ASSETS
Details of financial assets at December 31, 2013 and 2014 are as follow:
Thousands of U.S. dollars
2013Loans andreceivables Derivatives Total
Trade and other receivables (Note 13) 72 - 72Other financial assets (Note 12) 53,812 - 53,812Derivative financial instruments (Note 14) - 15,439 15,439Non-current financial assets 53,884 15,439 69,323Trade and other receivables (Note 13) (*) 516,960 - 516,960Other financial assets (Note 12) 1,425 - 1,425Derivative financial instruments (Note 14) - 2,857 2,857Cash and cash equivalents (Note 15) 213,491 - 213,491Current financial assets 731,876 2,857 734,733TOTAL FINANCIAL ASSETS 785,760 18,296 804,056
(*) Excluding prepayments.
Thousands of U.S. dollars
2014Loans andreceivables Derivatives Total
Trade and other receivables (Note 13) 10,503 - 10,503Other financial assets (Note 12) 44,639 - 44,639Derivative financial instruments (Note 14) - 32,265 32,265Non-current financial assets 55,142 32,265 87,407Trade and other receivables (Note 13) (*) 447,683 - 447,683Other financial assets (Note 12) 28,562 - 28,562Cash and cash equivalents (Note 15) 211,440 - 211,440Current financial assets 687,685 - 687,685TOTAL FINANCIAL ASSETS 742,827 32,265 775,092
(*) Excluding prepayments.
The carrying amount is similar to the fair value.
Credit risk arises from the possibility that the Atento Group might not recover its financial assets at the amounts recognized andin the established terms. Atento Group Management considers that the carrying amount of financial assets is similar to the fair value.
In December, the following factoring agreements without recourse were entered into, and as a consequence of this, the relatedtrade receivables were written off:
As at December 31, 2014, Atento Teleservicios España S.A., Atento Chile S.A., Atento Brasil S.A. and Teleatento del PerúS.A.C. entered into factoring agreements without recourse, whose anticipated value was 65.1 million U.S. dollars, and as aconsequence of this, the related trade receivables were written off.
12) OTHER FINANCIAL ASSETS

42
Details of other financial assets at December 31, 2013 and 2014 are as follow:
Thousands of U.S. dollars12/31/2013 12/31/2014
Other non-current receivables 2,428 5Non-current guarantees and deposits 51,384 44,634Total non-current 53,812 44,639Other current receivables - 27,782Current guarantees and deposits 1,425 780Total current 1,425 28,562Total 55,237 73,201
“Guarantees and deposits” at December 31, 2013 and 2014 primarily comprise deposits with the courts in relation to legaldisputes with employees of the subsidiary Atento Brasil, S.A. and for litigation underway with the Brazilian social security authority(Instituto Nacional do Seguro Social).
“Other current receivables” as at December 31, 2014 are comprised of 27,782 thousand U.S. dollars representing U.S. dollarshort term financial investments held by the subsidiary Atento Brasil, S.A. These short term financial investments represent exportcredit notes with a maturity greater than 90 days. Upon maturity the Company will receive Brazilian Reais based on the U.S. dollar –Brazilian Reais foreign exchange rate at the maturity date.
13) TRADE AND OTHER RECEIVABLES
Details of trade and other receivables are as follow:
Thousands of U.S. dollars12/31/2013 12/31/2014
Non-current trade receivables 72 10,503Total non-current 72 10,503Current trade receivables 492,900 424,395Other receivables 12,540 9,978Prepayments 4,326 3,711Personnel 11,520 13,310Total current 521,286 451,394Total 521,358 461,897
Thousands of U.S. dollars12/31/2013 12/31/2014
Trade receivables 502,986 440,244Impairment allowances (10,014) (5,346)Trade receivables, net 492,972 434,898
As at December 31, 2014 trade receivables not yet due for which no provision has been made amounted to 343,061 thousandU.S. dollars (422,086 thousand U.S. dollars as at December 31, 2013).
As at December 31, 2014 trade receivables due for which no provision has been made amounted to 91,837 thousand U.S. dollars(70,886 thousand U.S. dollars at December 31, 2013). These balances relate to certain independent customers with no recent history ofdefault. The aging analysis of these accounts is as follow:
Thousands of U.S. dollars
Less than 90 daysBetween 90 and
180 daysBetween 180 and
360 days Over 360 days Total12/31/2013 54,154 3,699 2,135 10,898 70,886

43
12/31/2014 79,320 8,833 2,145 1,538 91,837
Movements in the provision for impairment of trade receivables in 2014 were as follow:
Thousands of U.S. dollars2013 2014
Opening balance (17,270) (10,014)Allowance (3,496) (1,362)Reversal 5,522 3,027Application 4,212 793Translation differences 1,018 703Other - 1,507Closing balance (10,014) (5,346)
The Atento Group’s maximum exposure to credit risk at the reporting date is equivalent to the carrying amount of each of theaforementioned trade receivables categories. The Atento Group holds no guarantees as collection insurance.
14) DERIVATIVE FINANCIAL INSTRUMENTS
Details of derivative financial instruments at December 31, 2013 and 2014 are as follow:
Thousands of U.S. dollars12/31/2013 12/31/2014
Assets Liabilities Assets LiabilitiesInterest rate swaps - cash flow hedges 15,611 - 10,916 -Cross-currency swaps - cash flow hedge - (10,985) 3,837 -Cross-currency swaps - that do not meet the criteria forhedge accounting 2,685 (4,977) 17,512 (1,193)Total 18,296 (15,962) 32,265 (1,193)Non-current portion 15,439 (15,962) 32,265 (1,193)Current portion 2,857 - - -
Derivatives held for trading are classified as current assets or current liabilities. The fair value of a hedging derivative isclassified as a non-current asset or a non-current liability, as applicable, if the remaining maturity of the hedged item exceeds twelvemonths. Otherwise, it is classified as a current asset or liability.
The Atento Group has contracted interest rate swaps to hedge fluctuations in interest rates in respect of debentures issued inBrazil (see Note 17).
At December 31, 2014, the notional principal of the interest rate swaps amounts to 553 million Brazilian Reais (equivalent to208 million U.S. dollars). At December 31, 2013, the notional principal of the interest rate swaps amounts to 595 million Brazilianreais (equivalent to 254 million U.S. dollars).
During the year ended December 31, 2014 the average fixed interest rate was 13.2% (11.7% for the year ended at December2013). Floating interest rates are pegged to the CDI plus 3.70%.
The Atento Group has arranged cross-currency swap instruments to cover U.S. dollar payments arising from the senior securednotes issued in 2014 (see Note 17).
At December 31, 2014 details of cross-currency swaps that are designated and qualified as cash flow hedges were as follow:
Bank Date MaturityPurchasecurrency
Amountpurchased
(thousands)
Fixed ratebank
counterpartypayment
Sellingcurrency
Amountsold
(thousands)
Fixed rateAtento
payment SpotSantander 01/29/2013 01/29/2018 USD 738 7.3750% EUR 560 7.5450% 0.7588Santander 01/29/2018 01/29/2020 USD 922 7.3750% EUR 700 7.5450% 0.7592

44
Santander 01/29/2020 01/29/2020 USD 25,000 7.3750% EUR 18,560 7.5450% 0.7424Goldman Sachs 01/29/2013 01/28/2018 USD 48,000 7.3750% EUR 35,635 7.5450% 0.7424Goldman Sachs 01/29/2018 01/29/2020 USD 60,000 7.3750% EUR 44,543 7.5450% 0.7424Nomura 01/29/2013 01/28/2018 USD 22,000 7.3750% EUR 16,333 7.6050% 0.7424Nomura 01/29/2018 01/29/2020 USD 27,500 7.3750% EUR 20,416 7.6050% 0.7424
Gains and losses on swap hedges recognized in equity will be taken to the income statements up through the maturity of thecorresponding contracts as disclosed in the table above.
There were no ineffective hedge derivatives in 2013 and 2014.
The Atento Group also contracted the following cross currency swaps that are not designated and qualified as hedginginstruments:
Bank Date MaturityPurchasecurrency
Amountpurchased
(thousands)
Fixed ratebank
counterparty
paymentSelling
currencyAmount sold(thousands)
Fixed rateAtento
payment SpotSantander 01/29/2013 01/29/2018 USD 410 7.3750% MXN 9,144 12.9500% 22.302Santander 01/29/2018 01/29/2020 USD 615 7.3750% MXN 13,716 12.9500% 22.302Santander 01/29/2020 01/29/2020 USD 16,667 7.3750% MXN 211,833 12.9500% 12.71Goldman Sachs 01/29/2013 01/28/2018 USD 40,000 7.3750% MXN 508,400 12.9120% 12.71Goldman Sachs 01/29/2018 01/29/2020 USD 60,000 7.3750% MXN 762,600 12.9120% 12.71Nomura 01/29/2013 01/28/2018 USD 23,889 7.3750% MXN 303,628 12.9000% 12.71Nomura 01/29/2018 01/29/2020 USD 35,833 7.3750% MXN 455,442 12.9000% 12.71Goldman Sachs 01/29/2013 01/29/2018 USD 7,200 7.3750% COP 12,819,600 8.2150% 1780.5Goldman Sachs 01/29/2013 01/29/2018 USD 13,800 7.3750% PEN 35,356 7.7900% 2.562BBVA 01/29/2013 01/29/2018 USD 28,800 7.3750% COP 51,278,400 8.2160% 1780.5BBVA 01/29/2013 01/29/2018 USD 55,200 7.3750% PEN 141,422 7.7800% 2.625
During the year ended December 31,2014, variations in the fair value of derivative financial instruments that are not consideredas hedging derivatives recorded in the income statement amount to a net gain of 29,939 thousand U.S. dollars (a net loss of 5,470thousand U.S. dollar for the year ended December 31, 2013).
15) CASH AND CASH EQUIVALENTS
Thousands of U.S. dollars12/31/2013 12/31/2014
Cash and cash equivalents at banks 168,287 185,024Cash equivalents 45,204 26,416Total 213,491 211,440
As indicated in Note 25, the current accounts of some Group companies have been pledged in as guarantees.
“Cash equivalents” comprises short term fixed-income securities in Brazil, which mature in less than three months and accrueinterest pegged to the CDI.
16) FINANCIAL LIABILITIES
Details of financial liabilities at December 31, 2013 and 2014 are as follow:
Thousands of U.S. dollars
2013
Liabilities at fairvalue through profit
and loss Derivatives
Other financialliabilities at
amortized cost TotalDebentures and bonds (Note 17) - - 631,853 631,853

45
Interest-bearing debt (Note 17) - - 527 527Finance lease payables (Note 10) - - 6,536 6,536CVIs (Note 17) 43,367 - - 43,367Vendor Loans (Note 17) - - 151,701 151,701Payable to Group companies (Note 26) - - 519,607 519,607Derivative financial instruments (Note 14) - 15,962 - 15,962Trade and other payables (Note 18)(*) - - 1,033 1,033Non-current financial liabilities 43,367 15,962 1,311,257 1,370,586Debentures and bonds (Note 17) - - 11,682 11,682Interest-bearing debt (Note 17) - - 105 105Finance lease payables (Note 10) - - 5,341 5,341Trade and other payables (Note 18)(*) - - 269,789 269,789Current financial liabilities - - 286,917 286,917TOTAL FINANCIAL LIABILITIES 43,367 15,962 1,598,174 1,657,503
(*) Excluding deferred income and non-financial liabilities.
Thousands of U.S. dollars
2014
Liabilities at fair valuethrough profit and
loss Derivatives
Other financialliabilities at
amortized cost TotalDebentures and bonds (Note 17) - - 534,988 534,988Interest-bearing debt (Note 17) - - 60,919 60,919Finance lease payables (Note 10) - - 4,263 4,263CVIs (Note 17) 36,379 - - 36,379Derivative financial instruments (Note 14) - 1,193 - 1,193Trade and other payables (Note 18)(*) - - 560 560Non-current financial liabilities 36,379 1,193 600,730 638,302Debentures and bonds (Note 17) - - 11,213 11,213Interest-bearing debt (Note 17) - - 801 801Finance lease payables (Note 10) - - 4,747 4,747Trade and other payables (Note 18)(*) - - 255,558 255,558Current financial liabilities - - 272,319 272,319TOTAL FINANCIAL LIABILITIES 36,379 1,193 873,049 910,621
(*) Excluding deferred income and non-financial liabilities.
The maturity schedule for other financial liabilities, trade and other payables and liabilities at fair value through profit and lossat December 31, 2013 and 2014 are as follow:
2013
Thousands of U.S. dollarsMaturity (years)
2014 2015 2016 2017 2018More than
5 years TotalPayables to Group companies - - - - - 519,607 519,607Senior Secured Notes 9,342 - - - - 288,339 297,681Brazilian bonds — Debentures 2,340 27,518 57,804 69,365 80,926 107,901 345,854Finance leases 5,341 4,157 1,081 974 324 - 11,877Bank borrowing 105 393 134 - - - 632CVIs - - - - - 43,367 43,367Vendor Loans - - - - - 151,701 151,701Trade and other payables 269,789 1,033 - - - - 270,822Total financial liabilities 286,917 33,101 59,019 70,339 81,250 1,110,915 1,641,541

46
2014
Thousands of U.S. dollarsMaturity (years)
2015 2016 2017 2018 2019More than
5 years TotalSenior Secured Notes 9,342 - - - - 290,927 300,269Brazilian bonds—Debentures 1,871 16,538 61,126 71,313 95,084 - 245,932Finance leases 4,747 2,119 1,255 732 157 - 9,010Bank borrowing 801 12,789 15,199 15,199 15,199 2,533 61,720CVIs - - - - - 36,379 36,379Trade and other payables 255,558 560 - - - - 256,118Total financial liabilities 272,319 32,006 77,580 87,244 110,440 329,839 909,428
The Brazilian debentures contract established the following original repayment schedule:
2014 2015 2016 2017 2018 2019 Total
7.0% 11.0% 15.0% 18.0% 21.0% 28.0% 100.0%
As indicated in Note 17, the Brazilian subsidiary made three early repayments in 2014, totaling 68.9 million U.S. dollars(equivalent to 67.7 million U.S. dollars when converted by the average rate of December 2014). The new repayment schedule afterthose early repayments and over the initial amount of 915 million Brazilian Reais of Brazilian Debentures is as follow:
2015 2016 2017 2018 2019 Total
0% 4.8701% 18.0% 21.0% 28.0% 71.9%
17) INTEREST-BEARING DEBTDetails of interest-bearing debt at December 31, 2013 and 2014 are as follow:
Thousands of U.S. dollars12/31/2013 31/12/2014
Senior Secured Notes 288,339 290,927Brazilian bonds—Debentures 343,514 244,061Bank borrowing 527 60,919CVIs 43,367 36,379Vendor Loans 151,701 -Finance lease payables (Note 10) 6,536 4,263Sub-total of borrowing from third parties 833,984 636,549Payable to Group companies (Note 26) 519,607 -Total non-current 1,353,591 636,549Senior Secured Notes 9,342 9,342Brazilian bonds—Debentures 2,340 1,871Bank borrowing 105 801Finance lease payables (Note 10) 5,341 4,747Sub-total of borrowing from third parties 17,128 16,761Total current 17,128 16,761TOTAL INTEREST-BEARING DEBT 1,370,719 653,310
Issuance of bonds—Senior Secured Notes
On January 29, 2013 Atento Luxco 1, S.A. issued 300,000 Senior Secured Notes with a nominal value of 1,000 U.S. dollarseach, bearing interest at an annual rate of 7.375%. The bonds mature on January 29, 2020, and the issuer may redeem them early onJanuary 29, 2016, if certain conditions have been met.
Details of the senior secured notes issuances are as follow:

47
Issuer Issue dateNumber of
bonds Unit nominal valueAnnual
interest rate Maturity
Atento Luxco 1, S.A. January 29, 2013 300,000 1,000 U.S. dollars 7.375% January 29, 2020
All interest payments are made on a half-yearly basis.
The fair value of debt in relation to the issuance of senior secured notes, calculated on the basis of their quoted price atDecember 31, 2014, is 304,452 thousand U.S. dollars.
The fair value hierarchy of the senior secured notes is Level 1 as the fair value is based on the market price at the reporting date.
Details of the corresponding debt at each reporting date are as follow:
Thousands of U.S. dollars12/31/2013 12/31/2014
Maturity Currency PrincipalAccruedinterests Total debt Principal
Accruedinterests Total debt
2020 U.S. Dollar 288,339 9,342 297,681 290,927 9,342 300,269
Brazilian bonds—Debentures
On November 22, 2012 BC Brazilco Participações, S.A. (now merged with Atento Brasil, S.A.) issued preferential bonds inBrazil (the “Debentures”), which were subscribed by institutional investors (the “Debenture holders”) and assumed by Bain Capital,for an initial amount of 915,000 thousand Brazilian Reais (equivalent to 365,000 thousand U.S. dollars). This long term financialcommitment matures in 2019 and bears interest pegged to the Brazilian CDI (Interbank Deposit Certificate) rate plus 3.70%. Interestis paid on a half-yearly basis.
On March 25, 2013 and June 11, 2013 Atento Brasil, S.A. repaid, in advance of the scheduled date, 71,589 thousand BrazilianReais and 26,442 thousand Brazilian Reais respectively (equivalent to 35,545 thousand U.S. dollars and 12,287 thousand U.S. dollars,respectively).
On May 12, 2014 and June 26, 2014 Atento Brasil, S.A. repaid, in advance of the scheduled date, 34,358 thousand BrazilianReais and 45,000 thousand Brazilian Reais respectively (equivalent to 15,502 thousand U.S. dollars and 20,372 thousand U.S. dollarsrespectively using the exchange rate corresponding to the date of the transaction).
On August 28, 2014 Atento Brasil, S.A. repaid, in advance of the schedule date, 80,000 thousand Brazilian Reais (equivalent to33,058 thousands U.S. dollars).
Under the terms of the financing contract, the Brazilian subsidiary is subject to a financial covenant regarding the maximumdebt level at the end of each quarter. To date, the company has complied with this covenant and does not foresee any future non-compliance.
Details of the corresponding debt at each reporting date are as follow:
Thousands of U.S. dollars12/31/2013 12/31/2014
Maturity Currency PrincipalAccruedinterests Total debt Principal
Accruedinterests Total debt
2019 Brazilian Real 343,514 2,340 345,854 244,061 1,871 245,932
The carrying amount of debentures is similar to the fair value. The fair value is based on cash flow discounted and is classifiedin Level 2 of the fair value hierarchy.

48
Bank borrowing
Bank borrowings are held in the following currencies:
Thousands of U.S. dollars12/31/2013 12/31/2014
Foreigncurrency debt
U.S. Dollarsdebt
Foreigncurrency debt
U.S. Dollarsdebt
BRL - - 162,953 61,348MAD 5,170 632 3,413 372Total 632 61,720
The carrying amount of bank borrowing is similar to their fair value. The fair value is based on the cash flow discounted and iswithin Level 2 of the fair value hierarchy.
On February 3, 2014, Atento Brasil S.A. entered into a credit agreement with Banco Nacional de Desenvolvimento Econômico eSocial—BNDES (“BNDES”) in an aggregate principal amount of BRL 300 million (the “BNDES Credit Facility”), equivalent to 124million U.S. dollars. Once the debtor met certain requirements in the signed contract, the loan automatically became available to thedebtor. On March 27, 2014, BNDES disbursed BRL 56.6 million (equivalent to 21.3 million U.S. dollars as at December 31, 2014) ofthe total facility. On April 16, 2014, BNDES disbursed BRL 23.7 million (equivalent to 8.9 million U.S. dollars as at December 31,2014) of the total facility. On July 16, 2014, BNDES disbursed BRL 0.6 million (equivalent to 0.2 million U.S. dollars as at December31, 2014) of the facility. On August 13, 2014, BNDES disbursed BRL 80.6 million (equivalent to 30.3 million U.S. dollars as atDecember 31, 2014) of the facility. As at December 31, 2014, the total amount of BNDES disbursed was 68.8 million U.S. dollarswhen converted by the average rate of December 2014. As at December 31, 2014, the accrued interest amounted to BRL 1.6 million(equivalent to 0.6 million U.S. dollars).
The total amount of the BNDES Credit Facility is divided into five tranches in the following amounts and subject to thefollowing interest rates:
Amount of EachTranche Interest Rate
Tranche A BRL 182,330,000.00 Long Term Interest Rate (Taxa de Juros de Longo Prazo — TJLP) plus 2.5% perannum
Tranche B BRL 45,583,000.00 SELIC Rate plus 2.5% per annumTranche C BRL 64,704,000.00 4.0% per yearTranche D BRL 5,296,000.00 6.0% per yearTranche E BRL 2,048,000.00 Long Term Interest Rate (Taxa de Juros de Longo Prazo — TJLP)
The BNDES Credit Facility is to be repaid in 48 monthly installments. The first payment will be due on March 15, 2016 and thelast payment will be due on February 15, 2020.
The BNDES Credit Facility contains covenants that restrict Atento Brasil S.A.’s ability to transfer, assign, charge or sell theintellectual property rights related to technology and products developed by Atento Brasil S.A. with the proceeds from the BNDESCredit Facility. As at December 31, 2014, we were in compliance with these covenants. The BNDES Credit Facility does not containany other financial maintenance covenants.
The BNDES Credit Facility contains customary events of default including the following: (i) reduction of the number of theemployees of Atento Brasil S.A. without providing a program support for outplacement, such as training, job seeking assistance andobtaining pre-approval of BNDES, (ii) existence of unfavorable court decision against the Company for the use of children asworkforce, slavery or for any environmental crimes, and (iii) inclusion in the by-laws of Atento Brasil S.A. of any provision thatrestricts Atento Brasil S.A.’s ability to pay its obligations under the BNDES Credit Facility.
On January 28, 2013 Atento Luxco 1, S.A., Atento Teleservicios España, S.A.U. and Atento Mexicana, S.A. de C.V. (nowmerged within Atento Mexico Holdco, S. de R.L. de C.V. and as from July 21st, 2014) contracted a multi-currency revolving facility(“Super Senior Revolving Credit Facility”) at an amount of 50 million euros (equivalent to 60.7 million U.S. dollars as at December31, 2014).

49
The new revolving facility allows for drawdowns in Euros, Mexican pesos and U.S. dollars. The interest rates for Eurodrawdowns and Mexican Pesos drawdowns are the EURIBOR and the TIIE, respectively, and the LIBOR for drawdowns in any othercurrency, plus a 4.5% spread per year. This spread is subject to a step-down based on the debt ratio calculations.
The revolving facility matures on July 28, 2019. As at December 31, 2014 and December 31, 2013 no amounts had been drawdown on the revolving facility.
As at June 28, 2011, Atento Maroc, S.A. arranged a loan with Banco Sabadell for an amount of 21.2 million Moroccan Dirhamsmaturing on June 28, 2016 with an annual rate of interest of 6%. As at December 31, 2014, the principal loan balance was 3.4 millionDirhams (0.4 million U.S. dollars) (5.2 million Dirhams and 0.6 million U.S. dollars as at December 31, 2013).
Contingent Value Instruments
In relation to the acquisition described in Notes 1 and 5, two of the Company’s subholdings, Atalaya Luxco 2, S.à.r.l. (formerlyBC Luxco 2, S.à.r.l.) and Atalaya Luxco 3, S.à.r.l. (formerly BC Luxco 3, S.à.r.l.), which held stakes in the Atento Group’sArgentinian subsidiaries, issued a CVI with the counterparties Atento Inversiones y Teleservicios, S.A. and Venturini S.A., aTelefónica subsidiary. The CVIs together have an aggregated nominal value of 666.8 million Argentinian Pesos.
The CVIs represent preferential debt of Atalaya Luxco 2 and Atalaya Luxco 3, and are subject to mandatory (partial) repaymentin the following scenarios: (i) if the Argentinian subsidiaries maintain an excess-distributable cash balance, calculated as the greater ofthe sum of 30.3 million Argentinian Pesos (adjusted for inflation) or the sum that must be maintained by the subsidiaries to honor theirfinancial obligations in each year, pursuant to their business plans; (ii) sale of all or substantially all of the shares of the Argentiniansubsidiaries in respect of which the cash proceeds are distributed to Atalaya Luxco 2 and Atalaya Luxco 3; (iii) sale of the AtentoGroup whereby a portion of the price is allocated to the Argentinian subsidiaries, and (iv) payment of dividends by the Argentiniansubsidiaries.
The aforementioned instrument will be extinguished at the date on which the principal amount and interest pending paymentshow a zero balance (in respect of the repayment of outstanding debt or a reduction of the outstanding balance pursuant to the termsand conditions of the CVIs). Without prejudice to the above, the conditions of the CVIs stipulate that on October 12, 2022 the balanceof this debt will be reduced to zero. Moreover, the principal amount pending payment must be reduced by the aggregate amount of anydamages that may be incurred by the Argentinian subsidiaries as the result of noncompliance with the clauses stipulated in thepurchase contract between Bain Capital and Telefonica. The CVIs do not bear interest and are recognized at fair value. During theterm of the CVIs, holders have preferential purchase rights in the event that the Argentinian subsidiaries are sold.
Vendor Loans
On December 12, 2012, Midco issued the Vendor Loan Note at an aggregate principal amount of €110.0 million (equivalent ofapproximately 143 million U.S. dollars) to an affiliate of Telefónica. The Vendor Loan Note had a scheduled maturity ofDecember 12, 2022. Interest on the Vendor Loan Note accrued at a fixed rate of 5.0% per annum, and was payable annually in arrears.Interest on the Vendor Loan Note was payable in cash, if: (i) no default (or similar event) is ongoing or would arise under anyfinancing documents of the Company, as defined in the agreement governing the Vendor Loan Note, as a result of such interestpayment or any distribution or payment by a subsidiary to Midco to enable Midco to make the interest payment, and (ii) the Companyis able to lawfully upstream funds to Midco. Any interest that was not payable in cash was capitalized and added to the outstandingprincipal amount outstanding under the Vendor Loan Note. Interest was payable in cash only to the extent that the borrower hasreceived upstream payments from its subsidiaries in excess of the lesser of: (A) the expenses incurred during such interest period inconnection with the operation of the Company plus management and advisory fees paid to Bain Capital Partners, LLC or(B) €35.0 million (increased by 3% for each subsequent interest period on a compounding basis). Additionally, following the sale of atleast 66.66% of the business and assets of the Company, Midco shall be required to use the proceeds from such a sale to repay theVendor Loan Note, subject to items (i) and (ii) above. The Vendor Loan Note did not contain any other financial maintenancecovenants.
On May 16, 2014, Midco entered into an amendment letter and certain other related documentation with the VLN Lender whichprovided for certain amendments to be made to the Vendor Loan Note including, among others, changes reducing the principalamount of the Vendor Loan Note by €25.4 million (equivalent to $33.7 million for the period ended December 31, 2014). In addition,a portion of the total principal amount outstanding under the Vendor Loan Note was also reduced during the period ended December31, 2014 by the proceeds of the issuance of the PIK Notes in 2020.

50
In addition, in May 30, 2014 Atalaya Luxco Midco issued €64 million of PECs (equivalent to 87 million U.S. dollars) whichproceeds were applied to make a partial prepayment of the Vendor Loan Note.
On October 7, 2014, Midco prepaid to Telefónica the entire amount outstanding under the Vendor Loan Note for a total amountof €23.3 million (approximately $29.5 million). Consequently, as at December 31, 2014, there is no Vendor Loan outstanding balance.
18) TRADE AND OTHER NON-TRADE PAYABLES
Details of trade and other payables at December 31, 2013 and 2014 are as follow:
Thousands of U.S. dollars12/31/2013 12/31/2014
Other payables 1,033 560Deferred income 408 401Total non-current 1,441 961Suppliers 109,635 104,004Advances 262 1,762Suppliers of fixed assets 29,500 31,736Personnel 124,795 111,154Other payables 5,597 6,904Deferred income 859 2,133Total current 270,648 257,693Total current and non-current 272,089 258,654
The carrying amount of trade and other non-trade payables is similar to the fair value, as the impact of discounting is notsignificant.
19) EQUITY ATTRIBUTABLE TO THE EQUITY HOLDERS OF THE PARENT
Share capital
As described in Note 1b, following the Reorganization Transaction and the IPO, the financial statements present before March5, 2014 (date of incorporation of Atento S.A.) the consolidated results of Midco’s operations. The consolidated financial statements ofMidco are substantially the same as the consolidated financial statements of the Atento S.A. prior to the IPO, as adjusted for theReorganization Transaction. Thus, the Reorganization Transaction was retroactively reflected in Atento’s earnings per sharecalculations.
As at December 31, 2014 share capital stood at 48 thousand U.S. dollars, divided into 73,619,511 shares. PikCo owns 85.1% ofordinary shares of Atento S.A.
Share premium
The share premium refers to the difference between the subscription price that the shareholders paid for the shares and theirnominal value. Since this is a capital reserve, it can only be used to increase capital, offset losses, redeem, reimburse or repurchaseshares.
Legal reserve
According to commercial legislation in Luxembourg, Atento S.A. must transfer 5% of its profits for the year to a legal a reserveuntil the reserve reaches 10% of share capital. The legal reserve cannot be distributed.
At December 31, 2013 and 2014, no legal reserve had been established, mainly due to the losses incurred by Atento S.A.

51
Retained earnings
Movements in retained earnings during 2013 and 2014 are as follow:
Thousands of U.S. dollarsAt December 31, 2012 (56,620)
Loss for 2013 (4,039)At December 31, 2013 (60,659)
Loss for 2014 (42,152)At December 31, 2014 (102,811)
Translation differences
Translation differences reflect the differences arising on account of exchange rate fluctuations when converting the net assets offully consolidated foreign companies from local currency into Atento Group’s presentation currency (U.S. dollars) by the fullconsolidation method.
Share-based payments
a) Description of share-based payment arrangements
At December 31 2014, selected employees of Atento S.A. (directors, officers and other employees) had the following two share-based payment arrangements for the employees of its subsidiaries:
1. Time Restricted Stock Units (“RSU”) (equity settled)
• Grant date: December 3, 2014
• Amount: 256,134 RSUs
• Vesting period: 50% vests on October 1, 2015 and the remaining 50% vests on October 1, 2016.
• There are no other vesting conditions.
2. Performance RSU (equity settled)
• Grant date: December 3, 2014
• Amount: 931,189 RSUs
• Vesting period: 100% of the RSUs vest on October 1, 2017.
• Performance-based vesting conditions:
• TSR Tranche: 50% of the RSUs shall satisfy the performance-vesting condition, if at all, based on the TotalShareholder Return (“TSR”) thresholds set forth, and measured from October 1, 2014 through the end of thefinancial quarter immediately preceding October 1, 2017; provided, that the baseline price for purposes ofmeasuring the TSR compound annual growth will be $15.00. The thresholds are as follow:
• Below 10% compound annual growth: nil RSUs vest;
• 10 % compound annual growth: 25% of the RSUs vest;
• 22% compound annual growth: 100% of the RSUs vest; and
• Compound annual growth between 10% and 22%: RSUs vest based on a linear relationship
• Adjusted EBITDA Tranche: The remaining 50% of the RSUs shall satisfy the performance vesting condition, if atall, based on the Adjusted EBITDA thresholds set forth; provided, that for purposes of measuring the AdjustedEBITDA Tranche, the Performance Period shall include the time period between end of the financial quarterimmediately preceding October 1, 2014 through the end of the financial quarter immediately preceding October 1,2017. The thresholds are as follow:
• Below 8% compound annual growth: nil RSUs vest;
• 8% compound annual growth: 25% of the RSUs vest;

52
• 13.5% compound annual growth: 100% of the RSUs vest; and
• Compound annual growth between 8% and 13.5%: RSUs vest based on a linear relationship.
The TSR Tranche and the Adjusted EBITDA Tranche are treated separately. Thus, for example, even if the TSR threshold is notmet, provided the Adjusted EBITDA threshold is met, PRSUs will vest.
b) Measurement of fair value
The fair value of the RSUs for both arrangements has been measured using the Black-Scholes model. Service and non-marketperformance conditions attached to the arrangement were not taken into account in measuring the fair value. The inputs used in themeasurement of the fair values at the grant date are presented here below.
Time RSU Performance RSUTimeRSU
TimeRSU
Adj.EBITDA
TSR1
TSR2 Comments
Variable
Stock price (USD) 11.06 11.06 11.06 11.06 11.06Stock price of Atento S.A. in USD at grant date December3, 2014
Strike price (USD) 0.01 0.01 0.01 19.97 27.74 Value close to nil will be paidTime (years) 1 2 3 3 3 Time to vest as per the contractRisk free rate 0.18% 0.57% 1.04% 1.04% 1.04% USD risk free rate obtained from Bloomberg
Expected volatility 4.11% 4.11% 4.11% 4.11% 4.11%
Assumption is made to base volatility on the averagevolatility of main competitors because Atento S.A. itself islisted in October 2014
Dividend yield 2.00% 2.00% 2.00% 2.00% 2.00%
Assumption is made to set dividend yield at 2% because 1)there will be a limited ability to pay dividends in the nearterm and 2) it is in line with the dividend yield of the maincompetitors
Value RSU in USD 10.83 10.62 10.41 - -
The Time RSU has been split into two options for valuation purposes to reflect correctly the fact that 50% of the Time RSUsvests on October 1, 2016 and the remaining 50% will vest on October 1, 2017.
The Performance RSU has one market condition which needs to be taken into account when determining the grant date fairvalue. Two scenarios have been used to determine this fair value. For scenario “TSR 1” a compound annual growth of 10% was used;and for scenario “TSR 2” a compound annual growth rate of 22%. Given the base line price of USD15.00 (which was the openingprice when Atento went to the stock exchange), a current stock price of USD 11.06 and a low expected volatility, it is unlikely that thePRSUs of the TSR Tranche will vest. This results in a low valuation.
The Adjusted EBITDA Tranche is not included in the fair value condition as this tranche has a non-market performancecondition.
c) Outstanding RSUs
Movement in the number of RSUs has been nil since the grant date as shown in the table below. Holders of the RSUs willreceive the shares of Atento S.A. without having to make a payment once the RSUs vest.
Management has made the following assumptions regarding the service and non-market performance conditions:
• At the start of the plan, the expectation was that 100% of the holders of both the RSUs will meet the service conditions of2 and 3 years.
• For the second year, it is expected that 80% of the holders of the Time RSUs will meet the service condition of two years.
• For the second and third year, it is expected that 80% of the holders of the Performance RSUs will meet the servicecondition for three years.
• Finally, there is an 80% probability that the Adjusted EBITDA targets will be met.
A reference is made to the accounting policy regarding these share-based payments.
An overview of the current RSUs that are outstanding is given in the table below:

53
Balance as at December 3,2014
Number ofRSUs
Weighted average of RSUsgranted Vesting date
Time RSUs granted 256,134 USD 10.7250% vests October 1, 2015, 50% vests
October 1, 2016Performance RSU granted 931,189 USD 10.41 100% vests October 1, 2017Time/Performance RSUs vested -Time/Performance RSUscancelled -Balance as at December 31,2014Time RSUs granted 256,134Performance RSU granted 931,189
The RSUs have been shared with the subsidiaries as follow:
Country Time RSU Performance RSUArgentina 13,881 20,600Brasil 102,267 312,236Chile 9,849 48,345Spain 49,269 136,539France 4,120 3,845Guatemala 2,047 1,911Mexico 51,195 112,446Morocco 2,937 2,742Peru 5,204 8,096United States 15,365 284,429Total 256,134 931,189
d) Expense recognized in Profit or Loss
In 2014, 584 thousand U.S. dollars related to stock-based compensation are recorded as employee benefit expenses.
20) TAX MATTERS
a) Income tax
The reconciliation between the income tax expense that would result in applying the statutory tax rate and the income taxexpense recorded is as follow:
Thousand of U.S. dollarsFor the year ended December 31,
2013 2014Profit/(loss) before tax 4,307 (23,619)Income tax applying the statutory tax rate 1,259 (6,901)Permanent differences 17,291 12,026Adjustments due to international tax rates (12,538) 4,584Tax credits (92) (295)Branches Income Tax 2,409 2,544Reduction of the domestic federal statutory rate - 6,554Other 17 21Total income tax expense 8,346 18,533

54
Permanent differences in 2013 are mainly due to provisions in Brazil which are not deductible for tax purposes. Permanentdifferences in 2014 are mainly due to provisions in Brazil, Peru and Colombia, which are not deductible for tax purposes, and as aconsequence of the liquidation of the Peruvian branch, which required Spain to writte off its existing tax credits related to the branch.
The breakdown of the Atento Group’s income tax expense is as follow:
Thousands of U.S. dollarsFor the year ended December 31,
2013 2014Current tax expense 23,953 33,814Deferred tax (11,372) (15,669)Adjustment to prior years (4,235) 388Total income tax expense 8,346 18,533
The effective tax rate on Atento Group’s consolidated earnings in 2013 was 193.79%. This rate is distorted because of thecontribution of losses in the holding companies comprising the Group to Atento’s pre-tax result. Stripping out this effect, the pre-taxprofit would have stood at 111,272 thousand U.S. dollars, with an income tax expense of 33,378 thousand U.S. dollars. Consequently,the aggregate rate excluding the Group’s holding companies is 30%, in line with reasonable parameters for a comparable group.
The effective tax rate on Atento Group’s consolidated earnings in 2014 was (78.47%). This rate is distorted because of thecontribution of losses in the holding companies comprising the Group to Atento’s pre-tax result, and the tax effect of the impairmentdescribed in Note 7. Stripping out this effect, the pre-tax profit would have stood at 124,809 thousand U.S. dollars, with an income taxexpense of 51,984 thousand U.S. dollars. Consequently, the aggregate rate excluding the Group’s holding companies is 41.65%.
The years open for inspection by the tax authorities for the main taxes applicable vary from one consolidated company toanother, based on each country’s tax legislation, taking into account their respective statute of limitations periods. The directors of theAtento Group consider that no significant contingencies would arise from a review by the tax authorities of the operations in the yearsopen to inspection, other than those described in Note 21.
b) Deferred tax assets and liabilities
The breakdown and balances of deferred tax assets and deferred tax liabilities at December 31, 2013 and 2014 are as follow:
Thousand U.S. dollarsBalance at12/31/2012
Results EquityTransfers
Translationdifferences
Balance at12/31/2013Increases Decreases Increases Decreases
DEFERRED TAX ASSETS 190,293 27,856 (17,207) - - - (21,003) 179,939Unused tax losses(*) 4,495 18,584 (2,104) - - - 339 21,314Unused tax credits 410 7,467 (7,221) - - - (142) 514Deferred tax assets (temporarydifferences) 185,388 1,805 (7,882) - - - (21,200) 158,111DEFERRED TAXLIABILITIES (138,079) (458) 15,538 (3,001) - - 6,718 (119,282)Deferred tax liabilities(temporary differences) (138,079) (458) 15,538 (3,001) - - 6,718 (119,282)
(*) Tax credits for loss carryforwards.
Thousand U.S. dollars
Balance at12/31/2013
Results Equity
Transfers
Translationdifferences
Acquisitionof newentities
Balance at12/31/2014Increases Decreases Increases Decreases
DEFERREDTAX ASSETS 179,939 48,016 (52,454) - - (653) (24,479) 38 150,137
Unused taxlosses(*) 21,314 17,701 (15,832) - - (645) (4,400) 38 18,176
Unused taxcredits 514 224 (187) - - (413) (103) - 35
Deferred taxassets 158,111 30,091 (36,435) - - 405 (20,246) - 131,926

55
(temporarydifferences)DEFERREDTAXLIABILITIES
(119,282) 3 22,371 - 1,596 (6) 14,097 (1,911) (83,132)
Deferred taxliabilities(temporarydifferences)
(119,282) 3 22,371 - 1,596 (6) 14,097 (1,911) (83,132)
(*) Tax credits for loss carryforwards.
As a result of the business combination described in Note 5a, the Company recognized deferred tax assets amounting toapproximately 100 million U.S. dollars from existing Brazilian tax regulations which permit companies to deduct goodwill arisingfrom business combinations. These deferred tax assets amounted to 72 million U.S. dollars as at December 31, 2013. The Companyalso considered this amount as part of the assets acquired in the business combination. The remaining amount relates to the differencesin the tax and accounting criteria for recognizing the Company’s provisions for risks. Additional deferred tax assets arising from thebusiness combinations amounting to 31 million U.S. dollars were recorded due to the recognition of labor contingencies and other.The remaining amount relates to the differences in the tax and accounting criteria for recognizing the Company’s provisions for risks.
As a result of the business combination described in Note 5a, the Company recognized deferred tax liabilities amounting to1.9 million U.S. dollars due to the difference between the tax value of the customer base and the fair value allocated in the businesscombination, which amounted to 113 million U.S. dollars as at December 31, 2013.
As a result of the business combination described in Note 5b, the Company recognized deferred tax liabilities amounting to 1.7million U.S. dollars due to the difference between the tax value of the customer base and the fair value allocated in the businesscombination.
The following table presents the schedule for the reversal of recognized and unrecognized deferred tax assets and liabilities inthe statement of financial position based on the best estimates available at the respective estimation dates:
Thousands of U.S. dollars2013 2014 2015 2016 2017 2018 2019 Subsequent years TotalTax losses - 823 1,579 2,460 2,713 3,003 10,736 21,314Deductible temporary differences 28,427 27,152 28,292 7,532 7,659 8,146 50,904 158,111Tax credits for deductions 514 - - - - - - 514Total deferred tax assets 28,941 27,975 29,871 9,992 10,372 11,149 61,639 179,939Total deferred tax liabilities 14,506 14,460 14,422 15,216 15,173 15,137 30,368 119,282
Thousands of U.S. dollars2014 2015 2016 2017 2018 2019 2020 Subsequent years TotalTax losses 702 1,346 2,098 2,313 2,560 2,560 6,595 18,174Deductible temporary differences 23,719 22,655 23,607 6,285 6,391 6,797 42,474 131,928Tax credits for deductions 35 - - - - - - 35Total deferred tax assets 24,456 24,001 25,705 8,598 8,951 9,357 49,069 150,137Total deferred tax liabilities 10,078 10,051 10,605 10,575 10,549 10,528 20,746 83,132
The balance of deferred taxes related with items in other comprehensive income is as follow:
Thousands of U.S. dollars2013 2014
Cash flow hedges (3,001) 1,596

56
c) Tax consolidation
Since January 1, 2013, the following Atento Group companies in Spain have paid tax as part of consolidated tax group 230/13:
Parent Company: Atento Spain Holdco S.L.U. (formerly Global Chaucer, S.L.U.) Subsidiaries:
• Atento Teleservicios España, S.A.U.
• Atento Servicios Técnicos y Consultoría, S.A.U.
• Atento Impulsa, S.A.U.
• Atento Servicios Auxiliares de Contact Center, S.A.U.
• Atento Spain Holdco 5, S.L.U. (formerly Global Kiowa, S.L.U.)
• Atento Spain Holdco 6, S.L.U. (formerly Global Benoni, S.L.U.)
• Atento Spain Holdco 2, S.A.U. (formerly Global Laurentia, S.L.U.)1
• Atento Spain Holdco 4, S.A.U. (formerly BC Spain Holdco, S.A.U.)
• Global Rossolimo, S.L.U.
Losses carried forward recognized by the tax group in 2014 (corrected for any adjustments on tax consolidation), amounting to81,272 thousand U.S. dollars, will be offset by future profits obtained by the consolidated tax group.
d) Public administrations
Details of receivables from public administrations and payables to public administrations at December 31, 2013 and 2014 are asfollow:
Thousands of U.S. dollarsFor the year ended December 31,
Receivables 2013 2014
Non-currentIndirect taxes - 4,851CurrentIndirect taxes 5,887 4,691Other taxes 12,891 6,071Income tax 12,962 13,603Total 31,740 29,216
Thousands of U.S. dollarsFor the year ended December 31,
Payables 2013 2014
Non-currentSocial security 1,949 1,596CurrentIndirect taxes 28,317 28,903Other taxes 46,666 45,613Income tax 7,582 7,351Total 84,514 83,463
21) PROVISIONS AND CONTINGENCIES
Movements in provisions during 2013 and 2014 were as follow:Thousands of U.S. dollars
1 Converted into a Public Limited Company on April 9th, 2013.

57
12/31/2012 Allocation Application Reversal Discounted TransfersTranslationdifferences 12/31/2013
Non-currentProvisions for liabilities 79,285 7,638 (15,360) - - 11,669 (10,416) 72,816Provisions for taxes 5,432 5,750 (313) - 616 - (1,194) 10,291Provisions for dismantling 15,463 2,296 (149) - 1 (135) (2,008) 15,468Other provisions 361 1 (396) - 74 446 1 487Total non-current 100,541 15,685 (16,218) - 691 11,980 (13,617) 99,062CurrentProvisions for liabilities 21,948 3,476 (3,634) (475) - (11,668) (2,455) 7,192Provisions for taxes 938 - 85 - - - (85) 938Provisions for dismantling 29 72 (28) - - 135 (1) 207Other provisions 1,979 5,789 - (1,300) - (446) 159 6,181Total current 24,894 9,337 (3,577) (1,775) - (11,979) (2,382) 14,518
Thousands of U.S. dollars
12/31/2013 Allocation
Acquisitionof newentities Application Reversal Discounted Transfers
Translationdifferences 12/31/2014
Non-current
Provisions forliabilities 72,816 11,635 2,104 (21,960) - - - (7,706) 56,889
Provisions fortaxes 10,291 3,906 9,490 (356) - 1,251 - (2,865) 21,717
Provisions fordismantling 15,468 2,983 - (375) - - - (2,127) 15,949
Other provisions 487 152 - (434) - 50 - (36) 219Total non-
current 99,062 18,676 11,594 (23,125) - 1,301 - (12,734) 94,774
Current
Provisions forliabilities 7,192 2,878 - (1,713) (111) - - (1,547) 6,699
Provisions fortaxes 938 69 - - - - - (61) 946
Provisions fordismantling 207 5 - (135) - - - (14) 63
Other provisions 6,181 9,269 - (3,116) (58) - - (1,475) 10,801
Total current 14,518 12,221 - (4,964) (169) - - (3,097) 18,509
“Provisions for liabilities” primarily relate to provisions for legal claims underway in Brazil. Atento Brasil, S.A. has madepayments in escrow related to legal claims from ex-employees and the Brazilian social security authority (Instituto Nacional doSeguro Social) amounting to 48,690 thousand U.S. dollar and 41,838 thousand U.S. dollar as at December 31, 2013 and 2014,respectively.
“Provisions for taxes” mainly relate to probable contingencies in Brazil in respect of social security payments, which could besubject to varying interpretations by the social security authorities concerned.
The amount recognized under “Provision for dismantling” corresponds to the necessary cost of covering the dismantling processof the installations held under operating leases for those entities contractually required to do so.
Given the nature of the risks covered by these provisions, it is not possible to determine a reliable schedule of potentialpayments, if any.

58
At December 31, 2014, lawsuits still before the courts were as follow:
At December 31, 2014, Atento Brasil was involved in approximately 10,022 labor-related disputes, filed by Atento’s employeesor ex-employees for various reasons, such as dismissals or differences over employment conditions in general. The total amount ofthese claims was 100,863 thousand U.S. dollars, of which 53,931 thousand U.S. dollars are classified by the Company’s internal andexternal lawyers as probable, 38,257 thousand U.S. dollars are classified as possible, and 4,996 thousand U.S. dollars are classified asremote.
Moreover, as of December 31, 2014 Atento Brazil was party to 10 civil public actions filed by the Labor Prosecutor’s Officedue to alleged irregularities mainly concerning daily and general working routine, lack of overtime control and improper health andsafety conditions in the workplace. The total amount involved in these claims was approximately BRL68.0 million, of which BRL2.2million relate to claims that have been classified as probable by our internal and external lawyers, for which amount Atento Brazil hasestablished a reserve, as indicated in the paragraph above. We expect that our ultimate liability for these claims, if any, will besubstantially less than the full amount claimed. These claims are generally brought with respect to specific jurisdictions in Brazil, andit is possible that in the future similar claims could be brought against us in additional jurisdictions. We cannot assure you that thesecurrent claims or future claims brought against us will not result in liability to us, and that such liability would not have a materialadverse effect on our business, financial condition and results of operations.
In addition, at December 31, there are labor-related disputes belonging to the company CBCC totaling 1,166 thousand dollars.According to the Company’s external attorneys, materialization of the risk event is possible.
Moreover, Atento Brasil, S.A. has 26 civil lawsuits ongoing for various reasons (17 in 2013). The total amount of these claimsis approximately 3,199 thousand U.S. dollars (1,061 thousand U.S. dollars at December 31, 2013). According to the Company’sexternal attorneys, materialization of the risk event is possible.
In addition, at December 31, 2014 Atento Brasil, S.A. has 29 disputes ongoing with the tax authorities and social securityauthorities, for various reasons relating to infraction proceedings filed (33 in 2013). The total amount of these claims is approximately33,796 thousand U.S. dollars (47,532 thousand U.S. dollars at December 31, 2013). According to the Company’s external attorneys,materialization of the risk event is possible.
Lastly, there are other contingencies which are classified as possible by the Company amounting to 11,120 thousand U.S.dollars.
At December 31, 2014 Teleatento del Perú, S.A.C. has a lawsuit underway with the Peruvian tax authorities amounting to 8,509thousand U.S. dollars (9,473 thousand U.S. dollars in 2013). According to the Company’s external attorneys, materialization of therisk event is possible.
At December 31, 2014 Atento Teleservicios España S.A.U. and the rest of Spanish companies was party to labor-relateddisputes filed by Atento employees or former employees for different reasons, such as dismissals and disagreements regardingemployment conditions, totaling 4,401 thousand U.S. dollars (2,251 thousand U.S. dollars in 2013). According to the Company’sexternal lawyers, materialization of the risk event is possible.
At December 31, 2014 Atento México S.A. de CV was a party to labor-related disputes filed by Atento employees or formeremployees for different reasons, such as dismissals and disagreements regarding employment conditions, totaling 5,897 thousand U.S.dollars (4,823 thousand U.S. dollars in 2013). According to the Company’s external lawyers, materialization of the risk event ispossible.
Provision for restructuring in Spain
On June 26, 2014, the Company communicated to the Spanish Labor Unions a headcount reduction plan in Spain (“Expedientede Regulación de Empleo”) which took into consideration a maximum number of terminations amounting to 9% (up to 672employees) of the total headcount of Atento Teleservicios España, S.A.U. The estimated costs incurred in the personnel restructuringand other costs directly attributable to the restructuring at an amount equivalent to 13,918 thousand U.S. dollars as at September 30,2014 were accrued and recognized in “Other provisions”. As at September 30, 2014, the vast majority of total costs incurred inconnection with this restructuring process (11,484 thousand U.S. dollars) had already been paid.

59
An appeal against this agreement was filed by a minority of the unions before the Spanish National Court, claiming that therestructuring was null and void on a number of grounds. On November 12, 2014, the court issued its decision, and rejected each of theminority unions’ claims, except with respect to the claim that there was a defect in the referendum procedure conducted by themajority unions. The court ruled that there was a defect in the majority unions’ referendum procedure, and as a result, declared theCompany’s headcount reduction plan to be null and void.
The court, based on that nullity, declared that the Company must reinstate all dismissed employees and pay their salaries in fullfor the period from when they were dismissed until reinstatement. The employees would be required to pay back the severancepayments received upon termination. On November 19, 2014, the Company appealed this decision before the Spanish Supreme Court.
On December 12, 2014, the Spanish National Court approved a settlement agreement reached between the Company’ssubsidiary in Spain and all seven trade unions with representation in the legal proceedings, which provides a headcount reduction of476 employees of the total initially proposed headcount in the collective dismissal program.
According to the agreement reached, 179 employees will be readmitted to their prior positions with the Company on the termsthey had before the process began, including receiving the same salary.
This unanimous agreement and its approval by the Spanish National Court bring to an end the process and reflect the efforts ofall parties involved to reach a beneficial solution for all stakeholders.
22) REVENUE AND EXPENSES
a) Revenue
The breakdown of revenue at the Atento Group for the years ended December 31, 2013 and 2014 is as follow:
Thousands of U.S. dollars2013 2014
RevenueServices rendered 2,341,115 2,298,324Total 2,341,115 2,298,324
b) Other operating income
Details of other operating income recognized in the consolidated income statements for the years ended December 31, 2013 and2014 are as follow:
Thousands of U.S. dollars2013 2014
Other operating incomeOther operating income 2,587 3,605Operating grants 1,698 716Income from indemnities and other non-recurring income 57 187Gains on disposal of non-current assets 25 71
Total 4,367 4,579
c) Supplies
Details of amounts recognized under “Supplies” during the years ended December 31, 2013 and 2014 are as follow:
Thousands of U.S. dollars 2013 2014
SuppliesSubcontracted services 13,094 6,017
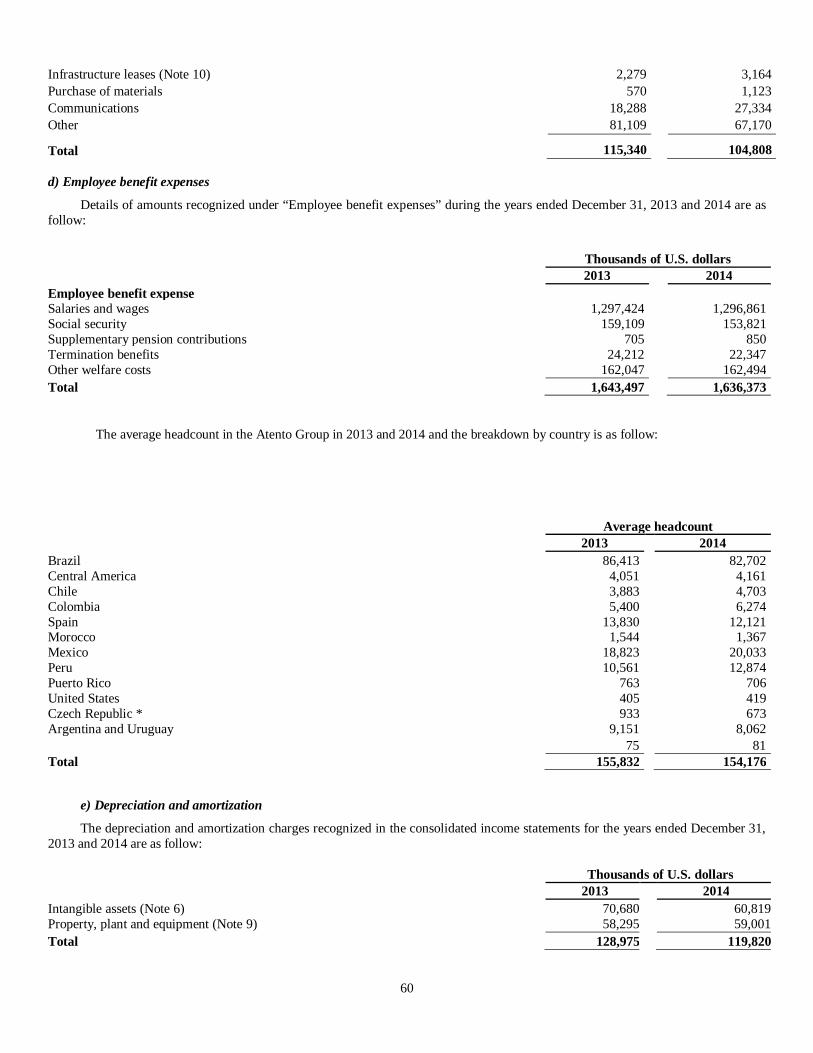
60
Infrastructure leases (Note 10) 2,279 3,164Purchase of materials 570 1,123Communications 18,288 27,334Other 81,109 67,170
Total 115,340 104,808
d) Employee benefit expenses
Details of amounts recognized under “Employee benefit expenses” during the years ended December 31, 2013 and 2014 are asfollow:
Thousands of U.S. dollars2013 2014
Employee benefit expenseSalaries and wages 1,297,424 1,296,861Social security 159,109 153,821Supplementary pension contributions 705 850Termination benefits 24,212 22,347Other welfare costs 162,047 162,494Total 1,643,497 1,636,373
The average headcount in the Atento Group in 2013 and 2014 and the breakdown by country is as follow:
Average headcount2013 2014
Brazil 86,413 82,702Central America 4,051 4,161Chile 3,883 4,703Colombia 5,400 6,274Spain 13,830 12,121Morocco 1,544 1,367Mexico 18,823 20,033Peru 10,561 12,874Puerto Rico 763 706United States 405 419Czech Republic * 933 673Argentina and Uruguay 9,151 8,062
75 81Total 155,832 154,176
e) Depreciation and amortization
The depreciation and amortization charges recognized in the consolidated income statements for the years ended December 31,2013 and 2014 are as follow:
Thousands of U.S. dollars2013 2014
Intangible assets (Note 6) 70,680 60,819Property, plant and equipment (Note 9) 58,295 59,001Total 128,975 119,820

61
f) Other operating expenses
The breakdown of “Other operating expenses” in the consolidated income statements for the years ended December 31, 2013and 2014 are as follow:
Thousands of U.S. dollars2013 2014
Other operating expensesExternal services provided by other companies 339,817 346,736Losses on disposal of fixed assets 1,160 899Taxes other than income tax 14,497 10,397Other ordinary management expenses 196 2,160Total 355,670 360,192
Details of “External services provided by other companies” under “Other operating expenses” are as follow:
Thousands of U.S. dollars2013 2014
External services provided by other companiesLeases (Note 25c) 118,335 106,345Installation and maintenance 44,688 35,997Lawyers and law firms 12,264 13,159Tax advisory services 329 240Consultants 36,255 30,436Audits and other related services 2,740 6,911Studies and work performed 1,497 724Other external professional services 45,044 76,923Publicity, advertising and public relations 7,753 9,327Insurance premiums 1,998 1,987Travel expenses 13,984 14,666Utilities 35,627 31,701Banking and similar services 625 8,734Other 18,678 9,586TOTAL 339,817 346,736
The amounts recognized under “Consultants” and “Other external professional services” in the years ended December 31, 2013and 2014 primarily relate to expenses incurred on the acquisition of the Atento Group from Telefónica, S.A. and other integrationrelated costs.
As at December 31, 2014, the total amount paid related to IPO costs was 43.8 million U.S. dollars, of which 1.3 million U.S.dollars were capitalized.
g) Finance income and costs
The breakdown of “Finance income” and “Finance costs” in the consolidated income statements for the years endedDecember 31, 2013 and 2014 are as follow:
Thousands of U.S. dollars2013 2014

62
Finance incomeInterest received from third parties 10,832 17,326Gains in the fair value of financial instruments 6,934 40,902Gains on the disposal of financial assets 27 60Total finance income 17,793 58,288Finance costInterest paid to Group companies (Note 26) (25,652) (25,435)Interest paid to third parties (90,820) (95,243)Discount to present value of provisions and other liabilities (1,215) (1,385)Losses on the disposal of financial assets (161) -Loss in the fair value of financial instruments (17,226) (13,631)Total finance cost (135,074) (135,694)
The breakdown of “Foreign Exchange gains” and “Foreign Exchange losses” is shown in the table below:
Thousands of U.S. dollars 2013Exchange gains Exchange losses Net
Foreign Exchange gains/(losses)Loans and receivables 23,781 (10,842)Other financial transactions 1,329 (519)Current transactions 24,982 (22,117)Total 50,092 (33,478) 16,614
Thousands of U.S. dollars 2014Exchange gains Exchange losses Net
Foreign Exchange gains/(losses)Loans and receivables - (32,905)Current transactions 36,576 (37,034)Total 36,576 (69,939) (33,363)
23) FINANCIAL INFORMATION BY SEGMENT
The CEO is the chief operating decision maker (“CODM”). Management has determined the operational segments on the basisof the information reviewed by the CEO for the purposes of allocating resources and appraising performance. The resultsmeasurement used by the CEO to appraise the performance of the Atento Group’s segments is earnings before interest, taxes anddepreciation and amortization (“EBITDA”) and Adjusted EBITDA (as defined below).
The CEO considers the business from the geographical perspective in the following areas:
• EMEA, which combines the activities carried out regionally in Spain, Morocco and the Czech Republic2.
• The Americas, which includes the activities carried out by the various Spanish-speaking companies in Mexico, Centraland South America. It also includes transactions in the United States.
• Brazil, which is managed separately in view of its different language and major importance.
Inter-segment transactions are carried out at market prices.
The Atento Group uses EBITDA and Adjusted EBITDA to track the performance of its segments and to establish operating andstrategic targets. Management believes that EBITDA and Adjusted EBITDA provides an important measure of the segment’soperating performance because it allows management to evaluate and compare the segments’ operating results, including their returnon capital and operating efficiencies, from period to period by removing the impact of their capital structure (interest expenses), assetbases (depreciation and amortization), and tax consequences. Adjusted EBITDA is defined as EBITDA adjusted to exclude acquisition
2 Until December 2014 (See note 27).

63
and integration costs, restructuring costs, sponsor management fees, asset impairments, site relocation costs, financing fees and otheritems which are not related to our core operating results.
EBITDA and Adjusted EBITDA are a commonly reported measure and are widely used among analysts, investors and otherinterested parties in the Atento Group’s industry, although not a measure explicitly defined in IFRS, and therefore, may not becomparable to similar indicators used by other companies. EBITDA and Adjusted EBITDA should not be considered as an alternativeto the profit for the year as a measurement of our consolidated earnings or as an alternative to consolidated cash flow from operatingactivities as a measurement of our liquidity.
The major data for these segments in the year ended December 31, 2013 was as follow:
Thousands of U.S. dollars
EMEA Americas BrazilOther and
eliminationsTotal
GroupSales to other companies 119,515 401,979 683,110 - 1,204,604Sales to Telefónica Group customers 243,264 370,225 523,022 - 1,136,511Intragroup sales 278 499 - (777) -Other operating income and expenses (338,802) (657,436) (1,055,441) (55,487) (2,107,166)EBITDA 24,255 115,267 150,691 (56,264) 233,949Depreciation and amortization (24,398) (47,695) (55,886) (996) (128,975)Operating profit/(loss) (143) 67,572 94,805 (57,260) 104,974Financial results (18,358) (3,891) (43,913) (34,505) (100,667)Income tax 7,770 (19,305) (17,710) 20,899 (8,346)Profit/(loss) for the period (10,731) 44,376 33,182 (70,866) (4,039)EBITDA 24,255 115,267 150,691 (56,264) 233,949Acquisition and integration costs 585 618 5,992 22,068 29,263Restructuring costs 1,890 2,506 - 8,453 12,849Sponsor management fees - - - 9,130 9,130Site relocation costs - - 1,845 - 1,845Financing fees - - 561 5,543 6,104Other - - 2,005 - 2,005Adjusted EBITDA 26,730 118,391 161,094 (11,070) 295,145Capital expenditure 7,180 31,812 63,241 796 103,029Fixed assets 136,916 303,329 377,933 3,941 822,119Allocated assets 535,645 694,391 853,018 (240,874) 1,842,180Allocated liabilities 361,576 398,067 661,039 555,464 1,976,146
The major data for these segments in the year ended December 31, 2014 was as follow:
Thousands of U.S. dollars
EMEA Americas BrazilOthers andeliminations
TotalGroup
Sales to other companies 127,291 408,485 693,165 - 1,228,941Sales to Telefónica Group 207,241 370,527 491,615 - 1,069,383Sales to other group companies 252 407 - (659) -Other operating income and expense (359,883) (672,172) (1,025,955) (33,344) (2,091,354)EBITDA (25,099) 107,247 158,825 (34,003) 206,970Depreciation and amortization (20,430) (42,959) (55,372) (1,059) (119,820)Operating profit/(loss) (45,529) 64,288 103,453 (35,062) 87,150Financial results (13,611) (14,716) (42,917) (39,525) (110,769)Income tax 15,308 (19,641) (22,271) 8,071 (18,533)

64
Profit/(loss) for the period (43,832) 29,931 38,265 (66,516) (42,152)EBITDA (25,099) 107,247 158,825 (34,003) 206,970Acquisition and integration related costs - 39 8,784 1,037 9,860Restructuring costs 16,602 8,092 1,354 667 26,715Sponsor management fees - - - 7,285 7,285Site relocation costs - - 1,668 - 1,668Financing and IPO fees - 405 1,893 49,657 51,955Asset impairments and Other 34,938 1,902 (406) (34,530) 1,904Adjusted EBITDA 26,441 117,685 172,118 (9,887) 306,357Capital expenditure 4,182 38,014 76,616 1,276 120,088Fixed assets 76,081 257,322 363,103 3,239 699,745Allocated assets 456,829 658,054 813,004 (269,986) 1,657,901Allocated liabilities 312,676 378,782 611,560 (109,983) 1,193,035
“Other and eliminations” includes activities of the following intermediate holdings in Spain: Atento Spain Holdco, S.L.U.,Atento Spain Holdco 6, S.L.U. and Global Rossolimo, S.L.U., as well as inter-group transactions between segments.
The breakdown of sales to customers by the main countries where the Atento Group operates is as follow:
Thousands of U.S. dollarsCountry 2013 2014Spain 327,351 306,599Morocco 20,863 18,417Czech Republic 14,565 9,516Other and eliminations (*) 278 252EMEA 363,057 334,784Argentina 198,710 151,939Chile 68,454 79,270Colombia 65,738 69,522El Salvador 12,753 13,929United States 20,142 20,727Guatemala 14,405 15,323Mexico 265,198 274,999Peru 102,168 131,772Puerto Rico 14,898 12,777Uruguay 9,565 8,017Panama 173 737Other and eliminations (*) 499 407Americas 772,703 779,419Brazil 1,206,132 1,184,780Other and eliminations (*) (777) (659)Total sales to non-Group customers 2,341,115 2,298,324(*) Includes revenue holding-company level as well as consolidation adjustments.
As stated in Note 5, the Atento Group signed a framework contract with Telefónica that expires in December 31, 2021. In 2014,approximately 46.5% of service revenue were generated from business with Telefónica Group companies (48.5% in 2013).
As stated in Note 9, property, plant and equipment totaled 237,196 thousand U.S. dollars at December 31, 2014(231,603 thousand U.S. dollars at December 31, 2013) and are primarily on site in Mexico and Brazil (23,527 thousand U.S. dollarsand 149,039 thousand U.S. dollars, respectively at December 31, 2014; 24,934 thousand U.S. dollars and 137,161 thousand U.S.dollars, respectively at December 31, 2013).
24) RESULTS PER SHARE
Basic results per share are calculated by dividing the profits attributable to equity holders of the Company by the weightedaverage number of ordinary shares outstanding during the periods.

65
Thousands of U.S. dollars2013 2014
Result attributable to equity holders of the CompanyNet loss for the period/year (thousands of U.S. dollars)(1) (4,039) (42,152)
Weighted average number of outstanding ordinary shares(2) 68,800 69,603Basic result per share (per U.S. dollars) (0.06) (0.61)
(1) Since a value close to nil will be paid for the ordinary shares in connection with the stock option plan there is no adjustment to netloss for the year.(2) The weighted average number of shares was calculated considering the convertion of ordinary shares had ocurred at October 7,2014 (see Note 19).
Diluted results per share are calculated by adjusting the weighted average number of ordinary shares outstanding to reflect thehypothetical conversion of all potentially dilutive ordinary shares. There is no difference between basic results and diluted results pershare.
25) COMMITMENTS
a) Guarantees and commitments
As at December 31, 2013 and 2014 the Atento Group had issued various guarantees and commitments to third parties amountingto 233,413 thousand U.S. and 234,990 thousand U.S. dollars respectively.
The transactions guaranteed and their respective amounts at December 31, 2013 and 2014 are as follow:
Thousands of U.S. dollars12/31/2013 12/31/2014
GuaranteesFinancial, labor related, tax and rental transactions 97,431 158,499Contractual obligations 135,830 76,486Other 152 5
Total 233,413 234,990
The Company’s directors consider that no liabilities will arise from these guarantees in addition to those already recognized.
The breakdown shown in the table above relates to guarantees extended by Atento Group companies, classified by their purpose.Of these guarantees, the majority relate to commercial purposes and rental activities, the bulk of the remaining guarantees relates totax and labor-related procedures.
b) Other financial commitments
As described in Note 17, on November 22, 2012 BC Brazilco Participações, S.A. (now merged with Atento Brasil, S.A.) issueddebentures in Brazil, subscribed by institutional investors and assumed by Bain. This long term financial commitment matures in2019.
In addition, on December 26, 2012 a trust agreement was signed between Atento Brasil, S.A. BC Brazilco Participações, S.A.and Banco BTG Pactual, S/A (as the depository bank) in order to guarantee this debenture issue.
As a result of the bonds issue by Atento Luxco 1, S.A. (formerly BC Luxco 1, S.A.) and the arrangement of the Super SeniorRevolving Credit Facilities Agreement described in Note 17, in April and May 2013 the following financial documents adherence andguarantee agreements were signed, inter alia:
1. Adherence to financial documents by Atento Atención y Servicios S.A. de C.V., Atento Impulsa, S.A.U., Atento ServiciosTécnicos y Consultoría, S.A.U., Atento Servicios Auxiliares de Contact Center S.A.U., Atento Colombia S.A., Teleatento del PerúS.A.C., and Atento Holding Chile, S.A. as Post Closing Guarantors.
2. Pledge of shares in Atento Group companies guaranteeing the financial loans, including Atento Mexicana, S.A. de C.V.,Atento Servicios, S.A. de C.V. and Atento Teleservicios España, S.A.U. as “Initial Guarantors”, as well as Atento Atención y

66
Servicios S.A. de C.V., Atento Impulsa, S.L.U., Atento Servicios Técnicos y Consultoría, S.L.U., Atento Servicios Auxiliares deContact Center, S.L.U., Atento Colombia S.A., Teleatento del Peru S.A.C. and Atento Holding Chile, S.A. as “Post-ClosingGuarantors”.
3. Pledge on the current accounts of Atento Teleservicios España, S.A.U., Atento Servicios Técnicos y Consultoría, S.A.U.,Atento Impulsa, S.A.U., and Atento Servicios Auxiliares de Contact Center, S.A.U. Current accounts of these subsidiaries amount to24,409 thousand U.S. dollars at December 31, 2013, and 41,091 thousand U.S. dollars at December 31, 2014.
Lastly, on April 29, 2013 Atento Mexico Holdco S.R.L. de C.V. and Atento Mexicana S.A. de C.V. entered into a trustagreement with CITIBANK N.A. London as bond underwriter for the loan contract, and as bond coverage guarantor.
c) Operating leases
The breakdown of total minimum future lease payments under non-cancellable operating leases is as follow:
Thousands of U.S. dollars2013 2014
Up to 1 year 90,930 73,717Between 1 and 5 years 170,692 181,632More than 5 years 33,116 36,986
Total 294,738 292,335
Total operating lease expenses recognized in the consolidated income statement for the year ended December 31, 2014 amountto 3,164 thousand U.S. dollars (2,279 thousand U.S. dollars in 2013) under “Infrastructure leases” (see Note 22c) and106,345 thousand U.S. dollars (118,335 thousand in 2013) under “External services provided by other companies” (see Note 22f).
No contingent payments on operating leases were recognized in the consolidated income statements for the years endedDecember 31, 2013 and 2014.
The operating leases where Atento Group acts as lessee are mainly on premises used as call centers. These leases have varioustermination dates, with the latest in 2024.
At December 31, 2014 the payment commitment for the early cancellation of these leases amounts to 141,779 thousand U.S.dollars (147,914 thousand U.S. dollars in 2013).
26) RELATED PARTIES
Directors
The directors of the Company as at the date on which the financial statements were prepared are Melissa Bethell, AurelienVasseur, Francisco Tosta Valim, Thomas Ianotti, Luis Javier Castro, Stuart Gent, Devin O’Reilly, and Alejandro Reynal.
The directors currently serving on the Board of the Company received no remuneration whatsoever for their functions asdirectors in 2013 nor in 2014. At December 31, 2014, the directors acquired the right on the share-based payments, as described inNote 19.
Key management personnel
Key management personnel include those persons empowered and responsible for planning, directing and controlling the AtentoGroup’s activities, either directly or indirectly.
Key management personnel with executive duties in the Atento Group in 2013 and 2014 are as follow:
2013

67
Name Post
Alejandro Reynal Ample................................................................ Chief Executive OfficerMª Reyes Cerezo Rodriguez Sedano....................................................Legal and Regulatory Compliance DirectorDiego Lopez San Román(*) ................................................................Director of Business DevelopmentJuan Enrique Gamé.............................................................................Regional Director—South AmericaMariano Castaños Zemborain ..............................................................Regional Director—EMEANelson Armbrust.................................................................................Regional Director—BrazilMiguel Matey Marañón.......................................................................Regional Director—North America and MexicoMauricio Teles Montilha ................................................................ Chief Financial OfficerJosé Ignacio Cebollero Bueno .............................................................Director of Human ResourcesJohn Robson .......................................................................................Director of Global Technology
(*) Until December 15, 2013.
2014Name Post
Alejandro Reynal Ample................................................................ Chief Executive OfficerMauricio Teles Montilha ................................................................ Chief Financial OfficerMª Reyes Cerezo Rodriguez Sedano....................................................Legal and Regulatory Compliance DirectorJuan Enrique Gamé.............................................................................Regional Director—South AmericaJose María Pérez Melber…………………………………………… Regional Director—EMEAMariano Castaños Zemborain ..............................................................Regional Director CommercialBruce Dawson……………………………………………………… Regional Director Near ShoreMichael Flodin……………………………………………………... Regional Diretor of OperationsNelson Armbrust.................................................................................Regional Director—BrazilJosé Ignacio Cebollero Bueno .............................................................Director of Human ResourcesMiguel Matey Marañón.......................................................................Regional Director—North America and Mexico
The following table shows the total remuneration paid to the Atento Group’s key management personnel in 2013 and 2014:
Thousands of U.S. dollars2013 2014
Total remuneration paid to key management personnel 8,303 5,491
The breakdown of the remuneration shown above is as follow:
Thousands of U.S. dollars12/31/2013 12/31/2014
Salaries and variable remuneration 7,896 4,490Salaries 3,401 2,999Variable remuneration 1,365 1,991Other remuneration related to Management Incentive Program 3,130 -Payment in kind 407 501Medical insurance 70 72Life insurance premiums 17 8Other 320 421
Total 8,303 5,491
In July 2013, the Shareholders of Atento Group implemented a Management Incentive Plan ( “MIP”) pursuant to which certainof the Group’s senior management are granted the opportunity to invest in the Group. The eligibility of managers to participate isdetermined by the remuneration committee of the company.
Managers who participate in the MIP are required to subscribe to various classes of shares in a Luxembourg special purposevehicle that is indirectly invested in Atalaya Luxco Topco S.C.A (“Topco”), the ultimate parent company of the Group. The sharesheld by each MIP participant fall into two categories: co-investment shares and performance shares.

68
The co-investment shares effectively allow managers to participate in dividends and other distributions on a pro rata and paripassu basis with Topco’s other shareholders. The performance shares only participate in dividends and other distributions if Topco’smajority shareholder achieves certain specified returns on its investment in Topco, with the performance shares being entitled toreceive a progressively larger share of all dividends and other distributions (up to a pre-determined maximum percentage) as the totalproceeds received by Topco’s majority shareholder reach certain pre-agreed hurdles.
MIP participants are only entitled to hold shares for so long as they are employed by a member of the Group. In the event that aMIP participant’s employment is terminated, his/her shares can be bought back at a pre-specified price that is linked to thecircumstances surrounding the termination of the relevant manager’s employment and the length of time that such manager has heldhis/her shares.
In connection with the MIP, the participants were granted an amount in cash exclusively for the purpose of acquiring the sharesdescribed above which has been accounted for as a compensation expense in 2014. The Board of Directors does not expect anysignificant future impact in the financial statements as a consequence of this Program.
On July 18, 2013, Atento Spain Holdco 2, S.A.U., an indirect subsidiary, entered into a revolving facility agreement withAtalaya Management Luxco Investment pursuant to which Atento Spain Holdco 2, S.A.U. provided a Euro revolving loan facility inan aggregate amount equal to €3.0 million (4.1 million U.S. dollars) to Atalaya Management Luxco Investment for the purpose ofacquiring an immaterial ownership interest in a related party. As at December 31, 2013, the management loan had an outstandingbalance of 2,423 thousand U.S. dollars which is included in other non-current receivables (See Note 12) on the statement of financialposition. The loan accrues interest at a rate of 6% per annum, matures on July 18, 2023 and was capitalized in full in April 2014.
On April 25, 2014, Atento Spain Holdco 2, S.A.U. contributed its receivable for the outstanding amount under the Facility(2,494 thousand euros equivalent to 3,449 U.S. dollars) to Atalaya Management Luxco Investment in exchange for the issuance byAtalaya Management Luxco Investment of a Class 4 Preference Share, fully subscribed by Atento Spain Holdco 2, S.A.U. On May 30,2014, the Class 4 Preference Share was redeemed for a total consideration of 2,508 thousand euros (equivalent to 3,413 thousand U.S.dollars). The redemption price was fully paid in cash.
Balances and transactions with the Sole Shareholder and other related parties
The table below sets out balances and transactions with ATALAYA Luxco TOPCO, S.C.A, in 2013 and 2014 (in thousand U.S.dollars):
12/31/2013 12/31/2014Non-current payables to Group companies 519,607 -Atalaya Luxco Topco, S.C.A. 519,607 -
Atalaya Luxco Topco, S.C.A payables are composed of the following: (i) four series of Preferred Equity Certificates (PECs,ALPECs and PPPECs) issued by the Atalaya Luxco Topco Company and subscribed by the Company, totaling 550.2 million U.S.dollars at October 3, 2014 (517.4 million U.S. dollars in 2013); (ii) interest accruing pending payment amounting to 26.0 million U.S.dollars at October 3, 2014 (2.2 million U.S. dollars in 2013).
The outlay for interest on these debts in 2014 was 25.4 million U.S. dollars (25.7 million U.S. dollars in 2013).
Preferred Equity Certificates
On December 3, 2012 the Company authorized the issuance of the following Preferred Equity Certificates (“PECs”):
• Series 1: 50,000,000,000 PECs with a par value of 0.01 Euros each. These PECs mature after 30 years, but may bewithdrawn prior to this date in certain scenarios, and accrue interest of 8.0309%. As at December 31, 2012 and 2013 theCompany had issued 23,580,000,000 Series 1 PECs for an aggregate amount of 311,114 and 325,192 thousand U.S.dollars, respectively. The interest capitalized in 2013 totaled 26,100 thousand U.S. dollars (equivalent to 26,479 thousandU.S. dollars at December 31, 2013). The interest accruing at December 31, 2013 totaled 2,197 thousand U.S. dollars.
• Series 2: 200,000 PECs with a par value of 0.01 Euros each. These PECs mature after 30 years, but may be withdrawnprior to this in certain scenarios.
The yield is equal to the profit recognized for Luxembourg generally accepted accounting practices in connection with the“Specified Assets” (meaning the investment of the Company in the Luxco 1 Series 2 PECs, as defined in the terms and

69
conditions of the Series 2 PECs) and not previously taken into account, less any loss recognized under the Luxembourggenerally accepted accounting practices in connection with the Specified Assets for a previous “Accrual Period” (asdefined in the terms and conditions of the Series 2 PECs), less a proportional amount of any direct expense (includingoverhead expenses) borne by the Company during the Accrual Period in relation to the Specified Assets and less thelosses of the Company in relation to the Specified Assets during the Accrual Period, including any such losses carriedforward from previous Accrual Periods, this amount is then divided by the number of Series 2 PECs in issue at any time inthat period.
At December 31, 2012 and 2013 the Company had issued 200,000 Series 2 PECs for an aggregate amount of 3 thousand U.S.dollar.
• Series 3: 25,000,000,000 PECs with a par value of 0.01 Euros each. These PECs mature after 60 years, but may bewithdrawn prior to this in certain scenarios. The yield equals to the “Specified Income” (meaning the sum of all incomeand capital gains derived by the Company from the Eligible Assets less losses of the Company carried forward less allother expenses of the Company connected to the investment in the Eligible Assets, as defined in the terms and conditionsof the Series 3 PECs) for each accounting period comprised in this “Accrual Period” (as defined in the terms andconditions of the Series 3 PECs) divided by 365 (or if a leap year, 366) and, respectively in the case of each such numberso ascertained, multiplied by the number of days of each such accounting period that comprised that Accrual Period, thendivided by the number of Series 3 PECs in issue. At December 31, 2013 the Company had issued 12,017,800,000 Series 3PECs for an aggregate amount of 165,737 thousand U.S. dollars.
• Series 4: 50,000,000,000 PECs with a par value of 0.01 euro each. These PECs mature after 30 years, but may bewithdrawn prior to this date in certain scenarios, and accrued interest of 5%. At June 30, 2014 the Company had issued6,414,652,564 Series 4 PECs for an aggregate amount of 64,147 thousand euros, equivalent to 87,285 thousand U.S.dollars.
The PECs were classified as subordinated debt with respect to the Company’s other present and future obligations.
The table below provides a summary of PECs and respective movements in 2014:
Thousands of U.S. dollars
PEC Maturity 12/31/2013 IssuanceInterest
capitalizedTranslationdifferences Capitalizations 12/31/2014
Series 1 PECs 2042 353,867 - 20,749 (33,885) (340,731) -Series 2 PECs 2042 3 - 3,197 (181) (3,019) -Series 3 PECs 2072 165,737 - - (15,322) (150,415) -Series 4 PECs 2044 - 87,285 1,489 (7,083) (81,691) -Total 519,607 87,285 25,435 (56,471) (575,856) -
Given the specific features and conditions of these instruments and their recent date of issuance, the PECs’s book valuesapproximate their fair value, and they are at Level 3 of the fair value hierarchy.
Transactions with Bain CapitalOn December 12, 2012, Atento Spain Holdco, S.L.U., an indirect subsidiary of the Company, entered into a consulting services
agreement with Bain Capital Partners, LLC, an investment adviser to certain of the Bain Capital funds, pursuant to which it agreed toprovide general executive, business development and other financial advisory services to us. Pursuant to the consulting servicesagreement, Bain Capital Partners, LLC received an annual fee equal to the greater of €5.0 million and 3.00% of the Company’s annualEBITDA, plus reimbursement for reasonable out-of-pocket expenses.
Additionally, pursuant to a transaction services agreement between Atento Spain Holdco S.L.U. and Bain Capital Partners, LLC,dated as of December 12, 2012, it provides certain transaction-specific advisory services. Pursuant to this agreement, Atento SpainHoldco, S.L.U. paid Bain Capital Partners, LLC a transaction fee of $20.3 million in December 2012 principally related to theAcquisition, and it has agreed to pay transaction fees for advice and support relating to future transactions by us (including, withoutlimitation, any share, asset or debt purchase, capital expenditures and refinancing of existing indebtedness) equal to 1.00% of theaggregate transaction value of each such future transaction plus any reasonable out-of-pocket expenses (including fees of anyaccountants, attorneys or other advisors retained by Bain Capital Partners, LLC and its affiliates) incurred in connection with theinvestigation, negotiation and consummation of such future transaction.

70
The transaction services agreement and consulting services agreements each have a one-year initial term and are thereaftersubject to automatic one-year extensions unless Bain Capital Partners, LLC provides written notice of termination at least 90 daysprior to the expiration of the initial term or any extension thereof. Bain Capital Partners, LLC may also terminate the agreements atany time by delivering to us written notice of termination. The agreements include customary indemnities in favor of Bain CapitalPartners, LLC. The transaction services agreement and the consulting services agreement were amended on May 17, 2013.
On October 7, 2014, the parties thereof entered into a deed of termination in relation to the consulting services agreement andthe transaction services agreement. In connection with such termination, Atento paid to Bain Capital Partners, LLC a termination feeof $23.0 million and a transaction fee of $1.5 million.
Our payment of fees to Bain Capital Partners, LLC in 2014 in connection with these agreements amounted to $31.5 million.
27) OTHER INFORMATION
a) Auditors’ fees
The fees to the various member firms of the Ernst & Young international organization, of which Ernst & Young, S.L., auditorsof the Atento Group in 2013 and 2014, amounted to a 1,836 thousand U.S. dollars and 3,534 thousand U.S. dollars, respectively.
Details of these amounts are as follows:Thousands of U.S. dollars
2013 2014
Audit fees (*)
Audit services 1,836 3,534
Total 1,836 3,534
(*) Audit services: services included in this heading are mainly the audit of the annual and interim financial statements and the reviewof the 20-F report to be filed with the Security and Exchange Commission (SEC) and the audit services related to the IPO. These feesinclude amounts in respect of fully consolidated Atento Group companies.

71
29) EVENTS AFTER THE REPORTING PERIOD
The Company has evaluated events through March 24, 2015, which is the date on which the consolidated financial statementsauthorized for issued by the Board of Directors, and has determined that there were no additional subsequent events after December31, 2014 requiring adjustment or disclosure in the consolidated financial statements.
a) Microsoft licenses
At January 2, 2015, Atento Brazil S.A. entered into a master agreement regarding the acquisition of rights to use Microsoft’software from SofwareONE Commerce and Computer Services Ltda. (“Contractor”), in which the Contractor provides Microsoft’software licenses Atento and its affiliates in Brazil, Colombia, Corporation, El Salvador, Peru, Guatemala, Mexico, and United Statesof America ("USA").
Acquisition prices stated in the agreements, which will be paid in 3 (three) annual payments due on January 2, 2015, 2016and 2017, are summarized below:
Description Thousands of US dollars
SoftwareONE agreement 37,440Microsoft agreements (not received for analysis in this memorandum) 7,920
45,360
The agreement expires in three years from the date of the agreement and it is non-cancellable.
SELECTED HISTORICAL FINANCIAL INFORMATION
Atento S.A. (“Atento”, the “Company” or “we”) was formed as a direct subsidiary of Atalaya Luxco Topco S.C.A. (“Topco”).In April 2014, Topco also incorporated Atalaya Luxco PIKCo S.C.A. (“PikCo”) and on May 15, 2014 Topco contributed to PikCo: (i)all of its equity interests in its then direct subsidiary, Atalaya Luxco Midco S.à.r.l. (“Midco”), the consideration for which was anallocation to PikCo’s account “capital contributions not remunerated by shares” (the “Reserve Account”) equal to €2 million, resultingin Midco becoming a direct subsidiary of PikCo; and (ii) all of its debt interests in Midco (comprising three series of preferred equitycertificates (the “Original Luxco PECs”)), the consideration for which was the issuance by PikCo to Topco of preferred equitycertificates having an equivalent value. On May 30, 2014, Midco authorized the issuance of, and PikCo subscribed for, a fourth seriesof preferred equity certificates (together with the Original Luxco PECs, the “Luxco PECs”).
In connection with the completion of Atento’s initial public offering (the “IPO”), Topco transferred its entire interest in Midco(being €31,000 of share capital) to PikCo, the consideration for which was an allocation to PikCo’s Reserve Account equal to €31,000.PikCo then contributed (the “Contribution”) all of the Luxco PECs to Midco, the consideration for which was an allocation to Midco’sReserve Account equal to the value of the Luxco PECs immediately prior to the Contribution. Upon completion of the Contribution,the Luxco PECs were capitalized by Midco. PikCo then transferred the remainder of its interest in Midco (being €12,500 of sharecapital) to the Company, in consideration for which the Company issued two new shares of its capital stock to PikCo. The differencebetween the nominal value of these shares and the value of Midco’s net equity was allocated to the Company’s share premiumaccount. As a result of this transfer, Midco became a direct subsidiary of Atento S.A. The Company completed a share split (the“Share Split”) whereby Atento issued approximately 2,219.212 ordinary shares for each ordinary share outstanding as of September 3,2014. The foregoing is collectively referred as the “Reorganization Transaction”.
On October 7, 2014, upon the closing of our initial public offering, Atento issued 4,819,511 ordinary shares without nominalvalue at a price of $15.00 per share. As a result of the completion of the IPO, including the Share Split and the ReorganizationTransaction, Atento has 73,619,511 ordinary shares outstanding and owns 100% of the issued and outstanding share capital of Midco.
As mentioned above, pursuant to the implementation of the Reorganization Transaction Midco became a wholly-ownedsubsidiary of Atento, which was a newly-formed company incorporated under the laws of Luxembourg with nominal assets andliabilities for the purpose of facilitating the IPO, and did not conduct any operations prior to the completion of the IPO. Following theReorganization Transaction and the IPO, Atento’s financial statements presented the consolidated results of Midco’s operations. Theconsolidated financial statements of Midco are substantially the same as the consolidated financial statements of Atento after to the

72
IPO, as adjusted for the Reorganization Transaction. Upon consummation, the Reorganization Transaction was retroactively reflectedin Atento’s calculations for earnings per share.
The consolidated financial statements were prepared in accordance with the European Union of International FinancialReporting Standards issued by the European Financial Reporting Advisory Group (the “EFRAG”) prevailing at December 31, 2014.The financial statements have not been prepared in accordance with generally accepted accounting principles in the United States ofAmerica. The consolidated financial statements have been prepared on a historical costs basis, with the exception of derivativefinancial instruments and Contingent Value Instruments, which have been measured at fair value.
The audited consolidated financial statements of Atento are the consolidated results of operations of Atento, which includes theyears ended December 31, 2013 and December 31, 2014.
Divestment transaction
On December 9, 2014, Atento S.A. through its indirect subsidiary, Atento Spain Holdco, S.L.U., a sole-shareholder subsidiaryof Atento Luxco 1, S.A. entered into an agreement for the sale of the 100% of the share capital of ATENTO CESKÁ REPUBLIKAA.S., which owns its operations in the Czech Republic, with the Italian company COMDATA S.P.A., the transaction was not subjectto regulatory approval.
Acquisition transaction
As at December 30, 2014, the Company, through its wholly owned subsidiary Atento Brasil S.A. acquired 100% of the sharecapital of Casa Bahia Contact Center Ltda. (“CBCC”), a call center services provider located in Brazil, for a total acquisition price of20,343 thousand of reais (equivalent to $7,659 thousand). As a result of the acquisition, the Atento group is expected to strengthen itspresence in the Brazilian market. At December 30, 2014, this company has been renamed as Atento Brasil 1, Ltda (Note 5a).
The goodwill of $4,061 thousand arose from the acquisition, which is attributable to the synergies derived from combining theoperations of the Atento and CBCC. None of the goodwill recognized is expected to be deductible for income tax purposes.
SELECTED FINANCIAL DATA
The following tables present a summary of the consolidated historical financial statements for the periods and as of the datesindicated and should be read in conjunction with the section of this document entitled “Management’s Discussion and Analysis ofFinancial Condition and Results of Operations” , “Selected Historical Financial Information” and audited consolidated financialstatements included elsewhere in this document.
For the year endedDecember 31,
For the year endedDecember 31, Change
(%)
Changeexcluding FX
(%)($ millions) 2013 2014
Revenue 2,341.1 2,298.3 (1.8) 7.7EBITDA (1) 234.0 207.0 (11.5) (0.8)Adjusted EBITDA (unaudited) (1) 295.1 306.4 3.8 13.7Adjusted Earnings (Loss) (unaudited) (2) 85.2 82.7 (2.9) 7.5Adjusted Earnings per share (in U.S. dollars)(unaudited) (3) 1.16 1.12 (2.9) 7.5Capital Expenditures (4) (103.0) (120.1) 16.6 25.9Total debt with third parties 851.2 653.3 (23.2) (12.8)Cash and cash equivalents and short-term financialinvestments 213.5 238.3 11.6 27.3Net debt with third parties (unaudited) (5) 637.7 415.0 (34.9) (26.2)
(1) In considering the financial performance of the business, our management analyzes the financial performance measures ofEBITDA and adjusted EBITDA at a company and operating segment level, to facilitate decision-making. EBITDA is

73
defined as profit/(loss) for the period from continuing operations before net finance costs, income taxes and depreciationand amortization. Adjusted EBITDA is defined as EBITDA adjusted to exclude Acquisition and integration related costs,restructuring costs, sponsor management fees, asset impairments, site-relocation costs, financing and IPO fees, and otheritems which are not related to our core results of operations. EBITDA and adjusted EBITDA are not measures defined byEU-IFRS. The most directly comparable EU-IFRS measure to EBITDA and adjusted EBITDA is profit/(loss) for theperiod from continuing operations.
We believe EBITDA and adjusted EBITDA, as defined above, are useful metrics for investors to understand our results ofcontinuing operations and profitability because they permit investors to evaluate our recurring profitability fromunderlying operating activities. We also use these measures internally to establish forecasts, budgets and operational goalsto manage and monitor our business, as well as to evaluate our underlying historical performance. We believe EBITDAfacilitates comparisons of operating performance between periods and among other companies in industries similar toours because it removes the effect of variation in capital structures, taxation, and non-cash depreciation and amortizationcharges, which may differ between companies for reasons unrelated to operating performance. We believe adjustedEBITDA better reflects our underlying operating performance because it excludes the impact of items which are notrelated to our core results of continuing operations.
EBITDA and adjusted EBITDA measures are frequently used by securities analysts, investors and other interested partiesin their evaluation of companies comparable to us, many of which present EBITDA-related performance measures whenreporting their results.
EBITDA and adjusted EBITDA have limitations as analytical tools. These measures are not presentations made inaccordance with EU-IFRS, are not measures of financial condition or liquidity and should not be considered in isolationor as alternatives to profit or loss for the period from continuing operations or other measures determined in accordancewith EU-IFRS. EBITDA and adjusted EBITDA are not necessary comparable to similarly titled measures used by othercompanies.
See below under the heading “Reconciliation of EBITDA and Adjusted EBITDA to profit/(loss)” for a reconciliation ofprofit/(loss) for the period from continuing operations to EBITDA and adjusted EBITDA.
(2) In considering the Company’s financial performance, our management analyzes the performance measure of adjustedearnings/(loss). Adjusted earnings/(loss) is defined as profit/(loss) for the period from continuing operations adjusted forAcquisition and integration related costs, amortization of Acquisition-related intangible assets, restructuring costs,sponsor management fees, assets impairments, site relocation costs, financing and IPO fees, PECs interest expense, otherand tax effects. Adjusted earnings/(loss) are not a measure defined by EU-IFRS. The most directly comparable EU-IFRSmeasure to adjusted earnings/(loss) is our profit/(loss) for the period from continuing operations.
We believe adjusted earnings/(loss), as defined above, is useful to investors and is used by our management for measuringprofitability because it represents a group measure of performance which excludes the impact of certain non-cash chargesand other charges not associated with the underlying operating performance of the business, while including the effect ofitems that we believe affect shareholder value and in-year return, such as income-tax expense and net finance costs.
Management expects to use adjusted earnings/(loss) to (i) provide senior management a monthly report of our operatingresults that is prepared on an adjusted earnings basis; (ii) prepare strategic plans and annual budgets on the basis ofadjusted earnings; and (iii) review senior management’s annual compensation, in part, using adjusted performancemeasures.
Adjusted earnings/(loss) are defined to exclude items that are not related to our core results of operations. Adjustedearnings/(loss) measures are frequently used by securities analysts, investors and other interested parties in theirevaluation of companies comparable to us, many of which present an adjusted earnings related performance measurewhen reporting their results.
Adjusted earnings/(loss) have limitations as an analytical tool. Adjusted earnings/(loss) is neither a presentation made inaccordance with EU-IFRS nor a measure of financial condition or liquidity, and should not be considered in isolation oras an alternative to profit or loss for the period from continuing operations or other measures determined in accordancewith EU-IFRS. Adjusted earnings/(loss) are not necessarily comparable to similarly titled measures used by othercompanies.
See below for a reconciliation of our adjusted earnings/(loss) to our profit/(loss) for the period from continuingoperations.
(3) Adjusted earnings per share calculated considering 73,619,511 Atento ordinary shares as of December 31, 2014. Theweighted average number of ordinary shares for the year ended December 31, 2014 was not considered in this calculation.

74
Adjusted earnings/(loss) per share is not a measure defined by EU-IFRS. The most directly comparable EU-IFRS measureto adjusted earnings/(loss) per share is our Basic result per share. We believe adjusted earnings/(loss) per share, as definedabove and related to the item (2) Adjusted earnings/(loss) included in this section, is useful to investors, and is used by ourmanagement for measuring profitability.
(4) We defined “capital expenditure” as the sum of the additions to property, plant and equipment and the additions tointangible assets.
(5) In considering our financial condition, our management analyzes net debt with third parties, which is defined as total debtless cash, cash equivalents (net of any outstanding bank overdrafts) and short-term financial investments and non-currentpayables to Atento Group companies (which represent the PECs). In 2013, the PECs were classified as our subordinateddebt relating to our other present and future obligations, and in 2014 they were capitalized in connection with the IPO.Net debt with third parties is not a measure defined by EU-IFRS.
Net debt with third parties has limitations as an analytical tool. Net debt with third parties is neither a measure defined byor presented in accordance with EU-IFRS nor a measure of financial performance, and should not be considered inisolation or as an alternative financial measure determined in accordance with EU-IFRS. Net debt with third parties is notnecessarily comparable to similarly titled measures used by other companies.
See below under the heading “Financing Arrangements” for a reconciliation of Total debt to net debt with third partiesutilizing EU-IFRS reported balances obtained from the financial information. Total debt is the most directly comparablefinancial measure under EU-IFRS.
Reconciliation of EBITDA and Adjusted EBITDA to profit/(loss):
Year ended December 31,($ in millions) 2013 2014
Profit/(loss) for the period from continuing operations (4.0) (42.1)Net finance expense 100.7 110.8Income tax expense 8.3 18.5Depreciation and amortization 129.0 119.8EBITDA (non-GAAP) (unaudited) 234.0 207.0Acquisition and integration related costs(a) 29.3 9.9Restructuring costs(b) 12.8 26.7Sponsor management fees(c) 9.1 7.3Site relocation costs(d) 1.8 1.7Financing and IPO fees(e) 6.1 51.9Asset impairments and Other(f) 2.0 1.9Adjusted EBITDA (non-GAAP) (unaudited) 295.1 306.4
(a) Acquisition and integration costs incurred in 2013 and 2014 are costs associated with the Acquisition and post-Acquisitionprocess targeting primarily financial and operational improvements. For the year ended December 31, 2013, of the $29.3million, $27.9 million are related to professional fees incurred to establish Atento as a standalone company not affiliatedto Telefónica. These projects are mainly related to full strategy review including growth implementation plan andoperational set-up with a leading consulting firm ($14.7 million), improvement of financial and cash flow reporting ($5.9million), improving the efficiency in procurement ($4.8 million) and headhunting fees related primarily to strengtheningthe senior management team post-Acquisition ($1.4 million). Acquisition and integration related cost incurred for the yearended December 31, 2014 primarily resulted from consulting fees incurred in connection with the full strategy reviewincluding our growth implementation plan and operational set-up with a leading consulting firm ($4.0 million), improvingthe efficiency in procurement ($2.3 million), and IT transformation projects ($2.5 million). These projects havesubstantially been completed by the end of 2014.
(b) Restructuring costs incurred in 2013 and 2014 primarily included a number of restructuring activities and other personnelcosts that were not related to our core result of operations. For the year ended December 31, 2013, $8.6 million of ourrestructuring costs were related to the relocation of corporate headquarters and severance payments directly related to theAcquisition. In addition in 2013, we incurred in restructuring costs in Spain of $1.5 million (relating to restructuring

75
expenses incurred as a consequence of significant reduction in activity levels as a result of adverse market conditions inSpain), and in Chile of $1.4 million (relating to restructuring expenses incurred in connection with the implementation ofa new service delivery model with Telefónica). Restructuring costs incurred for the year ended December 31, 2014, areprimarily related to headcount restructuring activities in Spain. In addition, we incurred restructuring costs not related toour core results of operations in Argentina and Peru of $4.8 million related to the restructuring of specific operations,Chile of $2.5 million related to restructuring expenses incurred in connection with the implementation of a new servicedelivery model with Telefónica, and in connection with certain changes to the executive team, and an additional $0.7million related to the relocation of corporate headquarters.
(c) Sponsor management fees represent the annual advisory fee paid to Bain Capital Partners, LLC that are expensed duringthe period presented. These fees have ceased following the offering.
(d) Site relocation costs incurred for the year ended December 31, 2013 and 2014 include costs associated with our currentstrategic initiative of relocating call centers from tier 1 cities to tier 2 cities in Brazil in order to get efficiencies throughrental cost reduction and attrition and absenteeism improvement.
(e) Financing and IPO fees for the year ended December 31, 2013 primarily relate to professional fees incurred in 2013 inconnection with the issuance of the Senior Secured Notes and to pay financial advisory fees. Financing fees and IPO feesfor the year ended December 31, 2014 primarily relate to fees incurred in connection with the IPO process includingadvisory, auditing and legal expenses among others. These fees have ceased in 2014.
(f) Asset impairment and other costs for the year ended December 31, 2013 relates to charges associated to projects forinventory control in Brazil which are not related to our core results of operations. Asset impairment and other costincurred for the year ended December 31, 2014, mainly relate to the goodwill and other intangible asset impairmentrelating to our operation in Czech Republic of $3.7 million and Spain of $28.8 million and other non-recurrent costs of$4.6 million during the year ended December 31, 2014, primarily related to a Revenue adjustment in Spain ($2.4 million)and a one off tax penalty in Colombia ($1.3 million), offset by the amendment of the MSA with Telefónica by which theminimum revenue commitment for Spain was reduced against a $34.5 million penalty fee compensated by Telefónica.
Reconciliation of adjusted earnings/(loss) to profit/(loss):
The following table reconciles our adjusted earnings/(loss) to our profit/(loss) for the period from continuing operations:
Year ended December 31,($ in millions) 2013 2014
Profit/(loss) attributable to equity holders of the parent (4.0) (42.1)Acquisition and integration related costs (a) 29.3 9.9Amortization of Acquisition related Intangible assets (b) 40.7 36.6Restructuring costs (c) 12.8 26.7Sponsor management fees (d) 9.1 7.3Site relocation costs (e) 1.8 1.7Financing and IPO fees (f) 6.1 51.9PECs interest expense (g) 25.7 25.4Asset impairments and Other (h) 2.0 1.9DTA adjustment in Spain (i) - 9.8Tax effect (j) (38.3) (46.4)Adjusted earnings /(loss) (non-GAAP) (unaudited) 85.2 82.7Adjusted earnings/(loss) per share - Basic (in U.S. dollars) (unaudited) (k) 1.16 1.12Adjusted earnings/(loss) per share - Diluted (in U.S. dollars) (unaudited) (k) 1.16 1.12
(a) Acquisition and integration costs incurred in 2013 and 2014 are costs associated with the Acquisition and post financialand operational improvements. For the year ended December 31, 2013, of the $29.3 million, $27.9 million are related toprofessional fees incurred to establish Atento as a standalone company not affiliated to Telefónica. These projects aremainly related to full strategy review including growth implementation plan and operational set-up with a leadingconsulting firm ($14.7 million), improvement of financial and cash flow reporting ($5.9 million), improving the efficiency

76
in procurement ($4.8 million) and headhunting fees related primarily to strengthening the senior management team post-Acquisition ($1.4 million). Acquisition and integration related cost incurred for the year ended December 31, 2014primarily resulted from consulting fees incurred in connection with the full strategy review including our growthimplementation plan an operational set-up with a leading consulting firm ($4.0 million), improving the efficiency inprocurement ($2.3 million), and IT transformation projects ($2.5 million). These projects have substantially beencompleted by the end of 2014.
(b) Amortization of Acquisition related intangible assets represents the amortization expense of intangible assets resultingfrom the Acquisition and has been adjusted to eliminate the impact of the amortization arising from the Acquisition whichis not in the ordinary course of our daily operations and distorts comparison with peers and results for prior periods. Suchintangible assets primarily include contractual relationships with customers, for which the useful life has been estimated atprimarily nine years.
(c) Restructuring costs incurred in 2013 and 2014 primarily included a number of restructuring activities and other personnelcosts that were not related to our core result of operations. For the year ended December 31, 2013, $8.6 million of ourrestructuring costs were related to the relocation of corporate headquarters and severance payments directly related to theAcquisition. In addition in 2013, we incurred in restructuring costs in Spain of $1.5 million (relating to restructuringexpenses incurred as a consequence of significant reduction in activity levels as a result of adverse market conditions inSpain), and in Chile of $1.4 million (relating to restructuring expenses incurred in connection with the implementation ofa new service delivery model with Telefónica). Restructuring costs incurred for the year ended December 31, 2014, areprimarily related to headcount restructuring activities in Spain. In addition, we incurred restructuring costs not related toour core results of operations in Argentina and Peru of $4.8 million related to the restructuring of specific operations,Chile of $2.5 million related to restructuring expenses incurred in connection with the implementation of a new servicedelivery model with Telefónica, and in connection with certain changes to the executive team, and an additional $0.7million related to the relocation of corporate headquarters.
(d) Sponsor management fees represent the annual advisory fee paid to Bain Capital Partners, LLC that are expensed duringthe period presented. These fees have ceased in following the offering.
(e) Site relocation costs incurred for the year ended December 31, 2013 and 2014 include costs associated with our currentstrategic initiative of relocating call centers from tier 1 cities to tier 2 cities in Brazil in order to get efficiencies throughrental cost reduction and attrition and absenteeism improvement.
(f) Financing and IPO fees for the year ended December 31, 2013 primarily relate to professional fees incurred in 2013 inconnection with the issuance of the Senior Secured Notes and to pay financial advisory fees. Financing fees and IPO feesfor the year ended December 31, 2014 primarily relate to fees incurred in connection with the IPO process includingadvisory, auditing and legal expenses among others. These fees have ceased in 2014.
(g) PECs Interest expense represents accrued interest on the preferred equity certificates that were capitalized in connectionwith the IPO.
(h) Asset impairment and other costs for the year ended December 31, 2013 relates to charges associated to projects forinventory control in Brazil which are not related to our core results of operations. Asset impairment and other costincurred for the year ended December 31, 2014, mainly relate to the goodwill and other intangible asset impairmentrelating to our operation in Czech Republic of $3.7 million and Spain of $28.8 million and other non-recurrent costs of$4.6 million during the year ended December 31, 2014, primarily related to a revenue adjustment in Spain ($2.4 million)and a one off tax penalty in Colombia ($1.3 million), offset by the amendment of the MSA with Telefónica by which theminimum revenue commitment for Spain was reduced against a $34.5 million penalty fee compensated by Telefónica.
(i) Deferred tax asset adjustment as a consequence of the tax rate reduction in Spain from 30% to 28% in 2015 and to 25% in2016.
(j) The tax effect represents the tax impact of the total adjustments based on a tax rate of 30.0% for 2013 and 39.5% for theyear ended December 31, 2014. The adjustments for the year ended December 31, 2014 include $43.8 million of IPO feesthat are not deductible and $9.8 million of DTA adjustments that are both excluded from the adjustments base for taxeffect calculation.
(k) The adjusted earnings/(loss) per share, for the period presented in the table above, were calculated considering the numberof ordinary shares of 73,619,511 as of December 31, 2014.
Financing Arrangements

77
As of December 31,2013 2014
Debt:7.375% Senior Secured Notes due 2020 297.7 300.3Brazilian Debentures 345.9 245.9Vendor Loan Note (1) 151.7 -Contingent Value Instrument 43.4 36.4Preferred Equity Certificates 519.6 -Finance lease payables 11.9 9.0Other borrowings 0.6 61.7
Total Debt 1,370.8 653.3Preferred Equity Certificates (519.6) -
Total Debt excluding PECs 851.2 653.3Cash and cash equivalents (213.5) (211.4)Short term financial investments - (26.9)Net Debt with third parties (non-GAAP) (unaudited) (2) 637.7 415.0
Adjusted EBITDA (non-GAAP) for the period (unaudited) 295.1 306.4
Net Debt with third parties/Adjusted EBITDA (non-GAAP) (unaudited) 2.2x 1.4x
(1) Reflects the prepayment to Telefónica of the entire indebtedness under the Vendor Loan Note.(2) In considering our financial condition, our management analyzes net debt with third parties, which is defined as total debt less cash, cash
equivalents, and short-term financial investments. Net debt is not a measure defined by EU-IFRS and it has limitations as an analytical tool. Netdebt is neither a measure defined by or presented in accordance with EU-IFRS nor a measure of financial performance, and should not beconsidered in isolation or as an alternative financial measure determined in accordance with EU-IFRS. Net debt is not necessarily comparable tosimilarly titled measures used by other companies.
(3) Adjusted EBITDA LTM is defined as EBITDA adjusted to exclude Acquisition and integration related costs, restructuring costs, sponsormanagement fees, asset impairments, site-relocation costs, financing fees, IPO costs and other items, which are not related to our core results ofoperations for the last twelve months.
(4) Net Debt/Adjusted EBITDA LTM is defined as Net debt divided by adjusted EBITDA LTM, as defined above.Net debt/Adjusted EBITDA LTM has limitations as an analytical tool. Net debt/Adjusted EBITDA LTM is neither a measure defined by orpresented in accordance with EU-IFRS nor a measure of financial performance, and should not be considered in isolation or as an alternativefinancial measure determined in accordance with EU-IFRS. Net debt/Adjusted EBITDA LTM is not necessarily comparable to similarly titledmeasures used by other companies.
As of December 31, 2014 we were in compliance with the terms of all our covenants.
MANAGEMENT’S DISCUSSION AND ANALYSIS OF FINANCIAL CONDITION AND RESULTS OF OPERATIONS
The “Management’s Discussion and Analysis of Financial Condition and Results of Operations” is based upon the auditedconsolidated financial statements of Atento as of and for the year ended December 31, 2013 and 2014 prepared in accordance withEU-IFRS, included elsewhere in this annual report,

78
The discussion contained in this “Management’s Discussion and Analysis of Financial Condition and Results of Operations”is solely with respect to Atento, and all references in this section of this quarterly report to “we,” “us” and “our” refer to AtentoGroup, unless otherwise stated.
EU-IFRS differs in certain significant respects from U.S. GAAP. Potential investors should consult their own professionaladvisors for an understanding of the differences between U.S. GAAP and EU-IFRS and how these differences might affect thefinancial statements and information herein.
The following discussion contains forward—looking statements. Our actual results could differ materially from those that arediscussed in these forward—looking statements. Factors which could cause or contribute to such differences include, but are notlimited to, those discussed below and elsewhere in this report.
The Company’s strategy
Our mission is to help make our clients successful by delivering the best experience for their customers. Our goal is tosignificantly outperform the expected market growth by being our clients’ partner of choice for customer experience while obtainingmargin efficiencies. We have laid out a clear strategy and a number of initiatives around 3 key pillars to bring Atento to its fullpotential: transformational growth, best in class operations and inspiring people. In 2014, the focused execution of our strategy hasresulted in very significant achievements in the year across these three pillars of our strategy positioning Atento for sustained growthand strong value creation potential for our shareholders.
Above-Market Growth
We are focused on delivering increasingly complex solutions and value-added services to our clients through multiple channelsto address a larger portion of our clients spend, whilst building even more sticky relationships and achieving higher profitability. Overtime, we have diversified and expanded our services, increased their sophistication and complexity and developed customizedsolutions such as smart collections, B2B (business-to-business) efficient sales, insurance management, credit management and otherCRM BPO processes. Our revenue from these solutions has grown faster than our overall revenue over the past several years. In 2014,we increased the share of our solutions penetration to over 23%, up 1.4 percentage points year-on-year.
Further, we are also aggressively growing outside of Telefónica and continue winning new client relationships, either fromcompetitors or as potential clients outsource their in-house operations. In particular, we have made this year substantial progress in thetelecommunications sector, as major telcos seek partnering with us now that we are an independent company as a result of our strongsector credentials. Today, we provide solutions to most of the telecommunications companies in Brazil and have been awardedcontracts with a leading LatAm regional telecommunication company in five countries. Going forward, we are focused on growingthese new relationships to scale.
Further, the market for providing outsourcing services to U.S. clients from Latin America is a sizable and fast-growingopportunity as (i) companies in the United States seek to balance outsourcing services across different geographies, generally favoringlocations with better cultural fit and proximity to their operations, while minimizing time zone differences (in particular compared tojurisdictions such as India and the Philippines), (ii) Latin America becomes a more cost-competitive location and (iii) the talent poolin the region grows, with more people who have strong English-language skills. In 2014, we continued to successfully ramp-up ournearshore operation. We have formed a dedicated business unit with its own infrastructure to exclusively serve the U.S. market which,as of December 2014, had approximately 500 workstations servicing five clients including one of the leading mobile devicesmanufacturers, one of the leading in financial services group in Mexico and one of the leading global travel companies. We believeour strong relationships with multi-national clients throughout Latin America positions us well to also serve their off-shoring needs inthe United States as exemplified by our near-shoring relationships.
Best-In-Class Operations

79
We are also seeing the benefits of the acceleration of the implementation of our operational transformational initiatives toexpand margins.
We have made significant investments in infrastructure, proprietary technologies, management and development processes thatcapitalize on our extensive experience managing large and globalized operations. Our operational excellence strategy is supported bythe following five key global initiatives:
Enhance Operations Productivity. We are focused on a variety of initiatives to enhance agent productivity. We haveestablished in 2014 an Operational Command Center in Sao Paulo, Brazil which is designed to streamline the efficiency of ouroperations across our delivery centers and optimize corporate functionality and management effectiveness via a standardized set ofenhanced processes and capabilities. This center is equipped with the technology available for our purposes and serves to enhance ourability to shift resources as needed, in real-time, based on client requirements. Additionally, it provides our management immediateanalytics and continuous data enabling them to streamline processes that we expect will offer the optimal customer experience for ourclients. Our focus on productivity improvements throughout the year resulted in our billable vs. payable increasing in the year by 2.7percentage points for the group.
Increase HR Effectiveness. Our business model is focused on improving operations HR effectiveness, developing our peopleand reducing turnover, driving both performance and reduction in costs. Recruiting, selecting and training talent is a key factor in thesuccessful delivery of our CRM BPO services and solutions. The roll-out of these initiatives helped us reduced our turnover ratios in 1percentage point for the group.
Deploy One Procurement. We are strengthening our centralized procurement model in order to lower costs and streamlinesupplier relationships. Our “Global Deal Delivered Locally” strategy allows us to work with vendors to reach global contracts, whileallowing procurement decisions to be handled locally. The implementation of a global centralized procurement model in the year hasallowed us to reduced overall costs, allowing us to achieve over 15% of savings in key categories addressed in 2014. We arecontinuing to deploy this procurement strategy across our business, including in our procurement of infrastructure, technology,telecommunications and professional services, to reduce operating costs and improve margins.
Drive Consistent and Efficient IT Platform. Our technology strategy is focused on (i) delivering a cost-efficient and reliableIT infrastructure to meet the needs of existing clients and support margin expansion, (ii) enhancing our ability to add capacity rapidlywith a highly variable cost structure for new business, (iii) developing new products and solutions that can be rapidly scaled and rolledout across geographies, (iv) providing standard operational tools and processes to enable the best experience to our clients’ customers,and (v) establishing common platforms that facilitate centralization of core IT services. Technology initiatives to capture benefits ofscale, standardization, and consolidation are managed globally, with full accountability by project leaders to continuously optimizeour operations and innovate client solutions.
Optimize Site Footprint. We continue to relocate a portion of our delivery centers from tier 1 to tier 2 cities, as we seek tooptimize lease expenses and reduce employee benefit expenses by focusing on reducing turnover and absenteeism. Additionally, therelocation of delivery centers allows us to access and attract new and larger pools of talent in locations where Atento is considered areference employer. We have completed several successful site transfers in Brazil. In Brazil, the percentage of total workstationslocated in tier 2 cities increased from 44% in 2011 to 53% in 2014. We have completed several successful site transfers in Brazil,Colombia and Argentina. As demand for our services and solutions grows and their complexity continues to increase, we continue toevaluate and adjust our site footprint to create the most competitive combination of quality of service and cost effectiveness.
In addition, given the size of our workforce, our operational excellence strategy is targeted at supporting the future growth ofour business and delivering efficiency gains while mitigating costs in particular wage inflation in the markets where we operate.
Inspiring People
We believe that our people are a key enabler to our business model and a strategic pillar to our competitive advantage. We havecreated, and constantly reinforce, a culture we believe is unique in the industry. We have developed processes to identify talent (bothinternally and externally), created individualized development plans and designed incentive plans that foster a work environment thataligns our management’s professional development with client objectives and our goals, including efficiency objectives, financialtargets and client and employee satisfaction metrics. We have implemented a new operating model that integrates the corporateorganization globally, allowing us to capture the benefits of scale, standardization and sharing of best practices. The corporateorganization is integrated globally but strategically segmented into different operating regions. We believe that this new organizationalstructure will foster agility and simplicity, while ensuring that corporate leaders are focused on coordinating, communicating andpursuing new solutions and innovation, with full accountability on the results. In 2014, we completed the relocation of ourheadquarters to be closer to our operations. We also continue to receive industry recognition for the strong culture and workplace

80
environment we promote across our organization. For the second year in a row, we have been recognized as one of the 25 BestMultinational Workplaces by GPTW.
Integrated Solutions and Client Value Proposition
We have based our strategy of future growth on certain assumptions regarding our industry, legal framework, services andfuture demand in the market for such services. However, the trend to outsource business processes may not continue and could bereversed by factors beyond our control, including negative perceptions attached to outsourcing activities or government regulationsagainst outsourcing activities. Current or prospective clients may elect to perform such services in-house to avoid negative perceptionsthat may be associated with using an off-shore provider. Political opposition to CRM BPO or outsourcing activities may also arise incertain countries if there is a perception that CRM BPO or outsourcing activities have a negative effect on employment opportunities.
Our value proposition has continued to evolve toward end-to-end CRM BPO solutions, incorporating processes, technologyand analytics as enablers for our services, all aimed at improving our clients’ efficiency and reducing costs. In 2014, CRM BPOsolutions and individual services comprised approximately 23.2% and 76.8% of group revenues, respectively. For our clients in Brazil,our largest market, approximately 64.7% of our revenue was contributed by individual services and approximately 35.3% fromsolutions, for the year ended December 31, 2014. This represents significant growth for the Brazilian CRM BPO services segmentwhich accounted for 16% of Brazilian revenue in 2011.
In 2014, approximately 68% of our revenues came from sales and customer service.
Our Clients
Over the years, we have experienced steady growth in our client base, gaining new clients year-on-year, resulting in what webelieve is a world-class roster of clients across industry sectors. Our long-standing, blue-chip client base spans across a variety ofindustries and includes names such as Telefónica Group, Banco Bradesco S.A., Banco Santander S.A., HSBC, Samsung, andWhirlpool, among others. Our clients are leaders in their respective industries and demand best-in-class service from their outsourcingpartners. We serve clients primarily in the telecommunications and financial services sectors, and in multi-sector including consumergoods, services, public administration, pay TV, healthcare, transportation, technology and media. For the year ended December 31,2014, our revenue from sales to clients in telecommunications, financial services and multi-sector industries, corresponded to 49.1%,35.2% and 15.7% of total revenue, respectively.
For December 31, 2014, our top 15 client groups accounted for 82.1% of our revenue and, excluding the Telefónica Groupcompanies, our next 15 client groups accounted for 36.0% of our revenue. In calculating these percentages, we treated each member ofthe same corporate group as one client. With each of these, we have worked closely over many years across multiple countries,building strong partnerships and commercial relationships with these clients.
Overview
Atento is the largest provider of customer-relationship management and business-process outsourcing (“CRM BPO”) servicesand solutions in Latin America and Spain, and among the top three global providers, by revenue. Atento’s tailored CRM BPOsolutions are designed to enhance each client’s ability to deliver a high-quality product by creating a best-in-class experience for theircustomers, enabling our clients to focus on operating their core businesses. Atento utilizes its expertise in its industry and in itscustomer care operations, combined with a consultative approach, to offer superior and scalable solutions across the entire value chainfor customer care, each solution being customized for the individual client’s needs and sophistications.
Atento offers a comprehensive portfolio of customizable, and scalable, solutions comprising front-end and back-end servicesranging from sales, applications-processing, customer care and credit-management. From our suite of products and value-addedservices, we derive embedded and integrated industry-tailored solutions for a large and diverse group of multi-national companies.Our solutions to our base of over 400 clients are delivered by over 154,000 of our highly engaged customer care specialists andfacilitated by our best-in-class technology infrastructure and multi-channel delivery platform. We believe we bring a differentiatedcombination of scale, capacity for processing customer transactions and industry expertise to our clients’ customer care operations,which allow us to provide higher-quality customer care services more cost-effectively than our clients could deliver on their own.
Our number of workstations increased from 79,197 as of December 31, 2013 to 86,071 workstations as of December 31, 2014.Since we lease all of our call center facilities, which increases our operating expenses and does not result in a depreciation expense,

81
our EBITDA performance has historically differed from competitors who own their buildings and equipment, as related financingshave generally resulted in higher depreciation expenses for those competitors and have increased such competitors EBITDA.
We are continuing to relocate a portion of our delivery centers from Tier 1 to Tier 2 cities, which tend to be smaller, moreaffordable locations, as we seek to optimize lease expenses and reduce employee benefit expenses by focusing on reducing turnoverand absenteeism. Additionally, the relocation of delivery centers allows us to access and attract new and larger pools of talent inlocations where Atento is considered a reference employer. We have completed several successful site transfers in Brazil, Colombiaand Argentina. In Brazil, the percentage of total workstations located in tier 2 cities decreased 1 percentage point, from 54% for theyear ended December 31, 2013 to 53% for the year ended December 31, 2014, due to an specific client requirement to operate in aTier 1 city, and the implementation of new delivery centers in Brazil in Tier 2 cities, postponed to the first quarter of 2015. As demandfor our services and solutions grows, and their complexity continues to increase, we continue to evaluate and adjust our site footprintto create the most competitive combination of quality of service and cost effectiveness.
During the last years, our infrastructure has grown in response to a substantial increase in demand for our services from ourclients. As of December 31, 2014, we had 86,071 workstations globally, with 44,061 in Brazil, 34,498 in the Americas (excludingBrazil) and 7,512 in EMEA. As of December 31, 2013, we had 79,197 workstations globally, with 39,744 in Brazil, 31,534 in theAmericas (excluding Brazil) and 7,919 in EMEA. As of December 31, 2014, we had 93 delivery centers globally, 29 in Brazil, 45 inthe Americas (excluding Brazil) and 19 in EMEA. As of December 31, 2013, we had 93 delivery centers globally, 26 in Brazil, 46 inthe Americas (excluding Brazil) and 21 in EMEA.
The following table shows the number of delivery centers and workstations in each of the jurisdictions in which we operated asat December 31, 2013 and 2014.
Number of Workstations Number of Service DeliveryCenters (1)
2013 2014 2013 2014Brazil 39,744 44,061 26 29Americas 31,534 34,498 46 45Argentina(2) 3,959 3,820 12 11Central America(3) 1,666 2,983 3 3Chile 3,467 2,398 3 2Colombia 4,791 5,827 6 6Mexico 9,143 9,812 17 17Peru 7,387 8,493 2 3United States(4) 1,121 1,165 3 3EMEA 7,919 7,512 21 19Czech Republic(5) 592 - 3 -Morocco 1,941 2,046 4 4Spain 5,386 5,466 14 15Total 79,197 86,071 93 93
(1) Includes service delivery centers at facilities operated by us and those owned by our clients where we provide operations personnel andworkstations.
(2) Includes Uruguay.(3) Includes Guatemala and El Salvador.(4) Includes Puerto Rico.(5) Operations in Czech Republic were divested in 2014.
During 2014, the revenue generated from our fifteen largest client groups (including the Telefonica Group) represented 82.1% ofour revenue as compared to 84.2% of our revenue for the same period in 2013. Excluding revenue generated from the TelefónicaGroup, our next 15 largest client groups represented in aggregate 36.0% of our revenue for the year ended December 31, 2014 ascompared to 36.2% of our revenue in the same period for 2013.
Our vertical industry expertise in telecommunications, financial services and multi-sector companies allows us to adapt ourservices and solutions for our clients, further embedding us into their value chain while delivering effective business results andincreasing the portion of our client’s services related to CRM BPO. In the year ended December 31, 2014, CRM BPO solutions andindividual services comprised approximately 23.2% and 76.8% of our revenues, respectively. For the same period in 2013, CRM BPO

82
solutions and individual services comprised approximately 21.8% and 78.2% of our revenues, respectively. For the same period in2013, CRM BPO solutions and individual services comprised approximately 22.1% and 77.9% of our revenues, respectively.
The percentage of solutions and individual services for the year ended December 31, 2013, representing approximately 23% and77% of group revenues, respectively, were misreported and should have amounted to 21.8% and 78.2% as disclosed in the paragraphabove.
During the year of 2014, telecommunications represented 49.1% of our revenue and financial services represented 35.2% of ourrevenue, compared to 52% and 35%, respectively, for the same period in 2013. Additionally, during 2014 and 2013 sales by servicewere represented as follows:
Year ended December 31,2013 2014
Customer Service 50.1% 49.8%Sales 18.7% 18.2%Collection 10.3% 10.8%Back Office 8.6% 8.8%Technical Support 9.8% 9.6%Others 2.5% 2.8%Total 100.0% 100.0%
Average headcount
The average headcount in the Atento Group in 2013 and 2014 and the breakdown by country is as follow:
Average headcount2013 2014
Brazil 86,413 82,702Central America 4,051 4,161Chile 3,883 4,703Colombia 5,400 6,274Spain 13,830 12,121Morocco 1,544 1,367Mexico 18,823 20,033Peru 10,561 12,874Puerto Rico 763 706United States 405 419Czech Republic 933 673Argentina and Uruguay 9,151 8,062Corporate 75 81Total 155,832 154,176
Revenue by country

83
Year ended December 31,($ in millions) 2013 2014CountrySpain 327.3 306.6Morocco 20.9 18.4Czech Republic 14.6 9.5Other and eliminations (*) 0.3 0.3EMEA 363.1 334.8Argentina 198.7 151.9Chile 68.5 79.3Colombia 65.7 69.5El Salvador 12.8 13.9United States 20.1 20.7Guatemala 14.4 15.3Mexico 265.2 275.0Peru 102.2 131.8Puerto Rico 14.9 12.8Uruguay 9.6 8.0Panama 0.1 0.8Other and eliminations (*) 0.5 0.4Americas 772.7 779.4Brazil 1,206.1 1,184.8Other and eliminations (*) (0.8) (0.7)Total revenue 2,341.1 2,298.3
(*) Includes revenue holding-company level as well as consolidation adjustments.
Divestment transaction
On December 9, 2014, Atento S.A. through its indirect subsidiary, Atento Spain Holdco, S.L.U., a sole-shareholder subsidiary ofAtento Luxco 1, S.A. entered into an agreement for the sale of the 100% of the share capital of ATENTO CESKÁ REPUBLIKA A.S.,which owns its operations in the CZECH REPUBLIC, with the Italian company COMDATA S.P.A.
This transaction allows Atento to continue strengthening the focus on its core markets encompassing the Pan LatAm region aswell as Spain and Morocco in the EMEA region.
Income Statement for the period ended December 31, 2013 and 2014
($ in millions, except percentage changes)For the year ended
December 31,For the year ended
December 31, Change(%)
ChangeexcludingFX (%)2013 2014

84
Revenue 2,341.1 2,298.3 (1.8) 7.7Other operating income 4.4 4.6 4.5 8.7Own work capitalized 0.9 0.5 (44.4) (32.5)Other gains - 35.1 N.M. N.M.Operating expenses:Supplies (115.3) (104.8) (9.1) 0.2Employee benefit expense (1,643.5) (1,636.4) (0.4) 9.3Depreciation and amortization (129.0) (119.8) (7.1) (0.3)Changes in trade provisions 2.0 1.7 (15.0) (10.1)Other operating expenses (355.6) (360.2) 1.3 9.2Impairment charges - (31.8) N.M. N.M.Total operating expenses (2,241.4) (2,251.3) 0.4 9.7
Operating profit/(loss) 105.0 87.2 (17.0) (1.3)
Finance income 17.8 58.3 N.M. N.M.Finance costs (135.1) (135.7) 0.4 5.8Net foreign exchange gain/(loss) 16.6 (33.4) N.M. N.M.Net finance expense (100.7) (110.8) 10.0 17.4
Profit/(loss) before tax 4.3 (23.6) N.M. N.M.
Income tax expense (8.3) (18.5) 122.9 N.M.Profit/(loss) for the period (4.0) (42.1) N.M. N.M.Profit/(loss) for the period from continuing operations (4.0) (42.1) N.M. N.M.Profit after tax from discontinued operations - - N.M. N.M.Non-controlling interests - - N.M. N.M.
Profit/(loss) for the period attributable to equity holders of theparent (4.0) (42.1) N.M. N.M.
Other financial data:EBITDA(1) (unaudited) 234.0 207.0 (11.5) (0.8)Adjusted EBITDA(1) (unaudited) 295.1 306.4 3.8 13.7
(1) For reconciliation with EU-IFRS as issued by the IASB, see section ‘Reconciliation of EBITDA and Adjusted EBITDA to profit/(loss)’ above.N.M. means not meaningful.
ChangeexcludingFX (%)
($ in millions, except percentage changes)For the year ended
December 31,2013
For the year endedDecember 31,
2014Change
(%)
Revenue:Brazil 1,206.1 1,184.8 (1.8) 7.5Americas 772.7 779.4 0.9 15.3EMEA 363.1 334.8 (7.8) (7.7)Other and eliminations(1) (0.8) (0.7) (12.5) (50.0)Total revenue 2,341.1 2,298.3 (1.8) 7.7

85
Operating expense:Brazil (1,113.6) (1,081.6) (2.9) 6.3Americas (705.9) (718.9) 1.8 16.7EMEA (365.2) (381.8) 4.5 4.7Other and eliminations(1) (56.7) (69.0) 21.7 22.4Total operating expenses (2,241.4) (2,251.3) 0.4 9.7Operating profit/(loss):Brazil 94.8 103.5 9.2 19.3Americas 67.6 64.3 (4.9) 5.5EMEA (0.1) (45.6) N.M. N.M.Other and eliminations(1) (57.3) (35.0) (38.9) (38.6)Total operating profit 105.0 87.2 (17.0) (1.3)Net finance expense:Brazil (43.9) (42.9) (2.3) 7.1Americas (3.9) (14.7) N.M. N.M.EMEA (18.4) (13.6) (26.1) (26.1)Other and eliminations(1) (34.5) (39.6) 14.8 14.8Total net finance expense (100.7) (110.8) 10.0 17.4Income tax expense:Brazil (17.7) (22.3) 26.0 37.9Americas (19.3) (19.7) 2.1 11.9EMEA 7.8 15.4 97.4 96.2Other and eliminations(1) 20.9 8.1 (61.2) (61.2)Total income tax expense (8.3) (18.5) 122.9 N.M.Profit/(loss) for the period:Brazil 33.2 38.3 15.4 26.2Americas 44.4 29.9 (32.7) (28.8)EMEA (10.7) (43.8) N.M. N.M.Other and eliminations(1) (70.9) (66.5) (6.2) (6.1)Profit/(loss) for the period (4.0) (42.1) N.M. N.M.Other financial data:EBITDA(2):Brazil 150.7 158.8 5.4 15.3Americas 115.3 107.2 (7.0) 2.2EMEA 24.3 (25.1) N.M. N.M.Other and eliminations(1) (56.3) (33.9) (39.8) (39.5)Total EBITDA (unaudited) 234.0 207.0 (11.5) (0.8)Adjusted EBITDA(2):Brazil 161.1 172.1 6.8 16.9Americas 118.4 117.7 (0.6) 10.7EMEA 26.7 26.4 (1.1) (1.2)Other and eliminations(1) (11.1) (9.8) (11.7) (9.9)Total Adjusted EBITDA (unaudited) 295.1 306.4 3.8 13.7
(1) Includes revenue and expenses at the holding-company level (such as corporate expenses and Acquisition related expenses), as applicable, as well as consolidationadjustments.(2) For a reconciliation with EU-IFRS as issued by the IASB, see section ‘Reconciliation of EBITDA and Adjusted EBITDA to profit/(loss)’.N.M. means not meaningful.
Year Ended December 31, 2014 Compared to the Year Ended December 31, 2013
Revenue
Revenue decreased by $42.8 million, or 1.8%, from $2,341.1 million for the year ended December 31, 2013 to $2,298.3 millionfor the year ended December 31, 2014. Excluding the impact of foreign exchange, revenue increased by 7.7% driven primarily by astrong performance in Brazil and the Americas, largely offsetting the reduction in EMEA. Revenue in Brazil and the Americas,combined, increased 10.5% excluding the impact of foreign exchange.

86
Revenue from Telefónica, excluding the impact of foreign exchange, increased by 4.4%, driven primarily by a strongperformance in the Americas, in particular, in Chile due to the finalization of the implementation of a new business model, in Peru asa result of the increase in offshore business from Argentina, in addition to price adjustments in Argentina. This positive performancein the Americas largely offset the reduction in EMEA caused by the adverse Telefónica situation in the Spanish telecom sector.Excluding the impact of foreign exchange, revenue from non-Telefónica clients increased by 10.8% due to the strong double digitgrowth in all regions. As of the end of the year, non-Telefónica revenue represented 53% of total revenue, an increase of 2 percentagepoints over the prior year. We have continued to increase our revenue diversification from Telefónica with significant customer winsin the telecommunication sector in Brazil and multisector segments, and higher volumes with current clients, primarily in the financesector. Strong growth in the Americas was driven by Peru, Colombia, Mexico and Argentina. In EMEA lower revenues withTelefónica were partially offset by a healthy performance in the non-Telefónica sector driven by higher activity with existing clients,in addition to new clients wins.
The following chart sets forth a breakdown of revenue based on geographical region for the year ended December 31, 2013 andDecember 31, 2014 and as a percentage of revenue and the percentage change between those periods with and net of foreign exchangeeffects.
For the year ended December 31,
($ in millions, except percentage changes) 2013 (%) 2014 (%)Change
(%)
ChangeexcludingFX (%)
Brazil 1,206.1 51.5 1,184.8 51.6 (1.8) 7.5Americas 772.7 33.0 779.4 33.9 0.9 15.3EMEA 363.1 15.5 334.8 14.6 (7.8) (7.7)Other and eliminations(1) (0.8) - (0.7) (0.1) (12.5) (50.0)Total 2,341.1 100.0 2,298.3 100.0 (1.8) 7.7
(1) Includes holding company level revenues and consolidation adjustments.
Brazil
Revenue in Brazil for the year ended December 31, 2013 and December 31, 2014 was $1,206.1 million and $1,184.8 million,respectively. Revenue decreased in Brazil by $21.3 million, or 1.8%. Excluding the foreign-exchange impact, revenue increased by7.5% over this period. Excluding the impact of foreign exchange, revenue from Telefónica increased by 2.8%, principally due to theintroduction of new services in Brazil. Revenue from non-Telefónica clients, excluding the impact of foreign exchange, increased by11.0% over this period, mainly due to volume growth and the introduction of new services with existing clients, driven by thefinancial sector, in addition to significant customer wins in the telecom sector where we now provide services to all major operators.
Americas
Revenue in the Americas for the year ended December 31, 2013 and December 31, 2014 was $772.7 million and $779.4 million,respectively. Revenue increased in the Americas by $6.7 million, or 0.9%. Excluding the impact of foreign exchange, revenueincreased by 15.3%. Excluding the impact of foreign exchange, revenue from Telefónica increased by 19.2% over this period, withstrong performance across the region and in particular in Chile due to the positive impact of the implementation of the new businessmodel with Telefónica and in Peru due to the increase in offshore business from Argentina. Excluding the impact of foreign exchange,revenue from non-Telefónica clients increased by 11.7%, with strong growth in most markets supported by new and existing clients,particularly in Peru, Colombia, Mexico and Argentina, driven by increased pricing.
EMEA
Revenue in EMEA for the year ended December 31, 2013 and December 31, 2014 was $363.1 million and $334.8 million,respectively. Revenue decreased in EMEA by $28.3 million, or 7.8%. Excluding the foreign exchange impact, revenue decreased by7.7%. Excluding the foreign exchange impact, revenue from Telefónica decreased by 14.8% principally due to a decrease in thevolume of customer sales in Spain, driven by the adverse Telefónica situation in the Spanish telecommunications market. Revenuefrom non-Telefónica clients increased by 6.8%, excluding the impact of foreign exchange, principally due to higher activity withexisting clients, in addition to new clients wins.

87
Other operating income
Other operating income increased by $0.2 million, from $4.4 million for the year ended December 31, 2013 to $4.6 million forthe year ended December 31, 2014. Excluding the impact of foreign exchange, other operating income increased by 8.7% principallydue to subsidies received in Spain for hiring disabled employees.
Other gains
In May 2014, the Master Service Agreement (“MSA”) with Telefónica, which required the Telefónica Group to meet pre-agreedminimum annual revenue commitments to us through 2021, was amended to adjust minimum revenue commitments in relation toSpain and Morocco, to reflect the expected lower level of activities in these countries. The provisions of the MSA required Telefónicato compensate us in case of shortfalls in these revenue commitments. Based on the above, Telefónica agreed to compensate us with apenalty fee amounting to €25.4 million (equivalent to $34.5 million).
Total operating expenses
Total operating expenses increased by $9.9 million, or 0.4%, from $2,241.4 million for the year ended December 31, 2013 to$2,251.3 million for the year ended December 31, 2014. Excluding the impact of foreign exchange, operating expenses increased by9.7%. As a percentage of revenue, operating expenses constituted 95.7% and 98.0% for the year ended December 31, 2013 and 2014,respectively. This increase was principally due to the impairment charges recognized, an increase in employee benefit expenses due torestructuring costs and other operating expenses incurred as a result of the IPO process. Adjusting for these items, operating expensesas a percentage of revenues would have constituted 93.1% of revenue.
The $9.9 million increase in operating expenses during the year ended December 31, 2014 resulted from the followingcomponents:
Supplies: Supplies decreased by $10.5 million, or 9.1%, from $115.3 million for the year ended December 31, 2013 to $104.8million for the year ended December 31, 2014. Excluding the impact of foreign exchange, supplies expense increased by 0.2%. Theincrease was principally caused by growth in Brazil and Mexico as well as a reclassification of costs previously booked as Otheroperating expenses and now booked as Supplies; these costs were partially offset by a decrease in the EMEA region as a result oflower activity. As a percentage of revenue, supplies constituted 4.9% and 4.6% for the year ended December 31, 2013 and 2014,respectively.
Employee benefits expenses: Employee benefits expenses decreased by $7.1 million, or 0.4%, from $1,643.5 million for the yearended December 31, 2013 to $1,636.4 million for the year ended December 31, 2014. Excluding the impact of foreign exchange,employee benefits expenses increased by 9.3%. This increase in employee benefits expenses was principally due to restructuringexpenses incurred in Spain, Argentina and Chile. This increase was partially offset by operational efficiencies generated. Adjusting forrestructuring expenses of $26.7 million and excluding the impact of foreign exchange, employee benefits expenses would haveincreased by 7.7%. As a percentage of our revenue, employee benefits expenses constituted 70.2% and 71.2% for the year endedDecember 31, 2013 and 2014, respectively. Adjusting for restructuring expenses, employee benefits expenses as a percentage ofrevenue would have constituted 69.7% and 70.0% for the year ended December 31, 2013 and 2014, respectively.
Depreciation and amortization: Depreciation and amortization expense decreased by $9.2 million, or 7.1%, from $129.0million for the year ended December 31, 2013 to $119.8 million for the year ended December 31, 2014. Excluding the impact offoreign exchange, depreciation and amortization expense decreased by 0.3%, principally due to the lower carrying amount of customerrelationship intangible assets, as a result of the impairment test performed in June 30, 2014.
Changes in trade provisions: Changes in trade provisions totaled a positive figure of $1.7 million for the year ended December31, 2014, a decrease of $0.3 million over the year ended December 31, 2013. This decrease was principally due to the collection, in2013, of some receivables that had previously been impaired. As a percentage of revenue, changes in trade provisions constituted0.1% and 0.1% for the year ended December 31, 2013 and 2014.
Other operating expenses: Other operating expenses increased by $4.6 million, or 1.3%, from $355.6 million for the year endedDecember 31, 2013 to $360.2 million for the year ended December 31, 2014. Excluding the impact of foreign exchange, otheroperating expenses increased by 9.2%, principally due to financing and IPO fees incurred during the IPO process and a reclassificationfrom suppliers to other operating expenses. As a percentage of revenue, other operating expenses constituted 15.2% and 15.7% for theyear ended December 31, 2013 and 2014, respectively.

88
Impairment charges: Asset impairment for the year ended December 31, 2013 relates to charges associated to projects forinventory control in Brazil which are not related to our core results of operations. For the year ended December 31, 2014, mainlyrelate to the goodwill and other intangible asset impairments relating to our operation in Czech Republic of $3.7 million and Spain of$28.8 million.
As of June 30, 2014, we performed an impairment test on the carrying amount of customer-relationship intangible assets,goodwill and property, plant and equipment, as a result of the amendment to the MSA which impacted the amount of expectedrevenue and also in consideration of the changes in expected revenue in certain countries. The impairment test was performed usingassumptions revised in accordance with the amendments to the MSA and with updated management expectations on cash flowgeneration from the different countries where we operate. The result of the test performed was an impairment charge of $27.7 millionof the intangible asset related to the customer relationship with Telefónica in connection with the MSA. Impairment charges of $1.1million of goodwill in Spain and of $3.7 million of goodwill in the Czech Republic were recognized during the year ended December31, 2014, as a result of this impairment test.
Brazil
Total operating expenses in Brazil decreased by $32.0 million, or 2.9%, from $1,113.6 million for the year ended December 31,2013 to $1,081.6 million for the year ended December 31, 2014. Excluding the impact of foreign exchange, operating expenses inBrazil increased by 6.3%, which was slightly below revenue growth. Operating expenses as a percentage of revenue decreased from92.3% to 91.3%. The decrease in operating expenses in Brazil as a percentage of sales was principally due to cost efficienciesachieved from our margin transformation programs in addition to higher costs incurred in 2013 as a result of the ramp-up of newTelefónica services.
Americas
Total operating expenses in the Americas increased by $13.0 million, or 1.8%, from $705.9 million for the year endedDecember 31, 2013 to $718.9 million for the year ended December 31, 2014. Excluding the impact of foreign exchange, operatingexpenses in the Americas increased by 16.7%, in line with the increase in revenues. Operating expenses as a percentage of revenueincreased from 91.4% to 92.2% in the year ended December 31, 2014, mainly explained by the restructuring costs incurred in 2014.Excluding this impact, operating expenses as a percentage of revenue would have been 91.2%.
EMEA
Total operating expenses in EMEA increased by $16.6 million, or 4.5%, from $365.2 million for the year ended December 31,2013 to $381.8 million for the year ended December 31, 2014. Operating expenses as a percentage of revenue increased from 100.6%to 114.0%. Excluding the impact of foreign exchange, operating expenses in EMEA increased by 4.7%. The increase in operatingexpenses in EMEA in the year ended December 31, 2014 was primarily attributable to impairment charges and restructuringcosts. Excluding the impact of these two effects amounting to $49.1 million, operating expenses as a percentage of revenue wouldhave reached 99.4%.
Operating profit
Operating profit decreased by $17.8 million, or 17.0%, from $105.0 million for the year ended December 31, 2013 to $87.2million for the year ended December 31, 2014. Excluding the impact of foreign exchange, operating profit decreased by 1.3%.Operating profit margin decreased from 4.5% for the year ended December 31, 2013 to 3.8% for the year ended December 31, 2014,due to the negative impact of costs incurred in connection with the IPO ($51.9 million), recognized impairments in EMEA ($32.5million) and restructuring costs ($26.7 million), partially offset by the positive impact of the MSA penalty fee (equivalent to $34.5million). Excluding these impacts, operating profit margin for the year ended December 31, 2014, would have amounted to 7.1%,driven mainly by the operational improvements in most of the markets as a result of the implementation of our strategic initiatives,growth in Chile after the implementation of the new business model with Telefónica during 2013 and costs related to the introductionof new services with Telefónica in Brazil incurred during the first half of 2013.
Brazil
Operating profit in Brazil increased by $8.7 million, or 9.2%, from $94.8 million for the year ended December 31, 2013 to$103.5 million for the year ended December 31, 2014. Excluding the impact of foreign exchange, operating profit increased by 19.3%in 2014. Operating profit margin in Brazil increased from 7.9% for the year ended December 31, 2013 to 8.7% for the year ended

89
December 31, 2014. The increase in operating profit in Brazil for the period was principally due to cost efficiencies achieved, partiallyoffset by the ramp-up of services with new clients.
Americas
Operating profit in the Americas decreased by $3.3 million, or 4.9%, from $67.6 million for the year ended December 31, 2013to $64.3 million for the year ended December 31, 2014. Excluding the impact of foreign exchange, operating profit in Americasincreased by 5.5% in 2014. Operating profit margin in the Americas decreased from 8.7% for the year ended December 31, 2013 to8.2% for the year ended December 31, 2014. The decrease in operating profit in the Americas was principally attributed torestructuring costs incurred in Argentina, Chile and Peru. Excluding this impact, operating profit margin would have reached 9.3%.
EMEA
Operating profit in EMEA decreased by $45.5 million, from a loss of $0.1 million for the year ended December 31, 2013 to aloss of $45.6 million for the year ended December 31, 2014. Excluding the impact of foreign exchange, operating profit in EMEAdecreased by $45.7 million in 2014. The operating profit margin in EMEA decreased from a loss of 0.0% for the year endedDecember 31, 2013 to a loss of 13.6% for the year ended December 31, 2014, principally as a result of the recognized impairmentcharge ($32.5 million) discussed above and the restructuring costs incurred ($16.6 million). Excluding these impacts operating profitmargin would have increased by 1.0%.
Finance income
Finance income increased by $40.5 million, from $17.8 million for the year ended December 31, 2013 to $58.3 million for theyear ended December 31, 2014. Excluding the impact of foreign exchange, finance income increased by $42.9 million during the yearended December 31, 2014. This increase was principally due to higher unrealized gains on cross-currency swaps associated with the7.375% Senior Secured Notes and on interest rate swaps associated with Brazilian Debentures, and higher finance income in Brazil.
Finance costs
Finance costs increased by $0.6 million, or 0.4%, from $135.1 million for the year ended December 31, 2013 to $135.7 millionfor the year ended December 31, 2014. Excluding the impact of foreign exchange, finance costs increased by 5.8% during the yearended December 31, 2014. This increase was principally due to a full period of finance costs incurred on the 7.375% Senior SecuredNotes. These impacts were partially offset by lower unrealized losses mainly related to cross-currency swaps associated with the7.375% Senior Secured Notes.
Net foreign exchange gain/(loss)
Net foreign exchange gain/(loss) changed by $50.0 million, from a gain of $16.6 million for the year ended December 31, 2013to a loss of $33.4 million for the year ended December 31, 2014. This decrease was principally due to net foreign exchange lossresulting from liabilities denominated in foreign currencies which depreciated against the U.S. dollar during the 2014 period.
Income tax expense
Income tax benefit/(expense) for the year ended December 31, 2013 and December 31, 2014 was an expense of $8.3 million and$18.5 million, respectively, increasing by $10.2 million during the year ended December 31, 2014. Excluding the impact of foreignexchange, income tax expense increased by $14.2 million. Higher tax expenses are primarily attributed to non-deductible expensesincurred in connection with the IPO and write-off of existing tax credits mainly as a result of corporate tax rate changes in Spain. Theaggregated effective tax rate for the year ended December 31, 2014 is distorted because of the contribution of losses in the holdingcompanies to our profit before tax and the tax effect of the impairment charges. Adjusting for this effect, the average effective tax ratefor the year ended December 31, 2014 would have been 39.5%, while the average effective tax rate of the year ended December 31,2013 would have been 30.0%.
Profit/(loss) for the period
Profit/(loss) for the year ended December 31, 2013 and December 31, 2014 was a loss of $4.0 million and $42.1 million,respectively, as a result of the factors discussed above.

90
EBITDA and adjusted EBITDA
EBITDA decreased by $27.0 million, or 11.5%, from $234.0 million for the year ended December 31, 2013 to $207.0 millionfor the year ended December 31, 2014. Adjusted EBITDA increased by $11.3 million, or 3.8%, from $295.1 million for the yearended December 31, 2013 to $306.4 million for the year ended December 31, 2014. The difference between EBITDA and adjustedEBITDA was due to the exclusion of items that were not related to our core results of operations. Our adjusted EBITDA is defined asEBITDA adjusted to exclude the acquisition and integration related costs, restructuring costs, sponsor management fees, assetimpairments, site relocation costs, financing and IPO fees and other items which are not related to our core results of operations. See“Item 3A. Selected Financial Data” for a reconciliation of EBITDA and adjusted EBITDA to profit/(loss).
Excluding the impact of foreign exchange, EBITDA decreased by 0.8% and adjusted EBITDA increased by 13.7% mainly dueto revenue growth and solid performance in Brazil and Americas, more than offsetting reduced activity with Telefónica in EMEA.
Brazil
EBITDA in Brazil increased by $8.1 million, or 5.4%, from $150.7 million for the year ended December 31, 2013 to $158.8million for the year ended December 31, 2014. Adjusted EBITDA in Brazil increased by $11.0 million, or 6.8%, from $161.1 millionfor the year ended December 31, 2013 to $172.1 million for the year ended December 31, 2014. Excluding the impact of foreignexchange, EBITDA and adjusted EBITDA increased by 15.3% and 16.9%, respectively. The increase in EBITDA and adjustedEBITDA was principally due to the strong growth in revenue with existing clients and the capture of new clients, as well as operatingefficiencies achieved from our margin transformational programs.
Americas
EBITDA in the Americas decreased by $8.1 million, or 7.0%, from $115.3 million for the year ended December 31, 2013 to$107.2 million for the year ended December 31, 2014. Adjusted EBITDA in the Americas decreased by $0.7 million, or 0.6%, from$118.4 million for the year ended December 31, 2013 to $117.7 million for the year ended December 31, 2014. Excluding the impactof foreign exchange, EBITDA and adjusted EBITDA increased during the year ended December 31, 2014 by 2.2% and 10.7%,respectively. The increase in Adjusted EBITDA was primarily attributed to strong growth achieved in the region, mainly in Argentina,Chile and Peru. Adjusted EBITDA margin grew at a slower pace than revenue, as a result of higher recruiting and training costs toramp-up the offshore business from Telefónica Argentina to Peru. On the other side, Chile was positively impacted by the finalizationof the implementation of the new business model with Telefónica.
EMEA
EBITDA in EMEA decreased by $49.4 million, from a gain of $24.3 million for the year ended December 31, 2013 to a loss of$25.1 million for the year ended December 31, 2014. Adjusted EBITDA in EMEA decreased by $0.3 million, from $26.7 million forthe year ended December 31, 2013 to $26.4 million for the year ended December 31, 2014. The decrease in Adjusted EBITDA, duringthe year ended December 31, 2014 was principally due to a reduction in Telefónica volumes in Spain which implied an oversizedstructure before the execution of the restructuring process in the year ended December 31, 2014.
Liquidity and Capital Resources
We fund our ongoing capital and working capital requirements through a combination of cash flows from our operating andfinancing activities. Based on our current and anticipated levels of operations and conditions in our markets and industry, we believethat our cash on hand and cash flows from our operating, investing and financing activities, including funds available under theRevolving Credit Facility, will enable us to meet our working capital, capital expenditures, debt service and other fundingrequirements for the foreseeable future. We have ample liquidity: (i) as at December 31, 2013, the total amount of credit available tous was €50 million ($69 million) under our Revolving Credit Facility, which remains undrawn as at December 31, 2014. In addition,we had cash and cash equivalents (net of any outstanding bank overdrafts) of approximately $213.5 million, of which $13.7 million islocated in Argentina and subject to restrictions on our ability to transfer them out of the country; (ii) as at December 31, 2014, the totalamount of credit available to us was €50 million ($60.7 million) under our Revolving Credit Facility, which remains undrawn as at

91
December 31, 2014. In addition, we had cash and cash equivalents (net of any outstanding bank overdrafts) and short-term financialinvestments of approximately $238.3 million as of December 31, 2014, of which $8.0 million (approximately than 3% of the total) islocated in Argentina and subject to restrictions on our ability to transfer them out of the country.
However, our ability to fund our working capital needs, debt payments and other obligations, and to comply with the financialcovenants under our debt agreements, depends on our future operating performance and cash flow, which are in turn subject toprevailing economic conditions, and other factors, many of which are beyond our control. Any future acquisitions, joint ventures orother similar transactions will likely require additional capital and such capital may not be available to us on acceptable terms, if at all.
As of December 31, 2014, our outstanding debt amounted to $653.3 million, which includes $300.3 million of our 7.375%Senior Secured Notes due 2020, $245.9 million equivalent amount of Brazilian Debentures, $36.4 million of CVIs, $9.0 million offinance lease payables, $61.3 million of financing provided by BNDES, and $0.4 million of other bank borrowings.
During the year ended December 31, 2014 we drew down BRL161.5 million (equivalent to $60.8 million) under our creditagreement with BNDES. On May 30, 2014, Midco issued PECs for an aggregate amount of €64.1 million (equivalent to $87.3million) which proceeds were applied to make a partial prepayment of the Vendor Loan Note. In addition, the MSA with Telefónicawas amended and Telefónica agreed to compensate us with a penalty fee amounting to €25.4 million (equivalent to $30.9 million forthe year ended December 31, 2014). We, in turn, used this amount to partially prepay the Vendor Loan Notes due to Telefónica. Weprepaid BRL34.4 million, BRL45.0 million and BRL80.0 million, respectively (equivalent to $15.5 million, $20.4 million and $33.1million, respectively) of the Brazilian Debentures. Finally, the Company, in connection with the IPO completed the followingoperations: on October 3, 2014, capitalized the Preferred Equity Certificates for a total amount of €460.1 million (approximately$575.9 million), and on October 7, 2014, repaid the entire outstanding amount under the Vendor Loan Note for a total amount of€23.3 million (approximately $29.5 million).
For the year ended December 31, 2014, our cash flow used for debt service totaled $283.7 million, which included voluntaryprepayments of our Brazilian Debentures of BRL34.4 million (equivalent to $15.5 million) on May 12, 2014, BRL45.0 million(equivalent to $20.4 million) on June 26, 2014, and BRL80.0 million (equivalent to $33.1 million) on August 28, 2014, voluntaryprepayments of our Vendor Loan Note of €64.1 million (equivalent to $87.3 million) on May 30, 2014, and €23.3 million (equivalentto $29.5 million) on October 7, 2014, and interest payments of $96.5 million. Also, during the year ended December 31, 2014, our netcash flows from operating activities totaled $135.3 million, which includes interest paid of $96.5 million. As such, our net cash flowsfrom operating activities (before giving effect to the payment of interest) amounted to $231.8 million. Cash flow used to service ourdebt represented 122.4% of our net cash flows from operating activities (before giving effect to the payment of interest). Excluding thevoluntary prepayments of our Brazilian Debentures and Vendor Loan Note mentioned above, our cash flow related to interest paymentand mandatory debt repayment represented 43.1% of the cash flows from operating activities (before considering the effect of thepayment of interest).
Cash Flow
As of December 31, 2014, we had cash and cash equivalents (net of any outstanding bank overdrafts) and short-term financialinvestments of approximately $238.3 million. We believe that our current cash flow from operating activities and financingarrangements will provide us with sufficient liquidity to meet our working capital needs.
For the year ended December 31,($ in millions) 2013 2014
Cash provided by/(used in) operating activities 99.6 135.3Cash used in investing activities (123.4) (149.8)Cash provided by/(used in) financing activities 31.2 38.8Effect of changes in exchanges rates 5.8 (26.4)Net increase (decrease) in cash and cash equivalents 13.2 (2.1)
Cash Provided by Operating Activities

92
Year Ended December 31, 2014 Compared to Year Ended December 31, 2013
Net cash provided by operating activities was $135.3 million for the year ended December 31, 2014 compared to $99.6 millionfor the year ended December 31, 2013. The increase in net cash provided by operating activities resulted from an overall improvementin working capital performance and also due to lower taxes paid.
Cash Used in Investing Activities
Year Ended December 31, 2014 Compared to Year Ended December 31, 2013
Net cash used in investing activities was $149.8 million for the year ended December 31, 2014 compared to $123.4 million forthe year ended December 31, 2013. Net cash used in investing activities for the year ended December 31, 2014 mainly includepayments for capital expenditure of $117.9 million, acquisition of subsidiaries of $7.5 million, net payments for financial instrumentsof $26.6 million, which include of $26.6 million of net short-term financial investments in Brazil. The increase for the year endedDecember 31, 2014 was primarily driven by the net short-term financial investments in Brazil to protect our cash holdings in U.S.dollars.
Cash Provided by/(Used in) Financing Activities
Year Ended December 31, 2014 Compared to Year Ended December 31, 2013
Net cash provided by financing activities was $38.8 million for the year ended December 31, 2014 compared to $31.2 millionfor the year ended December 31, 2013. The increase in net cash provided by financing activities was primarily attributable to theimpact of IPO proceeds received by Atento S.A., partially offset by prepayment to Telefónica of the entire amount outstanding underthe Vendor Loan Note, and the net amortization of debentures and amounts drawdown under the BNDES facility.
Free Cash Flow
Our management uses free cash flow to assess our liquidity and the cash flow generation of our operating subsidiaries. Wedefine free cash flow as net cash flows from operating activities less capital expenditures (addition to property, plant and equipment,and intangible assets) for the period. We believe that free cash flow is useful to investors because it adjusts our operating cash flow bythe capital that is invested to continue and improve business operations.
Free cash flow has limitations as an analytical tool. Free cash flow is not a measure defined by EU-IFRS and should not beconsidered in isolation from, or as an alternative to, cash flow from operating activities or other measures as determined in accordancewith EU-IFRS. Additionally, free cash flow does not represent the residual cash flow available for discretionary expenditures as itdoes not incorporate certain cash payments, including payments made on finance lease obligations or cash payments for businessacquisitions. Free cash flow is not necessarily comparable to similarly titled measures used by other companies.
For the year ended December 31,($ in millions) 2013 2014
Net cash flow from operating activities 99.6 135.3Capital expenditures (1) (103.0) (120.1)Free cash flow (non-GAAP) (unaudited) (3.4) 15.2
(1) We define capital expenditures as the sum of additions to property, plant and equipment and the additions to intangible assetsduring the period presented.

93
Year Ended December 31, 2014 Compared to Year Ended December 31, 2013
Free cash flow improved by $18.6 million from negative $3.4 million for the year ended December 31, 2013 to positive $15.2million for the year ended December 31, 2014. The improvement in free cash flow for the year ended December 31, 2014 wasprincipally due to the increase in net cash flow from operating activities.
Free cash flow for the year ended December 31, 2014 was negatively impacted by cash outflows of $39.4 million related tofinancing fees and IPO costs, $15.7 million related to restructuring costs, which include Spanish headcount reduction plan cash outlay,$7.8 million related to Acquisition and integration related costs, $7.0 million related to Sponsor management fee, $1.2 million relatedto site relocation costs, and $1.5 million related to other costs.
Free cash flow for the year ended December 31, 2013 was (i) negatively impacted by cash outflows of $28.2 million related toAcquisition and integration related costs, $0.7 million related to restructuring costs, $8.9 million related to Sponsor management fee,and $3.9 million related to financing fees, and (ii) positively impacted by $1.1 million related to other costs.
Finance Leases
The Company holds the following assets under finance leases:
As of December 31,2013 2014
($ in millions) Net carrying amount ofasset
Net carrying amountof asset
Finance leasesPlant and machinery - -Furniture, tools and other tangible assets 9.4 7.7Software - -Other intangible assets - -
Total 9.4 7.7
The assets acquired under these finance leases are located in Brazil, Colombia and Peru.
The present value of future finance lease payments is as follows:
As of December 31,2013 2014
($ in millions) Net carrying amount ofasset
Net carryingamount of asset
Up to 1 year 5.3 4.7Between 1 and 5 years 6.5 4.3
Total 11.9 9.0
As of December 31, 2014 we were in compliance with the terms of all our covenants.
Capital Expenditures
Our business has significant capital expenditure requirements, including for the construction and initial fit-out of our servicedelivery centers; improvements and refurbishment of leased facilities for our service delivery centers; acquisition of various items ofproperty, plant and equipment, mainly comprised of furniture, computer equipment and technology equipment; and acquisition andupgrades of our software or specific customer’s software.
The funding of the majority of our capital expenditures is covered by existing cash and EBITDA generation.

94
The table below sets forth our historic capital expenditures by segment for the year ended December 31, 2013 and 2014:
For the year ended December 31,($ in millions) 2013 2014
Brazil 63.2 76.6Americas 31.8 38.0EMEA 7.2 4.2Other and eliminations 0.8 1.3Total capital expenditures 103.0 120.1
We expect that our capital expenditures will increase in the future as our business continues to develop and expand.
RESEARCH AND DEVELOPMENT, PATENTS AND LICENSES
The Company believes the “Atento” trademark is a recognized and trusted brand in the CRM BPO services industry in each ofthe markets where we operate. We believe we have a strong corporate brand that gives credibility to our products and may offer andfacilitate our entrance and growth into future market. This also allows us to attract and retain the best talent, to generate a sense ofpride in our staff and to develop a relationship of commitment, confidence and trust with our clients. In December 2012 Atento SpainHoldco S.L.U. purchased all trademarks and domain names relevant for its business. Under the Berne Convention for the Protection ofLiterary and Artistic Works, the trademarks and copyrights noted are recognized in all countries that are signatories to the conventionand no other registration or license is required for its use. As of December 2014, all the countries in which we operate have signed theBerne Convention. We do not have any other material intellectual property such as patents or licenses. As of December 31, 2014 thereare no research and development in progress.
INTERNAL CONTROLS AND PROCEDURES
The Company has established disclosure controls and procedures to ensure that the information required to be disclosed by theCompany in its reports are recorded, processed, summarized and reported within the time periods specified in required rules. And suchinformation is accumulated and made known to the officers who certify the Company’s financial reports and to other members ofsenior management and the Board of Directors as appropriate to allow timely decisions regarding required disclosure.
There have been no changes in our internal control over financial reporting that occurred during the period covered by thisannual report that has materially affected, or is reasonably likely to materially affect, our internal control over financial reporting.
QUANTITATIVE AND QUALITATIVE DISCLOSURES ABOUT MARKET RISK
On February 26, the Brazilian Government enacted a Provisory Measure PM 669/15 whereby it raised the social security tax onemployees social contributions from 2% to 4.5% on gross revenue for the call center industry. Companies impacted by the measurewill have the option to revert to the original 20% tax on payroll spending. The new rule was to come into effect as of June, and firmswere allowed to change the way they pay social security tax as at this month. On March 3, Senate President however rejected theprovisional measure declaring it to be unconstitutional. Brazilian Government then submitted a law for Congress appreciation with thesame proposal, and if approved, the additional tax obligations that we would incur in Brazil may have a material adverse effect on ourbusiness, financial condition, results of operations and prospects. Despite recent political developments make the outcome and impactof the Provisory Measure in our business unpredictable, the Company is taking appropriate actions to address any potential exposureto our operations.
Financial risk factorsThe Atento Group’s activities expose it to various types of financial risk: market risk (including interest rate risk, currency risk
and country risk), credit risk and liquidity risk. The Atento Group’s global risk management policy aims to minimize the potentialadverse effects of these risks on the Atento Group’s financial returns. The Atento Group also uses derivative financial instruments tohedge certain risk exposures.

95
a) Market risk
Interest rate risk in respect of cash flow and fair value
Interest rate risk arises mainly as a result of changes in interest rates which affect: (i) finance costs of debt, bearing interest atvariable rates (or debt with short term maturity which is expected to be renewed), as a result of fluctuations in interest rates, and(ii) the value of non-current liabilities that bear interest at fixed rates.
At December 31, 2014 48.0% of financial debt with third parties (excluding CVIs and the effect of financial derivativeinstruments) bore interests at variable rates, while at December 31, 2013 this amount was 43.2%.
The Atento Group’s finance costs are exposed to fluctuations in interest rates. In 2013 and 2014, the rate to which the AtentoGroup had the greatest exposure was the Brazilian CDI rate.
As of December 31, 2014, the estimated fair value of the interest rate hedging instruments related to the Brazilian Debenturestotaled $10.9 million, which was recorded as a financial asset. Based on our total indebtedness of $653.3 million as of December 31,2014 and not taking into account the impact of our interest rate hedging instruments referred to above, a 1% change in interest rateswould impact our net interest expense by $3.2 million.
As of December 31, 2013, the estimated fair value of the interest rate hedging instruments related to the Brazilian Debenturestotaled $15.6 million, which was recorded as a financial asset. Based on our total indebtedness of $1,370.8 million as of December 31,2013 and not taking into account the impact of our interest rate hedging instruments referred to above, a 1% change in interest rateswould impact our net interest expense by $3.8 million.
The Atento Group’s policy is to monitor exposure to this risk. In that regard, as described in Note 14, the Atento Group hasarranged interest rate swaps that have the economic effect of converting floating-rate borrowing into loans at fixed interest rates.
The table below shows the impact on these value of derivatives of a +/-10 basis points variation in the CDI interest rate curves.
Thousands ofU.S. dollars
Thousands ofU.S. dollars
INTEREST RATE 12/31/2013 12/31/2014
FAIR VALUE................................................................................................................... 15,611 10,9160.10%................................................................................................................................ 14,817 10,434-0.10%............................................................................................................................... 16,407 11,399
Also, as described in Note 14, the Atento Group has cross-currency swap hedging instruments with the economic effect ofcovering cash flow related to the Senior Secured Notes issued in U.S. dollars.
Additionally, the Atento Group holds derivatives which are not considered as hedging instruments related to the cash flowgenerated in Mexican Pesos, Colombian Pesos and Peruvian Nuevos Soles.
The table below shows the impact on the value of the rest of derivatives of a +/-10 basis points variation in the interest ratecurve.
Thousands ofU.S. dollars
Thousands of U.S.dollars
CROSS CURRENCY 12/31/2013 12/31/2014
FAIRVALUE………………………………………………………………………………........ (13,277) 20,155
0.10%................................................................................................................................. (14,719) 18,939

96
-0.10%.................................................................................................................................... (11,658) 21,487
Foreign currency risk
As at December 31, 2013 and 2014, the Atento Group entities held several borrowing and cash equivalents in currencies otherthan their functional currency.
The most significant exposure to foreign currency risk is derived from the U.S. dollar denominated Senior Secured Notesissued by the subsidiary Atento Luxco 1, S.A. in 2013 whose functional currency is the Euro. As indicated above, the Atento Grouphas cross-currency swap hedging instruments with the economic effect of covering cash flow related to the Senior Secured Notesissued in U.S. dollars.
Sensitivity analysis of foreign currency risk
The Atento Group has reasonable control over its foreign currency risks, as its financial assets (cash and cash equivalents) andfinancial liabilities (Senior Secured Notes, Finance Leases and CVIs) denominated in currencies other than their functional areadequately matched. We performed a sensitivity analysis based on the outstanding volume of financial assets and liabilities and weapplied a 10% appreciation of each asset/liability currency versus the functional currency which highlights the limited impact thatsuch event would have on the income statement is U.S. dollars. A sensitivity analysis of foreign currency risk for the Atento Group’sis provided in Note 4.
Country risk
To manage or mitigate country risk, the Atento Group repatriates the funds generated in the Americas and Brazil that are notrequired to pursue new, profitable business opportunities in the region. The capital structure of the Atento Group comprises twoseparate ring-fenced financings: (i) the Brazilian Debentures denominated in Brazilian Reais and (ii) the USD 300 million 7.375%Senior Secured Notes due 2020, together with the €50 million ($60.7 million) Revolving Credit Facility. The objective of combining aBrazilian term loan with a USD bond is to create a natural hedge for the interest payments on the Brazilian loan, which are servicedwith cash flow from Atento Brazil, denominated in Brazilian Reais.
Argentinian subsidiary sit outside of these two separate ring-fenced financings, and as a result, we do not rely on cash flowfrom these operations to serve our Company’s debt commitments.
b) Credit risk
The Atento Group seeks to conduct all of its business with reputable national and international companies and institutions ofestablished solvency in their countries of origin, so as to minimize credit risk. As a result of this policy, the Atento Group has nomaterial adjustments to make to its trade accounts.
Accordingly, the Atento Group’s commercial credit risk management approach is based on continuous monitoring of the risksassumed and the financial resources necessary to manage the Group’s various units, in order to optimize the risk-reward relationshipin the development and implementation of business plans in the course of their regular business.
Credit risk arising from cash and cash equivalents is managed by placing cash surpluses in high quality and highly liquidmoney market assets. These placements are regulated by a master agreement revised annually on the basis of the conditions prevailingin the markets and the countries where Atento operates. The master agreement establishes: (i) the maximum amounts to be investedper counterparty, based on their ratings (long and short term debt ratings); (ii) the maximum period of the investment; and (iii) theinstruments in which the surpluses may be invested.
The Atento Group’s maximum exposure to credit risk is primarily limited to the carrying amounts of its financial assets. TheAtento Group holds no guarantees as collection insurance. The Atento Group carries out significant transactions with the TelefónicaGroup. At December 31, 2014 the balance of accounts receivable with Telefónica Group amounted to $237.0 million ($302.2 millionin 2013).
c) Liquidity risk
The Atento Group seeks to match its debt maturity schedule to its capacity to generate cash flow to meet the payments fallingdue, factoring in a comfortable cushion. In practice, this has meant that the Atento Group’s average debt maturity must be longer thanthe length of time required paying its debt (assuming that internal projections are met). A maturity schedule for the Atento Group’sfinancial liabilities is provided in Note 16.

97
Capital Management
The Atento Group’s Finance Department, which is in charge of the capital management, takes various factors intoconsideration when determining the Group’s capital structure.
The Atento Group’s capital management goal is to determine the financial resources necessary both to continue its recurringactivities and to maintain a capital structure that optimizes own and borrowed funds.
The Atento Group sets an optimal debt level in order to maintain a flexible and comfortable medium term borrowing structure,in order to be able to carry out its routine activities under normal conditions and also address new opportunities for growth. Debtlevels are kept in line with forecast future cash flows and with quantitative restrictions imposed under financing contracts.
In addition to these general guidelines, other considerations and specifics are taken into account when determining the AtentoGroup’s financial structure, such as country risk in the broadest sense, tax efficiency and volatility in cash flow generation.
Among the restrictions imposed under financing arrangements, the debentures contract lays out certain general obligations anddisclosures in respect of the lending institutions. Specifically, the borrower (BC Brazilco Participações, S.A., which has now mergedwith Atento Brasil, S.A.) must comply with the quarterly net financial debt/EBITDA ratio set out in the contract terms.
The contract also sets out additional restrictions, including limitations on dividends, payments and distributions to shareholdersand capacity to incur additional debt.
The Super Senior Revolving Credit Facility carries no financial covenant obligations regarding debt levels. However, the creditfacility does impose limitations on the use of the funds, linked to compliance with a debt ratio. The contract also includes otherrestrictions, including: limitations on the distribution of dividends, payments or distributions to shareholders, the capacity to incuradditional debt, and on investments and disposal of assets.
The Senior Secured Notes issued in 2013 carry no limitation covenant obligations regarding debt levels. However, the Notes doimpose limitations on the distributions on dividends, payments or distributions to the shareholders, the incurring of additional debt,and on investments and disposals of assets.
As at the date of these consolidated financial statements, the Atento Group was in compliance with all restrictions establishedin the aforementioned financing contracts, and does not foresee any future non-compliance. To that end, the Atento Group regularlymonitors figures for net financial debt with third parties and EBITDA.
Net financial debt with third parties at December 31, 2013 and 2014 is as follows:
Thousands of U.S. dollars12/31/2013 12/31/2014
Senior Secured Notes 297,681 300,269Brazilian bonds - Debentures 345,854 245,932Bank borrowing 632 61,720Finance lease payables 11,877 9,010CVIs 43,367 36,379Vendor Loans 151,701 -Derivative financial liabilities 15,962 1,193Less: Cash and cash equivalents (213,491) (211,440)
Net financial debt with third parties 653,583 443,063

98
IMPORTANT SUBSEQUENET EVENTS SINCE YEAR END
The Company has evaluated events through March 24, 2015, which is the date on which the consolidated financial statementsauthorized for issued by the Board of Directors, and has determined that there were no additional subsequent events after December31, 2014 requiring adjustment or disclosure in the consolidated financial statements.
a) Microsoft licenses
At January 2, 2015, Atento Brazil S.A. entered into a master agreement regarding the acquisition of rights to use Microsoft’software from SofwareONE Commerce and Computer Services Ltda. (“Contractor”), in which the Contractor provides Microsoft’software licenses Atento and its affiliates in Brazil, Colombia, Corporation, El Salvador, Peru, Guatemala, Mexico, and United Statesof America ("USA").
Acquisition prices stated in the agreements, which will be paid in 3 (three) annual payments due on January 2, 2015, 2016 and2017, are summarized below:
Description Thousands of US dollars
SoftwareONE agreement 37,440Microsoft agreements (not received for analysis in this memorandum) 7,920
45,360
The agreement expires in three years from the date of the agreement and it is non-cancellable.