Embed Size (px)
Citation preview

© Fraunhofer-Institut für Werkstoffmechanik IWM
I. Varfolomeev, M. LukeFraunhofer Institute for Mechanics of Materials IWM
Freiburg, Germany
ESIS TC24 Workshop
Fatigue Strength and Fatigue Life of Railway Axles
October 11-12, 2010, BAM Berlin
ASSESSMENT OF CRACK INITIATION IN PRESS FITS OF RAILWAY AXLES

© Fraunhofer-Institut für Werkstoffmechanik IWM
2
Outline
Introduction, motivation
Material EA4T
Fatigue tests
Fretting fatigue tests
Assessment of crack initiation in press fit
Conclusions
© Fraunhofer-Institut für Werkstoffmechanik IWM
3
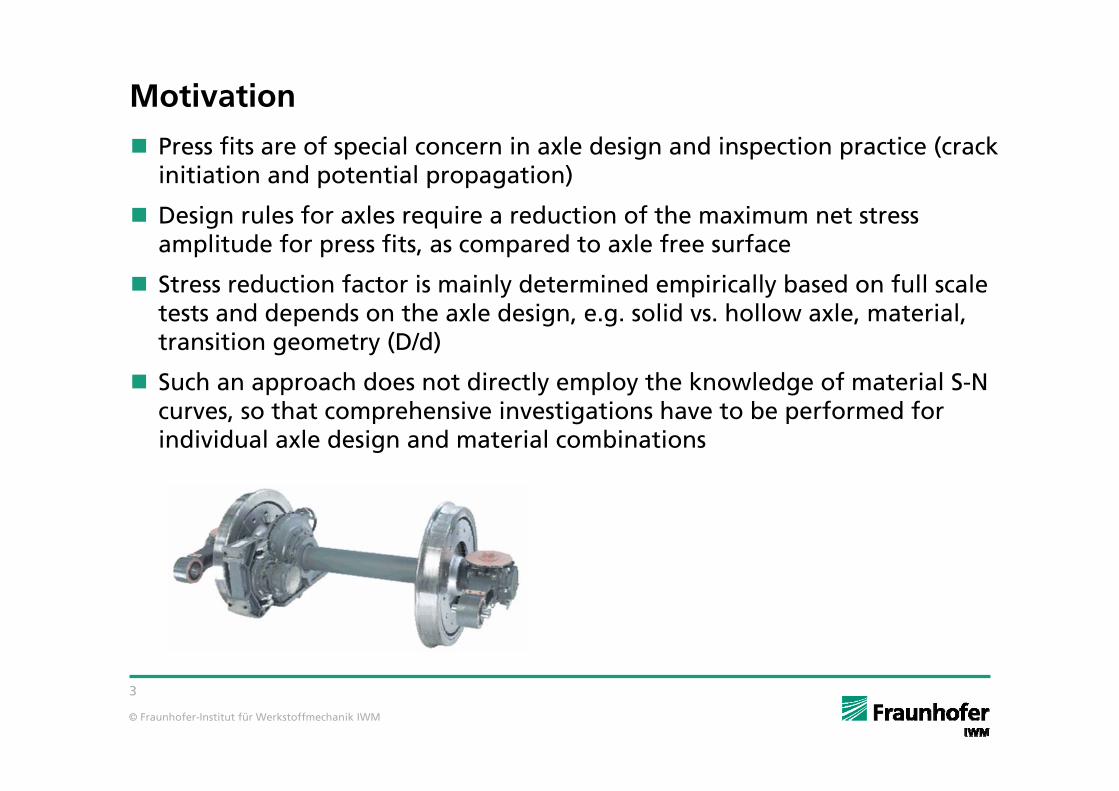
Motivation
Press fits are of special concern in axle design and inspection practice (crack initiation and potential propagation)
Design rules for axles require a reduction of the maximum net stress amplitude for press fits, as compared to axle free surface
Stress reduction factor is mainly determined empirically based on full scale tests and depends on the axle design, e.g. solid vs. hollow axle, material, transition geometry (D/d)
Such an approach does not directly employ the knowledge of material S-N curves, so that comprehensive investigations have to be performed for individual axle design and material combinations

© Fraunhofer-Institut für Werkstoffmechanik IWM
4
Acceptable stresses – after EN 13104
Nominal stress 240 MPa
Nominal stress 132…150 MPa
© Fraunhofer-Institut für Werkstoffmechanik IWM
5
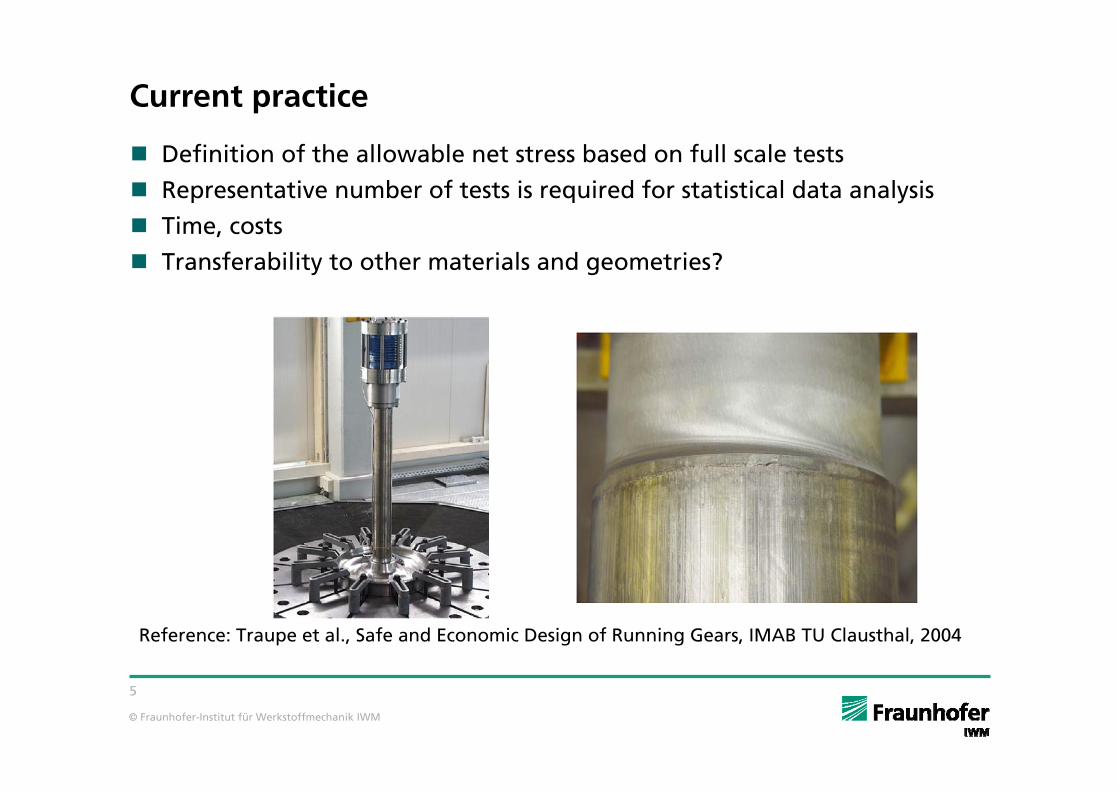
Current practice
Definition of the allowable net stress based on full scale tests
Representative number of tests is required for statistical data analysis
Time, costs
Transferability to other materials and geometries?
Reference: Traupe et al., Safe and Economic Design of Running Gears, IMAB TU Clausthal, 2004

© Fraunhofer-Institut für Werkstoffmechanik IWM
6
Goal and scope of the study
Correlation between standard fatigue S-N curves and fretting fatigue data
Plane fatigue and fretting fatigue tests
Assessment of crack initiation in press fit
Fracture mechanics analysis
Experimental setup and methodology similar to e.g. Lykins, Mall et al. (2000-2004)

© Fraunhofer-Institut für Werkstoffmechanik IWM
7
Material tensile properties (EA4T)
0
100
200
300
400
500
600
700
800
0,00 0,05 0,10 0,15 0,20 0,25 0,30
εtechnisch
σ tec
hnis
ch [
MPa
]
PA1-Z1PA1-Z3PA1-Z4PA1-Z6PA1-Z8PA1-Z9PA1-Z11PA1-Z13PA1-Z14
außen
Mitte
Kern
Strain [mm/mm]
Stre
ss [M
Pa]
outer surface
© Fraunhofer-Institut für Werkstoffmechanik IWM
8
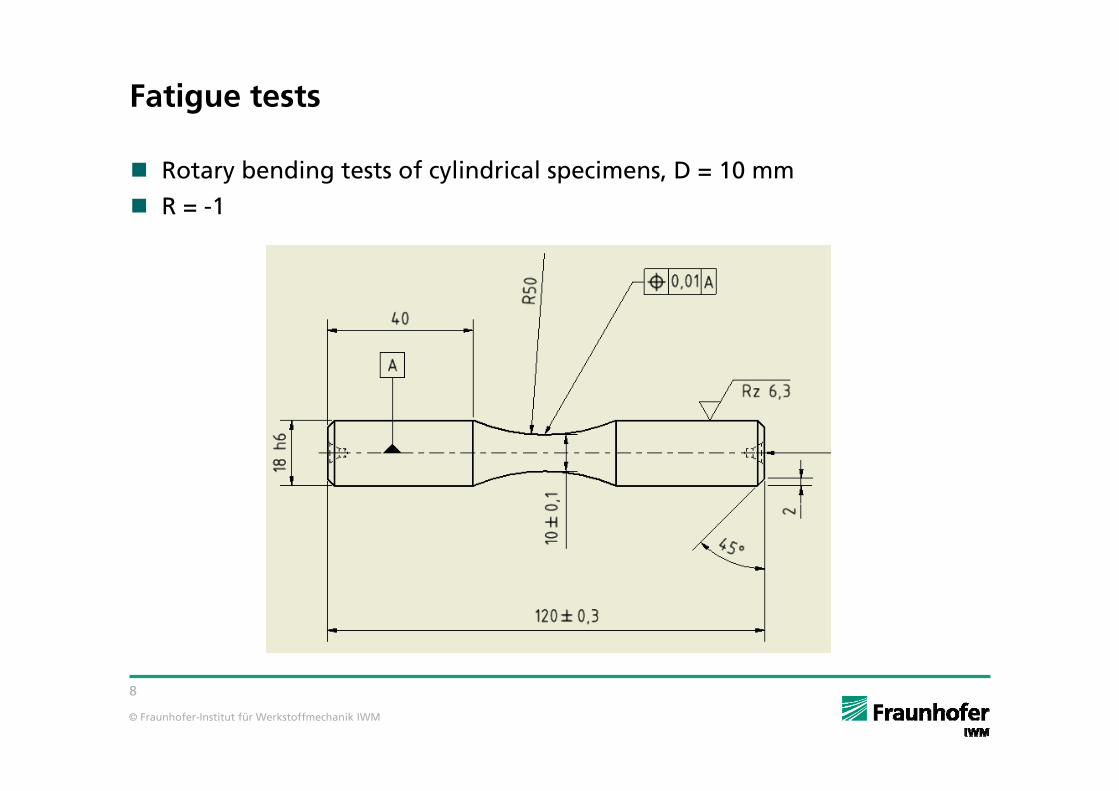
Fatigue tests
Rotary bending tests of cylindrical specimens, D = 10 mm
R = -1

© Fraunhofer-Institut für Werkstoffmechanik IWM
9
Fatigue data (S-N curves)
LCF and HCF test data, R = -1
Estimated endurance limit σD < 375 MPa
150
250
350
450
550
1E+4 1E+5 1E+6 1E+7
N, cycles
σ a, M
Pa
107106105104
median curve
run-outs

© Fraunhofer-Institut für Werkstoffmechanik IWM
10
Standard material characterization
Present results and reference data
Traupe et al. (2004)
Cherny et al. (2008)
150
250
350
450
550
1E+4 1E+5 1E+6 1E+7
N, cycles
σ a, M
Pa
107106105104
median curve
σD: Ø9 mm
σD: Ø170
size effect

© Fraunhofer-Institut für Werkstoffmechanik IWM
11
Data scatter and size effect
150
200
250
300
350
400
450
500
550
1E+4 1E+5 1E+6 1E+7 1E+8N, Zyklen
108106105104 107
σ a, M
Pa standard specimens, e.g. D = 10 mm

© Fraunhofer-Institut für Werkstoffmechanik IWM
12
Data scatter and size effect
150
200
250
300
350
400
450
500
550
1E+4 1E+5 1E+6 1E+7 1E+8N, cycles
108106105104 107
σ a, M
Pa standard specimens, e.g. D = 10 mm
large specimens (components)
small specimens
Endurance limit vs. specimen size:Ref. Cherny, Workshop on Damage Tolerance of Railway Axles13th–14th of October 2008, Milano

© Fraunhofer-Institut für Werkstoffmechanik IWM
13
Fretting fatigue tests
Test setup developed and adopted for resonant testing machine of type TESTRONIC (Russenberger Prüfmaschinen AG)Contact force ≤ 4 kNNet stress ratio R = 0.1
© Fraunhofer-Institut für Werkstoffmechanik IWM
14
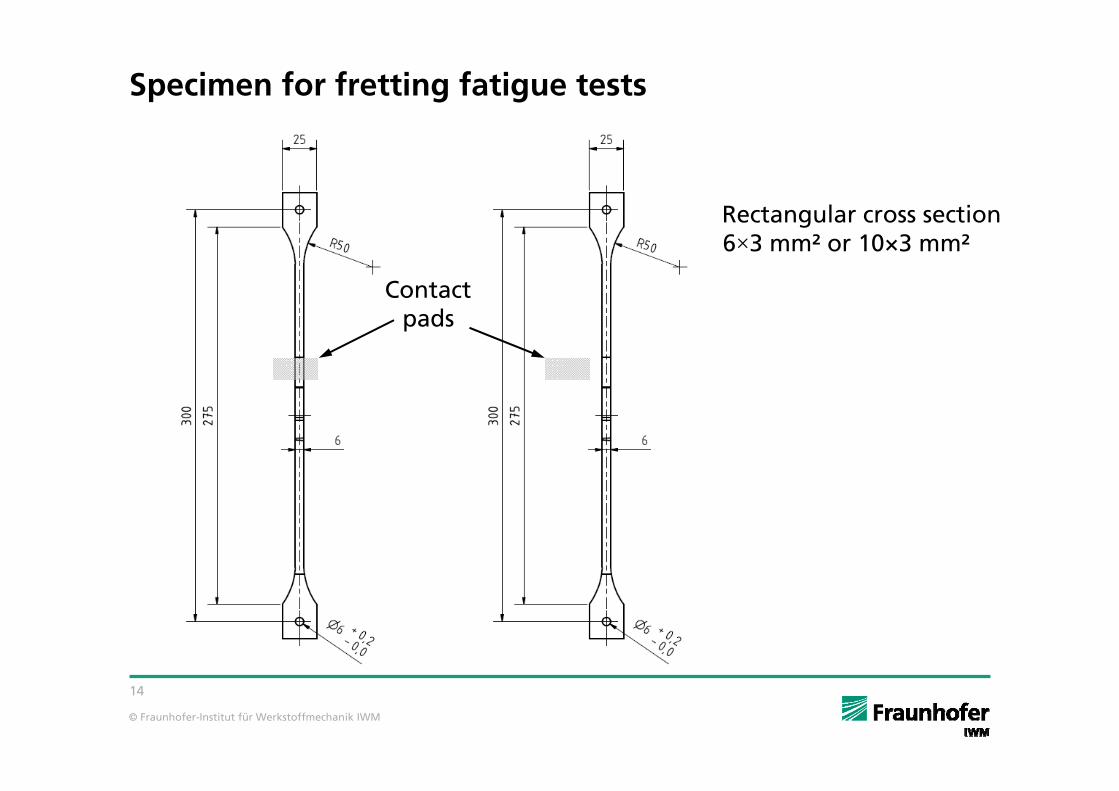
Specimen for fretting fatigue tests
Rectangular cross section 6×3 mm² or 10×3 mm²
Contact pads

© Fraunhofer-Institut für Werkstoffmechanik IWM
15
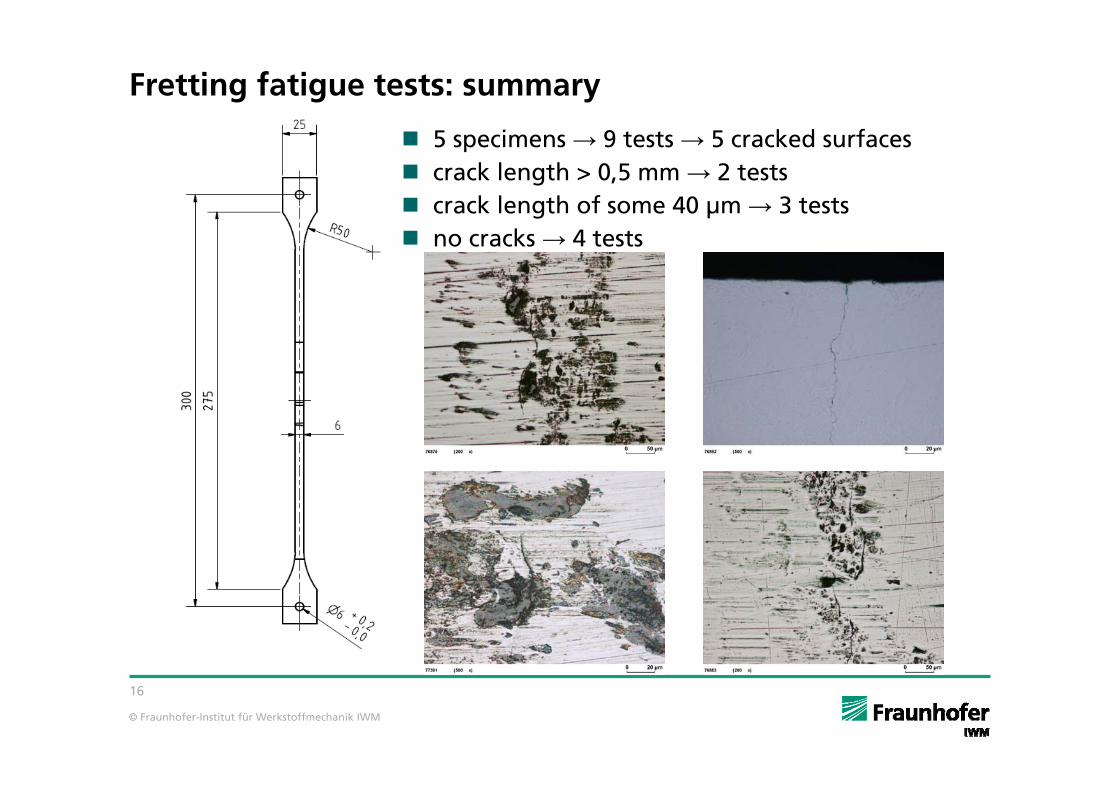
Fretting fatigue tests: summary
© Fraunhofer-Institut für Werkstoffmechanik IWM
16
Fretting fatigue tests: summary
5 specimens → 9 tests → 5 cracked surfacescrack length > 0,5 mm → 2 tests crack length of some 40 μm → 3 testsno cracks → 4 tests
© Fraunhofer-Institut für Werkstoffmechanik IWM
17
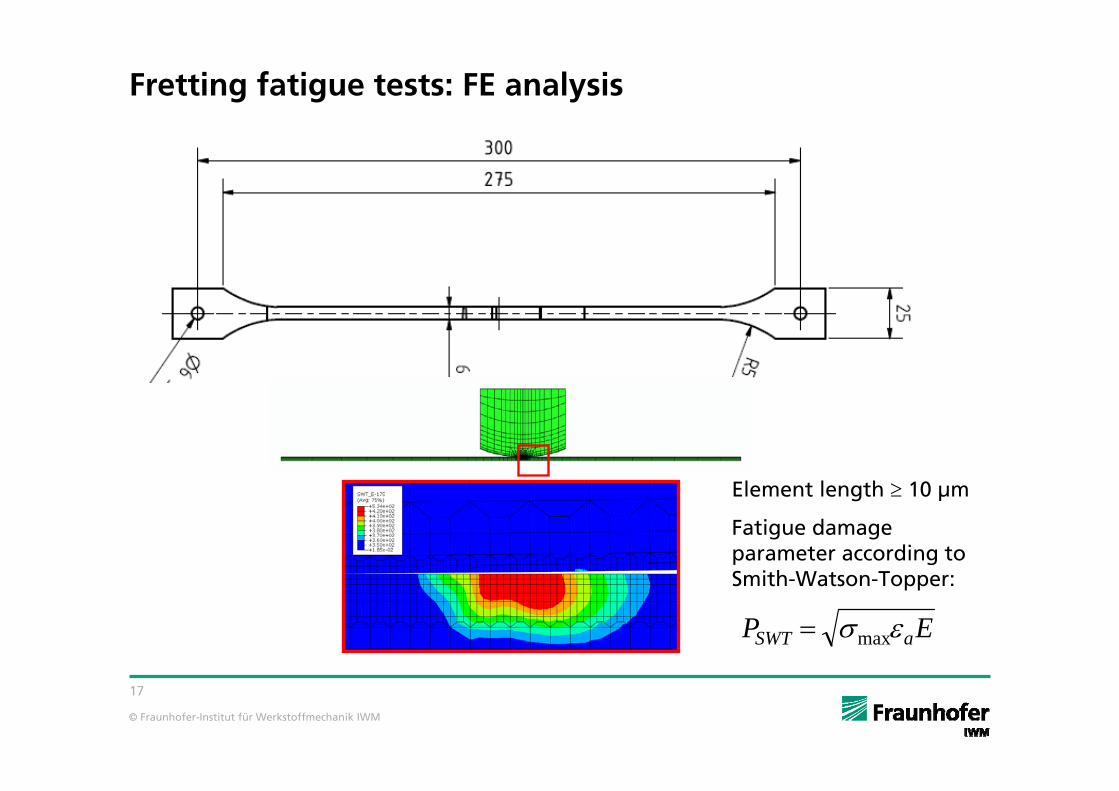
Fretting fatigue tests: FE analysis
EP aSWT εσmax=
Element length ≥ 10 μm
Fatigue damage parameter according to Smith-Watson-Topper:

© Fraunhofer-Institut für Werkstoffmechanik IWM
18
Plane fatigue vs. fretting fatigue results
Comparison in terms of the net stress
150
250
350
450
550
1E+4 1E+5 1E+6 1E+7
N, cycles
σ a, M
Pa
plane fatigue
fretting fatigue, crack initiation
fretting fatigue, no crack initiation
107106105104

© Fraunhofer-Institut für Werkstoffmechanik IWM
19
Plane fatigue vs. fretting fatigue results
Comparison in terms of the SWT parameter
150
250
350
450
550
1E+4 1E+5 1E+6 1E+7N, LW
σ a o
r P S
WT,
MPa
plane fatigue, d = 10 mm
fretting fatigue, crack initiation
fretting fatigue, no crack initiation
median curve, fretting fatigue tests
107106105104
Test Nr. 10
Test No. 3
Size effect: about 30-fold difference in the size of the high-stressed area in plane vs. fretting fatigue specimens increase of fatigue endurance
Shift of the median curve ×5
×2 scatter band of fretting fatigue data
© Fraunhofer-Institut für Werkstoffmechanik IWM
20
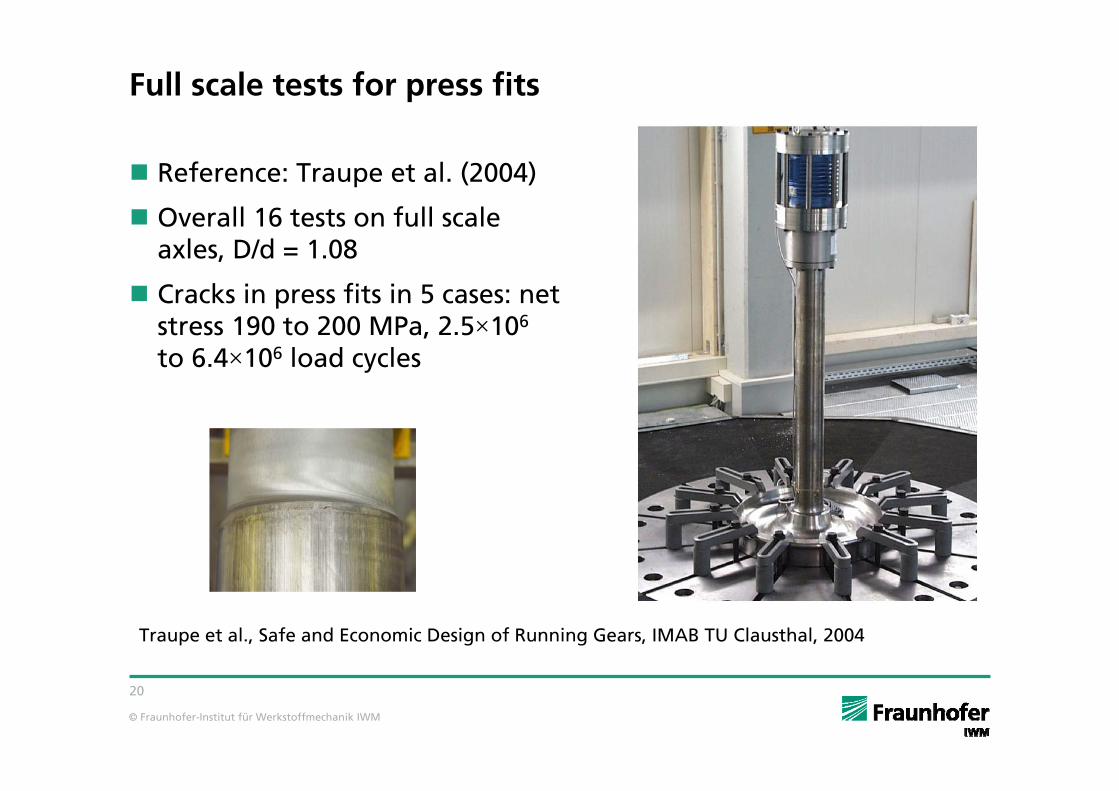
Full scale tests for press fits
Traupe et al., Safe and Economic Design of Running Gears, IMAB TU Clausthal, 2004
Reference: Traupe et al. (2004)
Overall 16 tests on full scale axles, D/d = 1.08
Cracks in press fits in 5 cases: net stress 190 to 200 MPa, 2.5×10⁶
to 6.4×10⁶ load cycles

© Fraunhofer-Institut für Werkstoffmechanik IWM
21
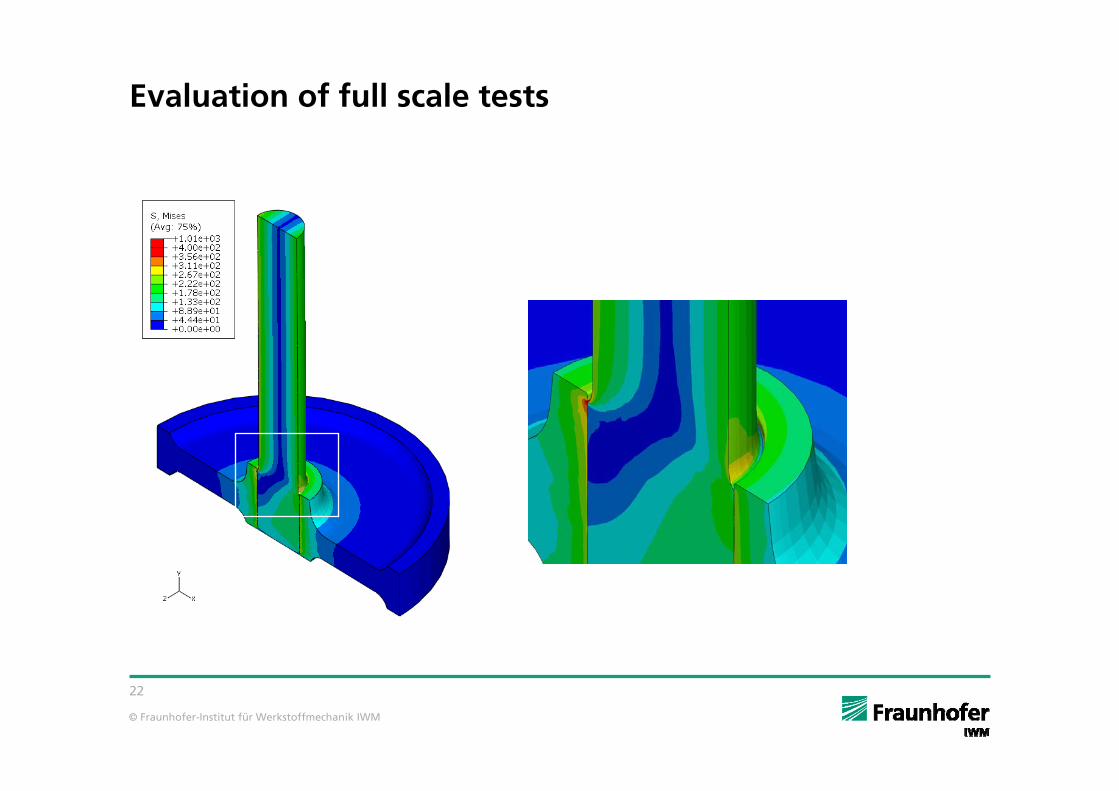
Evaluation of full scale tests
Finite-element modelling
Both elastic and elastic-plastic analyses
Variation of the coefficient of friction
© Fraunhofer-Institut für Werkstoffmechanik IWM
22
Evaluation of full scale tests

© Fraunhofer-Institut für Werkstoffmechanik IWM
23
Summary of fatigue tests
150
250
350
450
550
1E+4 1E+5 1E+6 1E+7N, LW
σ a o
r P S
WT,
MPa
plane fatigue, d = 10 mm
fretting fatigue, crack initiation
fretting fatigue, no crack initiation
median curve, fretting fatigue tests
full-scale press fit test, SWT
107106105104
Endurance limit according to DIN EN 13103/13104

© Fraunhofer-Institut für Werkstoffmechanik IWM
24
Summary of fatigue tests
150
250
350
450
550
1E+4 1E+5 1E+6 1E+7N, LW
σ a o
r P S
WT,
MPa
plane fatigue, d = 10 mm
fretting fatigue, crack initiation
fretting fatigue, no crack initiation
median curve, fretting fatigue tests
full-scale press fit test, SWT
full-scale press fit test, net stress
107106105104
Endurance limit according to DIN EN 13103/13104
net stress approach

© Fraunhofer-Institut für Werkstoffmechanik IWM
25
Conclusions
Results demonstrate a correlation between plane fatigue and fretting fatigue data (account for size effect!)
Lifetime of press fits can be predicted making use of the knowledge of material S-N curves and stress state in the component
Successful prediction for 5 out of 9 small specimens + full scale specimen

© Fraunhofer-Institut für Werkstoffmechanik IWM
26
Thank you for your attention


![Fatigue in Railway Inf [a. M. Robinson, A. Kapoor]](https://img.dokumen.tips/doc/110x75/55cf941e550346f57b9fc12f/fatigue-in-railway-inf-a-m-robinson-a-kapoor.jpg)