Embed Size (px)
Citation preview

DMD # 089151
1 / 53
Title page
Title:
Assessment and Confirmation of Species Difference in Nonlinear
Pharmacokinetics of Atipamezole with Physiologically Based
Pharmacokinetic Modeling
Authors:
Zheng Lia, You Gao a, Chunmiao Yang a, Yanan Xiang a, Wenpeng Zhanga, Tianhong
Zhanga, Ruibin Su a, Chuang Lub, and Xiaomei Zhuang*a
Afflictions:
a State Key Laboratory of Toxicology and Medical Countermeasures, Beijing Institute of
Pharmacology and Toxicology, Beijing, China
b Department of DMPK, Sanofi Company, MA, USA

DMD # 089151
2 / 53
Running Title Page
Running title: Nonlinear PBPK modeling of atipamezole
Corresponding Author:
Xiaomei Zhuang
State Key Laboratory of Toxicology and Medical Countermeasures
Beijing Institute of Pharmacology and Toxicology
Beijing
100850
China
Tel: +86 13683600728
Fax: +86 010 68211656
E-mail: [email protected]
Number of text pages: 16
Number of tables: 7
Number of figures: 9
Number of references: 40
Words in abstract: 249
Words in introduction: 716
Words in discussion: 1275
Nonstandard abbreviations:
AUC, area under the concentration-time curve; P450, Cytochrome P450; UGT,

DMD # 089151
3 / 53
UDP-glucuronosyltransferase; NADPH, β-nicotinamide adenine dinucleotide
phosphate, reduced; UDPGA, uridine diphosphate glucuronic acid; FIH: first
in human; PBS: phosphate buffer solution; LC-MS/MS, liquid
chromatography tandem mass spectrometry; PK, pharmacokinetics; RLM, rat
liver microsomes; HLM, human liver microsomes; IS, internal standard.

DMD # 089151
4 / 53
Abstract
Atipamezole, an α2-adrenoceptor antagonist, displayed nonlinear pharmacokinetics
(PK) in rats. The aim of this study was to understand the underlying mechanisms of
nonlinear PK in rats and linear PK in humans and develop physiologically based PK
models (PBPK) to capture and validate this phenomenon. In vitro and in vivo data
were generated to show that metabolism is the main clearance pathway of atipamezole
and species differences exists. Where CYP was responsible for the metabolism in
rats with a low Km, human specific UGT2B10 and 1A4 mediated N-glucuronidation
was identified as the leading contributor to metabolism in humans with a high Vmax
capacity. Saturation of metabolism was observed in rats at pharmacological relevant
doses but not in humans at clinically relevant doses. PBPK models were developed
using GastroPlus™ software to predict the pharmacokinetic profile of atipamezole in
rats after intravenous or intramuscular administration of 0.1-3 mg/kg doses. The
model predicted the nonlinear PK of atipamezole in rats and predicted observed
exposures within two-fold across dose levels. Under the same model structure, a
human PBPK model was developed using human in vitro metabolism data. The
PBPK model well described human concentration-time profiles at 10-100 mg doses
showing dose proportional increases in exposure. This study demonstrated that
PBPK is a useful tool to predict human PK when interspecies extrapolation is not
applicable. The nonlinear PK in rat and linear PK in human were characterized in
vitro and allowed the prospective human PK via i.m. dosing to be predicted at the
preclinical stage.

DMD # 089151
5 / 53
Significance Statement
This study demonstrated that PBPK is a useful tool for predicting human PK when
interspecies extrapolation is not applicable due to species unique metabolism.
Atipamezole, for example, is metabolized by CYP in rats and by N-glucuronidation in
humans that were hypothesized to be the underlying reasons for a nonlinear PK in rats
and linear PK in humans. This was testified by PBPK simulation in this study.

DMD # 089151
6 / 53
Introduction
Nonlinear pharmacokinetic (PK) profiles are observed in preclinical studies in part
because a wide dose range is studied. This sort of nonlinearity makes assessment of
the relationships of dose-toxicity and dose-efficacy difficult due to the occurrence of
non-dose-proportional exposure increase or decrease. It is therefore very crucial to
qualitatively elucidate the underlying mechanisms and quantitatively predict nonlinear
PK of a new chemical entity in humans (Fukuchi et al., 2007).
Atipamezole (Fig. 1) is a novel, potent and selective α2-adrenoceptor antagonist
devoid of significant interactions with other neurotransmitter receptors. It can
rapidly reverse sedation anesthesia induced by α2-adrenoceptor agonists. Hence, in
veterinary practice, atipamezole has been commonly used to recover animals from
sedation-anesthesia induced by α2-adrenoceptor agonists for over two decades (Ewing
et al., 1993). Animal studies suggest atipamezole enhanced sexual activity in rats
and monkeys (Viitamaa et al., 1995; Pertovaara et al., 2004) and improved behavioral
performance of rats subjected to focal cerebral ischemia (Puurunen et al., 2001;
Pertovaara et al., 2005). Studies also suggested that atipamezole might have
beneficial effects in the recovery from brain damage and might potentiate the
anti-Parkinsonian effects of dopaminergic drugs (Pitkänen et al., 2004).
Atipamezole is currently being investigated for human application, however, a clear
understanding of its disposition is lacking in both animals and humans.
Atipamezole has a high clearance and subject to significant first-pass clearance
(Pertovaara et al., 2005), hence, intravascular (i.v.) and intramuscular (i.m.) routes are

DMD # 089151
7 / 53
considered as potential drug administration routes.
In the literature, human pharmacokinetics of atipamezole was characterized in a
clinical study via single ascending i.v. administration at doses of 10-100 mg
(Karhuvaara et al., 1990). Our preclinical characterization of atipamezole
pharmacokinetics showed nonlinear PK in rats, yet linear increases in exposure were
reported for human at a comparable exposure compared to rats (AUC range ~100
-4000 h×ng/ml). When single i.v. administration of atipamezole were given to rats
from 0.3 to 3 mg/kg, the systemic plasma clearance of atipamezole decreased with
increased dose. Therefore, there was a need to understand the underlying disposition
of atipamezole in rats and humans and particularly the nonlinearity to better estimate
pharmacokinetic and pharmacodynamics relationship and further build confidence
around safety margins and dose escalation scheme for clinical trials with various
administration routes (Bachmann and Belloto, 1999; Tachibana et al., 2012; Chirehwa
et al., 2015; Wu et al., 2014).
Besides in vitro-in vivo extrapolation, traditional approaches for interspecies PK
extrapolation is based on allometric scaling, which is an empirical prediction from
animals to obtain human PK parameters (e.g., clearance, volume of distribution, Tang
and Mayersohn, 2006). Those methods can be applied only to drugs with linear PK
and no species unique metabolism exits for a given drug. For predicting and
understanding saturable PK of a new drug candidate, mechanistic modeling and
simulation approaches across species are increasingly being applied (Huang and
Rowland, 2012; Shebley et al., 2018). Among the modeling and simulation

DMD # 089151
8 / 53
approaches, physiologically based pharmacokinetic (PBPK) model is a powerful tool
to quantitatively delineate how certain extrinsic and intrinsic factors might influence
the non-proportional systemic exposures. PBPK modeling is based on
drug-dependent physicochemical and pharmacokinetic parameters as well as
drug-independent physiological systemic parameters to capture the kinetics and
dynamics of drug absorption, distribution, metabolism and excretion (ADME)
(Rowland et al., 2011; Liu et al., 2013; Jones et al., 2015; Zhuang and Lu, 2016; Li et
al., 2018). With broad application of PBPK modeling and many successful
examples of predicting human PK and DDI, it is particularly useful in capturing linear
and nonlinear processes simultaneously (Dong et al., 2011; Chen et al., 2013).
The purpose of this study is to utilize a PBPK modeling approach to predict both
rat and human PK and predict exposures in humans after various routes of
administration. To achieve this, key in vitro and in vivo data for atipamezole were
generated in rats (in vitro and in vivo) and in humans (in vitro only) to understand the
respective metabolism mechanisms and tissue partitioning. Then a bottom-up
combined with top-down PBPK model was developed and applied in the assessment
of nonlinear PK in rats and identifying the mechanism that led to the nonlinearity.
Ultimately, a PBPK model was built to predict human PK using all available
information from preclinical in vitro and in vivo studies, as well as the learnings from
the rat PBPK model.
Materials & Methods

DMD # 089151
9 / 53
Chemical and reagents. Atipamezole hydrochloride was supplied by chemical
synthesis laboratory of our Institute (Beijing, China) with purity greater than 99%
(Supplemental Figure 1 is the NMR spectrum; Li et al., 2019). Midazolam (MDZ),
1’-OH-MDZ, phenacetin, acetaminophen, diclofenac, S-mephenytoin,
4-OH-diclofenac, 4-OH-mephenytoin, bupropion, OH-bupropion, amodiaquine,
N-desethylamodiaquine, dextromethorphan, dextrorphan were all purchased from
Sigma-Aldrich (St. Louis, MO). Human liver microsomes (150-donor pool, mixed
sex), male rat liver microsomes, and recombinant UGT Supersomes (UGT1A1, 1A3,
1A4, 1A6, 1A8, 1A9, 2B4, 2B7, 2B10, 2B15, and 2B17) were purchased from
Corning Life Sciences (Tewksbury, MA). NADPH was purchased from Roche Life
Science (Basel-Stadt, Switzerland). Other reagents were of HPLC grade or better.
NADPH- and UDPGA-dependent hepatic clearance in liver microsomes. The
CYP-mediated metabolic stability was conducted in incubations containing 1 μM of
atipamezole in rat or pooled human liver microsomes (0.5 mg/ml) in 100 mM of
potassium phosphate buffer with 5 mM of MgCl2, pH 7.4. The mixture was
pre-incubated at 37 °C for 5 min. NADPH (final concentration of 1 mM) was added
to initiate the reactions. For UGT-mediated metabolic clearance assays, alamethicin
at final concentration of 25 μg/mg protein, 1 μM of atipamezole and rat or human
liver microsomes in 100 mM of potassium phosphate buffer (pH 7.4) were mixed on
ice for 15 min. The mixture was then pre-incubated at 37 °C for 5 min. UDPGA
(final concentration of 2.5 mM) was added to initiate the reactions. For combined
NADPH and UDPGA mediated metabolism assays, the pooled liver microsomes of
rat or human and drug solutions were treated as described above for the

DMD # 089151
10 / 53
glucuronidation assay. The reactions were initiated by adding mixture of NADPH (1
mM) and UDPGA (2.5 mM), final concentrations. Aliquots of the incubation were
removed at 0, 5, 15, and 30 min and diluted in 4× volume of chilled acetonitrile
containing internal standard to stop the reactions. After centrifugation at 13000 g for
10 min, the supernatant was collected and stored at -20 °C until LC-MS/MS analysis.
The in vitro t1/2 in liver microsomal incubation was calculated from the semi-log plot
of atipamezole concentration remaining vs. incubation time and intrinsic clearance
(CLint, ml/min/kg) was calculated as following:
(1)
For rat and human, X values of 40 and 25.7 were used, respectively (Davies and
Morris, 1993).
The conversion of CLint to hepatic clearance CLh by a well-stirred model is described
previously (Houston. 1994):
(2)
Identification of UGTs involvement in metabolism of atipamezole. To identify
the hepatic UGTs involved and understand the difference in metabolizing enzymes
responsible for the metabolism of atipamezole in humans, recombinant UGT of
UGT1A1, 1A3, 1A4, 1A6, 1A8, 1A9, 2B4, 2B7, 2B10, 2B15, and 2B17 were
incubated (0.5 mg/ml protein with 1 μM atipamezole) in a similar way as HLM
described above. The reaction product after incubation and protein precipitation was
analyzed on LC-MS/MS for the formation of glucuronides.
Measurement of Michaelis constant (Km) in RLM using substrate depletion

DMD # 089151
11 / 53
method. Due to the lack of authentic standards of atipamezole metabolites, the
Michaelis constant (Km) of atipamezole towards P450 mediated biotransformation in
RLM was obtained using a substrate depletion approach (Obach and Reed-hagen,
2002, Nath and Atkins, 2006). Various concentrations of atipamezole (0.32, 0.63,
1.25, 2.5, 5, 10, 20 µM) and rat liver microsomes (0.5 mg/ml) in 100 mM of
potassium phosphate buffer (pH 7.4) with 5 mM of MgCl2 were preincubated at 37 °C
for 5 min. NADPH (1 mM, final concentration) was added to initiate the reactions.
Aliquots were removed from incubations with various initial atipamezole
concentrations at 0, 2, 5, 10, 15, and 30 min time points. The reactions were
terminated by diluting the aliquots in 4× volume of chilled acetonitrile containing
internal standard. The samples were processed for analysis by mass spectrometry as
stated below. The log transformed percentage remaining of atipamezole were
plotted against each time point for each incubation group to obtain the substrate
depletion rate constants (kdep). Km value was then determined from the inflection
point of a plot of the kdep values versus the initial atipamezole concentrations in a
semi-log plot following Eq. 3:
(3)
where [S] is the substrate concentration, kdep([S] = 0) represents the theoretical maximum
substrate depletion rate constant at an infinitely low-substrate concentration, and Km is
the Michaelis constant.
Enzyme kinetic parameters for UGT-mediated metabolism in HLM. A
metabolite profiling study indicated that atipamezole is mainly metabolized by UGT
in HLM and generate a single N-glucuronidation metabolite. The enzyme kinetic
parameters (Km and Vmax) of atipamezole in HLM were obtained by determining the

DMD # 089151
12 / 53
formation of the UGT-conjugation metabolite at different atipamezole concentrations.
Similar procedure as described above for the HLM clearance assay was applied in a 5
min incubation with initial concentration of 0.32, 0.63, 1.25, 2.5, 5, 10, and 20 µM.
The amount of UGT-conjugated metabolite formed (pmol/min/mg protein) was
calculated in the reference of known amount of atipamezole disappearance as
described by Eq.4:
(4)
The data were analyzed with the nonlinear analysis to generate Km and Vmax values
(Pharsight Corporation, USA).
Non-specific protein binding. The extent of protein binding of atipamezole to
plasma and liver microsomes of rat and human, and major tissue homogenates of rat
(liver, kidney, lung, brain, fat, spleen, heart, gonad, and muscle) were determined
using a 48-well Rapid Equilibrium Dialysis device (Thermo Bioscience, Woburn,
MA). All rat tissues were homogenized in 4x volume (w/v) of PBS (pH 7.4). Rat
or human plasma was spiked with atipamezole at three concentrations (1, 3 and 10
μM). Rat or human liver microsomes (0.5 mg/ml protein) and other tissue
homogenates were spiked with atipamezole at final concentration of 1 μM. Aliquots
of 200 μl of the spiked biological matrices were loaded into the donor side of a
dialysis apparatus and 350 μl of buffer was added to the receiving side. The
apparatus was incubated in a shaking incubator at 37°C for 4h. After incubation, the
samples from donor and receiving chambers were diluted in the same matrixes in the
other chamber so the final matrix composition was the same. The resulting samples
were precipitated in acetonitrile with IS. The atipamezole concentrations were
determined by LC-MS/MS.

DMD # 089151
13 / 53
The unbound fraction of atipamezole in plasma or liver microsomes (ƒu,x) was
calculated as shown in Eq. 5, and unbound fraction in the tissue homogenate (ƒu,t) was
calculated according to Eq. 6.
ƒu,x = Concbuffer chamber/Concplasma/liver microsomes chamber (5)
ƒu,t = Concbuffer chamber/Conctissue homogenate chamber (6)
The measured unbound fractions would be higher when a tissue is homogenized
and diluted in buffer, the unbound fractions in an undiluted tissues (ƒu,tissue) were
calculated using Eq. 7.
,
, hom
1/ =
((1/ ) 1) 1/u tissue
u tissue ogenate
DUndiluted f
f D− + (7)
Where D represents the fold of dilution factor in tissue homogenates. The free
fraction of plasma and undiluted tissue are used in tissue-to-plasma exposure ratio
calculation (Kalvass and Maurer, 2002).
Blood to plasma partitioning. The blood/plasma concentration ratio (Rbp) of
atipamezole was determined by incubating the compound with fresh whole blood
from rats and humans. Atipamezole (final concentration1 µM) was added to whole
blood and an equal volume of plasma isolated from the same blood which served as a
control for the whole blood concentration. The spiked whole blood and plasma were
incubated at 37°C for 1 h. After incubation, the blood was centrifuged at 2000×g for
10 min, and 50 µl aliquots of plasma were removed. All incubations were
performed in triplicate. The concentrations of atipamezole in plasma separated from
the blood and plasma spiked directly with atipamezole were determined by
LC-MS/MS. Rbp was calculated by dividing the concentration in the plasma spiked
directly with atipamezole by the concentration in the plasma separated from blood
after incubation.

DMD # 089151
14 / 53
Disposition and tissue distribution of atipamezole in rats. Male SD rats (200
to 220 g) were obtained from Beijing Vital River Laboratory Animal Technology Co.,
Ltd. (Beijing, China). Animals were housed in a temperature and
humidity-controlled room with a 12 h light/dark cycle. They were fasted 12 h prior
the experiments and had ad libitum access to water. The animal experiments were
conducted in the Beijing Center for Drug Safety Evaluation and according to a
protocol approved by the Institutional Animal Care and Use Committee of the Center,
which followed the guidelines of the Association for Assessment and Accreditation of
Laboratory Animal Care International (AAALAC). The animal protocol number is
IACUC-2017-053. For PK investigation, 36 rats were randomly divided into six
groups (each group consisting of six rats). Three groups were given intravenous (i.v.)
bolus injection of atipamezole solution via the tail vein at the doses of 0.3, 0.9, 3
mg/kg. The other three groups were given intramuscular (i.m.) injection of
atipamezole solution at the doses of 0.1, 1, and 3 mg/kg. Atipamezole was
formulated in saline. For all groups, at sampling times of 0, 0.033, 0.083, 0.25, 0.5,
1, 2, 4, 6, 8, 10, 12 and 14h after dosing, 0.2 ml blood samples were collected into
heparinized polypropylene tubes. The plasma samples were collected after
centrifugation of the blood samples at 2000×g for 10 min and stored at -20oC until
analysis using an established LC-MS/MS method.
For tissue distribution study, 24 male rats (6 animals for each time point) were
dosed (i.m.) with the atipamezole solution at 1 mg/kg. The animals were
anaesthetized and exsanguinated at 0.25, 1, 4, 24h post dose. After perfusion with

DMD # 089151
15 / 53
PBS via ventriculus sinister for 2 minutes, major tissues (liver, kidney, lung, brain,
adipose, spleen, heart, gonad, and muscle) were harvested and rinsed with cold saline
and blotted dry with filter paper. Tissue samples were homogenized and
atipamezole quantitated along with plasma samples using the LC-MS/MS method.
The tissue-to-plasma concentration ratios were calculated by dividing tissue
concentration over plasma concentration at the indicated time (0.25, 1, 4, 24h post
dose) and referred as the tissue-to-plasma partition coefficient (Kp).
Brain distribution at different dosage. 36 male rats were divided into 3 groups
and dosed with the atipamezole solution at 0.3, 1 and 3 mg/kg i.m. Animals were
anaesthetized and then exsanguinated at 0.25, 1, 4, 24h after dosing (3 animals for
each time point). Plasma and brain were harvested and processed with the same
methods described above for atipamezole concentration determination.
Sample process and analysis methods. Plasma, blood, microsomal, and tissue
homogenates samples were precipitated with 4× volume of acetonitrile followed by
centrifugation to remove protein. The acetonitrile contains propranolol (30 ng/ml) as
internal standard (IS). The concentrations of atipamezole in all samples were
determined by a reported LC-MS/MS method (Li et al., 2019) using an MRM positive
mode with mass transition (m/z) of 213.1 to117.0. The method fulfilled with pre-set
acceptance criteria (in-house analytical method validation protocol), including QC
precision (RSD less than 15%), QC accuracy (85%-115%), stability (precision and
bias less than ±15% for three cycles of freeze/thaw). Long team stability was tested
at -20°C and -40°C for 4 weeks and short team stability was tested for 24 h at room

DMD # 089151
16 / 53
temperature. The calibration/standard curve linearity ranges 0.5-1000 ng/ml with
correlation coefficient r2 >0.99. The method met the acceptance criteria according to
the bioanalytical method validation standard established by the FDA. The
pharmacokinetic parameters for atipamezole were calculated by noncompartmental
analysis using WinNonlin Phoenix v6.3 (Pharsight, Sunnyvale, CA).
Atipamezole GastroPlusTM PBPK model. A full PBPK model was constructed
for atipamezole mainly using bottom-up and top-down approach (Jamei et al., 2009)
in GastroPlusTM simulator (version 9.6). The work flow of the model construction,
verification and prediction is presented in Fig. 2. PBPK model was initially
developed for a simple pharmacokinetic profile of atipamezole in rats via i.v. route at
low dose (0.3mg/kg) which only includes clearance and distribution processes. Key
parameters (i.e., physicochemical parameters, Rbp, fu,p, fu,mic), Km value generated from
RLM incubation, Vmax value back-calculated from in vivo clearance and measured Kp
values of individual tissues were as input information are presented in Table 1 and
Table 2. Then the nonlinear pharmacokinetic profiles of atipamezole in rats via i.v.
administrative across ascending dosages were verified with observed data from rat PK
studies. In the next step, the PBPK model was employed for rat i.m.
pharmacokinetic by alternating the dosing route. After nonlinear PK behaviors of rat
were successfully observed with both i.v. and i.m. dosing routes, this PBPK model
was extrapolated to human using human specific parameters, i.e. in vitro enzyme
kinetic data combined with tissue distribution profiles converted from Kp values
obtained in rats corrected with plasma binding data (Table 2). Population-dependent

DMD # 089151
17 / 53
physiological parameters in the Population Estimates for Age-Related PhysiologyTM
(PEAR) module of GastroPlusTM v9.7 were used in our human PBPK model.
Customized information, such as age, gender, height, and body weight in a Caucasian
population were set up to match the patient characterization in a published clinical
trial which was used to verify our human model (Karhuvaara et al., 1990).
Statistical analysis. In in vitro study, replicated incubations/samples were
performed (n=3), and all positive and negative control groups were included
simultaneously. In in vivo study, replicated animals/samples were performed (n=6).
All measured data were presented as means±standard deviation. For the
comparison of measured Kp values of individual tissues and their predicted Kp values
using the GastroPlusTM software (Table 2), ratio of two values beyond 0.5-2 is defined
as significant difference. For accuracy assessment of a model simulation,
acceptance is set to be within 2-fold. For comparison between groups, the
statistically significant difference is set for a P value of less than 0.05 using analysis
of variance, with the Student's t-test.
Results
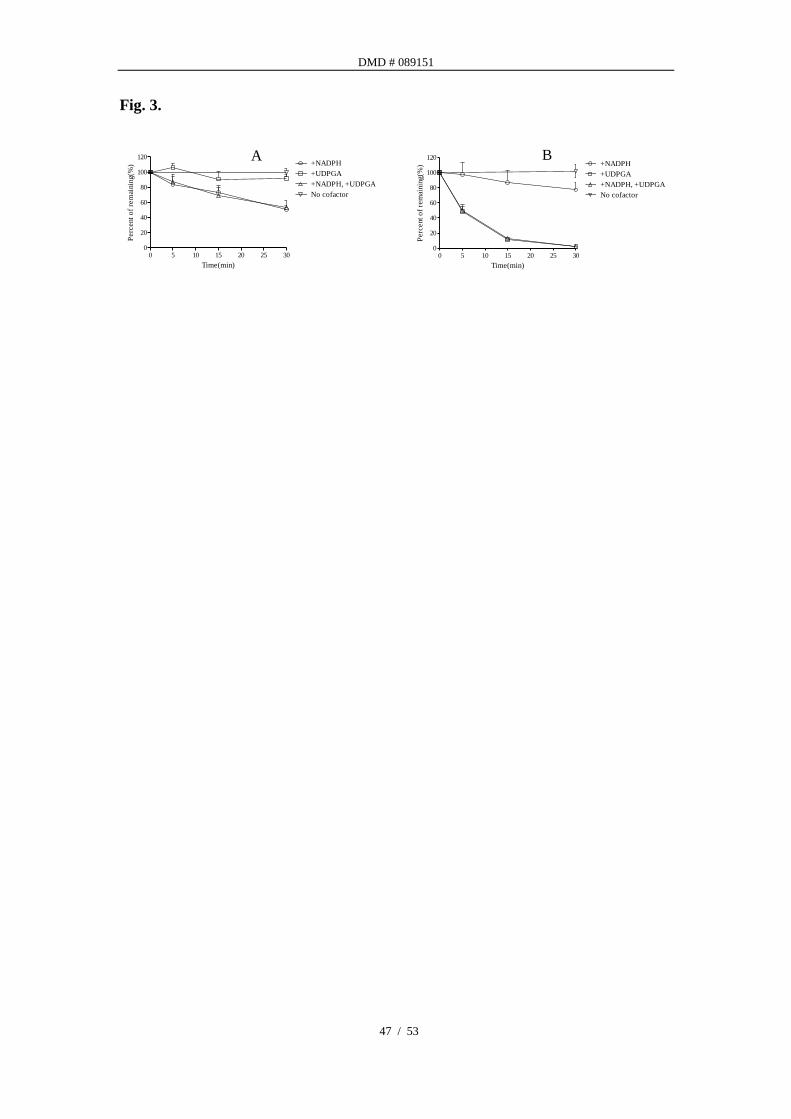
In vitro metabolic stability of atipamezole. Atipamezole was found to be
metabolized in RLM and HLM to different extents in presence of co-factors of CYPs
(NADPH) and/or UGTs (UDPGA). The percentages of atipamezole remaining at
various time points are presented in Fig. 3. The turnover of atipamezole in RLM
only occurred in the presence of NADPH, no decrease of parent drug concentration
was observed in the presence of UDPGA. Co-incubation with both cofactors had
similar depletion rate as the NADPH only (Fig. 3A). In HLM, the disappearance

DMD # 089151
18 / 53
rate of atipamezole is much greater in the presence of UDPGA than in the presence of
NADPH. Co-incubation with both cofactors led to almost no increase in turnover
rate as UDPGA alone suggested the direct glucuronidation was the major clearance
pathway in HLM (Fig. 3B). The intrinsic clearance and extrapolated hepatic
clearance of atipamezole were calculated from data presented in Fig. 3.
In RLM, the hepatic clearance of atipamezole driven by CYP was 31.7±0.8
ml/min/kg which was close to rat in vivo clearance (39.9±5.8 ml/min/kg, Table 5).
Additionally, an earlier metabolism profiling study in rats detected little parent drug
in urine and bile and circulating oxidized-metabolites were mainly presented in bile
(data not presented). That confirmed hepatic metabolism is the major clearance
pathway for atipamezole in rats catalyzed predominantly by P450.
In HLM, UGT-mediated hepatic clearance (19.4±0.02 ml/min/kg) played a more
important role compared to that by CYP (9.7±1.8 ml/min/kg). With the presence of
both NADPH and UDPGA, the hepatic clearance (19.3±0.04 ml/min/kg) is almost
identical to that of only UDPGA presence as a cofactor (Table 3). UGT-mediated
hepatic clearance is also close to the in vivo clearance of atipamezole reported in
human (21.3±2.8 ml/min/kg) (Karhuvaaral et al., 1990), as well as to human hepatic
liver blood flow (20.7 ml/min/kg) (Davis and Morris, 1993). These results
demonstrated that hepatic metabolism is the leading elimination route of atipamezole
in humans catalyzed primarily by UGT. The in vitro and in vivo metabolite
identification has also been conducted in HLM and RLM with NADPH or UDPGA as
cofactors and bile from BDC rat to testify the liver metabolism (Supplemental Figure

DMD # 089151
19 / 53
2-6, Li et al., 2018). Three oxidation metabolites were identified in RLM and HLM
in the presence of NADPH. In the bile of BDC rat, the same three oxidation
metabolites were excreted. Additionally, only a single UGT-conjugated metabolite
was found in HLM with UDPGA.
Recombinant UGTs involved in human hepatic metabolism. Among 11
rUGTs tested, only UGT2B10 and 1A4 were identified to contribute to the hepatic
metabolism of atipamezole. Based on equal molar incubations, rUGT2B10 played a
more important role than rUGT1A4 at an approximately 15:1 ratio.
Michaelis constant of atipamezole in RLM and HLM. Two methods were
utilized to estimate the Michaelis constant of atipamezole in RLM and HLM due to
the different metabolizing enzyme involved in the biotransformation of atipamezole in
in rats and humans and lack of metabolite standards. In RLM, the kdep values at
various initial concentrations were determined using a substrate depletion assay
(Obach et al., 2002; Nath and Atkins 2006)). The plot of in vitro depletion rate
constants versus substrate concentration for atipamezole in RLM is shown in Fig. 4A.
The obtained total Km value in RLM was 1.7±0.03 µM (361±6 ng/ml). The enzyme
kinetic parameters of atipamezole in HLM were determined using the
N-glucuronidation metabolite formation rate. The Km and Vmax values obtained from
the Michaelis-Menten plot were 2.89±0.27 µM (614±57 ng/ml) and 1.07±0.03
nmol/min/mg protein, respectively (Fig. 4B).
Unbound fractions of atipamezole in plasma. Atipamezole was tested in rat
and human plasma at 37 oC for 4 hours and found to be stable (with recoveries of

DMD # 089151
20 / 53
96.7-113.8%). Unbound fractions of atipamezole in rat or human plasma were
determined to identify the potential of protein binding effect on nonlinear PK. Our
results showed no obvious species difference in the unbound fraction in plasma, the
atipamezole free fraction was 0.085 for rats and 0.067 for humans. Moreover, the
unbound fractions in rat or human plasma were concentration independent (Table 4).
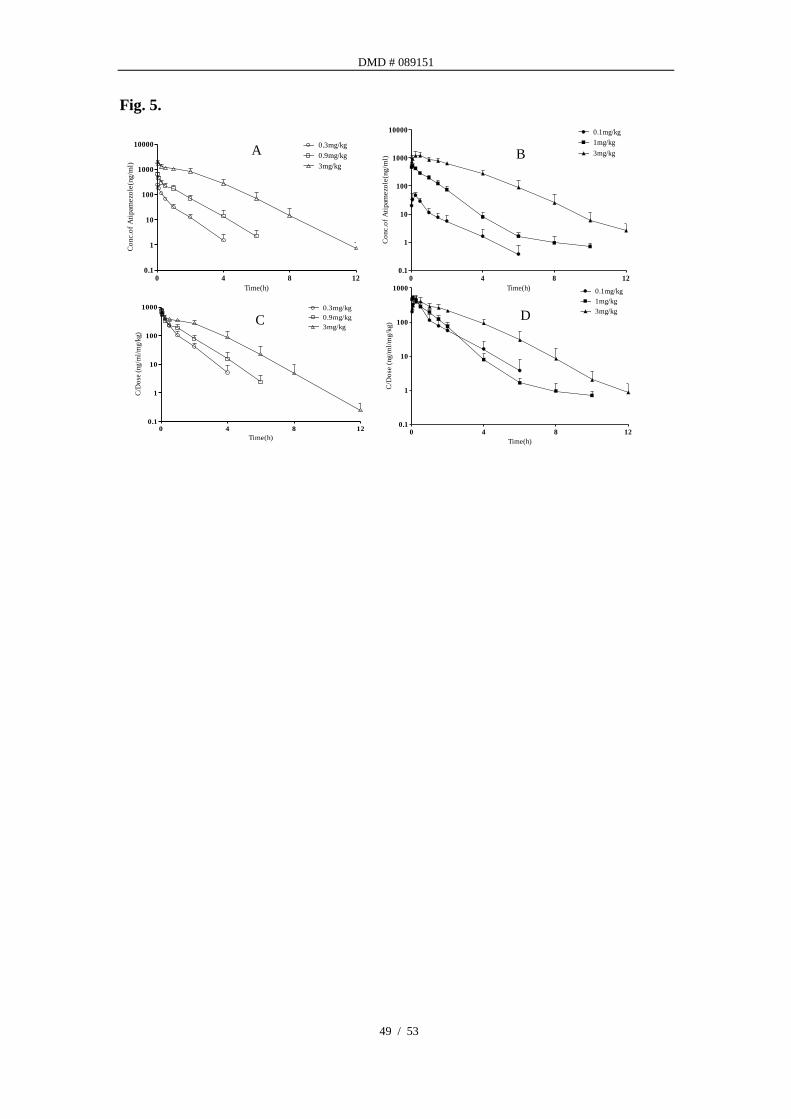
Nonlinear PK behavior of atipamezole in rats. Mean atipamezole plasma
concentration-time profiles in rats after various i.v. (A) and i.m. (B) doses are
presented in Fig. 5. Existence of marked nonlinear pharmacokinetics at 3 mg/kg is
manifested by the dose-normalized AUC profiles in both i.v. (C) and i.m.
administrations (D). Pharmacokinetic parameters (Table 5) showed ~3-fold increase
in dose (~1 to 3 mg/kg) resulted in 7.7 and 6.1-fold increase in AUC after i.v. and i.m.
administration, respectively, indicating a super-proportional dose-exposure
relationship. Total plasma clearance after intravenous dosing decreased notably
when dose increased from 0.3 mg/kg to 3 mg/kg (i.e. from 39.96 ml/min/kg to 13.96
ml/min/kg). However, no obvious changes were observed in volume of distribution
(i.v. route) and dose normalized Cmax (i.m. route).
In vitro unbound Km value of atipamezole in RLM is 137 ng/ml (0.65 µM) which is
close to the unbound Cmax (109 ng/ml) observed in rats after i.m. administration of 3
mg/kg of atipamezole. The unbound Cmax was calculated from the total Cmax of 1283
ng/ml with an average fu,plasma of 0.085 from the present study. The nonlinear PK
may be attributed from the saturation of hepatic CYP metabolism in rats. In contrast,
the in vitro unbound Km value of atipamezole in HLM in the presence of NADPH and

DMD # 089151
21 / 53
UDPGA was 361 ng/ml (1.7 µM) which is much higher than the unbound Cmax of 33
ng/ml (0.16 µM) reported in clinical trial at 100 mg QD dose (Karhuvaara et al.,
1990).
Brain tissue distribution. Further investigation on potential factors contributed
toward the nonlinear PK behavior was focused on the drug target tissue, i.e. brain to
plasma ratios (Kp) at different doses, to investigate whether there is a target mediated
drug disposition (TMDD). Disproportional increase of exposure in brain was
observed as the fold of concentrations normalized to the low dose increased from
1-fold to 3.9 and 17.4-fold with dose increased from 0.3 to 1 and 3 mg/kg (observed
and predicted AUCs are presented in Table 7), respectively. However, the Kp,uu
values stayed around 1.4-1.5 from 0.3 mg/kg to 3mg/kg suggesting a rapid
equilibrium of atipamezole between brain and plasma and the nonlinear brain
concentration is mainly driven by plasma concentration.
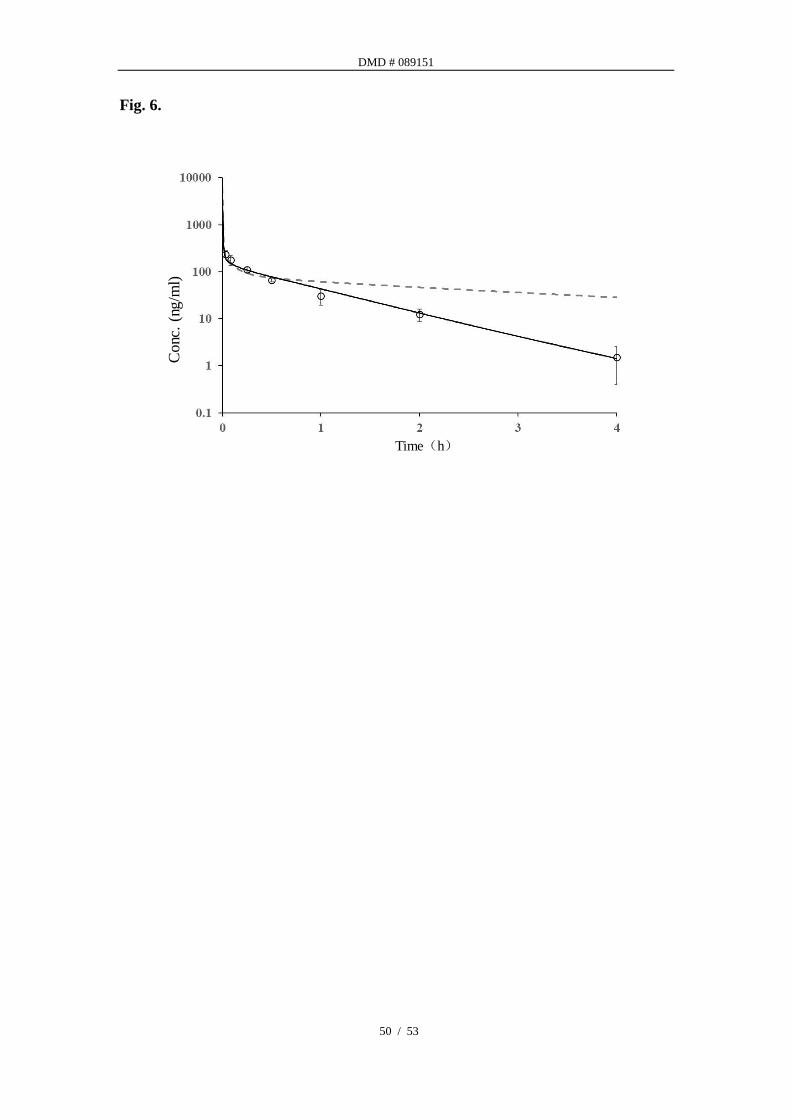
PBPK modeling in rats. PBPK model was established in rats with modules of
passive diffusion and metabolic clearance using, 1) a back-calculated Vmax from in
vivo clearance and in vitro determined Km, and 2) distribution parameters (Kp)
determined from tissue distribution assays in various organs. Lukacova Kp (Miller et
al., 2019) method was also used to predict the Kp values. The predicted and
measured Kp values of individual tissues (Table 2) were found to be statistically
deferent, i.e. measured and predicted value ratios were beyond 0.5-2 folds in most of
the organs. This led us to use the measured tissue partitioning values instead of the
predicted values. A comparison of PK profiles using either measured or predicted
DMD # 089151
22 / 53
Kp values are presented in Fig. 6, along with the observed PK from in vivo study. As
one can tell, the PBPK simulation using predicted Kp values led to poor prediction of
PK.
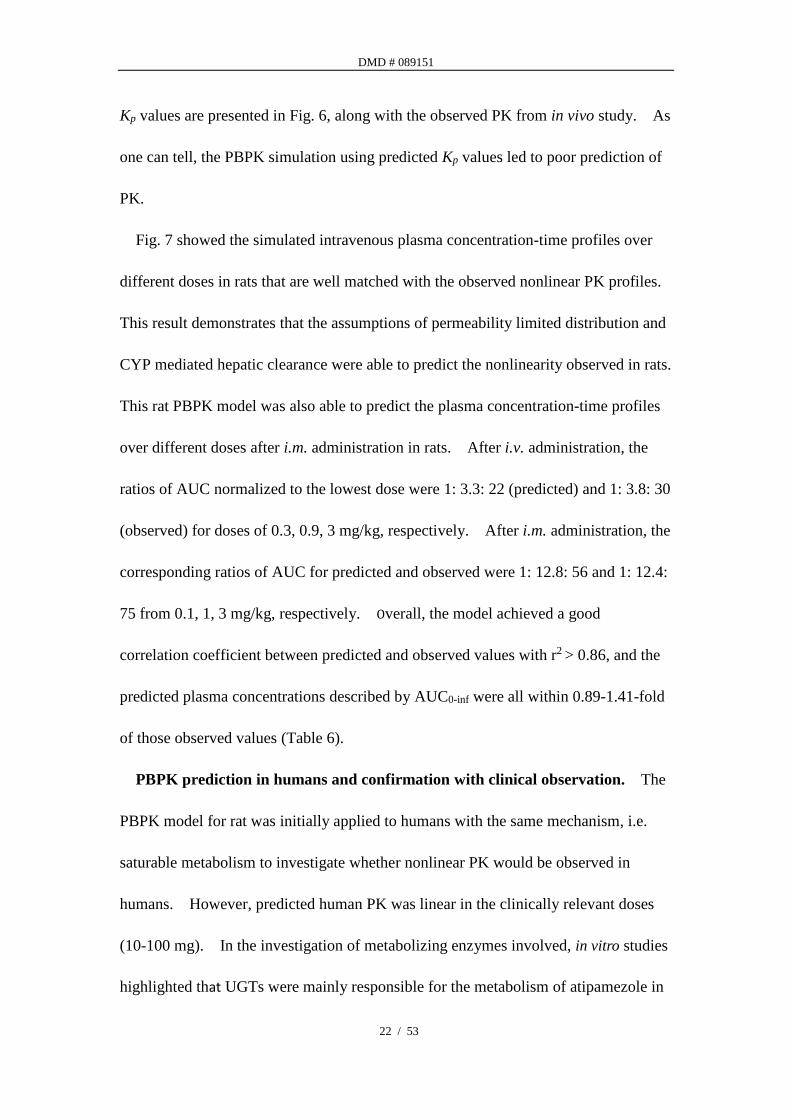
Fig. 7 showed the simulated intravenous plasma concentration-time profiles over
different doses in rats that are well matched with the observed nonlinear PK profiles.
This result demonstrates that the assumptions of permeability limited distribution and
CYP mediated hepatic clearance were able to predict the nonlinearity observed in rats.
This rat PBPK model was also able to predict the plasma concentration-time profiles
over different doses after i.m. administration in rats. After i.v. administration, the
ratios of AUC normalized to the lowest dose were 1: 3.3: 22 (predicted) and 1: 3.8: 30
(observed) for doses of 0.3, 0.9, 3 mg/kg, respectively. After i.m. administration, the
corresponding ratios of AUC for predicted and observed were 1: 12.8: 56 and 1: 12.4:
75 from 0.1, 1, 3 mg/kg, respectively. Overall, the model achieved a good
correlation coefficient between predicted and observed values with r2 > 0.86, and the
predicted plasma concentrations described by AUC0-inf were all within 0.89-1.41-fold
of those observed values (Table 6).
PBPK prediction in humans and confirmation with clinical observation. The
PBPK model for rat was initially applied to humans with the same mechanism, i.e.
saturable metabolism to investigate whether nonlinear PK would be observed in
humans. However, predicted human PK was linear in the clinically relevant doses
(10-100 mg). In the investigation of metabolizing enzymes involved, in vitro studies
highlighted that UGTs were mainly responsible for the metabolism of atipamezole in

DMD # 089151
23 / 53
humans which is different from that in rats.
In addition, liver clearance can be roughly expressed by UDPGA-mediated
clearance. For distribution, Kp values from rats were calibrated using human fu,plasma
to predict Kp in humans. This calibration was based on the observation that the
predicted volume of distribution in rats is close to the actual observed value of
distribution, and tissue distributions tend to have little species difference (Rowland et
al., 2011). These assumptions were further confirmed by our human PBPK
modeling, as the predicted plasma AUCs and volume of distribution were in good
agreement with the available clinical data from three doses from the literature
(Karhuvaara et al., 1990).
As mentioned above, besides using the transformed Kp values from rats, in vitro
measured Vmax and Km in HLM in the present with NADPH and UDPGA and fu,mic
were used in our model to define the overall clearance and metabolic pathways. The
observed and predicted human PK profiles for each group are presented in Fig. 8 and
Table 6. These data showed the predicted PK captured the reported PK quite well
with about 155%-175% over prediction. A few factors may contribute to this
deviation, such as the sparse clinical time points and the use of in vitro hepatic
clearance as the whole-body clearance. For i.m. administration, the predicted human
PK was conducted at projected efficacious doses of 10-100 mg as well as higher doses.
The PK is proportional to the dose up to 1000 mg (Fig. 9) and then becomes greater
than proportional above 1000 mg.
Considering atipamezole has no species differences in its receptor affinity for

DMD # 089151
24 / 53
α2-adrenoceptor subtypes in humans and rodents (Haapalinna et al., 1997), brain
exposure in rats under pharmacological efficacious dose (1 mg/kg, i.m.) is a practical
way to bridge to human efficacious exposure. Table 7 summarized the PBPK model
predicting brain exposure of atipamezole in rats and humans at different doses, along
with the observed exposure from this study. Results showed AUC in human brain at
30 mg/person is close to that in rats at 1 mg/kg.
Discussion
When a drug candidate shows nonlinear PK in preclinical study, it can be a
challenge to predict an appropriate efficacious dose for clinical trials. Special
attention is also required when carrying out dose escalation during phase I clinical
trials. Hence, it is important to understand the factors contributing to the nonlinear
PK. Nonlinear PK is believed to be mainly associated with absorption, hepatic
metabolism, protein binding, liver uptake, or target tissue distribution (Ludden, 1991;
Han et al., 1999; Takeuchi et al., 2001). During the preclinical PK study of
atipamezole in rats, AUC normalized by the dose (AUC/dose) was found to increase
markedly beyond 500 ×10-6 h×kg/ml as the dose increased. This dose-dependent
nonlinear exposure is within the efficacy regiment in rats (unpublished pharmacology
study data in rats). Plasma protein binding was consistent across the rats and humans
at different concentrations. The drug target site of atipamezole is mainly in CNS,
and brain distribution could be an additional pathway of drug disposition/elimination
(Smith et al., 2018). Our results show that although brain concentration was
dose-dependent super-proportional increased, the Kp,uu values was consistent across

DMD # 089151
25 / 53
doses, suggesting that brain free concentrations were driven by the plasma free
concentrations, and in turn, the efficacy. To elucidate whether liver uptake is also
involved in the saturable pharmacokinetics of atipamezole, transport experiments with
LLC-PK1/MDR1 cells was carried out. The average Papp (a-b) and Papp (b-a) of
atipamezole is 80.3±5.8×10⁻⁶ and 88.0±8.4×10⁻⁶ cm/s (Li et al., 2019), respectively,
suggesting high permeability and passive transport of atipamezole across the
bio-membrane to be a major mechanism, even if an active uptake might exist. On
the other hand, although the Kp values of several tissues are far higher than 1, the Kp,uu
values were much lower than Kp values after corrected by fu (Kp,uu in Table 2).
Especially, with low value of the Kp,uu of liver (0.06), together with high intrinsic
clearance suggesting extensive metabolism occurred in liver and that attributes to low
intracellular free drug concentration (Lu et al., 2006). Therefore, it suggested active
uptake is unlikely to play a critical role in the mechanisms of the nonlinearity.
However, it would be beneficial to further investigate this subject to clarify the
possibility of involvement of carrier-mediated uptake, especially in humans. Mass
balance study in rats showed a minimal parent recovery in feces and urine with less
than 1% (0.28%). Metabolites of atipamezole were mainly detected in bile,
suggesting the liver is the major elimination organ for atipamezole. Taken together,
target site distribution has limited impact on the nonlinear PK of atipamezole, and
saturation of metabolism seemed to be the main reason for nonlinear PK in rats.
In liver microsomes of rats and humans, significant difference in the hepatic
clearance of atipamezole was identified. The clearance of atipamezole in rats was
DMD # 089151
26 / 53
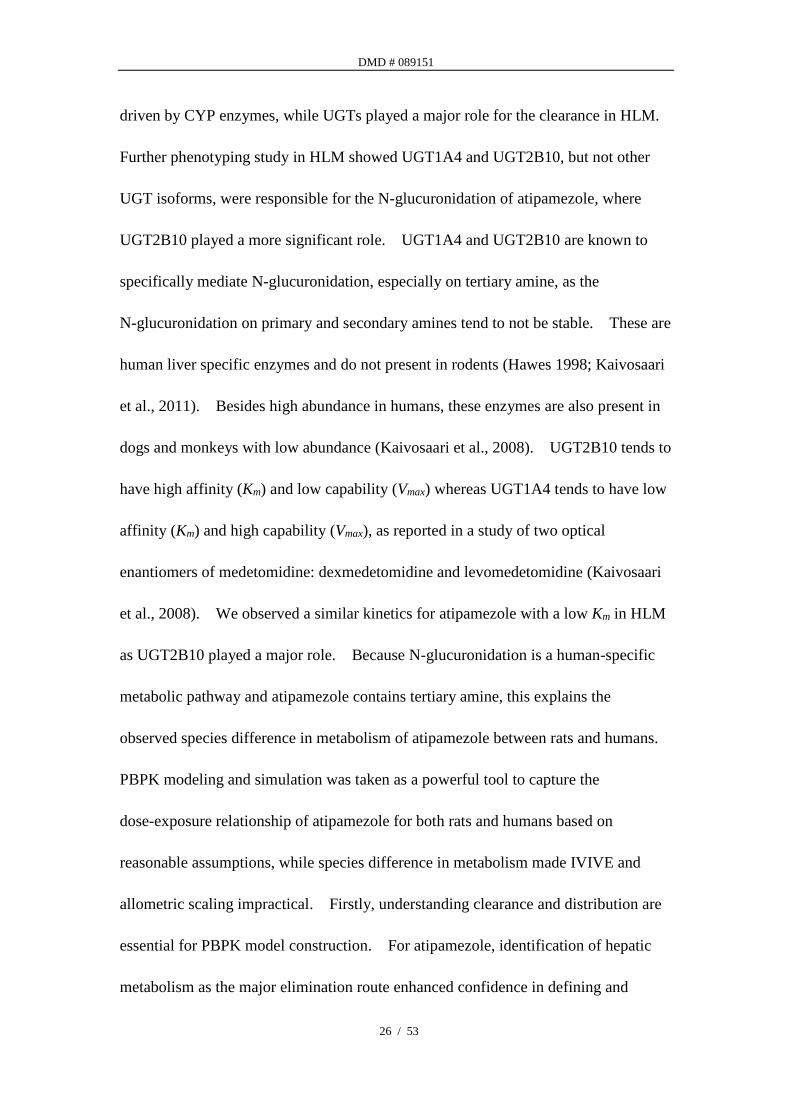
driven by CYP enzymes, while UGTs played a major role for the clearance in HLM.
Further phenotyping study in HLM showed UGT1A4 and UGT2B10, but not other
UGT isoforms, were responsible for the N-glucuronidation of atipamezole, where
UGT2B10 played a more significant role. UGT1A4 and UGT2B10 are known to
specifically mediate N-glucuronidation, especially on tertiary amine, as the
N-glucuronidation on primary and secondary amines tend to not be stable. These are
human liver specific enzymes and do not present in rodents (Hawes 1998; Kaivosaari
et al., 2011). Besides high abundance in humans, these enzymes are also present in
dogs and monkeys with low abundance (Kaivosaari et al., 2008). UGT2B10 tends to
have high affinity (Km) and low capability (Vmax) whereas UGT1A4 tends to have low
affinity (Km) and high capability (Vmax), as reported in a study of two optical
enantiomers of medetomidine: dexmedetomidine and levomedetomidine (Kaivosaari
et al., 2008). We observed a similar kinetics for atipamezole with a low Km in HLM
as UGT2B10 played a major role. Because N-glucuronidation is a human-specific
metabolic pathway and atipamezole contains tertiary amine, this explains the
observed species difference in metabolism of atipamezole between rats and humans.
PBPK modeling and simulation was taken as a powerful tool to capture the
dose-exposure relationship of atipamezole for both rats and humans based on
reasonable assumptions, while species difference in metabolism made IVIVE and
allometric scaling impractical. Firstly, understanding clearance and distribution are
essential for PBPK model construction. For atipamezole, identification of hepatic
metabolism as the major elimination route enhanced confidence in defining and

DMD # 089151
27 / 53
inputting clearance in our PBPK models. In addition, metabolism-related
nonlinearity is often influenced by the drug plasma concentrations as well as its
kinetic parameters (Km and Vmax) for hepatic metabolism enzymes (Ludden, 1991).
Determination of Km, is usually assessed by the rate of metabolite formation against a
series of substrate concentrations. However, authentic metabolites are required in
this approach to quantify the formation of metabolite(s), which often are not available
in drug discovery or even development stages. For atipamezole, due to multiple
CYP-mediated oxidation, metabolites were identified in RLM incubation and standard
metabolites were not available. As such, the parent disappearance half-life assay at
different atipamezole concentrations to capture the saturation of metabolism phase
was applied to determine the Km in RLM (Obach and Reed-Hagen, 2002). A later
publication provides a method to calculate the Vmax from the same set of data (Nath
and Atkins 2006). The Vmax of atipamezole calculated from Nath and Atkins’s
method was within 2-fold of that back calculated from in vivo clearance. In this
study, the back calculated Vmax of atipamezole with a middle-out approach was used
in the PBPK modeling. In HLM, since glucuronidation metabolite was found to be
the dominant metabolite in a metabolite profiling study, in vitro measured Km and
Vmax values toward UGT-mediated N-glucuronidation of atipamezole were directly
employed in the PBPK model by a bottom-up approach.
Understanding tissue distribution is also essential for PBPK modeling. In the
present study, tissue distribution experiments in rats indicated atipamezole distributed
rapidly to most tissues, including lung, liver, spleen, brain, adipose, kidney, heart, and

DMD # 089151
28 / 53
muscle, and their concentration-time profiles were parallel to the blood
concentration-time curve. In the full PBPK distribution model, we therefore
assumed that the drug distributes instantaneously and homogeneously within each
tissue and that its uptake is limited by the blood flow (perfusion limited module in the
GastroPlusTM). Furthermore, in the current study, transporter-mediated tissue
permeation and distribution for atipamezole were not considered based on a previous
study that showed atipamezole is not a substrate of P-gp (Li et al., 2019). The
tissue-to blood partitioning coefficients (Kp) were determined in rats and incorporated
into the PBPK model with respective free fractions (fu,t) for each individual tissue.
Our results also show that using experimentally determined Kp values generated better
PK prediction in PBPK modeling, although software prediction based on
physicochemical properties has certain merit. The Kp values are believed to carry
minimal species difference, thus in this study, converted human Kp values were
calculated from the ratio of free concentration of atipamezole in human plasma over
its free concentrations in rat tissues. The PBPK prediction using these converted Kp
values showed a good PK prediction in humans. Although intramuscular
administration is not a popular route in drug administration, it is still an effective
route for first-aid administration and avoiding first-pass elimination. In the rat
PBPK modeling of atipamezole via i.m. administration, selecting suspension
formation in the software was found to provide a better prediction of PK profiles (e.g.
Tmax and Cmax) over the solution formation. This might be attributed to the fact that
administration of a drug in solution via i.m. route would have a similar delay in

DMD # 089151
29 / 53
absorption, as well as distribution in the body as if the drug was in suspension.
In summary, our study exemplifies that sometimes there is a “cross species barrier”
for extrapolating animal PK to human PK. Understanding the species similarity or
difference in metabolism/transport and sometimes excretion is important in the
preclinical space for the prediction of PK or DDI risks in human. This study
demonstrates a PBPK model that can capture nonlinear PK in rat with both i.v. and
i.m. dosing routes. It provides insights into potential clinical application of
atipamezole via i.v. or i.m. administration routes.

DMD # 089151
30 / 53
Acknowledgment
The authers greatly appreciate the help of Dr. Jennifer Fretland in editing this
manuscript.
Authorship Contributions
Participated in research design: Zhuang, Li, Su, and Lu.
Conducted experiments: Li, Gao, Yang, Xiang, and Zhang.
Contributed new reagents or analytic tools: Su.
Performed data analysis: Zhuang, Li, and Zhang.
Wrote or contributed to the writing of the manuscript: Zhuang, Li, and Lu.

DMD # 089151
31 / 53
References:
Bachmann KA and Belloto Jr RJ (1999) Differential kinetics of phenytoin in elderly
patients. Drugs Aging 15:235-250.
Chen T, Mager DE, and Kagan L (2013) Interspecies modeling and prediction of
human exenatide pharmacokinetics. Pharm res 30:751-760.
Chirehwa MT, Rustomjee R and Mthiyane T (2015) Model-based evaluation of
higher doses of rifampin using a semimechanistic model incorporating
autoinduction and saturation of hepatic extraction. Antimicrob Agents Chemother
60:487-494.
Davis B and Morris T (1993) Physiological parameters in laboratory animals and
humans. Pharm Res 10:1093-1095.
Dong JQ, Salinger DH, Endres CJ, Gibbs JP, Hsu CP, Stouch BJ, Hurh E, and Gibbs
MA (2011) Quantitative prediction of human pharmacokinetics for monoclonal
antibodies: retrospective analysis of monkey as a single species for first-in-human
prediction. Clin pharmacokinet 50:131-142.
Ewing KK, Mohammed HO, Scarlett JM and Short CE (1993) Reduction of
isoflurane anesthetic requirement by medetomidine and its restoration by
atipamezole in dogs. Am J Vet Res 54:294-299.
Fukuchi Y, Toshimoto K, Mori T, Kakimoto K, Tobe Y, Sawada T, Asaumi R, Iwata
T, Hashimoto Y, Nunoya K, Imawaka H, Miyauchi S and Sugiyam Y (2017)
Analysis of Nonlinear Pharmacokinetics of a Highly Albumin-Bound Compound:
Contribution of Albumin-Mediated Hepatic Uptake Mechanism. J Pharmaceutical
Sci 106:2704-2714.
Haapalinna A, Viitamaa T, MacDonald E, Savola JM, Tuomisto L, Virtanen R and
Heinonen E (1997) Evaluation of the effects of a specific alpha 2-adrenoceptor
antagonist, atipamezole, on alpha 1- and alpha 2-adrenoceptor subtype binding,
brain neurochemistry and behavior in comparison. Naunyn-Schmiedeberg's
Arch Pharmacol 5:570-582.
Han YH, Kato Y, and Sugiyama Y (1999) Nonlinear disposition kinetics of a novel
antifolate, MX-68, in rats. J Pharmacol Exp Ther 291:204-212.
Hawes EM (1998) N-glucuronidation, a common pathway in human metabolism of
drugs with a tertiary amine group. Drug Metab Dispos 26:830-837.
Houston JB (1994) Utility of in vitro drug metabolism data in predicting in vivo

DMD # 089151
32 / 53
metabolic clearance. Biochem Pharmacol 47:1469-1479.
Huang SM and Rowland M (2012) The role of physiologically based pharmacokinetic
modeling in regulatory review. Clin Pharmacol Ther 91:542-549.
Jamei M, Dickinson GL, and Rostami-Hodjegan A (2009) A framework for assessing
interindividual variability in pharmacokinetics using virtual human populations and
integrating general knowledge of physical chemistry, biology, anatomy, physiology
and genetics: a tale of ‘bottom-up’ vs ‘top-down’ recognition of covariates. Drug
Metab Pharmacokinet 24:53-75.
Jones HM, Chen Y, Gibson C, Heimbach T, Parrott N, Peters SA, Snoeys J, Upreti
VV, Zheng M, and Hall SD (2015) Physiologically based pharmacokinetic
modeling in drug discovery and development: a pharmaceutical industry
perspective. Clin Pharmacol Ther 97:247-262.
Kaivosaari S, Finel M, and Koskinen M (2011) N-glucuronidation of drugs and other
xenobiotics by human and animal UDP-glucuronosyltransferases. Xenobiotica 41:
652-669.
Karhuvaara S, Kallio A, Scheinin M, Anttila M, Salonen JS and Scheinin H (1990)
Pharmacological effects and pharmacokinetics of atipamezole, a novel
á2-adrenoceptor antagonist - a randomized, double-blind cross-over study in
healthy male volunteers. Br J Clin Pharmacol 30:97-106.
Kaivosaari S, Toivonen P, Aitio O, Sipila J, Koskinen M, Salonen JS and Finel M
(2008) Regio- and stereospecific N-glucuronidation of medetomidine: the
differences between UDP glucuronosyltransferase (UGT) 1A4 and UGT2B10
account for the complex kinetics of human liver microsomes. Drug Metab Dispos
36:1529-1537.
Li M, Zhao P, Pan Y, and Wagner C (2018) Predictive Performance of Physiologically
Based Pharmacokinetic Models for the Effect of Food on Oral Drug Absorption:
Current Status. CPT Pharmacometrics Syst Pharmacol 7: 82-89.
Li Z, Gao Y, Yang C, Qiu X, Zhang T, Zhang W, Su R, Zhuang X (2018). In vitro
metabolism of atipamezole in different species of liver microsomes and cytochrome
P450 enzymes by high-resolution mass spectrometry. Chin J Pharmacol Toxicol,
32: 946-952.
Li Z, Zhang Y, GaoY, XiangY, Zhang W, Lu C and Zhuang XM (2019) Atipamezole
is a promising non-discriminative inhibitor against pan- CYP450 including

DMD # 089151
33 / 53
diclofenac 4′-hydroxylation: A comparison with ABT for drug ADME optimization
and mechanism study. Eur J Pharm Sci 130: 156-165.
Liu F, Zhuang XM, Yang C, Li, Xiong S, Zhang ZW, Li J, Lu C and Zhang ZQ (2014)
Characterization of preclinical in vitro and in vivo ADME properties and prediction
of human PK using a physiologically based pharmacokinetic model for YQA-14, a
new dopamine D3 receptor antagonist candidate for treatment of drug addiction.
Biopharm Drug Dispos 35:296-307.
Lu C, Li P, Gallegos R, Uttamsingh V, Xia CQ, Miwa GT, Balani SK and Gan
LS (2006) Comparison of Intrinsic Clearance in Liver Microsomes and
Hepatocytes from Rats and Humans: Evaluation of Free Fraction and Uptake in
Hepatocytes. Drug Metab Dispos 34:1600-1605.
Ludden TM (1991) Nonlinear pharmacokinetics: clinical implications. Clin
Pharmacokinet 20:429-446.
Miller NA, Reddy MB, Heikkinen AT, Lukacova V and Parrott N (2019)
Physiologically Based Pharmacokinetic Modeling for First In Human Predictions:
An Updated Model Building Strategy Illustrated with Challenging Industry Case
Studies. Clin Pharmacokinet 58:727-746.
Nath A and Atikins WM (2006) A Theoretical Validation of the Substrate Depletion
Approach to Determining Kinetic Parameters. Drug Metab Dispos 34:1433-1435.
Obach RS and Reed-Hagen AE (2002) Measurement of Michaelis constants for
cytochrome P450-mediated biotransformation reactions using substrate depletion
approach. Drug Metab Dispos 30:831-837.
Pertovaara A, Haapalinna A, Sirviö J and Virtanen R (2005) Pharmacological
Properties, Central Nervous System Effects, and Potential Therapeutic Applications
of Atipamezole, a Selective á2-Adrenoceptor Antagonist. CNS Drug Rev
3:273-288.
Pertovaara A, Linnankoski I, Artchakov D, Rämä P and Carlson S (2004) Apotential
aphrodisiac for female macaques. Pharmacol Biochem Behav 79:137-141.
Pitkänen A, Narkilahti S, Bezvenyuk Z, Haapalinna A and Nissinen J (2004)
Atipamezole, an á2-adrenoceptor antagonist, has disease modifying effects on
epileptogenesis in rats. Epilepsy Res 61:119-140.
Puurunen K, Jolkkonen J, Sirviö J, Haapalinna A and Sivenius J (2001) An
α2-adrenergic antagonist, atipamezole, facilitates behavioral recovery after focal
cerebral ischemia in rats. Neuropharmacol 40:597-606.

DMD # 089151
34 / 53
Rowland M, Peck C, and Tucker G (2011) Physiologically-based pharmacokinetics in
drug development and regulatory science. Annu Rev Pharmacol Toxicol 51:45-73.
Shebley M, Sandhu P, Emami Riedmaier A, Jamei M, Narayanan R, Patel A, Peters
SA, Reddy VP, Zheng M and de Zwart L (2018) Physiologically based
pharmacokinetic model qualification and reporting procedures for regulatory
submissions: a consortium perspective. Clin Pharmacol Ther 104:88-110.
Smith DA, van Waterschoot RAB, Parrott NJ, Olivares-Morales A, Lavé T, and
Rowland M (2018) Importance of target-mediated drug disposition for small
molecules. Drug Disco Today 23:2023-2030.
Tachibana T, Kato M and Sugiyama Y (2012) Prediction of nonlinear intestinal
absorption of CYP3A4 and P-glycoprotein substrates from their in vitro Km values.
Pharm Res 29:651-668.
Takeuchi T, Tagawa Y, Hagihara K, Maeshiba Y, Yamashita K, Tsukuda R, and
Yoshimura Y (2001) Nonlinear pharmacokinetics of TAK-044, a new endothelin
antagonist, in rats. Biopharm Drug Dispos 22:221-230.
Tang H and Mayersohn M (2006) A global examination of allometric scaling for
predicting human drug clearance and the prediction of large vertical allometry. J
pharm sci 95:1783-1799.
Viitamaa T, Haapalinna A and Heinonen E (1995) The effect of the á2-adrenoceptor
antagonist, atipamezole, on the sexual behavior of sexually low-active male rats.
Behav Pharmacol 6:634-635.
Wu F, Gaohua L and Zhao P (2014) Predicting nonlinear pharmacokinetics of
omeprazole enantiomers and racemic drug using physiologically based
pharmacokinetic modeling and simulation: application to predict drug/genetic
interactions. Pharm Res 31:1919-1929.
Yang QJ, Si L, Tang H, Sveigaard HH, Chow EC and Pang KS (2015) PBPK
modeling to unravel nonlinear pharmacokinetics of verapamil to estimate the
fractional clearance for verapamil N-demethylation in the recirculating rat liver
preparation. Drug Metab Dispos 43:631-645.
Zhuang XM and Lu C (2016) PBPK modeling and simulation in drug research and
development. Acta Pharmaceutica Sinica B 6:430-440.
Footnotes
Dr. Zhuang was supported by National Science & Technology Major Special Project on

DMD # 089151
35 / 53
Major New Drug Innovation, China [2018ZX09711003-006] and [AWS16J016]. Dr.
Zhang was supported by National Science & Technology Major Special Project on Major
New Drug Innovation, China [2018ZX09721003-001-005].

DMD # 089151
36 / 53
FIGURE LEGENDS
Fig. 1. Chemical structure of atipamezole.
Fig. 2. Work flow scheme of the atipamezole PBPK model construction,
verification and prediction.
Fig. 3. In vitro metabolic stability of atipamezole.
Amounts of atipamezole remaining after incubation in pooled RLM (A) or HLM (B)
at various times are shown as a percentage compared to the amount at time zero. The
values represent as means ± S.D. (n=3).
Fig. 4. Measurement of Michaelis constant of atipamezole for metabolizing enzyme
mediated biotransformation reaction in RLM and HLM.
A: Plots of in vitro depletion rate constants versus atipamezole concentration- “in
vitro t1/2 method” was used to yield Km value in RLM. B: Enzyme kinetic profiles of
atipamezole-glucuronide formation in HLM (rates of atipamezole-G formation are
shown as transferred amounts of atipamezole-glucuronide based on parent
disappearance as described in the method section). The selected in vitro
concentrations cover the in vivo plasma concentrations in rats from linear PK to
nonlinear PK. The values represent as means ± S.D. (n=3).
Fig. 5. Plasma atipamezole concentration versus time curves in rats after
intravenous and intramuscular administration at different dosages.
Existences of nonlinear pharmacokinetics (A and B) are manifested by the
dose-normalized (C and D) plasma drug concentration versus time profiles in both
routes.
Fig. 6. Observed and predicted concentration-time profiles of atipamezole in rats
after i.v. 0.3mg/kg.
Black open circles represent concentrations obtained in rats; black line represents the
simulated concentration-time profiles with a physiologically based pharmacokinetic
model using measured Kp; gray dashed line represents the simulated
concentration-time profiles with a physiologically based pharmacokinetic model using
predicted Kp generated from Lukacova method.
Fig. 7. Observed and predicted concentration-time profiles of atipamezole doses in
rats (A) single 0.3 mg/kg i.v. (B) single 0.9 mg/kg i.v. (C) single 3 mg/kg i.v. (D)
single 0.1 mg/kg i.m. (E) single 1 mg/kg i.m. (F) single 3 mg/kg i.m.
The solid black line represents the simulated concentration-time profiles of
atipamezole, the points on the graph are the observed mean concentrations.
Fig. 8. Observed and predicted concentration-time profiles of (A) single 10 mg i.v.
dose of atipamezole (B) single 30 mg i.v. dose of atipamezole (C) single 100 mg i.v.

DMD # 089151
37 / 53
dose of atipamezole in human.
The solid black line represents the simulated concentration-time profiles of
atipamezole, the points on the graph are the observed mean concentrations.
Fig. 9. Predicted dose dependent exposure of atipamezole in Chinese.
(A) predicted concentration-time profile of atipamezole in plasma; (B) predicted
concentration-time profile of atipamezole in brain.

DMD # 089151
38 / 53
Tables
Table 1 Physicochemical and ADME parameters of atipamezole used for PBPK models
Parameter Value Source
Molecular weight (g/mol) 212.3 GastroPlusTMTM 9.6
pKa 7.08, 13.33 GastroPlusTMTM 9.6
LogD at pH 7.4 3.1 GastroPlusTMTM 9.6
Solubility at pH 8.98 (mg/ml) 0.17 GastroPlusTMTM 9.6
Rbp in rat 1.07 Measured in this study
Rbp in human 0.77 Measured in this study
fu,p and fu,mic of rat 0.085, 0.38 Measured in this study
fu,p and fu,mic of human 0.067, 0.59 Measured in this study
Km of rat, human metabolizing enzyme (μM) 1.70 (361ng/ml),
2.89 (614 ng/ml) Measured in this study
Vmax of rat, human metabolizing enzyme
(nmol/min/mg (protein)) 0.131, 1.07 Measured in this study
Population information
Caucasia, Males,
23-year-old,
height 182,
weight 73kg
Karhuvaara et al., 1990

DMD # 089151
39 / 53
Table 2 Tissue partitions (Kp) of atipamezole measured in rats and the extrapolated values in
human PBPK modeling
Tissue Measured Kp of
rat (n=6)
fut (%)
(n=3)
Kpuu of rat
(n=6)
Transformed Kp
of humana
Predicted
Kp of ratb
brain 4.4±0.6 3.7±0.2 1.9±0.5 3.5 13.77*
adipose 0.4±0.2 2.9±0.2 0.1±0.06 0.3 7.79*
spleen 2.9±0.6 3.7±0.03 1.4±0.5 2.3 4.12
heart 1.3±0.6 2.4±0.1 0.4±0.03 1.0 3.77*
lung 6.1±2.3 1.8±0.08 1.3±0.4 4.8 6.07
muscle 0.6±0.3 2.9±0.5 0.2±0.08 0.5 2.65*
kidney 11.4±4.4 1.0±0.05 1.4±0.5 9.0 6.62
liver 23±8.9 0.02±0.01 0.06±0.02 18.1 6.34*
reproductive
organ 4.7±4 2.7±0.1 1.5±0.6 3.7 6.63
a: Kp in human is transformed from rat Kp according to Kp uu of human= Kp uu of rat, under the
assumption that fut is identical between human and rat, namely, human Kp = rat Kp× (rat Cplasma,
u/human Cplasma, u).
b: Predicted Kp in rat is obtained using Lukacova tissue-plasma partition method.
*: represents the ratio of predicted Kp of measured Kp is beyond 2-fold deviation.

DMD # 089151
40 / 53
Table 3 In vitro hepatic clearance atipamezole in liver microsomes of rats and humans in the
presence of NADPH and UDPGA for metabolizing enzyme identification (n=3)
Metabolizing
Enzyme
HLM RLM
t1/2 (min) Clint(ml/min/kg) Clh(ml/min/kg) t1/2 (min) Clint(ml/min/kg) Clh(ml/min/kg)
NADPH 93.5±33.8** 19.5±6.7** 9.7±1.8** 34.1±10.1 79.8±22.6 31.9±3.9
UDPGA 5.4±0.1 295.9±5.4 19.4±0.02 ∕ ∕ ∕
NADPH+UDPGA 5.4±0.2 295.2±9.9 19.3±0.04 33.4±2.0 75.0±4.8 31.7±0.8
The values represent as means ± S.D. (n=3). *p<0.05 and **p<0.01 compared to NADPH+ UDPGA group.

DMD # 089151
41 / 53
Table 4 Unbound fraction of atipamezole in rat and human plasma at the relevant concentrations
in vivo
Conc. (µM) Rat Human
0.3 0.071±0.008 0.068±0.016
1 0.095±0.005 0.060±0.006
3 0.090±0.005 0.073±0.004
The values represent as means ± S.D. (n=3).
DMD # 089151
42 / 53
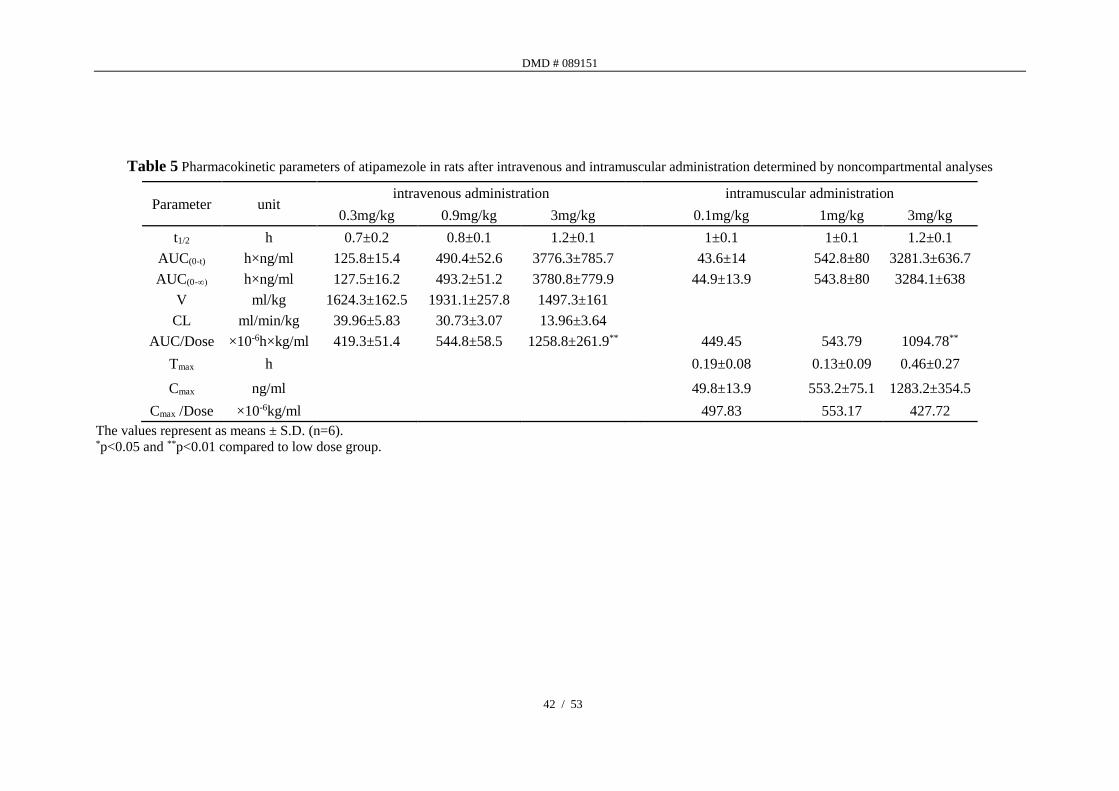
Table 5 Pharmacokinetic parameters of atipamezole in rats after intravenous and intramuscular administration determined by noncompartmental analyses
Parameter unit intravenous administration intramuscular administration
0.3mg/kg 0.9mg/kg 3mg/kg 0.1mg/kg 1mg/kg 3mg/kg
t1/2 h 0.7±0.2 0.8±0.1 1.2±0.1 1±0.1 1±0.1 1.2±0.1
AUC(0-t) h×ng/ml 125.8±15.4 490.4±52.6 3776.3±785.7 43.6±14 542.8±80 3281.3±636.7
AUC(0-∞) h×ng/ml 127.5±16.2 493.2±51.2 3780.8±779.9 44.9±13.9 543.8±80 3284.1±638
V ml/kg 1624.3±162.5 1931.1±257.8 1497.3±161
CL ml/min/kg 39.96±5.83 30.73±3.07 13.96±3.64
AUC/Dose ×10-6h×kg/ml 419.3±51.4 544.8±58.5 1258.8±261.9** 449.45 543.79 1094.78**
Tmax h 0.19±0.08 0.13±0.09 0.46±0.27
Cmax ng/ml 49.8±13.9 553.2±75.1 1283.2±354.5
Cmax /Dose ×10-6kg/ml 497.83 553.17 427.72
The values represent as means ± S.D. (n=6). *p<0.05 and **p<0.01 compared to low dose group.

DMD # 089151
43 / 53
Table 6 Predicted and observed pharmacokinetic parameters in rat and human receiving a single
dose of atipamezole
Species Route and dose AUCped(0-inf)
h·ng/ml
AUCobs(0-inf)
h·ng/ml
AUCpre/obs
Fold error
(FE)
rat
i.v.
dose (mg/kg)
0.3 148.0 122.2 1.21
0.9 592.8 479.2 1.24
3 3931.0 3732.1 1.05
i.m.
dose (mg/kg)
0.1 52.5 46.1 1.14
1 641.4 547.3 1.18
3 2806.3 3289.0 0.85
human
i.v.
dose (mg/person)
10 182.0 104.3 1.74
30 566.9 370.2 1.53
100 1893.5 1354.6 1.40

DMD # 089151
44 / 53
Table 7 Predicted and observed brain AUC of atipamezole in rat and human receiving a single
i.m. of atipamezole
Species dose AUCped(0-inf)
h·ng/ml
AUCobs(0-inf)
h·ng/ml
rat
0.3mg/kg 650 703
1mg/kg 2500 2553
3mg/kg 11500 16790
Human
10mg 600
30mg 2300
100mg 7400

DMD # 089151
45 / 53
Fig. 1

DMD # 089151
46 / 53
Fig. 2
0 4 8 120.1
1
10
100
1000
10000 0.3mg/kg
0.9mg/kg
3mg/kg
Time(h)
Co
nc.o
f A
tip
am
ezo
le(n
g/m
L)
0 1 2 30
1000
2000
3000
4000
Dose(mg/kg)
AU
C(0
-t) (h
·ng/m
L)
Nonlinear Pharmacokinetics Absorption Distribution TMDD Excretion Metabolism
Mechanism Identification in rat (Saturable metabolism)
Michaelis-
Menten
equation
• CYP-mediatedRat
• UGT-mediatedHuman
Clearance
Distribution• Use Kp,uu
extrapolated to
human
Perfusion
Limited Human Pharmacokinetics prediction
Intramuscular PK Brain distribution
Rat to human PBPK extrapolation
In vitro Km and Vmax Rat distribution
Rat PBPK Modeling
Developed by i.v. PK Validated by i.m. PK
Fig. 2
DMD # 089151
47 / 53
Fig. 3.
0 5 10 15 20 25 300
20
40
60
80
100
120+NADPH
+UDPGA
+NADPH, +UDPGA
No cofactor
Time(min)
Perc
ent
of
rem
ainin
g(%
)
0 5 10 15 20 25 300
20
40
60
80
100
120+NADPH
+UDPGA
+NADPH, +UDPGA
No cofactor
Time(min)
Perc
ent
of
rem
ainin
g(%
)
A B

DMD # 089151
48 / 53
Fig. 4.
0 5 10 15 200.0
0.2
0.4
0.6
0.8
1.0
V(n
mo
l/m
in/m
g(p
rote
in)
-0.5 0.0 0.5 1.0 1.50.00
0.01
0.02
0.03
0.04
log[atipamezole], μM
Deple
tio
n r
ate c
onst
ant
(1/m
in)
A B
DMD # 089151
49 / 53
Fig. 5.
0 4 8 120.1
1
10
100
1000
10000 0.3mg/kg
0.9mg/kg
3mg/kg
Time(h)
Co
nc.o
f A
tipam
ezo
le(n
g/m
l)
0 4 8 120.1
1
10
100
1000
10000
3mg/kg
1mg/kg
0.1mg/kg
Time(h)
Co
nc.o
f A
tipam
ezo
le(n
g/m
l)
0 4 8 120.1
1
10
100
1000 0.3mg/kg
0.9mg/kg
3mg/kg
Time(h)
C/D
ose
(ng
/ml/
mg/
kg)
0 4 8 120.1
1
10
100
1000
3mg/kg
1mg/kg
0.1mg/kg
Time(h)
C/D
ose
(ng/m
l/m
g/k
g)
A B
C D
DMD # 089151
50 / 53
Fig. 6.
Time(h)
Co
nc.
(ng
/ml)

DMD # 089151
51 / 53
Fig. 7.
0 1 2 3 40.1
1
10
100
1000 0.3mg/kg
Time(h)
Co
nc.o
f A
tipam
ezo
le(n
g/m
l)
0 1 2 3 4 5 60.1
1
10
100
1000 0.9mg/kg
Time(h)
Co
nc.o
f A
tipam
ezo
le(n
g/m
l)
0 1 2 3 4 5 6 7 80.1
1
10
100
1000
10000 3mg/kg
Time(h)
Co
nc.o
f A
tipam
ezo
le(n
g/m
l)
0 1 2 3 40.1
1
10
100 0.1mg/kg
Time(h)
Co
nc.o
f A
tipam
ezo
le(n
g/m
l)
0 2 4 6 8 100.1
1
10
100
1000 1mg/kg
Time(h)
Co
nc.o
f A
tipam
ezo
le(n
g/m
l)
0 2 4 6 8 10 12 140.1
1
10
100
1000
10000 3mg/kg
Time(h)
Co
nc.o
f A
tipam
ezo
le(n
g/m
l)
A B C
D E F

DMD # 089151
52 / 53
Fig. 8.
0 1 2 31
10
100
1000 10mg
Time(h)
Co
nc.o
f A
tipam
ezo
le(ng/m
l)
0 1 2 3 41
10
100
1000 30mg
Time(h)C
onc.o
f A
tipam
ezo
le(ng/m
l)
0 1 2 3 4 5 61
10
100
1000
10000 100mg
Time(h)
Co
nc.o
f A
tipam
ezo
le(ng/m
l)
A B C

DMD # 089151
53 / 53
Fig. 9.