Embed Size (px)
DESCRIPTION
climate change
Citation preview

ORI GIN AL PA PER
Assessing the resilience of Delhi to climate-relateddisasters: a comprehensive approach
Sunil Prashar • Rajib Shaw • Yukiko Takeuchi
Received: 18 January 2011 / Accepted: 27 July 2012 / Published online: 10 August 2012� Springer Science+Business Media B.V. 2012
Abstract The study addresses disaster risks in Delhi through a resilience approach. It utilizes
the Climate Disaster Resilience Index (CDRI) tool, which assesses disaster resilience from five
dimensions: physical, social, economic, institutional, and natural. Each dimension comprises 5
parameters, and each parameter consists of 5 variables. The study is carried out in the nine
revenue districts of Delhi and reveals that East Delhi is least resilient and New Delhi is most
resilient. The CDRI analysis in East Delhi points out the urgent need to focus on key
parameters such as housing and land use, population, intensity and frequency of natural
hazards, ecosystem services, and land use in natural terms. On the other hand, New Delhi is the
most resilient due to all five dimensions, where most significant parameters responsible for its
high resilience are housing and land use, population, income, employment, intensity and
frequency of natural hazards, ecosystem services, and land use in natural terms. In addition, the
overall results of all nine districts show an inverse relationship between resilience score and
population density. For example, districts with higher population density show low resilience
and vice versa. Moreover, districts located on hazard-prone areas show low resilience. For
example, East Delhi and North East Delhi scored low resilience because they both are situated
on the Yamuna flood catchment areas. The study further develops key suggestions that are
required to address disaster risk in all nine districts of Delhi and discusses future implications
of CDRI to address city’s vulnerability. The approach’s distinctness is reflected through its
consideration of micro-level diversities and presents some implications to resilience.
Keywords Risk assessment � Climate-related hazards � Disaster risk � Resilience
1 Introduction
India is one of the most important countries in the world with regard to the impact of
hydrometeorologial disasters such as floods, storms, mass movements (wet), extreme
S. Prashar (&) � R. Shaw � Y. TakeuchiGraduate School of Global Environmental Studies, Kyoto University, Yoshida Honmachi,Sakyo-Ku, Kyoto 6068501, Japane-mail: [email protected]
123
Nat Hazards (2012) 64:1609–1624DOI 10.1007/s11069-012-0320-4
temperatures, droughts, and wild fires. Between 1980 and 2010, more than 400 disasters
have occurred in India and most of them are hydrometeorological in nature, affecting
millions of people through the loss of lives, injuries, and damage to infrastructure. The
Centre for research on the Epidemiology of Disasters (EM-DAT 2010) noted that 54.2 %
of the total people were killed from hydrometeorological disasters, 34.8 % from geo-
physical, and the remaining 10.8 % were reported killed from biological disasters.
Impact of hydrometeorological disasters is increasing in urban areas of India, especially
due to the floods that occurred recently in several megacities of India. For example, in
2010, floods occurred in Delhi, Guwahati, Ahmedabad, and Mumbai (National Disaster
Management Authority 2010). Similarly, in 2008, Jamshedpur, Mumbai, and Hyderabad
were worst affected cities in India. On one hand, these cities are the major economic
centers with large international operation, and on the other hand, they encountered higher
economic loss due to floods than other disasters (National Disaster Management Authority
2010). Moreover, these cities create a complex dynamic system as a result of concentration
of people, resources, and information (Chatterjee 2010).
Disasters are the interaction of shocks (natural hazards) and stresses (Wisner et al.
2004). Wisner et al. (2004) defines this interaction through ‘‘Pressure and Release’’ model
and develops linkage to disasters. In context of urban areas of India, some of the urban
stresses are urban poverty, basic urban services, loss of urban green spaces, disrupted
ecosystems, exhausted institutions, and unplanned development. These stresses can further
exacerbate the impact of disasters in the complex urban environment. For instance,
Mumbai flood of 2005 is a classic example that shows disaster impact as a result of
interaction between shocks (floods) and stresses (urban poverty, unplanned development,
and loss of urban green space, among others) (Government of Maharashtra 2005).
Moreover, flood affected over thousands of people as a result of unprecedented rainfall,
causing extensive loss and damage to infrastructure, settlements, and services. Most
affected groups were urban poor, who were living in slums without proper access to basic
infrastructure and services. In addition, not all urban poor were equally affected. A study
by Chatterjee (2010) on slum dwellers’ response to flooding events in the megacities of
India shows that during the Mumbai flood of 2005, new residents (less than 10 years) and
old residents (more than 20 years) living in slums were more vulnerable than medial
residents (10–20 years). Medial residents had greater access to social networks during the
flood which helped in their quick rehabilitation and recovery. The above example shows
that slums dwellers are not equally vulnerable due to ‘‘different exposure, sensitivity, and
adaptive capacity’’ (Adger 2006). Furthermore, their ‘‘ability to re-organize, change, and
learn in response to a threat’’ (Cutter et al. 2008) shows their different level of resilience.
In the context of urban areas, Adger (2000) defines resilience as the ability of human
beings living in built environment to cope with external stress is shaped by economic,
institutional, and natural aspects. Moench et al. (2011) emphasize building resilience as
cyclical process where different systems are interdependent. These definitions stress on the
‘‘dynamic’’ characteristics of urban resilience. Thus, urban resilience is dynamic in nature.
Moreover, it is a complex function of physical, social, economic, and institutional issues in
natural environment (Joerin 2012).
This study addresses disaster issues of Delhi through resilience approach. The first step
to enhance disaster resilience is its assessment. Thus, the study develops and utilizes CDRI
tool to assess disaster resilience of Delhi. The paper first describes the disaster risks in
Delhi and the CDRI tool. The next section analyzes the results of the study and examines
the two selected districts, New Delhi and East Delhi in depth. Finally, implications of the
CDRI results to address city’s vulnerability are presented.
1610 Nat Hazards (2012) 64:1609–1624
123

2 Disaster risks in Delhi
Delhi, also called National Capital Territory (NCT) of Delhi, occupies an area of 1,483 sq.
km. The total population as per the 2011 census is over 16 million, making it one of the
nation’s most densely populated areas. It comprises nine revenue districts—Central Delhi,
North Delhi, South Delhi, East Delhi, North East Delhi, South West Delhi, New Delhi,
North West Delhi, and West Delhi (Prashar et al. 2012; Parvin et al. 2011). Moreover,
Delhi has a unique and complex structure of governance due to the existence and func-
tioning of the two governments—Union Government and Government of NCT of Delhi
(Prashar et al. 2012; Government of India 2009). It is ranked the 10th largest among
world’s most populated cities (Prashar et al. 2012; Government of National Capital Ter-
ritory of Delhi 2006). The city has experienced very fast population growth between 1991
and 2001, expected to reach 28.41 million by 2026 (Census of India 2001).
With rapid population growth, the city is getting highly urbanized and becoming prone
to floods, heat and cold waves, earthquakes, fires, epidemics, and terrorist attacks. The city
vulnerability is increasing due to urban stresses such as rapid urbanization, environment
degradation, infrastructure pressure, housing shortage, and slums and squatters settlements.
To understand city vulnerability, it is essential to understand the key vulnerability
parameters: exposure, sensitivity, and adaptive capacity (Adger 2006) in context of Delhi.
For example, unplanned settlements with dense and dilapidated housing structures in Delhi
are sensitive and exposed to floods and other hazards (DDMA 2009). Similarly, the
adaptive capacity to accommodate natural hazards is low among the poor due to lack of
preparedness. Moreover, adaptive capacity can also be understood in terms of resilience, as
Gallopin (2006) describes adaptive capacity as ‘‘capacity to adapt,’’ which means com-
munity or people learn and improve their capacity before or after disasters. This reflects the
resilience aspects. In Delhi, adaptive capacity in context of resilience can be understood as
system and community preparedness before and after disasters.
2.1 Rapid urbanization
Delhi is experiencing rapid urbanization due to concentration of people and industries.
According to the 2001 census, 93 % of Delhi’s population lives in urban areas (Ministry of
Health and Family Welfare 2007). The population increased from 0.7 million in 1947 to
13.7 million in 2001. It is expected to double by 2026 (Ministry of Health and Family
Welfare 2007). With the rapid increase in urban population growth, the city has experi-
enced rapid increase in small-scale industries since 1951 when there were 8,160 small-
scale industries, which increased to 129,000 in 2001 (Government of Delhi 2006). The
rapid increase in industry and population brought massive changes in the city’s land use
(Fig. 1).
The change in land use in the city has greatly affected very fertile lands in terms of
productivity. Natural lands including water bodies, flood plain regions, and small lakes
have been converted into built-up areas. Agricultural land has also been converted into
urban areas. This process has led to the loss of ecosystem services such as water recharge,
bioremediation, nutrient cycling, waste management, and climatic regulation (Kumar
2009). Agricultural land is traditionally used as a percolation zone, and now it is contin-
uously being reduced (Pareva 2006; Fig. 1). The net agricultural area sown in 1950–1951
was 97,067 hectares and decreased to 25000 hectares by 2005–2006 (Pareva 2006). The
use of agricultural land has rapidly decreased after 1999. The pressure of urbanization has
resulted in the increase in urban land usage (Kumar 2009).
Nat Hazards (2012) 64:1609–1624 1611
123

2.2 Environment degradation
The environmental conditions are relatively poor in Delhi. The last three decades have led
to changes in the land-use pattern (Rahman and Netzband 2007). In particular, there has
been an increase in the built-up area. In 1990–1991, the built-up area was 742 sq. km,
50 % of the geographical area of Delhi that increased to 897 sq. km (60.5 %) by
2000–2001 (Government of Delhi 2006). Huge expansion of industries, reduction in
agriculture areas, and rapid population growth caused this change. Expansion of industries
as well as rapid population growth created huge demand for natural resources and services,
which degraded environmental conditions in the city. Some of the examples of environ-
mental degradation include the following: explicit use of ground water, discharge of waste
effluents in the river, and water, air and noise pollution. The city represents 2 % of the
Yamuna catchment area and is 80 % polluted. The Yamuna is considered as one of the
most polluted rivers in the world (Rahman and Netzband 2007), which is a result of
municipal waste water discharged into the river from nine drains. In addition, the city
produces 200 million liters of untreated sewage (Government of Delhi 2006).
2.3 Climate-related hazards
The city is vulnerable to climate-related hazards such as floods, heat waves, cold waves,
and hydrological droughts and water scarcities (Panda 2011). In the recent past, Delhi has
experienced major floods. Since 1900, floods took place in 1924, 1947, 1967, 1971, 1975,
1976, 1978, 1988, 1993, 1995, and 1998 (DDMA 2009). High-magnitude floods occurred
in 1977, 1978, 1988, and 1995 (DDMA 2009). The Yamuna River produced most of the
major floods and experts believe that the flooding in the city has many explanations: heavy
rainfall, urbanization, unauthorized colonies, trespassing on storm water drains, siltation of
drains, siltation of water bodies, choked water carriers, poor water and sewerage man-
agement, deficiencies in the drainage system, failure of pumping installation, and multiple
authorities with no responsibility (Pareva 2006). In addition, heat waves and cold waves in
the past have caused enormous human discomfort in northern India including Delhi. For
example, between April and June 2007, 72 deaths were recorded in north and northwestern
India due to heat waves (SAARC 2009). Many places witnessed high temperature close to
50 �C. Similarly, between December and January 2007, around 137 deaths were recorded
in northern India. The minimum recorded temperature in several cities was between 0 and
5 �C (SAARC 2009). Several studies have noted the occurrence of heat waves and cold
Fig. 1 Trend of land-use change in Delhi. Source: Kumar (2009)
1612 Nat Hazards (2012) 64:1609–1624
123

waves conditions in Delhi (Dube and Rao 2005; Mohanty et al. 1997). The city receives
extreme lowest temperature during December and highest temperature during May
(Mohanty et al. 1997).
2.4 Infrastructure pressure
The city is experiencing huge infrastructure pressure. In recent decades, three major
development activities created infrastructure pressure in Delhi: one is rapid industrial
expansion, the second, relocation of informal units, and the third, inflow of migrants
(Government of Delhi 2006). The rapid population growth creates serious implications in
terms of gaps in water and energy demand, problems in housing shortages, inadequate
water and sanitation services, poor solid waste management, pressure on public trans-
portation, and power failures. For example, recent data from Delhi indicate changes
between 1977 and 1991. The housing shortage in 1977 was 14,500 units, and it went to
257,000 units in 1991 (Government of Delhi 2006). A large number of the population lives
in the city without shelter. Approximately 50,000–70,000 persons are homeless (Gov-
ernment of Delhi 2006). A large portion of households live in slums. There are 1,080
Jugghies and Jopries (informal settlements) that accommodate 3 million people or 22 % of
the Delhi population (Government of Delhi 2006). Similarly, there is a huge pressure on
basic services. Out of 690,000 households in the slum area, 16 % of the households receive
less than 25 liters per capita daily water and 71 % of the households receive 25–50 l per
capita daily water (Government of Delhi 2006). Almost 45 % of the Delhi population has
no sewerage service. These conditions have exacerbated in recent years.
2.5 Increase in slums, squatters, and migrant population
The Slum Area Act of 1956 defines ‘‘slums’’ as ‘‘regions where buildings are unfit for
human habitation for reasons such as dilapidation, overcrowding, and a lack of ventilation,
light, and sanitary facilities’’ (Jha et al. 2005). In 1951, the slum population was 12,749 and
increased to over 3 million by 2005 (Government of Delhi 2006). The number of housing
units is 0.6 million accommodating 3 million of the population. This means that more than
three persons live in one room. Living conditions in slums are very poor; basic services
such as street light, sanitation, water, and road networks are lacking. However, not all
slums are equally poor and vulnerable due to social, economic, and political dimensions.
For example, Jha et al. 2005 notes that newly established slums in Delhi are more vul-
nerable than old established slums. The risks include constant threat of demolition, fire,
theft, and uncertain property rights. In old established slums, the Pradhan (community
leader) has greater access to politicians, bureaucrats, and police officers. Moreover, they
also benefit from the various development schemes of the Government of NCT of Delhi
such as Sanjha Prayas (collective action) and also called a scheme launched to promote
effective participation of poor people in governance (Prashar and Shaw 2012). SanjhaPrayas focuses on slum development and works mainly in three core areas: water, elec-
tricity, and sanitation-solid waste disposal (Prashar and Shaw 2012). Similarly, social and
economic dimensions also play important roles in defining the vulnerability of people
living in slums. A study by Kumar and Aggarwal (2003) on patterns of consumption and
poverty in Delhi slums noted that women are disadvantageous than men in terms of their
economic status. Unemployment rate for men (15 years and over) is 21.85 %, whereas for
women as high as 91.40 %. In addition, caste divisions in India are another important
factor that determines vulnerability in slums. Kumar and Mitra (2001) conducted a study in
Nat Hazards (2012) 64:1609–1624 1613
123

Delhi slums to understand the extent to which cast divisions in India coincide with
socioeconomic divisions such as literacy, jobs, and income and food expenditure, among
others. The survey was conducted with four groups of households in Delhi slums: HinduSchedule Caste (SCs), Hindu Other Backward Caste (OBCs), General Hindu, and Muslims.
The study indicates that SCs non-workers in total population are more dependent (73 %)
than OBCs (62 %), General Hindu (65 %), and Muslims (66 %). In terms of literacy, most
SCs (65 %) are illiterate than OBCs (63 %), Muslims (59 %), and General Hindu (50 %).
Thus, SCs household in Delhi slums need more attention from Government of NCT of
Delhi in terms of reducing illiteracy and unemployment condition.
2.6 Existing approaches of disaster risk reduction in Delhi
The National Disaster Management Act of 2005 provides a constitution for establishing
disaster management authority at national, state, and district levels. The Delhi Disaster
Management Authority (DDMA) was constituted after 2005. Subsequently, the District
Disaster Management Authority was established in all nine districts of Delhi. The authority
follows the holistic approach toward disaster management, focusing on prevention, miti-
gation, and preparedness measures. Disaster Management Plans of Delhi and nine districts
highlight civic authorities’ roles in disaster situation. For instance, action plans for
emergency support functions for all relevant civic bodies are developed, and disaster mock
drills are conducted regularly to sensitize and aware general public. Similarly, booklets,
reading and audio visual materials are disseminated to spread awareness among the people.
The authority circulates Information Education and Communication materials on disasters
in all districts including schools, communities, markets, and offices. In addition, the
incorporation of disaster risk reduction measures is successfully mainstreamed into the
school curriculum, whereas it is hardly or rarely incorporated into the Delhi development
plans or transportation plans, etc. The existing approach toward disaster management in
Delhi is weak in terms of several aspects. For example, risk reduction measures are not or
less integrated into the city development plan. Investment in terms of human and infra-
structure planning for disaster risk reduction is also low in the relevant sectors. Finally,
there is lack of capacity of local authorities to implement disaster risk reduction measures.
3 Approach adopted in the current study
CDRI is an integral component of Climate Disaster Resilience Initiative, a planning tool
that aims at sustainable development through increasing disaster resilience of cities. Cli-
mate Disaster Resilience Initiative goes beyond vulnerability assessment and focuses on
enhancing resilience. This initiative originated when resilience was greatly emphasized by
researchers in the field of disaster management. For instance, the prime goal of the Hyogo
Framework for Action (2005–2015) is to reduce vulnerabilities through five priorities of
actions for disaster risk reduction. This framework was adopted by 168 countries in 2005 to
address disaster risk. Later, the resilience concept was applied more to urban areas (Joerin
and Shaw 2011). For example, researchers started using ‘‘Resilient Cities’’ to define
‘‘sustainable network of systems and communities’’ (Godschalk 2003). World Bank (2009)
defines a resilient city as being ‘‘able to sustain itself through its systems by dealing with
issues and events that threaten, damage, or destroy it’’ (World Bank 2009). These defi-
nitions stress more on ‘‘system.’’ Thus, systems need to be well prepared before disaster
challenges various aspects of the city. For instance, an adequate system of basic services
1614 Nat Hazards (2012) 64:1609–1624
123

such as water, electricity, solid waste, and transportation can help in quick recovery of a
city from disaster (Joerin and Shaw 2011). However, before cities’ resilience can be
enhanced, understanding of their current level of resilience is necessary.
The CDRI methodology is unique because it incorporates the micro-level diversities of
a city. Several studies in the past have been carried out to address the different aspects of
cities’ resilience and vulnerability to climate-related disasters. They often neglected local
level issues (Parvin et al. 2011). Moreover, local level issues are key information required
for a well-governed city. The CDRI methodology and its results can help in understanding
the complexity of a city and its services (Parvin et al. 2011). It can also be utilized in
strategic planning or policy formulation and can guide the process of budget allocation in
the city. Moreover, CDRI can be also linked to ‘‘a guide for implementing Hyogo
Framework for Action (HFA).’’ This guide consists of 22 tasks for local/city government to
build the resilience of nation and communities (Matsuoka and Shaw 2012).
3.1 CDRI methodology
CDRI is developed from five resilience dimensions: physical, social, economic, institu-
tional, and natural. Each dimension consists of five parameters, and each parameter
carries 25 variables as shown in Table 1. All in all, CDRI analyzes disaster resilience on
125 (5 9 5 9 5) key quantifiable variables. For the purpose of data collection, a CDRI
questionnaire survey is developed and utilized in the study area. Each parameter is
evaluated on five choices between (1 = poor) and (5 = best). The respondent is requested
to provide a choice between poor and best. In addition, each variable under a specific
parameter is required to be ranked or weighted on a scale of (1 = not important) and
(5 = very important). All collected data are analyzed using Weighted Mean Index (WMI)
and Aggregate Weighted Mean Index (AWMI) formula. WMI provides the resilience
score for all parameters. Similarly, AWMI provides resilience score for all dimensions.
The calculated value of AWMI of one dimension is the CDRI of that dimension. The
CDRI scores vary from 1 to 5, where (1 = very poor, 2 = poor, 3 = moderate,
4 = good, and 5 = best). Higher CDRI values are equivalent to higher preparedness to
cope with climate-related disasters. The quality of results depends on the knowledge of
respondents. Needless to say, the results presented are not absolute values but can serve as
policy guidance.
The study was conducted in nine revenue districts of Delhi. The CDRI questionnaire
was answered by the District Project Officers and Project Coordinators, who are respon-
sible for disaster management activities in their respective districts. Some of the short-
coming observed in the study was the quality of data. The respondents were fairly equipped
with the knowledge of all five dimensions. However, they were much informed about the
institutional dimension. This shortcoming was improved with the help of secondary data
related to other dimensions.
3.2 Disaster resilience of Delhi
The results show an inverse relationship between resilience score and population density of
districts. Districts that are densely populated show low resilience score and vice versa.
Central Delhi, East Delhi, and North East Delhi show low resilient and high population
density. Their density is above 20,000 persons per sq. km. (Table 2) and contains popu-
lation above 1 million except Central Delhi. These districts are completely urbanized, and
Nat Hazards (2012) 64:1609–1624 1615
123

most of their areas are covered by residential or commercial areas (Table 2). They are
highly populated with no space for further urbanization (Table 2).
Figure 2 shows the climate disaster resilience scores of all nine districts. The overall
map shows moderate resilience scores in all nine districts (Fig. 3). The resilience scores are
above 3 with the exception of East Delhi (2.90) (Fig. 2). The natural and institutional
dimensions show an interesting relationship with the overall resilience (Fig. 2). Natural
resilience contributes to the decrease in the overall resilience due to parameters such as
land use in natural terms, ecosystem services, and environmental policy and security
(Table 1). In addition, frequency of natural hazards differs from place to place. For
Table 1 Dimensions and variables of Climate Disaster Resilience Index (CDRI)
Dimension Physical Social Economic Institutional Natural
Parameter Electricity Population Income Mainstreaming ofDRR and CCA
Intensity/severityof naturalhazards
Water Health Employment Crisis management Frequency ofnatural hazards
Sanitation &solid wastedisposal
Education andawareness
Householdassets
Knowledgedissemination &management
Ecosystemservices
Accessibilityof roads
Social capital Finance andsavings
Institutionalcollaboration
Land use
Housing andland use
Communitypreparedness
Budget andsubsidy
Good governance Environmentalpolicies
Table 2 Demographic profile and key characteristics of the nine districts of Delhi
Districts Populationa Densitya Key characteristicsb
Central 578,671 23,147 Major part of the district is institutional area having governmentoffices/courts
North 883,418 14,973 Major part of district have residential areas and urbanizable land
South 2,733,752 10,935 Major part of the district has residential areas, urbanizable areas, cityforest, and ridge/regional parks
Only a few areas have industries
East 1,707,725 26,683 Major part is covered by residential areasVery few have commercial areas and industries
NorthEast
2,240,749 37,346 Major part is covered by residential areas and city parks
SouthWest
2,292,363 5,445 Major part is covered by green belt and urbanizable areaSome parts cover residential areas, airport, and government land
NewDelhi
133,713 3,820 Major part of the district covers commercial areas, president estate &parliament house, and city parks and forest
NorthWest
3,651,261 8,298 Major part covers residential areas, green belt/urbanizable area, andindustries
West 2,531,583 19,625 Major part covers residential areas, city parks, and urbanizable area
Sources: a Census 2011, b DDA (Delhi Development Authority) 2007
1616 Nat Hazards (2012) 64:1609–1624
123

example, the natural resilience score of East Delhi (2.18) and North East Delhi (2.56) is
poor, and both often get affected by river flood during monsoon due to their location,
which is inside the Yamuna flood catchment area. Thus, districts score differs according to
their land use. Moreover, the authorities can utilize these findings in the Delhi Urban
Environment and Infrastructure Improvement project—21, which aims at making Delhi a
sustainable city. For example, the results can be effectively used in developing action
programs for environment management by the Government of NCT of Delhi (Planning
Department 2001). Analysis of natural dimensions can be incorporated in developing
information systems for environment management. This information system will provide
key information on CDRI results to decision makers and stakeholders.
The institutional dimension shows high resilience scores in all nine districts (Fig. 2).
The resilience scores of most districts are close to 4 (Fig. 2). Institutional parameters
mentioned in Table 1 such as effectiveness of district’s crisis management framework,
knowledge dissemination and management, institutional collaboration with other organi-
zations and stakeholders during a disaster, and good governance have high resilience score
in all nine districts. However, resilience score for mainstreaming of DRR and CCA is low
and needs more consideration in the near future. Furthermore, key CDRI finding of
institutional dimension can be incorporated into Government of India-United Nations
Development Programme (GOI-UNDP) (2009–2012), which aims at mainstreaming DRR
into ongoing development projects of the Indian Government (HP State Disaster Man-
agement Authority 2009). For example, CDRI results can provide key information in terms
of current level of progress in mainstreaming DRR into development plans of Delhi, ability
to produce development plans, incorporation of disaster management plan, and community
participation in development plans. The current level of DRR incorporation can guide
GOI-UNDP programs in terms of developing a plan of action.
Overall
1
2
3
4
5Central Delhi
North Delhi
South Delhi
East Delhi
North East DelhiSouth West Delhi
New Delhi
North West Delhi
West Delhi
Physical
12345
Central Delhi
North Delhi
South Delhi
East Delhi
North East DelhiSouth West Delhi
New Delhi
North West Delhi
West Delhi
Social
12345
Central Delhi
North Delhi
South Delhi
East Delhi
North East DelhiSouth West Delhi
New Delhi
North West Delhi
West Delhi
Natural
12345
Central Delhi
North Delhi
South Delhi
East Delhi
North East DelhiSouth West Delhi
New Delhi
North West Delhi
West Delhi
Institutional
12345
Central Delhi
North Delhi
South Delhi
East Delhi
North East DelhiSouth West Delhi
New Delhi
North West Delhi
West Delhi
Economic
12345
Central Delhi
North Delhi
South Delhi
East Delhi
North East DelhiSouth West Delhi
New Delhi
North West Delhi
West Delhi
Fig. 2 CDRI resilience scores of all nine districts in Delhi
Nat Hazards (2012) 64:1609–1624 1617
123

3.3 Contrasting level of risk of New Delhi and East Delhi
The following section discusses the results in two districts: East Delhi and New Delhi
(Figs. 4, 5). East Delhi is selected mainly due to its low resilience score. The analysis will
provide the key factors responsible for its low resilience. Further, it will also give the scope
for improvement. New Delhi is mainly selected due to its high resilience score. The
analysis will reflect the key factors for its high resilience.
East Delhi has an area of 64 sq. km covering 4.31 % of the total area of Delhi. As per
2011 census, the total population is 1.7 million with a population density of 26,683 persons
per sq. km., the third highest population density in Delhi. However, the annual population
growth is lower than Delhi between 2001 and 2011. For example, the population growth of
East Delhi is 1.55 %, which is lower than Delhi (i.e., 1.92 %). The population factor also
affects the CDRI resilience level in the social dimension. It is estimated that by 2015, Delhi
population may reach around 20 million (United Nations 2002) due to natural increase and
migration. It is thus necessary to control population growth in the city.
Population growth brings tremendous stress on land, housing, infrastructure facilities,
and services. The same can be seen in East Delhi. The physical resilience of the district is
low due to all five parameters as mentioned in Table 1. However, housing and land use
scored very poor due to buildings with non-permanent structure and populations living in
close proximity to polluted industries. The district consists of different kinds of settlements
including planned settlements, unauthorized colonies, and urban villages. Moreover,
unauthorized colonies are characterized by poor structural conditions of buildings, inad-
equate infrastructure services, congestion, poor urban form, and lack of community
Fig. 3 Resilience map of all nine districts in Delhi. Central Delhi (C), North Delhi (N), South Delhi (S),East Delhi (E), North East Delhi (NE), South West Delhi (SW), New Delhi, North West Delhi (NW), andWest Delhi (W)
1618 Nat Hazards (2012) 64:1609–1624
123

facilities (Fig. 4; DDA 2010). Around 69 unauthorized residential areas exist in this dis-
trict. Moreover, 70–80 slums clusters are situated along the Pusta (low-lying area)
(DDMP-E 2008). In addition, 21 urban villages currently exist in East Delhi. The problems
are much severe in unauthorized and slums areas, making physical resilience score below 2
(Fig. 5).
The natural dimension score is below 3 (Fig. 5) due to the intensity and severity of
natural hazards, which is high in comparison with other districts. Most settlements along
the Yamuna River are situated along the hazard-prone area. A study on ‘‘Urban Flooding
and its Management’’ by the Irrigation and Flood Control, Government of NCT of Delhi
identified East Delhi under the flood plain region and vulnerable to floods (Pareva 2006).
During the monsoon, low-lying areas adjacent to Yamuna receive floods. Recently, Delhi
was flooded in September 2010. Most of the areas along the Yamuna River were flooded,
and a heavy damage to life and property was recorded. Hundreds of informal settlements
were submerged under water, and 169 relief camps were set up by the Delhi Government to
tackle the flood in the capital city. In one incident, a five-story building collapsed in East
Delhi, which killed around 66 people and injured 77 people (BBC News, 16 Nov 2010). In
addition, ecosystem services are poor due to the low quality of district’s characteristics in
terms of soil, air, water bodies, and biodiversity. For example, the land department of DDA
has identified six water bodies in this district that need greater consideration in the Master
East Delhi New Delhi
Fig. 4 Settlements in East Delhi (left) and New Delhi (right)
Fig. 5 Resilience levels of East Delhi and New Delhi
Nat Hazards (2012) 64:1609–1624 1619
123

Plan of Delhi (MPD)—2021 due to lack of green area. The river bed in this region is
considered as the city’s life sustaining need for ground water recharge. It has suddenly
changed in the late 1990s and 2000s (Yamuna Jiye Abhiyaan 2007). The construction of
Metro Depot, New Railway Bridge, Nizamuddin Bridge, Akshardham Temple, and
Common Wealth Games Village obstruct the safe passage of flood water (Yamuna Jiye
Abhiyaan 2007). In addition, land use in natural term is poor due to loss of urban green
space. A major part of East district is covered by residential areas (Table 2). It is deficient
in terms of recreational areas. In MPD 2021, Delhi Development Authority (DDA) has
planned to develop recreational areas in this district. The plan includes the development of
Sanjay Lake, district parks, and historical monuments, among others.
New Delhi falls under Zone D of the Master Plan of Delhi—2001. It comprises Lutyens
Garden City and extension. As per 2011 census, the total population is around 0.13 million
and has a population density of around 3,820 persons per sq. km. New Delhi is the most
resilient district due to its physical, social, economic, and institutional dimensions (Fig. 5).
Between 1912 and 1930, Sir Lutyens planned New Delhi in a triangular shape, ‘‘which had
three functions at its apex, viz. commercial, governmental, and recreational’’ (DDA 1999).
Thus, the district is specially planned and consists mainly of residential areas, commercial
areas, recreational, transportation, governmental, and public and semi-public facilities
(DDA 1999).
The physical resilience of New Delhi is high mainly due to all five parameters men-
tioned in Table 1. However, housing and land use scored high on resilience. The residential
areas comprise government bungalows, private-leased bungalows, group housing, gov-
ernment housing areas, and plotted areas (Fig. 4; DDA 1999). The New Delhi Municipal
Corporation is a separate municipal authority that provides basic services and other
facilities to this district. This authority is mainly established to improve the quality of basic
services. A detailed study on basic services as per Master Plan standards shows that there is
hardly any deficiency (DDA 1999). Thus, the physical resilience score is above 4 (Fig. 5).
The social resilience score is above 4 (Fig. 5) due to population and health parameters
mentioned in Table 1. The district population is 0.80 % of the total population of Delhi and
shares 3 % of total area of NCT of Delhi. Moreover, the district has well-functioning and
efficient social and health facilities like schools and hospitals. The facilities are adequate
due to major employment centers located in this district (DDA 1999). Like basic services,
the commercial facilities and social infrastructure of New Delhi are adequate as per the
norms of Master Plan Standards (DDA 1999). In addition, economic resilience score is
above 4 due to better income and employment opportunities. The income and employment
levels are high as major employment centers are located here. Most of the district residents
live in bungalows are employees of the Centre and State government. The district also has
enterprises including finance, insurance, real estate, and business services; community,
personal services, and others (DES 2008). However, the budget and subsidy for disaster
risk reduction-related activities have not received proper attention. It includes activities
that are focused on capacity building at all levels. In natural dimension, the resilience score
is below 4 (Fig. 5) due to low intensity and frequency of climate-related hazards, and better
ecosystem and land use than other districts. In recent past, the district has not received any
major floods. However, heat waves, droughts, and local flooding are common in the district
but not major concern due to low intensity and frequency (DDMP-ND 2008).
The overall results of CDRI could also be useful in developing knowledge and
awareness of the city authorities such as DDMA, DDA, local level development initiators,
partners, and policy makers. DDMA can effectively utilize the study results in identifying
areas that could be targeted for disaster preparedness in future. Similarly, the results can be
1620 Nat Hazards (2012) 64:1609–1624
123
also useful to DDA in developing MPD—21, which also focuses on enhancing the disaster
preparedness. For instance, in planning for retrofitting activity, the authority can utilize
CDRI result in assessing the existing housing and land-use situation at micro-level.
4 Discussion
Over the last few decades, urban areas are increasingly getting affected by climate-related
disasters, which have resulted in increase in economic losses and deaths (Munich Re Group
2009). Typically, in urban areas, impacts of disasters depend upon several factors including
intensity and frequency of natural hazards, climate change, and urban stresses, among
others. However, it is also widely assumed that resilient cities can effectively address urban
stresses and impact of climate change. To build a resilient city, it is essential to assess their
resilience level.
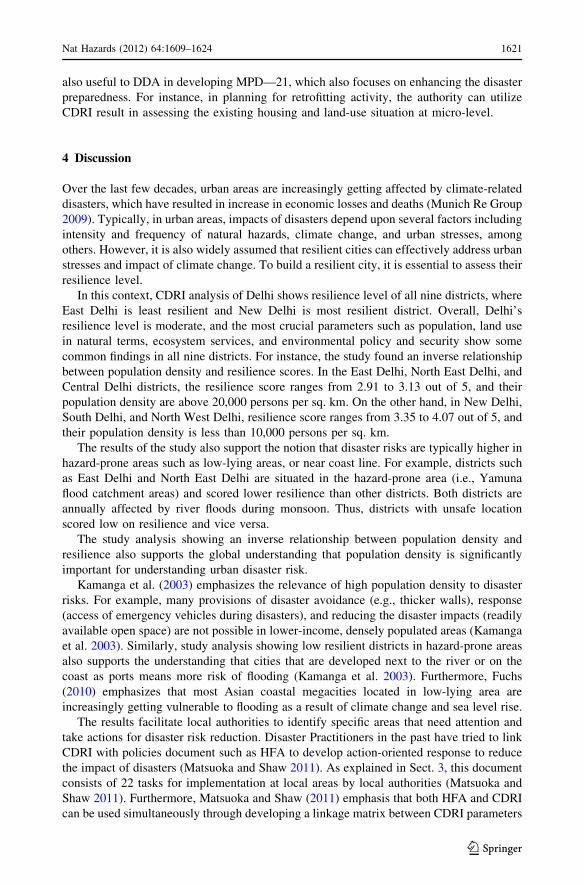
In this context, CDRI analysis of Delhi shows resilience level of all nine districts, where
East Delhi is least resilient and New Delhi is most resilient district. Overall, Delhi’s
resilience level is moderate, and the most crucial parameters such as population, land use
in natural terms, ecosystem services, and environmental policy and security show some
common findings in all nine districts. For instance, the study found an inverse relationship
between population density and resilience scores. In the East Delhi, North East Delhi, and
Central Delhi districts, the resilience score ranges from 2.91 to 3.13 out of 5, and their
population density are above 20,000 persons per sq. km. On the other hand, in New Delhi,
South Delhi, and North West Delhi, resilience score ranges from 3.35 to 4.07 out of 5, and
their population density is less than 10,000 persons per sq. km.
The results of the study also support the notion that disaster risks are typically higher in
hazard-prone areas such as low-lying areas, or near coast line. For example, districts such
as East Delhi and North East Delhi are situated in the hazard-prone area (i.e., Yamuna
flood catchment areas) and scored lower resilience than other districts. Both districts are
annually affected by river floods during monsoon. Thus, districts with unsafe location
scored low on resilience and vice versa.
The study analysis showing an inverse relationship between population density and
resilience also supports the global understanding that population density is significantly
important for understanding urban disaster risk.
Kamanga et al. (2003) emphasizes the relevance of high population density to disaster
risks. For example, many provisions of disaster avoidance (e.g., thicker walls), response
(access of emergency vehicles during disasters), and reducing the disaster impacts (readily
available open space) are not possible in lower-income, densely populated areas (Kamanga
et al. 2003). Similarly, study analysis showing low resilient districts in hazard-prone areas
also supports the understanding that cities that are developed next to the river or on the
coast as ports means more risk of flooding (Kamanga et al. 2003). Furthermore, Fuchs
(2010) emphasizes that most Asian coastal megacities located in low-lying area are
increasingly getting vulnerable to flooding as a result of climate change and sea level rise.
The results facilitate local authorities to identify specific areas that need attention and
take actions for disaster risk reduction. Disaster Practitioners in the past have tried to link
CDRI with policies document such as HFA to develop action-oriented response to reduce
the impact of disasters (Matsuoka and Shaw 2011). As explained in Sect. 3, this document
consists of 22 tasks for implementation at local areas by local authorities (Matsuoka and
Shaw 2011). Furthermore, Matsuoka and Shaw (2011) emphasis that both HFA and CDRI
can be used simultaneously through developing a linkage matrix between CDRI parameters
Nat Hazards (2012) 64:1609–1624 1621
123

and HFA tasks to address the urban issues. The output provides an overall and holistic
assessment of the tasks required to implement HFA, which links to services like physical
resilience or social or economic resilience of CDRI (Matsuoka and Shaw 2011). Thus,
linkage between HFA and CDRI can facilitate local authorities to implement HFA tasks.
In the case of Delhi, the synergy between CDRI of Delhi and HFA can facilitate
Government of NCT of Delhi to take effective measures to address city vulnerabilities. For
example, physical dimension of East Delhi is low due to unplanned settlements with dense
and dilapidated housing. This is also reflected in the housing and land-use parameters of
CDRI study. To address this issue, the matrix suggests that Government can address this
issue through implementing task 12, ‘‘to incorporate DRR in environment management,’’
task 14, ‘‘physical planning: establishing measures to incorporate DRR in urban and land-
use planning,’’ and task 15, ‘‘strengthen mechanisms for improved building safety.’’
Similarly, the adaptive capacity of most poor to accommodate natural hazards is very low.
This can be improved by implementing task 13, ‘‘social needs: establishing mechanisms
for increasing resilience of the poor and the most vulnerable.’’ Thus, implications of
implementing these HFA tasks would address the major vulnerability of Delhi.
Acknowledgments The first author acknowledges the guidance and support of his supervisor in carryingout this study. He is thankful to the Japanese Government (Monbukagakusho: MEXT) for scholarshipsupport for the study in Delhi, India. In addition, the first author received support in India from Dr. AnshuSharma of SEEDS, India, and Ms. Abha Mishra of UNDP, India. The first author would also like to thankthe District Project Officers and Project Coordinators of Delhi Government for valuable contribution in datacollection. Finally, the first author acknowledges Kyoto University’s Environmental Management LeaderProgram (EML) under which the author is pursuing his doctoral course.
References
Adger WN (2000) Social and ecological resilience: are they related? Prog Hum Geogr 24(3):347–364Adger WN (2006) Vulnerability. Global Environ Change 16:268–281Census of India (2001) Population projections for India and states 2001–2026. Office of the Registrar
General & Census Commissioner, New DelhiChatterjee M (2010) Slum dwellers response to flooding events in the megacities of India. Mitig Adapt
Strateg Glob Change 15:337–353Cutter SL, Barnes L, Berry M, Burton C, Evans E, Tate E, Webb J (2008) A place based model for
understanding community resilience to natural disasters. Global Environ Change 18:598–606DDA (Delhi Development Authority) (1999) Zone development plan (Divison-‘D’ New Delhi. Approved by
DDA for objection and suggestions. Delhi Development Authority, New DelhiDDA (Delhi Development Authority) (2007) Master plan for Delhi 2021. Delhi Development Authority,
New DelhiDDA (Delhi Development Authority) (2010) Zone development plan—East Delhi. Modified based on the
approval of Government of India. Delhi Development Authority, New DelhiDDMA (Delhi Disaster Management Authority) (2009) Chapter III: hazard and risk assessment. In Delhi
disaster management draft plan. http://www.delhi.gov.in/wps/wcm/connect/doit_dm/draft/plan.Accessed 28 May 2010
DDMP-E (District Disaster Management Plan—East) (2008) Office of the Deputy Commissioner (East),Government of NCT of Delhi
DDMP-ND (District Disaster Management Plan—New Delhi) (2008) Office of the Deputy Commissioner(New Delhi), Government of NCT of Delhi
DES (Directorate of Economics and Statistics) (2008) Report on fifth economic census 2005 in Delhi.Government of NCT of Delhi. www.delhi.gov.in/DoIT/DES/Economic_Census/es2005.pdf. Accessed26 Oct 2010
Dube US, De RK, Rao GSP (2005) Extreme weather events over India in the last 100 years. J Ind GeophysUnion 9(3):173–187
1622 Nat Hazards (2012) 64:1609–1624
123

EM-DAT (2010) India disaster statistics. The OFDA/CRED international disaster database. Centre forResearch on the Epidemiology of Disasters, University catholique de Louvain, Brussels
Fuchs (2010) Cities at Risk: Asia’s coastal cities in an age of climate change. Analysis from East-West Center no.96. http://www.apn-gcr.org/resources/archive/files/f8517fd6d7f894cdbf2140c7731a72e7.pdf Accessed on20 May 2012
Gallopin GC (2006) Linkages between vulnerability, resilience, and adaptive capacity. Global EnvironChange 16:293–303
Godschalk DR (2003) Urban hazard mitigation: creating resilience cities. Nat Hazard Rev 4(3):143–236Government of Delhi (2006) Delhi human development report 2006. Oxford University Press, New DelhiGovernment of India (2009) State and district administration—fifteenth report. Second Administrative
Reforms Commission, New Delhi, p 310Government of Maharashtra (2005) Status report—Maharashtra floods 2005. http://mdmu.maharashtra.gov.
in/pdf/Flood/statusreport.pdf. Accessed 23 May 2010Government of National Capital Territory of Delhi (2006) Delhi human development report 2006. Uni-
versity Press, OxfordHP State Disaster Management Authority (2009). State level advocacy workshop on planning and main-
streaming of disaster risk reduction. Government of India-UNDP Disaster Risk Reduction Programme(2009–2012), State Disaster Management Authority, Himachal Pradesh
Jha S, Rao V, Woolcock M (2005) Governance in the gullies: Democratic responsiveness and leadership inDelhi’s slums. Q-Squared Working Paper no. 5. Centre for International Studies, University of Tor-onto, Canada
Joerin J (2012) Enhancing climate-related disaster resilience of urban communities in Chennai, India.Dissertation, Kyoto University, Japan
Joerin J, Shaw R (2011) Mapping climate and disaster resilience in cities. In: Shaw R, Sharma A (eds)Climate and disaster resilience in cities. Emerald Group Publishing Limited, UK, pp 47–61
Kamanga LB, Diagne K, Lavell A, Leon E, Lerise F, MacGregor H, Maskrey A, Meshack D, Pelling M,Reid H, Satterthwaite D, Songsore J, Westgate K, Yitambe A (2003) From everyday hazards todisasters: the accumulation of risk in urban areas. Environ Urbaniz 15(1):193–204
Kumar P (2009) Assessment of economic drivers of land use change in urban ecosystems of Delhi, India.Ambio 38(1), Feb 2009
Kumar N, Aggarwal SC (2003) Pattern of consumption and poverty in Delhi slums. Econom Political Wkl5294–5300
Kumar N, Mitra A (2001) Social and economic dualism: caste, employment and poverty in Delhi slums.Delhi University, Institute of Economic Growth
Matsuoka Y, Shaw R (2011) Linking resilience planning to Hyogo framework for action in cities. In: ShawR, Sharma A (eds) Climate and disaster resilience in cities. Community, environment and disaster riskmanagement, vol 6. Emerald Group, UK, pp 129–147
Ministry of Health and Family Welfare (2007) State of urban health in Delhi. www.uhrc.in/name-CmodsDownload-index-req-getit-lid-63.html. Accessed 27 May 2010
Moench M, Tyler S, Lage J (2011) Catalyzing urban climate resilience. Applying resilience concepts toplanning practice in the ACCCRN program (2009–2011). Institute of Social and EnvironmentalTransition (ISET), International. ISET, Boulder
Mohanty UC, Ravi N, Madan OP, Paliwal (1997) Forecasting minimum temperature during winter andmaximum temperature during summer at Delhi. Meteorol Appl 4:37–48
Munich Re Group (2009) Natural catastrophes 2008: analysis, assessments, positions. Munich Re, MunichNational Disaster Management Authority (2010) National disaster management guidelines: management of
urban flooding. Government of India, New Delhi. http://ndma.gov.in/ndma/guidelines/Management_Urban_Flooding.pdf. Accessed 20 April 2012
Panda A (2011) Climate change risks & adaptation: Indian mega cities. The India Economy Review 2011,New Delhi, pp 26–33
Pareva M (2006) Urban flooding and its management. First Disaster Management Congress. http://nidm.gov.in/idmc/Proceedings/Flood/B2%20-%2036.pdf. Accessed 26 Sept 2010
Parvin AG, Joerin J, Prashar S, Shaw R (2011) Climate and disaster resilience mapping at microlevel ofcities. In: Shaw R, Sharma A (eds) Climate and disaster resilience in cities. Community, environmentand disaster risk management, vol 6. Emerald Group, UK, pp 103–127
Planning Department (2001) Delhi urban environment and infrastructure improvement project (DUIIP)Delhi—21. Ministry of Environment and Forests, Govt. of India, New Delhi
Prashar S, Shaw R (2012) Disaster resilience of slums in Delhi through appropriate risk communication.Asian J Environ Disaster Manag 4(1):575–593
Nat Hazards (2012) 64:1609–1624 1623
123
Prashar S, Shaw R, Takeuchi Y (2012) Community action planning in East Delhi: a participatory approachto build urban disaster resilience. Mitigation and adaptation strategies for global change. SpringerScience. doi:10.1007/s11027-012-9368-4
Rahman A, Netzband M (2007) An assessment of urban environmental issues using remote sensing and GIStechniques an integrated approach: a case study: Delhi, India’. In: De Sherbinin, A, Rahman A,Barbieri, A, Fosto, J C, and Zhu Y (eds) Urban population-environment dynamics in the developingworld: case studies an lessons learned. International Cooperation in National Research in demography(CICRED), Paris (Working paper). www.ciesin.columbia.edu/repository/pern/papers/urban_pde_rahman_etal.pdf-2009-12-04. Accessed 28 May 2010
SAARC (South Asian Association for Regional Cooperation) (2009) South Asian disaster report 2008,SAARC Disaster Management Centre. Mac Millan Publishers India Ltd., New Delhi
United Nations (2002) World urbanization prospects: The 2001 revision data tables and highlights. http://www.un.org/esa/population/publications/wup2001/wup2001dh.pdf. Accessed on 13 April 2012
Wisner B, Blaikie P, Cannon T, Davis I (2004) At risk: natural hazards. People’s vulnerability and disasters.MIT Press, Cambridge
World Bank (2009) Climate resilient cities: a primer on reducing vulnerabilities to disasters. The WorldBank, Washington
Yamuna Jiye Abhiyaan (2007) Yamuna flood plains under siege in Delhi. A report by Yamuna JiyeAbhiyaan. http://www.peaceinst.org/publication/book-let/Yamuna%20under%20siege-20in%20Delhi.pdf.Accessed on 25 April 2012
1624 Nat Hazards (2012) 64:1609–1624
123