Embed Size (px)
Citation preview
- 1 -
Assessing the Financial Impacts of RFID Technologies on the Retail and Healthcare Sectors
Anitesh Barua, Deepa Mani & Andrew B. Whinston Center for Research in Electronic Commerce
Department of IROM McCombs School of Business
The University of Texas at Austin
Executive Summary The introduction of RFID technologies in the retail and health care sectors has had a
profound economic impact, which is expected to grow substantially as new applications
are embraced and as implementations spread to a wider share of the economy.
RFID technologies have already added $40 billion in benefit to the retail and health care
sectors despite relatively low adoption of item-level RFID tagging. This benefit has come
from $4.4 billion in infrastructure investment in those sectors, implying a return on
investment of over 900 percent.
These early results reflect the promise of RFID technologies to fundamentally transform
virtually every sector of the economy by enabling new business processes that would be
economically infeasible with existing technologies and labor-intensive activities.
This study was commissioned because of the shortage of systematic studies assessing the
current and potential financial impact of this innovation at the industry or sector level.
Such assessment is critical in providing investment guidance to user firms as they ponder
the question of whether or when to adopt the technology in their business operations.
- 2 -
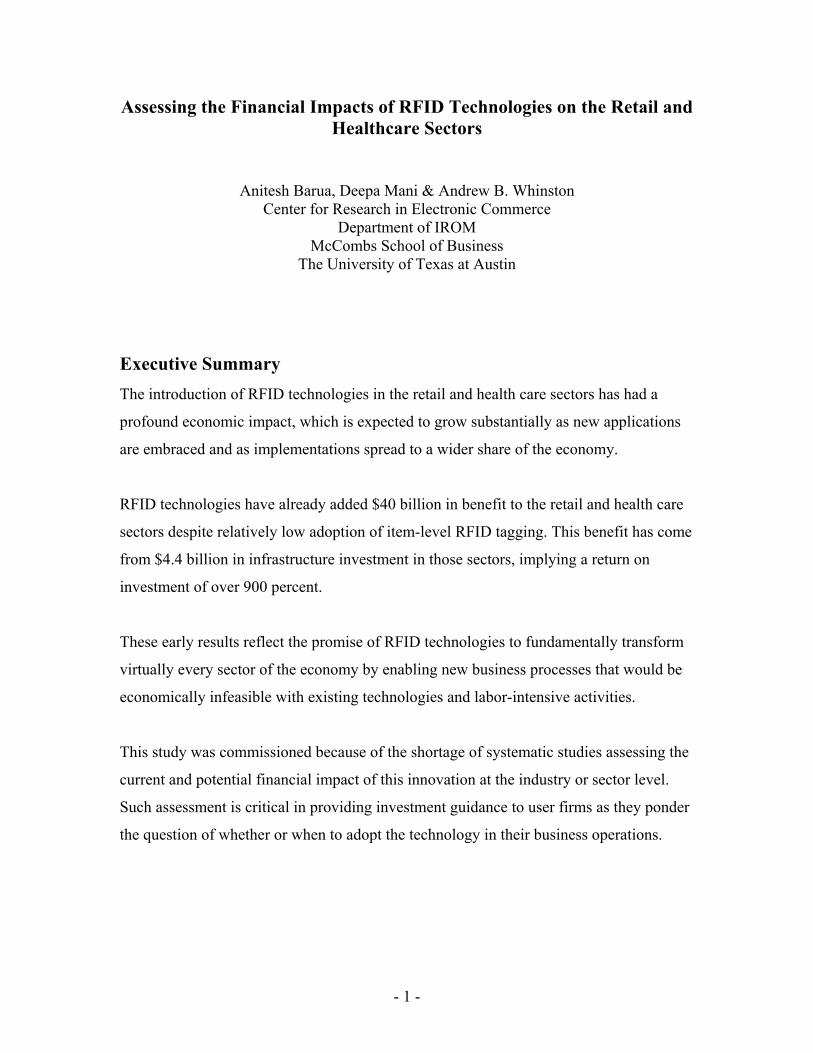
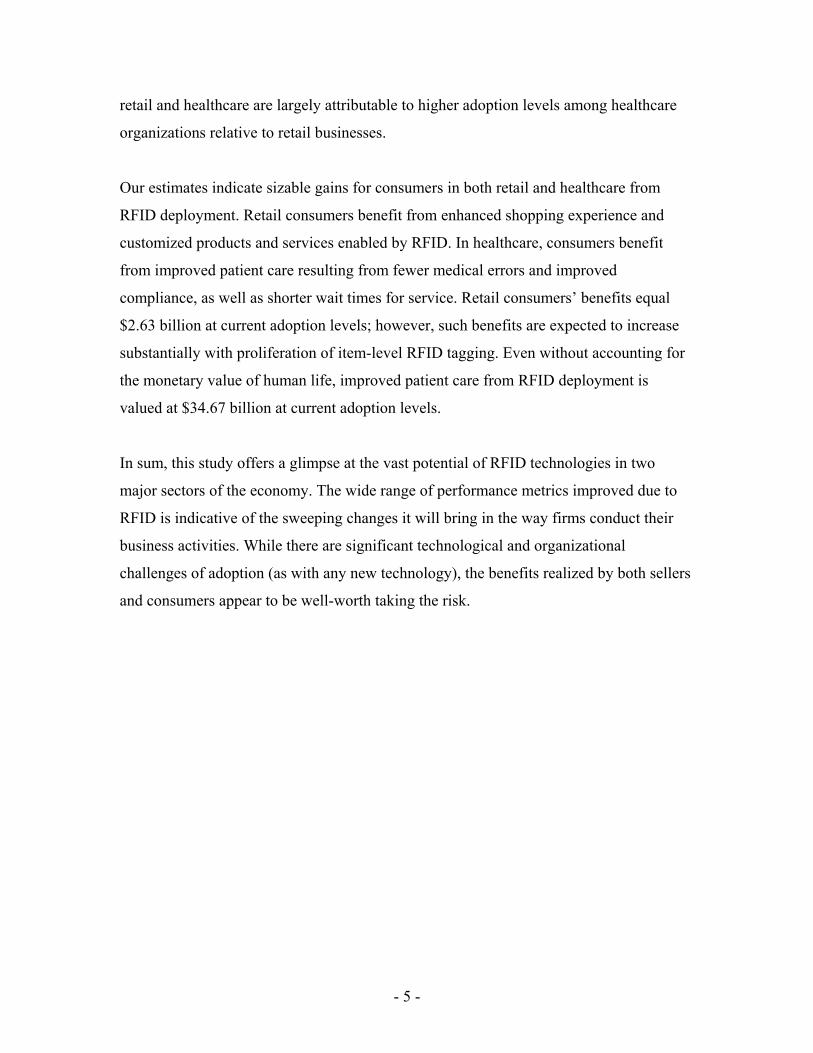
Current benefits (in USD billions) in Retail and Healthcare for sellers & consumers
In this study, we assess the financial benefits of RFID in retail and healthcare, which
represent two of the largest sectors of an economy. Our approach focuses on identifying
the operational efficiency benefits and revenue enhancing opportunities through RFID
deployment, and on quantifying such improvements. We also consider benefits that
accrue to consumers as a result of these RFID applications. Using data from a variety of
sources including case studies of RFID trials and deployment, government agencies such
as the Bureau of Labor Statistics and industry associations such as Healthcare
Distribution Management Association (HDMA), and synthesizing results from prior
studies, we find that RFID applications are already creating large benefits for both
sellers/service providers and consumers.
In computing financial benefits, we distinguish between and account for pallet- and item-
level RFID tagging. Using current adoption levels of RFID at the pallet (9% of sales) and
item levels (2% of sales) in retail, we estimate that sellers currently derive $12.05 billion
in benefits from existing RFID applications. These benefits result from reductions in (i)
labor costs, (ii) shrinkage losses, (iii) inventory write-offs and (iv) non-working
-
5.00
10.00
15.00
20.00
25.00
30.00
35.00
40.00
45.00
Retail Healthcare Total
Spend Seller Benefits Consumer Benefits
- 3 -
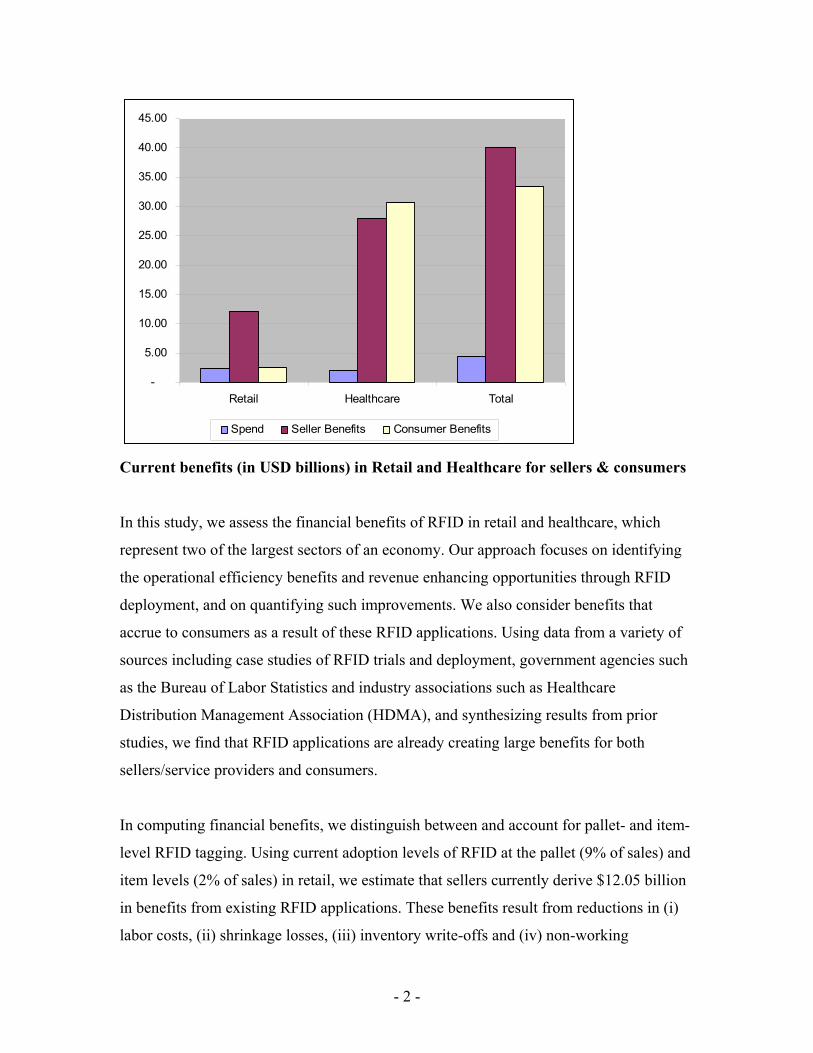
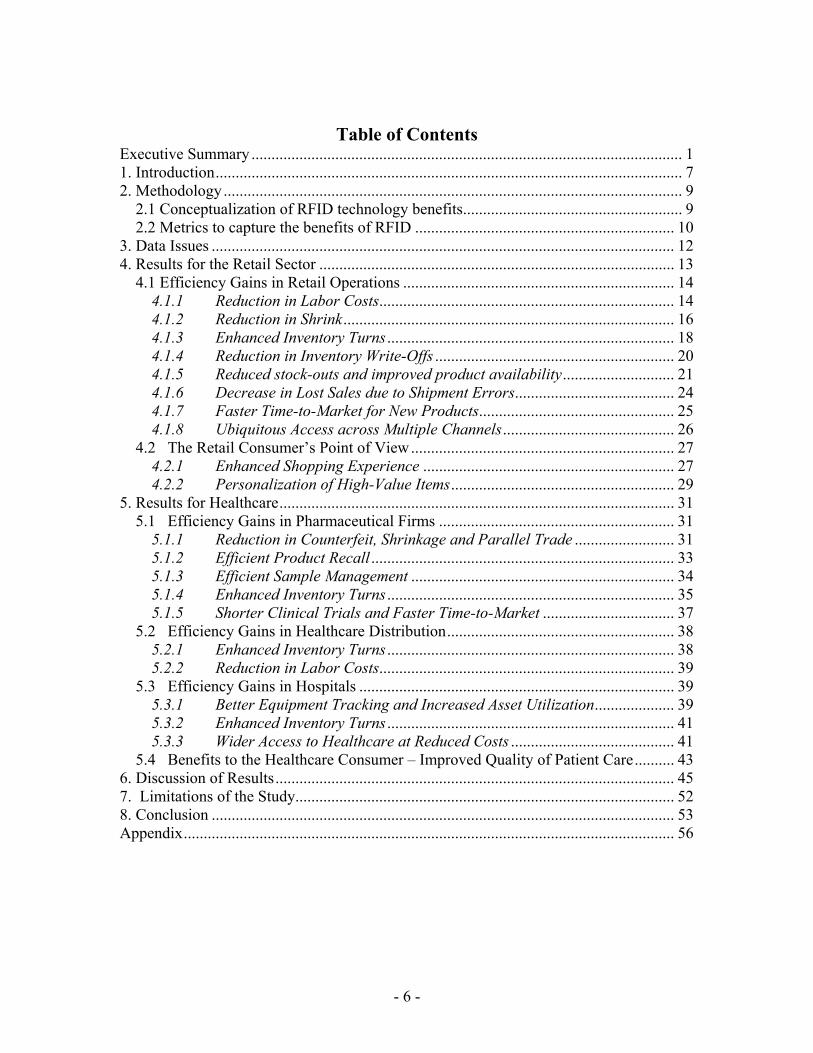
inventory, and also from increased product availability, faster time to market, and
providing ubiquitous access to customers across multiple channels. Based on projected
adoption rates of RFID in retail (e.g., 45% pallet and 20% item level tagging in 2011), we
find that the benefits to sellers in the retail sector will reach an impressive $68.55 billion
in five years time.
The Potential of RFID (in USD billions) in the retail sector
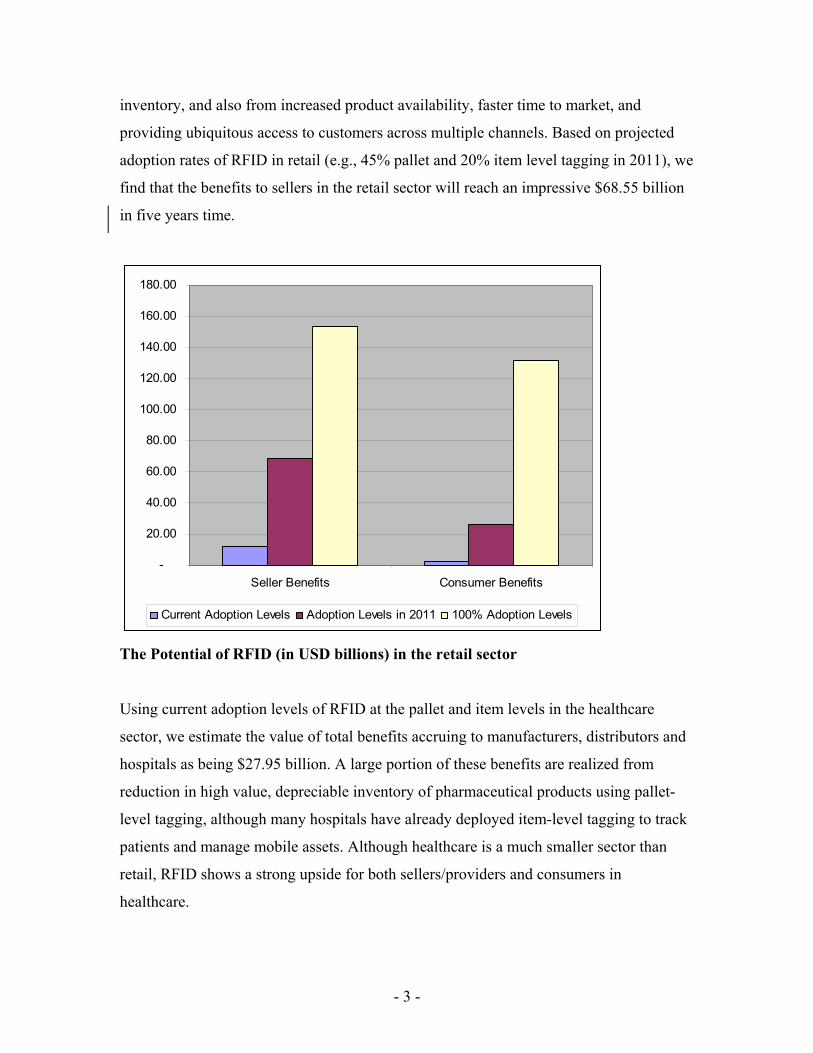
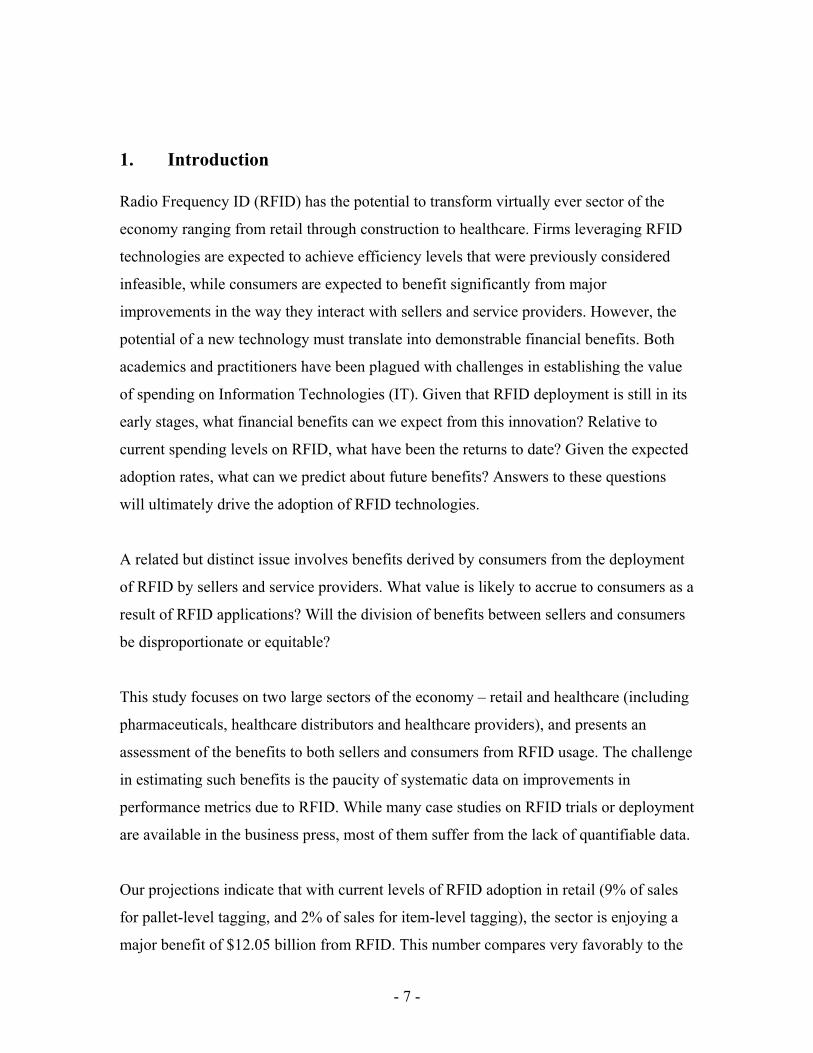
Using current adoption levels of RFID at the pallet and item levels in the healthcare
sector, we estimate the value of total benefits accruing to manufacturers, distributors and
hospitals as being $27.95 billion. A large portion of these benefits are realized from
reduction in high value, depreciable inventory of pharmaceutical products using pallet-
level tagging, although many hospitals have already deployed item-level tagging to track
patients and manage mobile assets. Although healthcare is a much smaller sector than
retail, RFID shows a strong upside for both sellers/providers and consumers in
healthcare.
-
20.00
40.00
60.00
80.00
100.00
120.00
140.00
160.00
180.00
Seller Benefits Consumer Benefits
Current Adoption Levels Adoption Levels in 2011 100% Adoption Levels
- 4 -
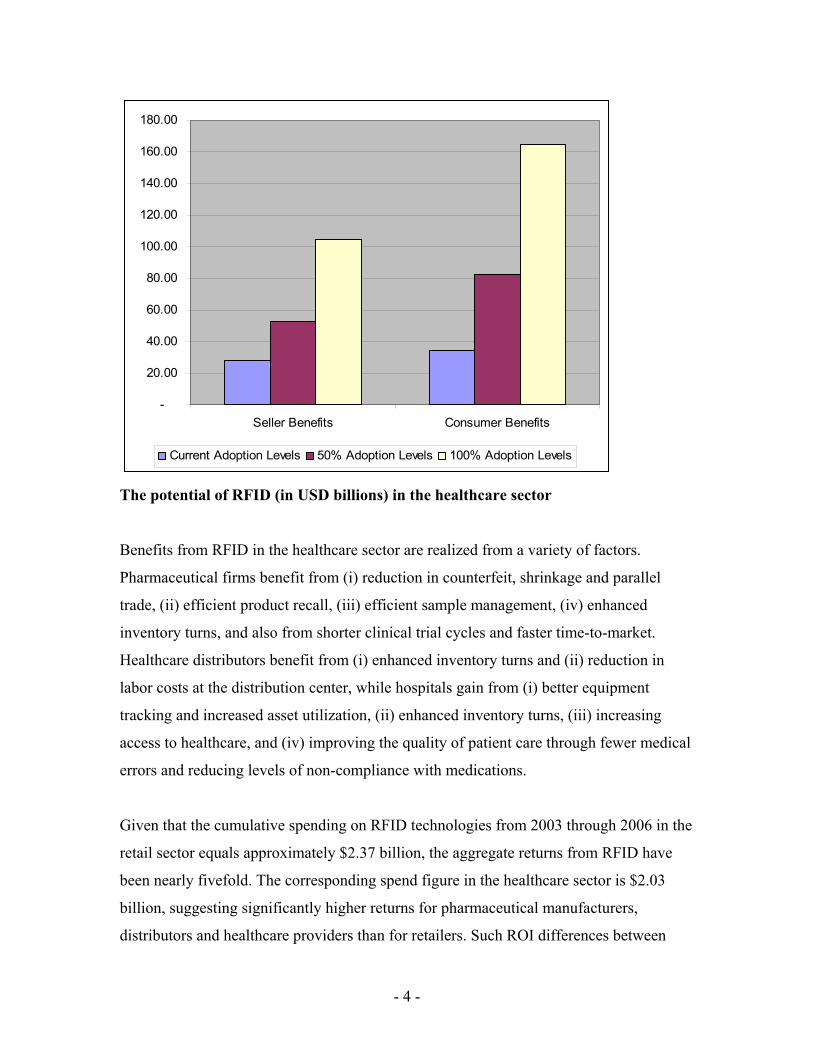
The potential of RFID (in USD billions) in the healthcare sector
Benefits from RFID in the healthcare sector are realized from a variety of factors.
Pharmaceutical firms benefit from (i) reduction in counterfeit, shrinkage and parallel
trade, (ii) efficient product recall, (iii) efficient sample management, (iv) enhanced
inventory turns, and also from shorter clinical trial cycles and faster time-to-market.
Healthcare distributors benefit from (i) enhanced inventory turns and (ii) reduction in
labor costs at the distribution center, while hospitals gain from (i) better equipment
tracking and increased asset utilization, (ii) enhanced inventory turns, (iii) increasing
access to healthcare, and (iv) improving the quality of patient care through fewer medical
errors and reducing levels of non-compliance with medications.
Given that the cumulative spending on RFID technologies from 2003 through 2006 in the
retail sector equals approximately $2.37 billion, the aggregate returns from RFID have
been nearly fivefold. The corresponding spend figure in the healthcare sector is $2.03
billion, suggesting significantly higher returns for pharmaceutical manufacturers,
distributors and healthcare providers than for retailers. Such ROI differences between
-
20.00
40.00
60.00
80.00
100.00
120.00
140.00
160.00
180.00
Seller Benefits Consumer Benefits
Current Adoption Levels 50% Adoption Levels 100% Adoption Levels
- 5 -
retail and healthcare are largely attributable to higher adoption levels among healthcare
organizations relative to retail businesses.
Our estimates indicate sizable gains for consumers in both retail and healthcare from
RFID deployment. Retail consumers benefit from enhanced shopping experience and
customized products and services enabled by RFID. In healthcare, consumers benefit
from improved patient care resulting from fewer medical errors and improved
compliance, as well as shorter wait times for service. Retail consumers’ benefits equal
$2.63 billion at current adoption levels; however, such benefits are expected to increase
substantially with proliferation of item-level RFID tagging. Even without accounting for
the monetary value of human life, improved patient care from RFID deployment is
valued at $34.67 billion at current adoption levels.
In sum, this study offers a glimpse at the vast potential of RFID technologies in two
major sectors of the economy. The wide range of performance metrics improved due to
RFID is indicative of the sweeping changes it will bring in the way firms conduct their
business activities. While there are significant technological and organizational
challenges of adoption (as with any new technology), the benefits realized by both sellers
and consumers appear to be well-worth taking the risk.
- 6 -
Table of Contents Executive Summary ............................................................................................................ 1 1. Introduction..................................................................................................................... 7 2. Methodology................................................................................................................... 9
2.1 Conceptualization of RFID technology benefits....................................................... 9 2.2 Metrics to capture the benefits of RFID ................................................................. 10
3. Data Issues .................................................................................................................... 12 4. Results for the Retail Sector ......................................................................................... 13
4.1 Efficiency Gains in Retail Operations .................................................................... 14 4.1.1 Reduction in Labor Costs.......................................................................... 14 4.1.2 Reduction in Shrink................................................................................... 16 4.1.3 Enhanced Inventory Turns ........................................................................ 18 4.1.4 Reduction in Inventory Write-Offs ............................................................ 20 4.1.5 Reduced stock-outs and improved product availability............................ 21 4.1.6 Decrease in Lost Sales due to Shipment Errors........................................ 24 4.1.7 Faster Time-to-Market for New Products................................................. 25 4.1.8 Ubiquitous Access across Multiple Channels........................................... 26
4.2 The Retail Consumer’s Point of View.................................................................. 27 4.2.1 Enhanced Shopping Experience ............................................................... 27 4.2.2 Personalization of High-Value Items........................................................ 29
5. Results for Healthcare................................................................................................... 31 5.1 Efficiency Gains in Pharmaceutical Firms ........................................................... 31
5.1.1 Reduction in Counterfeit, Shrinkage and Parallel Trade ......................... 31 5.1.2 Efficient Product Recall ............................................................................ 33 5.1.3 Efficient Sample Management .................................................................. 34 5.1.4 Enhanced Inventory Turns ........................................................................ 35 5.1.5 Shorter Clinical Trials and Faster Time-to-Market ................................. 37
5.2 Efficiency Gains in Healthcare Distribution......................................................... 38 5.2.1 Enhanced Inventory Turns ........................................................................ 38 5.2.2 Reduction in Labor Costs.......................................................................... 39
5.3 Efficiency Gains in Hospitals ............................................................................... 39 5.3.1 Better Equipment Tracking and Increased Asset Utilization.................... 39 5.3.2 Enhanced Inventory Turns ........................................................................ 41 5.3.3 Wider Access to Healthcare at Reduced Costs ......................................... 41
5.4 Benefits to the Healthcare Consumer – Improved Quality of Patient Care.......... 43 6. Discussion of Results.................................................................................................... 45 7. Limitations of the Study............................................................................................... 52 8. Conclusion .................................................................................................................... 53 Appendix........................................................................................................................... 56
- 7 -
1. Introduction Radio Frequency ID (RFID) has the potential to transform virtually ever sector of the
economy ranging from retail through construction to healthcare. Firms leveraging RFID
technologies are expected to achieve efficiency levels that were previously considered
infeasible, while consumers are expected to benefit significantly from major
improvements in the way they interact with sellers and service providers. However, the
potential of a new technology must translate into demonstrable financial benefits. Both
academics and practitioners have been plagued with challenges in establishing the value
of spending on Information Technologies (IT). Given that RFID deployment is still in its
early stages, what financial benefits can we expect from this innovation? Relative to
current spending levels on RFID, what have been the returns to date? Given the expected
adoption rates, what can we predict about future benefits? Answers to these questions
will ultimately drive the adoption of RFID technologies.
A related but distinct issue involves benefits derived by consumers from the deployment
of RFID by sellers and service providers. What value is likely to accrue to consumers as a
result of RFID applications? Will the division of benefits between sellers and consumers
be disproportionate or equitable?
This study focuses on two large sectors of the economy – retail and healthcare (including
pharmaceuticals, healthcare distributors and healthcare providers), and presents an
assessment of the benefits to both sellers and consumers from RFID usage. The challenge
in estimating such benefits is the paucity of systematic data on improvements in
performance metrics due to RFID. While many case studies on RFID trials or deployment
are available in the business press, most of them suffer from the lack of quantifiable data.
Our projections indicate that with current levels of RFID adoption in retail (9% of sales
for pallet-level tagging, and 2% of sales for item-level tagging), the sector is enjoying a
major benefit of $12.05 billion from RFID. This number compares very favorably to the

- 8 -
cumulative RFID investment of $2.37 billion from 2003 to 2006 in retail. More
interestingly, our analysis suggests that benefits to sellers in retail are projected to grow
to $68.55 billion in 2011 with pallet- and item-level tagging expected to reach 45% and
20% respectively. Most of these benefits are driven by reductions in labor cost, shrink
and inventory costs.
We also find that the benefits to sellers and service providers in the healthcare sector
amount to $27.95 billion at current adoption levels. Given that the cumulative RFID
investment in the healthcare sector during the 2003-2006 period was $2.03 billion, the
returns have been truly impressive. These benefits are largely attributable to reductions in
high value, depreciable inventory for both pharmaceutical manufacturers and hospitals,
and to improved asset tracking and utilization in hospitals.
RFID benefits have not eluded consumers either. In retail, we estimate consumer benefits
(assessed as the willingness-to-pay for customized products and services, and enhanced
shopping experience enabled by RFID) to equal $2.63 billion at current adoption levels.
In the healthcare sector, the corresponding consumer benefits are estimated to be $34.67
billion.
This research uses case studies that document successful trials or deployment of RFID.
Given the lack of cases highlighting failures in RFID implementation, we have implicitly
assumed that all RFID investments will succeed in realizing their expected benefits.
Based on failure rates in implementations of other IT applications, RFID deployment
may also witness its share of failures, especially in the early stages. However, even if half
of the RFID investments result in failure, the aggregate returns at the sector level will still
far outweigh the costs of RFID deployment.
In sum, this study offers a glimpse at the vast potential of RFID technologies in two
major sectors of the economy. The wide range of performance metrics improved due to
RFID is indicative of the large-scale changes it will bring in the way firms conduct their
business activities. While there are significant technological and organizational
- 9 -
challenges of adoption (as with any new IT), the benefits realized by both sellers and
consumers appear to be well-worth taking the risk.
2. Methodology 2.1 Conceptualization of RFID technology benefits
Any technology creates new value through a variety of means (e.g., enabling sellers and
consumers to do things faster, cheaper and better), which ultimately gets shared between
producers (sellers) and consumers based on industry competitiveness, relative bargaining
power of sellers and consumers, maturity of the technology, etc. The first step in
developing a model of RFID’s potential impact involves the enumeration of broad classes
of benefits for sellers and consumers enabled by RFID. For sellers, such benefits would
include better tracking of assets, increasing utilization of resources, reduction in out-of-
stock incidents, labor reduction, etc. For instance, U.K. retailer Tesco’s RFID trials with
item-level tagging resulted in a 50% increase in product availability, while shrinkage
reduced by 40%.
Seller-side benefits from RFID deployment (some of which may have to be passed on to
customers in the form of lower prices) = Top line gains (e.g., additional selling
opportunities in retail) + bottom line gains (efficiency related cost savings). We do not
attempt to decouple the part of the seller benefits that may have to be passed to the
consumers, since it depends on many factors including the extent of competition, and
buyer bargaining power. Top line gains will be measured not by additional revenues that
accrue to the sellers as a result of RFID, but by the corresponding EBITDA figures.
Bottom line gains (cost savings) are free cash flows, and are therefore used in seller
benefit calculations without any further adjustments.
Consumer benefits from RFID are measured as willingness-to-pay (WTP) for attributes
or features enabled by RFID technologies (such as less waiting time, enhanced shopping
experience, personalization, improved patient care, etc.). The central idea is that
consumers’ willingness to pay for a product or service indicates that the product or the
service is of value to them. Consumer value in retail is created through "hedonic"
- 10 -
attributes (experiential factors that do not directly relate to tangible outcomes such as
saving money). In healthcare, consumer value is created through higher safety and
improved patient care from fewer medical errors and improved compliance, and also
from faster access to healthcare services.
It is important to note that the maximum willingness-to-pay is how much a product or
service is worth to a consumer. A consumer expects to pay less than this amount, and the
difference between the maximum willingness to pay and the price paid is the consumer
surplus. In this study, we are not measuring the consumer surplus, since there is no
systematic data available at this time to enable such assessment.
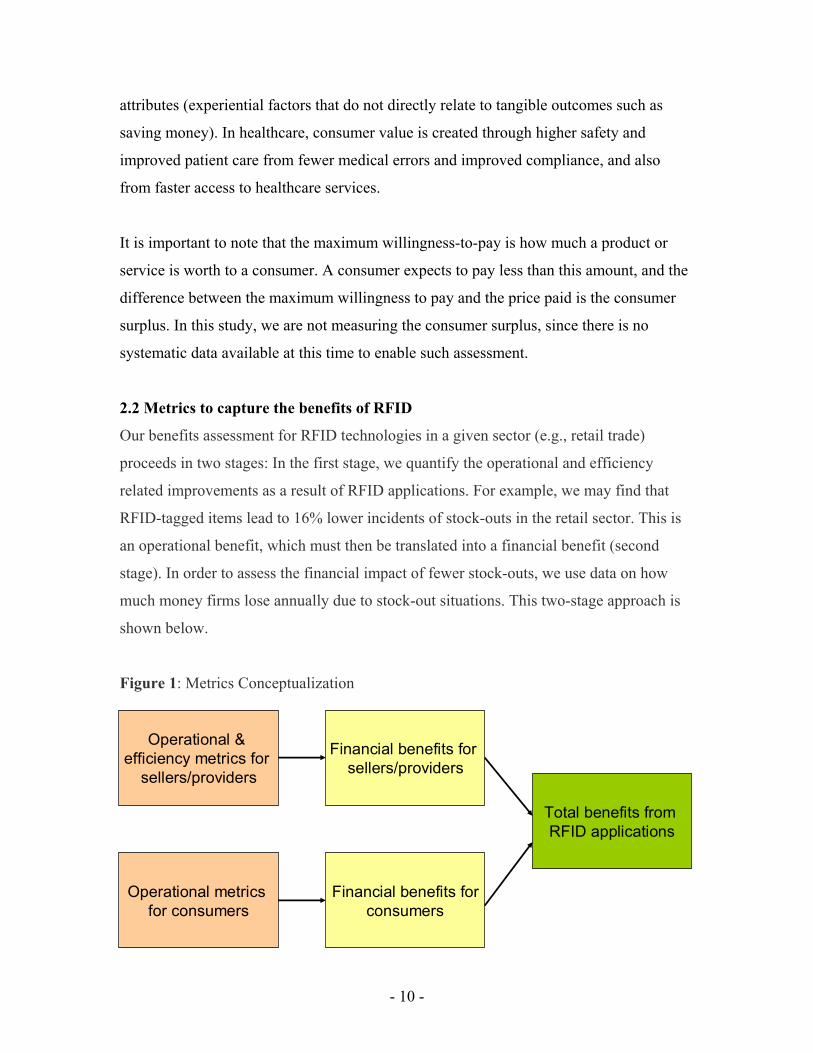
2.2 Metrics to capture the benefits of RFID
Our benefits assessment for RFID technologies in a given sector (e.g., retail trade)
proceeds in two stages: In the first stage, we quantify the operational and efficiency
related improvements as a result of RFID applications. For example, we may find that
RFID-tagged items lead to 16% lower incidents of stock-outs in the retail sector. This is
an operational benefit, which must then be translated into a financial benefit (second
stage). In order to assess the financial impact of fewer stock-outs, we use data on how
much money firms lose annually due to stock-out situations. This two-stage approach is
shown below.
Figure 1: Metrics Conceptualization
Operational & efficiency metrics for
sellers/providers
Operational metrics for consumers
Financial benefits forconsumers
Financial benefits for sellers/providers
Total benefits from RFID applications
- 11 -
Metrics for the Retail Sector
In retail, RFID applications are likely to increase efficiency and revenue through the
following improvements:
1. Reduction in Labor Costs
2. Reduction in Shrink
3. Enhanced Inventory Turns
4. Reduction in Inventory Write-Offs
5. Reduced Stock-Outs and Improved Product Availability
6. Decrease in Lost Sales Due to Shipment Errors
7. Faster Time-to-Market for New Products
8. Ubiquitous Access Across Multiple Channels
The above operational/efficiency metrics need to be mapped into a corresponding
financial benefit. E.g., if we find that inventory is lowered by x percent on an average due
to use of RFID technologies, the corresponding financial benefit is a savings of Y(1 -
x/100)c, where Y is the average inventory (in $), and where c is the inventory holding
cost commonly deployed in the sector. After assessing the financial benefits of improving
an operational/efficiency measure (e.g., inventory reduction) at the firm level, we project
the results to the sector level.
Consumer Metrics for the Retail Sector
1. Customization of products and services
2. Enhanced shopping experience
The metrics for the healthcare sector for pharmaceutical manufacturers, distributors,
hospitals and consumers respectively are enumerated below:
Metrics for Pharmaceutical Manufacturers
1. Reduction in Counterfeit, Shrinkage and Parallel Trade
2. Efficient Product Recall

- 12 -
3. Efficient Sample Management
4. Enhanced Inventory Turns
5. Shorter Clinical Trials and Faster Time-to-Market
Metrics for Healthcare Distributors
1. Enhanced Inventory Turns
2. Reduction in Labor Costs
Metrics for Hospitals
1. Better Equipment Tracking and Increased Asset Utilization
2. Enhanced Inventory Turns
3. Wider Access to Healthcare at Reduced Costs
Consumer Metrics for the Healthcare Sector
1. Faster Access to Better Healthcare
2. Improved Quality of Patient Care – fewer medical errors and improved
compliance
3. Reduced Mortality Rates
We make a distinction between item- and pallet-level tagging in our analysis. For
example, item level tagging is necessary for certain types of benefits, such as drug
compliance for patient care or customization of retail products and services, to be
realized. We then use data on item- and pallet-level adoption levels to estimate the
aggregate benefits for each metric in the two sectors.
3. Data Issues Use of RFID is in its early stages even in advanced sectors of the economy. Therefore, it
is difficult to obtain systematic data that can help in assessing financial benefits. Thus, we
rely on case studies reported in the business press, synthesize findings from other studies,
and then extrapolate the findings to the retail and healthcare sectors. One challenge in
using these case studies is that many of them do not provide quantified benefits, either at

- 13 -
the efficiency metric or the financial level. Such cases may provide insights into the
experience of a retailer or healthcare organization with RFID, but are of limited value for
estimating financial benefits. We map case studies to the metrics identified in the
conceptualization part of our research, and if any quantification of efficiency or other
metrics is provided in the case, we use it to calculate financial benefits. For example, if a
case study in the retail sector identifies that a firm has lowered its inventory by 15% as a
result of a trial application of RFID, we use an inventory holding cost that is generally
used in that sector (e.g., 33%) to quantify the financial benefits of lower inventory. Case
studies were obtained from many sources including the RFID Journal and the RFID
Gazette.
For general economic data (e.g., the size of retail and healthcare sectors, labor costs, etc.),
we rely on sources such as the Bureau of Labor Statistics, while for detailed data on
individual sectors and firms, we rely upon publications of industry associations. For
example, data on the number of beds in hospitals, current adoption levels of RFID by
pharmaceutical firms, distribution centers and healthcare providers, etc., were obtained
from the Handbook of the Healthcare Distribution Management Association (HDMA).
4. Results for the Retail Sector RFID can potentially yield significant efficiency benefits across the retail supply chain,
ranging from reduction in labor costs to enhanced inventory velocity and accuracy. We
discuss below the nature and potential value of efficiency benefits that accrue to retailers
from the use of RFID in supply chain operations. We also discuss related consumer
benefits that are realized from the use of RFID. These include improved outcomes,
processes, and “hedonic” benefits or experiential benefits that may not directly relate to
tangible consumer value outcomes.
- 14 -
4.1 Efficiency Gains in Retail Operations
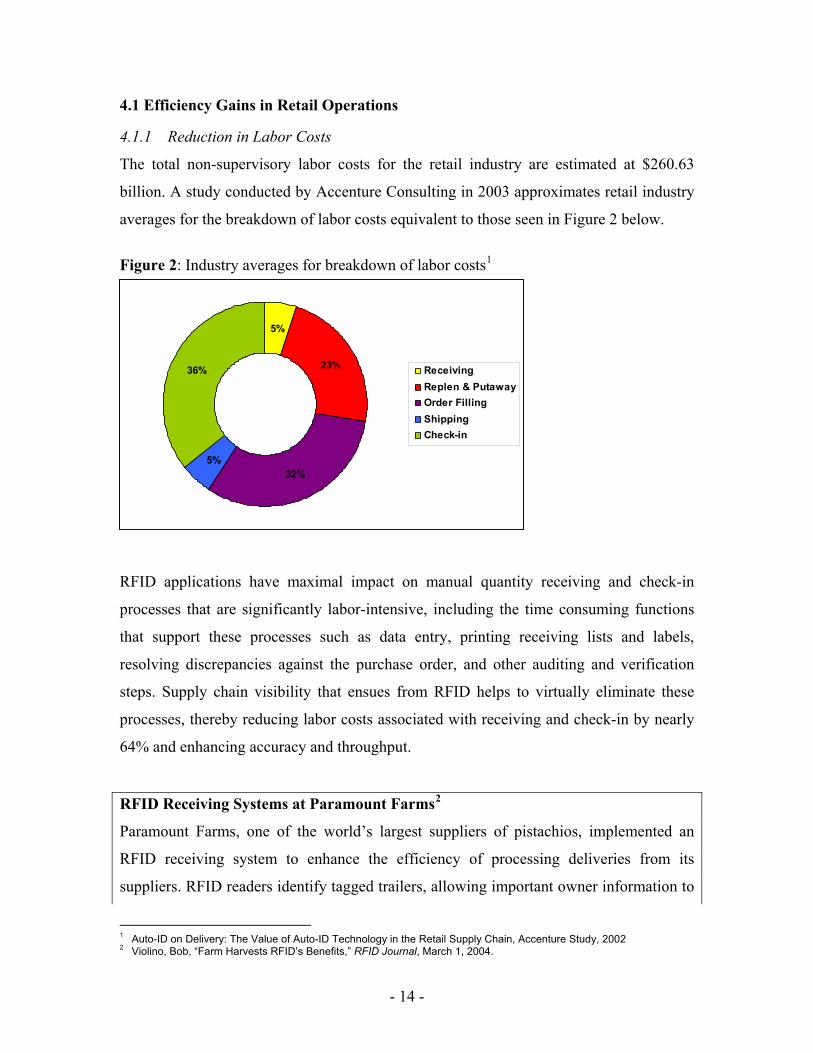
4.1.1 Reduction in Labor Costs
The total non-supervisory labor costs for the retail industry are estimated at $260.63
billion. A study conducted by Accenture Consulting in 2003 approximates retail industry
averages for the breakdown of labor costs equivalent to those seen in Figure 2 below.
Figure 2: Industry averages for breakdown of labor costs1
5%
23%
32%5%
36% ReceivingReplen & PutawayOrder FillingShippingCheck-in
RFID applications have maximal impact on manual quantity receiving and check-in
processes that are significantly labor-intensive, including the time consuming functions
that support these processes such as data entry, printing receiving lists and labels,
resolving discrepancies against the purchase order, and other auditing and verification
steps. Supply chain visibility that ensues from RFID helps to virtually eliminate these
processes, thereby reducing labor costs associated with receiving and check-in by nearly
64% and enhancing accuracy and throughput.
RFID Receiving Systems at Paramount Farms2
Paramount Farms, one of the world’s largest suppliers of pistachios, implemented an
RFID receiving system to enhance the efficiency of processing deliveries from its
suppliers. RFID readers identify tagged trailers, allowing important owner information to
1 Auto-ID on Delivery: The Value of Auto-ID Technology in the Retail Supply Chain, Accenture Study, 2002 2 Violino, Bob, “Farm Harvests RFID’s Benefits,” RFID Journal, March 1, 2004.
- 15 -
be retrieved from the company’s grower receiving system database. RFID-enabled
automation speeds data entry and ensures accuracy. Before the company implemented the
new RFID system, a Paramount employee would manually check and record a stenciled
ID number on the side of each trailer. Data collection in this manner would take up to two
minutes. However, human error and occasional fading of the number sometimes resulted
in inaccurate recording. Further, the manual process was impeded by elements of
physical hardship such as hostile climatic conditions in the plants’ desert location.
Paramount notes that the new RFID enabled receiving process has significantly reduced
the amount of paperwork and manual data-entry steps, slashed the transaction time for
initiating a new load by 60%, reduced trailer usage by 30%, and enabled the company to
meet increased production goals without adding to its workforce. All of these have
contributed to significant reduction in labor costs at Paramount Farms.
This estimated reduction in receiving and check-in labor costs is conservative since it
does not consider savings from improved labor throughput and accuracy, and its impact
on overall operational efficiency. For example, because of increased efficiency in
receiving and check-in, Paramount was able to cancel plans to build a new scale house
required to meet rising demand for its products. That generated additional savings on
capital expenditures. Timely, accurate and easy access to product delivery information
has enabled informed management decisions on the plant floor. Most important, the new
system has contributed to better dispute resolution, and improved supplier management
and satisfaction.
The efficiency benefits from the use of RFID in receiving and check-in also percolate to
consequent replenishment and order filling, resulting in labor cost reductions of nearly
25% in these categories. RFID enables putaway and replenishment personnel to drop off
and pick up merchandise without manual scanning or verification. Inventory systems are
automatically adjusted to accurately reflect new quantities, thereby enabling better
resource utilization and fewer errors in stocking and shipment.
- 16 -
Similarly, in the case of order filling, greater locational accuracy of inventory enabled by
RFID allows order fill personnel to be directed to the right picking location and retrieve
the required quantity of merchandise for further handling. RFID also enables direct
reduction in order filling labor costs by eliminating manual verification of quantities
filled and consequent resolution of discrepancies against the purchase order. Inventory
levels and store order information too are automatically updated.
The total reduction in labor costs that accrue from the use of RFID is estimated at
$102.95 billion. This estimate and all estimates presented below assume 100% adoption
of RFID in retail. However, we also calculate the benefits for current adoption levels and
those for the year 2011, when pallet-level tagging is expected to reach 45%. Details of
these and all other benefits are provided in the Appendix at the end of the document.
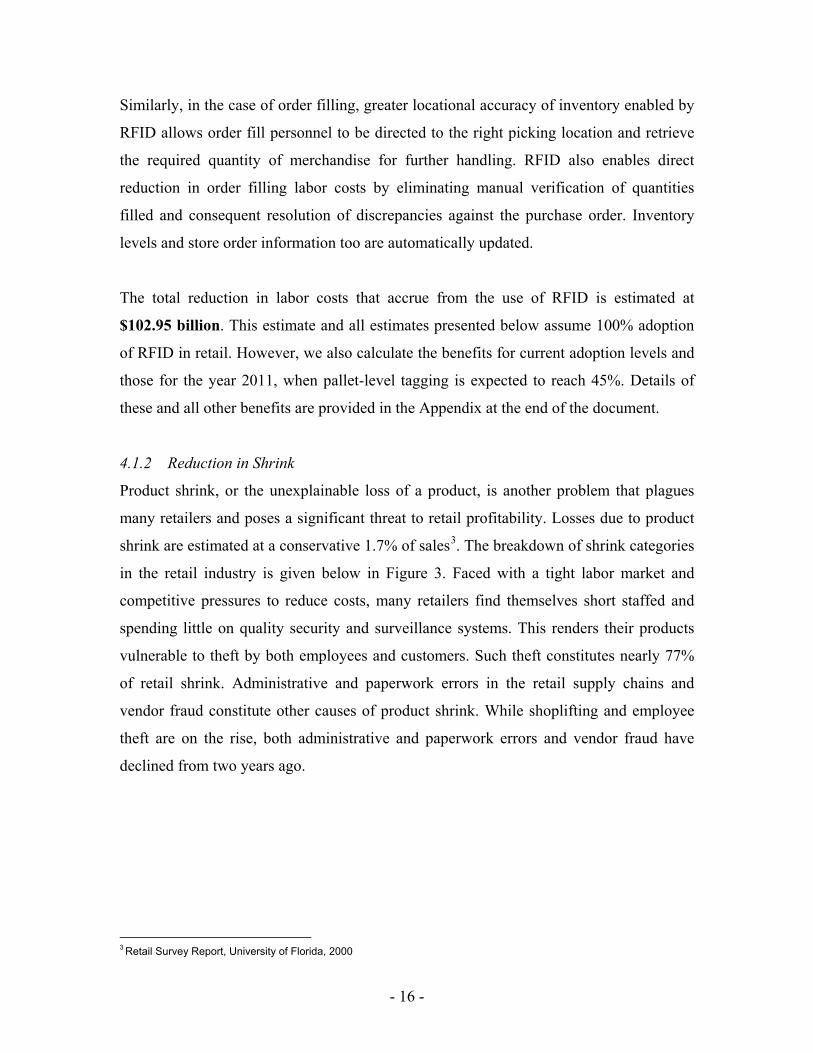
4.1.2 Reduction in Shrink
Product shrink, or the unexplainable loss of a product, is another problem that plagues
many retailers and poses a significant threat to retail profitability. Losses due to product
shrink are estimated at a conservative 1.7% of sales3. The breakdown of shrink categories
in the retail industry is given below in Figure 3. Faced with a tight labor market and
competitive pressures to reduce costs, many retailers find themselves short staffed and
spending little on quality security and surveillance systems. This renders their products
vulnerable to theft by both employees and customers. Such theft constitutes nearly 77%
of retail shrink. Administrative and paperwork errors in the retail supply chains and
vendor fraud constitute other causes of product shrink. While shoplifting and employee
theft are on the rise, both administrative and paperwork errors and vendor fraud have
declined from two years ago.
3 Retail Survey Report, University of Florida, 2000

- 17 -
Figure 3: Industry averages for shrink categories4
45%
32%
17%
6%
Employee Theft
Shoplifting
Admin. and PaperworkErrors
Vendor Fraud
Increased visibility, traceability and order accuracy provided by RFID help combat the
issue of product shrink sans an increase in associated labor costs. Over time, RFID
applications will help enhance accountability in the supply chain, thereby proving an
invaluable tool in the reduction of shrink as products move through the supply chain.
While item-level tagging is more likely to reduce employee theft and shoplifting, case
level tagging will likely have little impact on these categories. However, case level
tagging can virtually eliminate vendor fraud and also reduce administrative and
paperwork errors.
A study by IBM Consulting Services notes that pilot programs for implementation of
RFID, by a major retail customer, have yielded up to 47 percent reduction in losses from
shrink, including theft5. This is aligned with results from other pilot programs in the retail
industry. For example, the U.K. retailer Tesco has focused on RFID applications to
reduce shrink in its high value items, such as DVDs and compact disks, which are
characterized by relatively higher levels of theft. Company reports state that the item-
level pilots have significantly reduced theft, and decreased overall product shrink by as
much as 20% to 50%6. An RFID rollout at Scottish Courage Brewing in the U.K. also
4 Auto-ID on Delivery: The Value of Auto-ID Technology in the Retail Supply Chain, Accenture Study, 2002 5 Using RFID Tags to Prevent Theft, RFID Journal, July 14, 2003
6 The Present and Future of RFID, Barcode and RFID News, available at: http://www.unifiedbarcode.com/article-rfid-retailers.html
- 18 -
saw a 50% reduction in product theft. The Metro Group, in its pilot program, found 18%
reduction in product shrink.
The total reduction in retail product shrink losses that accrues from the use of RFID is
estimated at $19.06 billion.
4.1.3 Enhanced Inventory Turns
Accurate inventory information is necessary to better manage production models, track
work-in-process and speed finished goods through the supply chain. Poor visibility into
the supply chain and allied inaccurate information on inventory levels result in low
inventory turns and high inventory carrying costs that are important impediments to retail
profitability. Inventory turns in the retail industry fell from 14 in 2002 to fewer than 11 in
2003, suggesting that the average annual inventory holding cost in the retail industry is a
significant $105.65 billion. Manual processes, such as receipts, “assumed receipts”, sales
data, and cycle or physical counting, serve as typical updates to retail inventory levels,
rendering inventory control and management prone to erroneous and delayed
information. High levels of inventory inaccuracy result in low levels of inventory
velocity and ultimately low levels of customer service.
The use of RFID in inventory management processes helps provide accurate, real-time
information and insight into the movement of goods across the supply chain. RFID
tagged inventory can be tracked automatically with reduced manual intervention,
validation and reconfiguration as it moves through the manufacturing, distribution and
store sites. This helps to significantly reduce costly inventory errors, optimize time and
resources, improve inventory forecasting and enhance inventory turns. Improved
inventory processes also help to better manage and match production and demand
models.
- 19 -
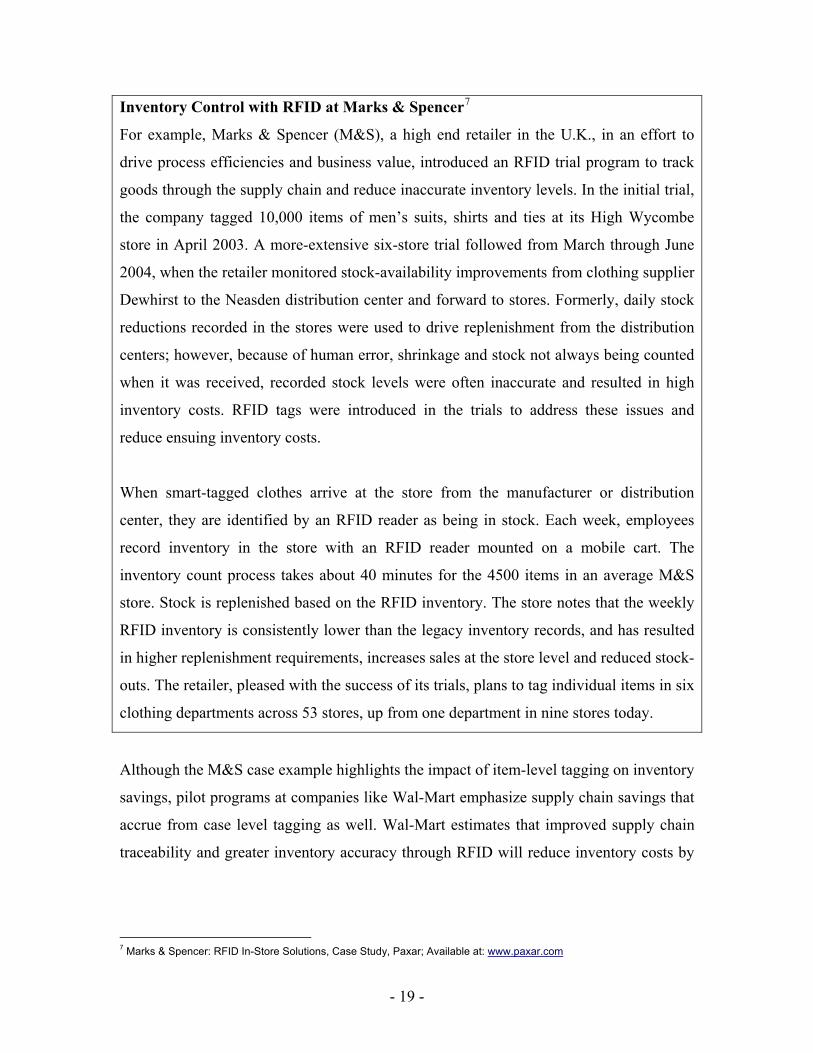
Inventory Control with RFID at Marks & Spencer7
For example, Marks & Spencer (M&S), a high end retailer in the U.K., in an effort to
drive process efficiencies and business value, introduced an RFID trial program to track
goods through the supply chain and reduce inaccurate inventory levels. In the initial trial,
the company tagged 10,000 items of men’s suits, shirts and ties at its High Wycombe
store in April 2003. A more-extensive six-store trial followed from March through June
2004, when the retailer monitored stock-availability improvements from clothing supplier
Dewhirst to the Neasden distribution center and forward to stores. Formerly, daily stock
reductions recorded in the stores were used to drive replenishment from the distribution
centers; however, because of human error, shrinkage and stock not always being counted
when it was received, recorded stock levels were often inaccurate and resulted in high
inventory costs. RFID tags were introduced in the trials to address these issues and
reduce ensuing inventory costs.
When smart-tagged clothes arrive at the store from the manufacturer or distribution
center, they are identified by an RFID reader as being in stock. Each week, employees
record inventory in the store with an RFID reader mounted on a mobile cart. The
inventory count process takes about 40 minutes for the 4500 items in an average M&S
store. Stock is replenished based on the RFID inventory. The store notes that the weekly
RFID inventory is consistently lower than the legacy inventory records, and has resulted
in higher replenishment requirements, increases sales at the store level and reduced stock-
outs. The retailer, pleased with the success of its trials, plans to tag individual items in six
clothing departments across 53 stores, up from one department in nine stores today.
Although the M&S case example highlights the impact of item-level tagging on inventory
savings, pilot programs at companies like Wal-Mart emphasize supply chain savings that
accrue from case level tagging as well. Wal-Mart estimates that improved supply chain
traceability and greater inventory accuracy through RFID will reduce inventory costs by
7 Marks & Spencer: RFID In-Store Solutions, Case Study, Paxar; Available at: www.paxar.com

- 20 -
nearly $1 billion, estimated at approximately 0.4% of sales8. An Accenture study
estimates 10-30% reduction in inventory due to reduced safety stock9.
The total reduction in inventory costs that accrues to the retail industry from the use of
RFID is estimated at $16.33 billion.
4.1.4 Reduction in Inventory Write-Offs
More than 10% of all perishable goods, including foods products, are rendered unusable
before they reach the consumer. Inventory write-offs in the retail industry from spoilage
and obsolescence cost the retail industry $120 billion worldwide. The corresponding
figure for the U.S. retail industry is estimated at $52.83 billion.
RFID can significantly reduce the amount of non-saleable spoilage and perishables in the
supply chain. Expiry information, recorded to the write portion of the tag, enables
warehouse and other enterprise systems to identify products that need to be moved
relatively quickly to points of sale or removed from distribution. Further, some products,
such as produce, fresh foods and/ or frozen foods, spoil more easily and quickly than
others. Unfavorable temperatures may further erode shelf life, resulting in rejection of the
shipment by the retailer. RFID tags can help reduce the likelihood of spoilage in the
distribution of these goods. For example, some food producers are pairing RFID
technology with diagnostic sensors to gather information about product handling during
transport, and consequently using the near real-time data to correct environmental
problems and mitigate spoilage.
SYSCO Gets Fresh with RFID10
Wholesale food distributor SYSCO undertook a trial implementation of an RFID system
to both ensure the freshness of produce and frozen goods distributed by the firm as well
as determine location of spoilage. RFID tags, deployed at various points in the
refrigerated trailer used to transport fresh produce and frozen food, monitored sudden
8 Kapica, Jack, “RFID Exposed: The Naked Truth About the Future of Retail,” Digital Journal, July 7, 2006 9 Blount, Dan, “RFID in the Warehouse/ Distribution,” Sun Microsystems presentation, 10 Collins, Jonathan, “SYSCO Gets Fresh with RFID,” RFID Journal, June 13, 2005

- 21 -
variations in temperature, thereby recording exactly when the trailer’s doors were
opened. The tags were first read inside the trailer using a PDA, thereby identifying
problems even before the shipment was unloaded. Data recorded on the tag also provided
a record of the shipment temperature during transit. The tags were subsequently removed
when the goods were delivered and interrogated by RFID readers to download
temperature logs. In this manner, all members of the supply chain were informed
whether, when and how goods were mistreated. Prior equipment in SYSCO that
monitored temperatures produced printed results that needed manual intervention for
interpretation and/ or required that the temperature recorder be sent away and the
temperature record returned only after days or weeks. After SYSCO’s success with the
trial implementation, it is expected that the company will replace existing equipment with
the RFID system.
Trials of Sensitech’s RFID-enabled temperature tracking product showed that companies
could reduce losses due to spoilage by as much as 15%11. Other studies estimate that
inventory write-offs from spoilage and obsolescence can be reduced by up to 20% using
RFID.
The total savings in inventory write-offs, from the use of RFID, is estimated at $10.56
billion.
4.1.5 Reduced stock-outs and improved product availability
Estimates of lost sales in the U.S. retail industry, due to stock-outs, range from 1 - 4% of
total store sales, scaling to 11% of the top 2,000 items and 20% during special
promotions. According to the Food Business Forum, the Food Marketing Institute and the
Grocery Manufacturers of American grocery stores, as much as 8.3 percent of retail
revenue is lost each year due to stock-outs. Some estimates of such loss are even higher.
For example, a study of over 600 store locations, conducted by IRI and Procter &
Gamble, found that over 2% of high-volume stock keeping units (SKUs) are out-of-stock
at any given time, and contribute to revenue losses upward of 25% in some promoted
11 Catherine O’Connor, Mary, “Sensitech’s RFID Cold Chain Solution,” RFID Journal, November 11, 2005
- 22 -
categories. In broader studies, the overall economic impact of stock-outs on the retail
marketplace is estimated at $69 billion in lost revenue. In addition to lost revenue, the
availability of products that meet the customer’s needs and wants is an important
determinant of customer satisfaction and loyalty. This is evidenced in the study
conducted by IRI and Procter & Gamble, which concluded that 15% of the time, when
consumers encounter a stockout, the sale is lost altogether, and 50% of the time,
consumers purchase a competing brand. Similarly, a study by Intel12 points to lost sales
20% of the time that an item is out-of-stock.
According to a 2002 study13 commissioned by the Grocery Manufacturers of America
(GMA), retailers are responsible for nearly 75% of all stock-out situations – in 50% of
the cases, the problem stems from poor planning and forecasting, and 25% of the time,
the products are within the store but are either misplaced or not recorded in store
inventory systems.
RFID has the potential to address these supply chain inefficiencies and significantly
reduce stock-outs. First, RFID systems can reduce human error and better match
outbound merchandise against the purchase order. For example, if the wrong number of
cases were loaded at the distribution center, RFID readers would scan the case tags, and
enterprise systems designed to compare the pallet info against the purchase order would
alert personnel loading the cases to the error. Second, automated supply chain processes
enable companies to collect more data while reducing the extent of human error. Finally,
RFID provides significant visibility into the supply chain, thereby establishing real time
links between the manufacturer, distribution center and retail store. The high levels of
locational accuracy throughout the supply chain, enabled by RFID, allow for efficient
inventory operations – they improve the way retailers replenish their goods and help
manufacturers to better plan for variations in retail demand.
12 Jon C. Stine, Intel Retail Consumer Package Goods: Industry Field Primer, Oct. 28, 2005 13 Retail Out-of-Stocks: A Worldwide Examination of Extent, Causes and Consumer Responses, 2002.
- 23 -
Tesco Uses Smart Shelves to Reduce Stock-Outs
Item-level tagging has the potential to virtually eliminate stock-outs. “Smart shelves” can
monitor inventory and alert personnel to impending stock-outs. For example, Tesco has
been testing smart shelves, or shelves with RFID readers, to monitor its stock of DVDs in
real time. RFID tags are placed on DVDs, outbound for two stores, at the DVD
distribution company. The DVDs are tracked both in the back of the store and on the
shelf. In this manner, store personnel acquire information on stock and location of DVDs,
so that workers can replenish shelves and put items back in the right location. Tesco CIO
Collin Cobain noted that during the initial trial at the stores, item-level tags increased
product availability by over 50%.
Pallet-level Tagging Reduces Stock-Outs at Wal-Mart14
Although item-level tagging yields significant benefits, most companies are researching
and investing in pallet-level tagging for now. A dominant example in this regard is that of
Wal-Mart. A University of Arkansas study15 compared stock-out levels between 12
RFID-enabled and 12 control stores to analyze the impact of RFID on product
availability. Wal-Mart has leveraged its RFID system to make an important process
change to the monitoring and management of shelf stock. The store generates pick lists,
not through manual inspection of stock levels on shelves or back-room stock, but rather
by combining point-of-sale data with data generated from RFID readers located at the
loading dock, at the doorway between back room and sales floor, and readings of empty
cases. Thus, pick lists generated are automatically.
The RFID-generated lists correlated with reduced stock-outs in the test stores, and
emphasize the significance of RFID in improving operational processes in the retail
environment. The report highlights the impact on stock-outs of non-RFID-generated pick
lists, partially RFID-generated pick lists and fully RFID-generated lists. In comparison
with weekly stock-out levels of test stores that use a non-RFID-generated pick list, the
stock-outs improved by 15 percent at test stores using a partially RFID-generated list, and
14 Collins, Jonathan, “The $69 billion Problem,” RFID Journal, 2005. 15 Hardgrave, B.C., Waller, M., and R. Miller, “Does RFID Reduce Out of Stocks? A Preliminary Analysis,” University of
Arkansas, November 2005
- 24 -
by 26 percent at stores using a fully RFID-generated list. Although the control stores also
experienced an improvement in the average weekly out-of-stock levels during the 29-
week test period, the test stores using a fully RFID-generated list showed improvements
of approximately 16%.
The increase in revenue from reduced stock-outs through the use of RFID is estimated at
$11.04 billion. The corresponding free cash flow savings is estimated at $1.08 billion.
4.1.6 Decrease in Lost Sales due to Shipment Errors
It is estimated that in 2005, U.S. consumers made 90 million returns of merchandise
bought over the Internet, representing nearly $6 billion worth of goods. Several retail
studies and surveys show that defective, damaged, and/ or incorrect merchandise, shipped
to consumers, accounts for a significant percent of customer returns. For example,
Daugherty, Autry and Ellinger's survey of catalog retailers selling electronic products
found that that the retailer was responsible for shipment errors that accounted for more
than 40% of customer returns. Similarly, based on inputs from the Annual Retail Trade
survey by the U.S. Census, estimates mail-order returns are pegged at $8.03 billion.
Through these calculations, we assume that order processing and shipping errors do not
occur in in-store sales, and are relevant only for online & mail-order sales.
However, not all customer returns are representative of lost sales. A study on customer
returns by Harris Interactive concluded that 33% of consumers were likely to want to
exchange merchandise, 24% will likely ask for a refund, and 40% were equally likely to
ask for either. Using these estimates, lost sales in the retail industry, on account of
shipment errors, is given as $2.47 billion.
RFID has the potential to eliminate shipment errors and consequently, eliminate lost sales
due to such errors. As store personnel process and ship a particular customer order, an
RFID reader, integrated with the relevant enterprise systems, will discern what items
constitute the shipment, compare it with the customer order, and will alert the store
personnel if a wrong item has been processed, extra items have been processed or items
- 25 -
are missing. Similar alerts can be set up at various points in the order process to minimize
shipment errors and consequent lost sales.
The increase in revenue from fewer shipment errors through the use of RFID is estimated
at $2.47 billion. The corresponding free cash flow savings is estimated at $197.51
million.
4.1.7 Faster Time-to-Market for New Products
A study by Deloitte Research16 emphasizes that innovation is the primary source of new
revenue growth amongst global manufacturers. As sales of new products represent a
growing portion of total revenue, companies are increasingly shortening the time to
market for new products. The implications of faster time-to-market cannot be ignored: by
2010, products representing more than 70% of today’s sales will be obsolete on average.
Further, the study found that the average time-to-market in 2004 was 15.5 months and
new product revenue (NPR) was 29% of total sales. Projected time to market in 2007 is
12.8 months and NPR is 34% of sales. This suggests that a reduction in time to market of
17% increases NPR by 5%.
RFID enables faster product launches by providing real time end-to-end visibility in the
retailer network and actionable information on various checkpoints along the launch
continuum. This helps firms achieve product availability, effectively coordinate
marketing plans, and effectively manage repeat demand, even when SKU offtake is
different from plans across stores and channels. Visibility into supply chain operations
enables faster time-to-market, thereby, engendering important competitive advantage.
Gillette Speeds Product Launch with RFID17
Gillette’s Fusion razor was completely EPC-supported at the time of its launch. All cases
and pallets of razors, shipped to the 400 RFID-enabled retail locations involved in the
pilot, were RFID tagged. The company also placed tags on the Fusion promotional
16 Koudal, P., “Mastering Innovation: Exploiting Ideas for Profitable Growth,” Deloitte Research Global Manufacturing
Study, 2005 17 Catherine O’Connor, Mary, “Gillette Fuses RFID with Product Launch,” RFID Journal, March 27, 2006.
- 26 -
displays that it sent to retailers. The tagged goods provided added visibility, beginning at
the distribution centers and ending at the retail box crushing machines, allowing Gillette
to confirm that all contents had been placed on shelves. Alerts were generated and
communicated to store managers where no read events were recorded. The company
noted that the use of RFID enabled it to get the Fusion razors onto shelves 90% faster
than normal. To illustrate, the process of getting a product onto shelves after it was sent
from the firm’s distribution center typically took 14 days for a new product launch.
However, because the cases of the Fusion product were EPC enabled, Gillette could get
the products onto the shelves in 3 days.
The increase in revenue from faster time-to-market through the use of RFID is estimated
at $39.15 billion. The corresponding free cash flow savings is estimated at $3.13 billion.
4.1.8 Ubiquitous Access across Multiple Channels
Customer expectations and competitive forces are increasingly requiring retailers to
support customer service operations through several delivery channels. The treatment of
each delivery channel as a separate silo of information precludes retailers from leveraging
information across the channels and also renders it difficult to provide a consistent
customer service experience. Despite the significant benefits of channel integration, few
retailers are able to provide customers ubiquitous access across multiple channels. For
example, in an e-tailing group survey, nearly half (44 percent) of evaluated stores
offering the "shop online/return in-store" function required a manager to override the
system to complete the process. There were compatibility issues that prevented easy
returns, such as Internet invoices that lacked tax, credit card and order number
information. Similarly, in a LakeWest Group survey, only 5% of the respondents
provided access to store inventory through the store's POS system. 80.3% of e-tailers
have a complementary offline presence and aim for more synergy between channels. Lost
sales due to lack of channel integration are estimated at up to 4% of revenues.
RFID offers an important alternative to expensive integration programs that communicate
between disparate channels. The latter rarely operate in real time, resulting in delays in
- 27 -
synchronizing information, and add costly overhead, since the integration is often
executed and maintained independently of the customer service applications for each
channel. The real-time visibility provided by RFID across channels for a specific product
enables efficient ubiquitous access across multiple channels. This includes access to
product information across channels, enhanced communication, sale coordination, and
more effective returns management.
The increase in revenue from ubiquitous access across multiple channels through the use
of RFID is estimated at $2.28 billion. The corresponding free cash flow savings is
estimated at $182.44 million.
4.2 The Retail Consumer’s Point of View
The abovementioned supply chain efficiencies generated by RFID also help to provide
customers with better information and serve them more efficiently. They significantly
diminish aspects of the shopping experience that result in dissatisfaction, yielding
satisfied customers and better profitability.
4.2.1 Enhanced Shopping Experience
The issues which consumers face during shopping are well known – price inaccuracy,
inefficient checkouts, product unavailability, etc. RFID optimizes retail operations to
address these inefficiencies and provide a superior consumer experience. RFID-enabled
applications such as context- and location-aware smart shopping assistants (SSA) may
provide timely and relevant product information to consumers, including pricing,
availability, customized promotions and location, which will significantly reduce the
costs and time involved in obtaining products. By using RFID, employees too can
identify the exact location of any retail item at any time, enabling customer requests to be
handled quickly and across channels. RFID also allows for self-checkouts that result in
shorter wait times for customers. All of these contribute to efficient shopping outcomes
and processes, and a superior overall shopping experience.
- 28 -
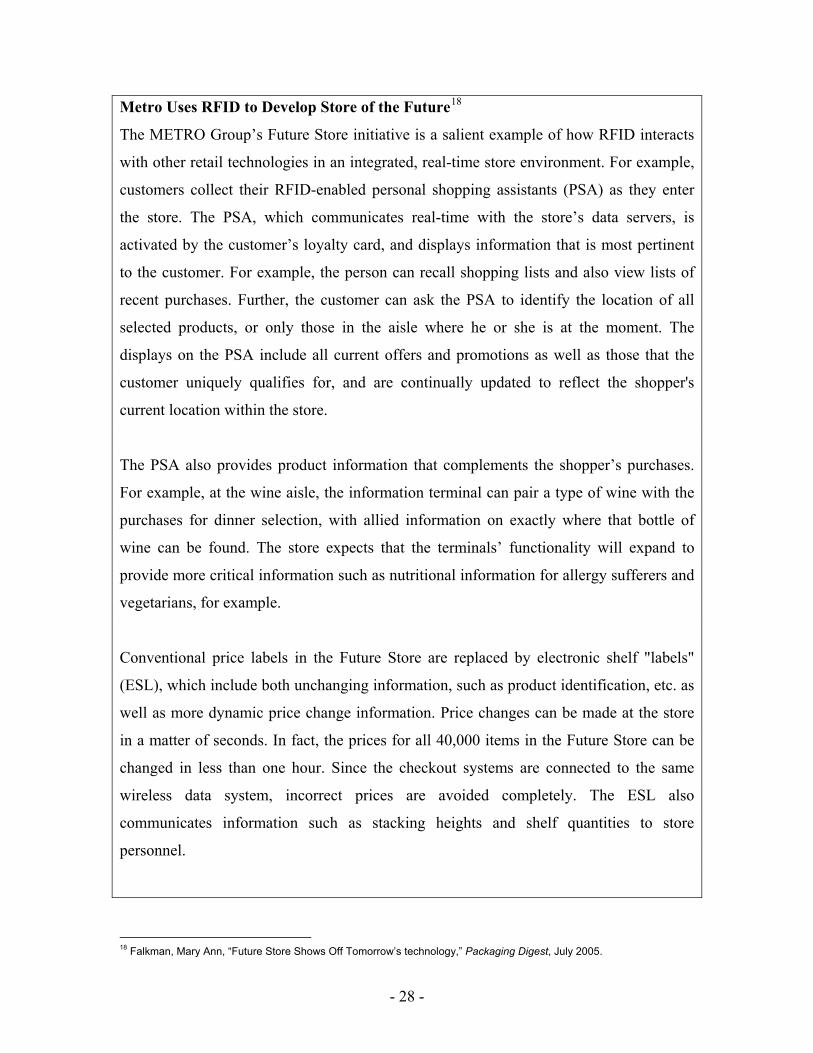
Metro Uses RFID to Develop Store of the Future18
The METRO Group’s Future Store initiative is a salient example of how RFID interacts
with other retail technologies in an integrated, real-time store environment. For example,
customers collect their RFID-enabled personal shopping assistants (PSA) as they enter
the store. The PSA, which communicates real-time with the store’s data servers, is
activated by the customer’s loyalty card, and displays information that is most pertinent
to the customer. For example, the person can recall shopping lists and also view lists of
recent purchases. Further, the customer can ask the PSA to identify the location of all
selected products, or only those in the aisle where he or she is at the moment. The
displays on the PSA include all current offers and promotions as well as those that the
customer uniquely qualifies for, and are continually updated to reflect the shopper's
current location within the store.
The PSA also provides product information that complements the shopper’s purchases.
For example, at the wine aisle, the information terminal can pair a type of wine with the
purchases for dinner selection, with allied information on exactly where that bottle of
wine can be found. The store expects that the terminals’ functionality will expand to
provide more critical information such as nutritional information for allergy sufferers and
vegetarians, for example.
Conventional price labels in the Future Store are replaced by electronic shelf "labels"
(ESL), which include both unchanging information, such as product identification, etc. as
well as more dynamic price change information. Price changes can be made at the store
in a matter of seconds. In fact, the prices for all 40,000 items in the Future Store can be
changed in less than one hour. Since the checkout systems are connected to the same
wireless data system, incorrect prices are avoided completely. The ESL also
communicates information such as stacking heights and shelf quantities to store
personnel.
18 Falkman, Mary Ann, “Future Store Shows Off Tomorrow’s technology,” Packaging Digest, July 2005.
- 29 -
At checkout, the shopper has three options. The customer can do a conventional checkout
where the cashier scans each item on the conveyor. Or, the customer can scan the items
into the PSA and then just hand the PSA to the cashier. Finally, the shopper can do a self-
checkout, where he scans each item and places it directly into an open plastic bag, which
is sitting on a scale. If the weight of the item added to the bag does not match what was
scanned, a store attendant is notified that there is a problem.
The Future Store has received positive feedback from customers and yielded a 20 percent
increase in METRO’s customers. The company has since decided to roll out the self-
checkout in 50 of its stores as well as the Intelligent Scales, and has plans to set up
another Future Store near its headquarters in Germany.
Customers’ willingness to pay for an enhanced shopping experience that accrues from
RFID is estimated at $29.05 billion.
4.2.2 Personalization of High-Value Items
It is argued that compared to conventional standard products, a customized product19
"might render the following benefits: (1) First, the output might be beneficial as self-
designed products offer a much closer fit between individual needs and product
characteristics. In addition to this mere functional benefit, extra value might also stem
from (2) the perceived uniqueness of the self-designed product. Designing one's own
products might, however, also more generally change the way in which people consume
products. As the customer takes on the role of an active co-designer, there may also be
two general do-it-yourself effects: (3) First, the process of designing per se is likely to
allow the customer to meet hedonic or experiential needs. (4) As the customers
themselves are the designers, they will also be likely to value the output more highly, as
they will be proud of having created something on their own (instead of traditionally
buying something created by somebody else) – which might be referred to as the 'pride-
19 Schreier, Martin, "The value increment of mass-customized products: An empirical assessment and conceptual analysis
of its explanation," Journal of Consumer Behavior, forthcoming
- 30 -
of-authorship' effect". Therefore, the average willingness to pay (WTP) for customers
designing their own products is greater than 100%.
RFID has the potential to influence customization in high-value luxury items and
significantly enhance the shopping experience in this case. The typical luxury consumer20
spent $50,640 in 2004 buying luxuries, estimating the number of consumers of luxury
goods at nearly 18 million. Assuming spend on luxury experiences was $12,000, the
average amount spent by the luxury consumer on personal, home, and automobiles was
$38,640.
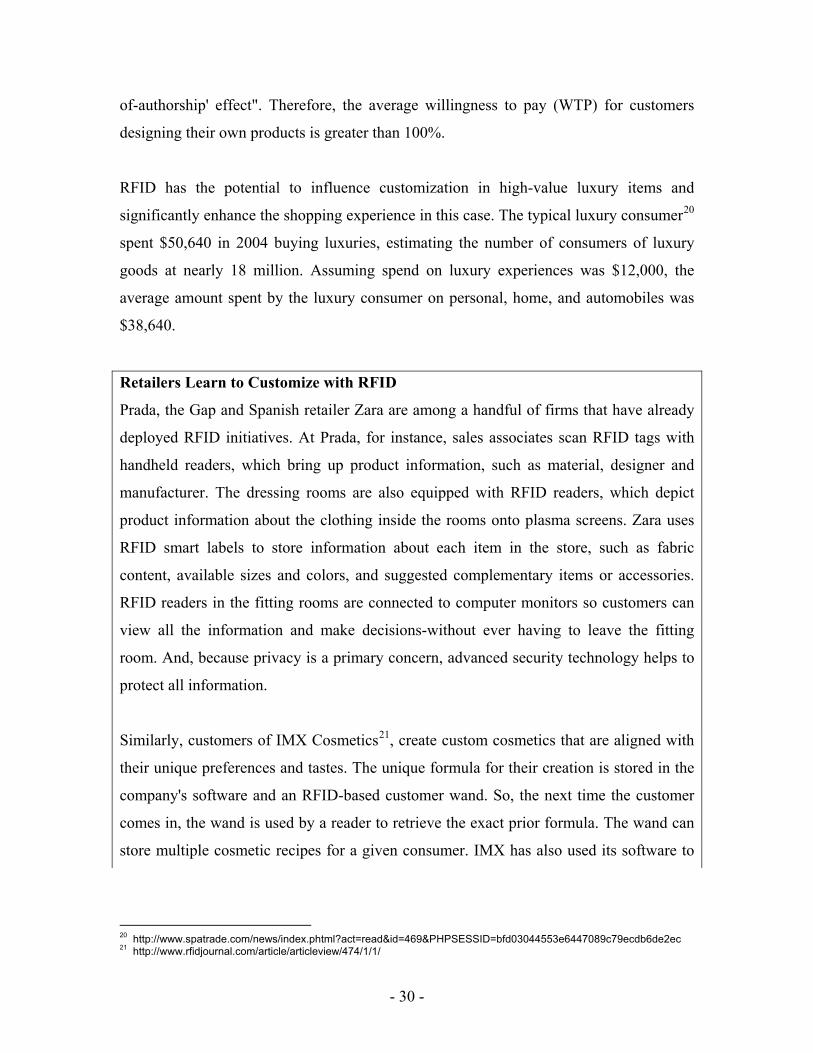
Retailers Learn to Customize with RFID
Prada, the Gap and Spanish retailer Zara are among a handful of firms that have already
deployed RFID initiatives. At Prada, for instance, sales associates scan RFID tags with
handheld readers, which bring up product information, such as material, designer and
manufacturer. The dressing rooms are also equipped with RFID readers, which depict
product information about the clothing inside the rooms onto plasma screens. Zara uses
RFID smart labels to store information about each item in the store, such as fabric
content, available sizes and colors, and suggested complementary items or accessories.
RFID readers in the fitting rooms are connected to computer monitors so customers can
view all the information and make decisions-without ever having to leave the fitting
room. And, because privacy is a primary concern, advanced security technology helps to
protect all information.
Similarly, customers of IMX Cosmetics21, create custom cosmetics that are aligned with
their unique preferences and tastes. The unique formula for their creation is stored in the
company's software and an RFID-based customer wand. So, the next time the customer
comes in, the wand is used by a reader to retrieve the exact prior formula. The wand can
store multiple cosmetic recipes for a given consumer. IMX has also used its software to
20 http://www.spatrade.com/news/index.phtml?act=read&id=469&PHPSESSID=bfd03044553e6447089c79ecdb6de2ec 21 http://www.rfidjournal.com/article/articleview/474/1/1/
- 31 -
identify frequently used mixes to add to its product line and cater to different
demographics.
Customers’ willingness to pay for a personalized shopping experience that accrues from
RFID is estimated at $102.24 billion.
5. Results for Healthcare The healthcare supply chain comprises pharmaceutical manufacturers, healthcare
distributors and hospitals. RFID has the potential to generate process improvements in
each of these sectors that address critical vulnerabilities in the supply chain and improve
the ultimate quality of healthcare service provided to individuals and communities. We
discuss below the nature and potential value of efficiency benefits that accrue to each of
pharmaceutical manufacturers, healthcare distributors and hospitals from the use of RFID
in the supply chain. We also discuss related consumer benefits that accrue from the use of
RFID.
5.1 Efficiency Gains in Pharmaceutical Firms
5.1.1 Reduction in Counterfeit, Shrinkage and Parallel Trade
Drug counterfeiting, theft and parallel trade are important problems that confront many
pharmaceutical manufacturers. Counterfeit drugs may be misbranded, adulterated,
contaminated or expired. Others may be generic copies of pharmaceutical brands that the
Food and Drug Administration (FDA) has not approved for use in the United States. The
World Health Organization (WHO)22 estimates that between 5 to 8% of global
pharmaceuticals are counterfeit with the figures being significantly higher for some
countries at between 25 to 40%. This suggests that counterfeit drugs could represent from
$7 billion to $26 billion of the global drug market. The Healthcare Distribution
Management Association (HDMA) estimates that the pharmaceutical industry loses $2
billion each year due to counterfeit drugs23. Further, business norms stipulate that
manufacturers bear the cost of replacing counterfeit products, resulting in significant
22 Fact Sheet. Business Action to Stop Counterfeiting and Piracy. International Chamber of Commerce, Paris, February
2004, Available at: http://www.uscib.org/docs/BASCAP_factsheet.pdf 23 “Pharmaceutical Product Tampering News Media Factsheet,” HDMA, April 2004.
- 32 -
losses, including that of shareholder value and brand identity. For example, research from
the University of Wisconsin suggests that shareholder value lost after a drug recall is
approximately 12 times the estimated total cost brought about through litigation, recall, or
replacement, suggesting that the impact on shareholder value could be as high as 1 – 2%.
Similarly, theft and parallel trade also represent important concerns in the pharmaceutical
industry, with the issues having a disproportionately greater impact on European
manufacturers than they do on others in the channel. For example, IMS estimates suggest
that nearly 8% of market sales in the European market result from parallel trade and
reimportation.
The FDA’s24 support for RFID as an innovative “track and trace” technology that can
greatly enhance the security of the drug supply has generated interest in RFID
implementation initiatives in the pharmaceutical industry. The visibility provided by
item-level tags through the supply chain allows for the reliable authentication, tracking
and tracing of pharmaceutical products, which help to effectively combat issues of
counterfeiting, shrink and parallel trade to provide a safer and more accountable supply
chain. In particular, RFID application developers are using RFID to create electronic
pedigrees for pharmaceutical drugs. An electronic pedigree is a secure record
documenting that a drug was manufactured and distributed under safe and secure
conditions. By affixing a tag with a unique EPC to pharmaceutical products at the
manufacturing plant, and using RFID readers to track them to the wholesaler and
eventually the retailer or pharmacy, the manufacturer, distributor and pharmacy can
ensure that the product is genuine.
A Capgemini report25 on the opportunities for RFID in the pharmaceutical industry notes
that the loss due to the gray market is on average 1.83% of revenue. This assumes
counterfeit and shrinkage (due to theft, damage, etc. and expiry of perishable items) loss
is 100% of profit, and parallel trade and reimportation loss is 50% of profit. This is a
24 “Combating Counterfeit Drugs,” FDA, Rockville MD, February 2004. 25 Economic Benefits of EPC in Pharmaceuticals, Capgemini Report, 2004
- 33 -
conservative estimate as it does not include damage to patient health arising from a
counterfeit product, measured by litigation costs arising from such administration.
The lost revenue due to counterfeit, shrinkage and parallel trade is estimated at $4.31
billion. The corresponding free cash flow savings is estimated at $1.85 billion. The allied
brand protection benefits are estimated at $6.32 billion.
5.1.2 Efficient Product Recall
Product recalls in the pharmaceutical industry for both prescription and non-prescription
drugs, whether due to counterfeit or contamination, number in the hundreds each year.
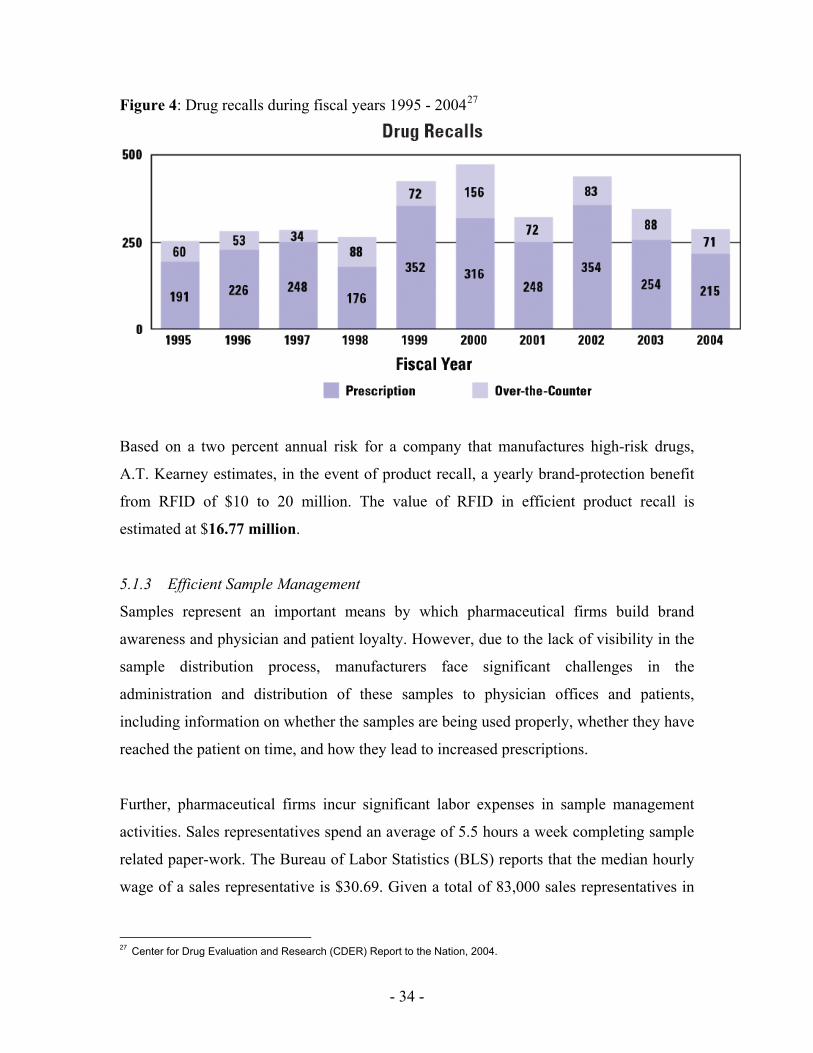
The number of drug recalls during fiscal years 1995 – 2004 is shown in Figure 4. These
recalls represent millions in administrative costs and lost sales. More important, product
recalls are also accompanied by important brand erosion and loss in shareholder value.
For example, in the 1982 Tylenol tampering incident, the poisoning of the first victims
resulted in consumers avoiding the product. Consequently, the market share for the brand
declined from 37% to 8% at the end of 198226.
Item-level RFID tags allow for targeted product recall, resulting in relatively less
resource wastage. A.T. Kearney estimates the savings range to be from $50,000 to
$100,000 per year per $10 billion in revenue. This estimate is based on manufacturers
having 50 to 100 percent of tagging penetration at the item or unit level and also includes
time saved on administering recalls and returns.
26 ICFAI Center for Management Research, The Johnson & Johnson Tylenol Controversies, Business Ethics Case
Studies.
- 34 -
Figure 4: Drug recalls during fiscal years 1995 - 200427
Based on a two percent annual risk for a company that manufactures high-risk drugs,
A.T. Kearney estimates, in the event of product recall, a yearly brand-protection benefit
from RFID of $10 to 20 million. The value of RFID in efficient product recall is
estimated at $16.77 million.
5.1.3 Efficient Sample Management
Samples represent an important means by which pharmaceutical firms build brand
awareness and physician and patient loyalty. However, due to the lack of visibility in the
sample distribution process, manufacturers face significant challenges in the
administration and distribution of these samples to physician offices and patients,
including information on whether the samples are being used properly, whether they have
reached the patient on time, and how they lead to increased prescriptions.
Further, pharmaceutical firms incur significant labor expenses in sample management
activities. Sales representatives spend an average of 5.5 hours a week completing sample
related paper-work. The Bureau of Labor Statistics (BLS) reports that the median hourly
wage of a sales representative is $30.69. Given a total of 83,000 sales representatives in
27 Center for Drug Evaluation and Research (CDER) Report to the Nation, 2004.
- 35 -
the pharmaceutical industry, the opportunity cost of such sample management is
estimated at $728.52 million.
RFID readers can report the content of sample closets at regular intervals to
pharmaceutical data centers so that the company has real time information on how much
and how often specific samples are used. Such information allows for efficient sample
management in several ways. First, it increases representative efficiency and
effectiveness. Representatives can use RFID readers to access critical product
information such as expiry and obsolescence so that the right samples are delivered at the
right time to the right location. Second, RFID tagged samples provide vital marketing
information on flow rates and usage to representatives and manufacturers that they can
act on. In conjunction with other information such prescription-fill statistics,
manufacturers can estimate conversion rates and develop pertinent sales and marketing
programs. Finally, patients benefit from better operational and marketing decisions
through reduced drug costs and enhanced product availability.
The potential benefit from the use of RFID in sample management and distribution is
estimated at $12.73 billion.
5.1.4 Enhanced Inventory Turns
In the pharmaceutical industry, product unavailability can lead to significantly adverse
consequences. The important relationship between inventory and quality customer
service leads manufacturers to main relatively high levels of inventory at significant
costs. However, the need to meet high levels of service has resulted in significant
overstocking of inventory in the pharmaceutical supply chain. Annual inventory turns in
the pharmaceutical industry average 1-2. This suggests that average annual inventory
levels in the pharmaceutical industry are an estimated $156.93 billion. Other studies
suggest that the retail and pharmaceutical markets must absorb more than $2 billion in
product returns due to overstocking and expirations. However, in the face of high
competitive pressures, pharmaceutical manufacturers are looking to reduce wasteful
resource expend in their supply chains while maintaining high levels of service.
- 36 -
The visibility of inventory provided by RFID at various points in the supply chain allows
for efficient tracking and movement of goods within the channel. Real-time analysis of
track-and-trace information will facilitate removal of distribution bottlenecks and
improve the efficiency of business processes to forecast inventory needs more accurately
and reduce ensuing inventory costs.
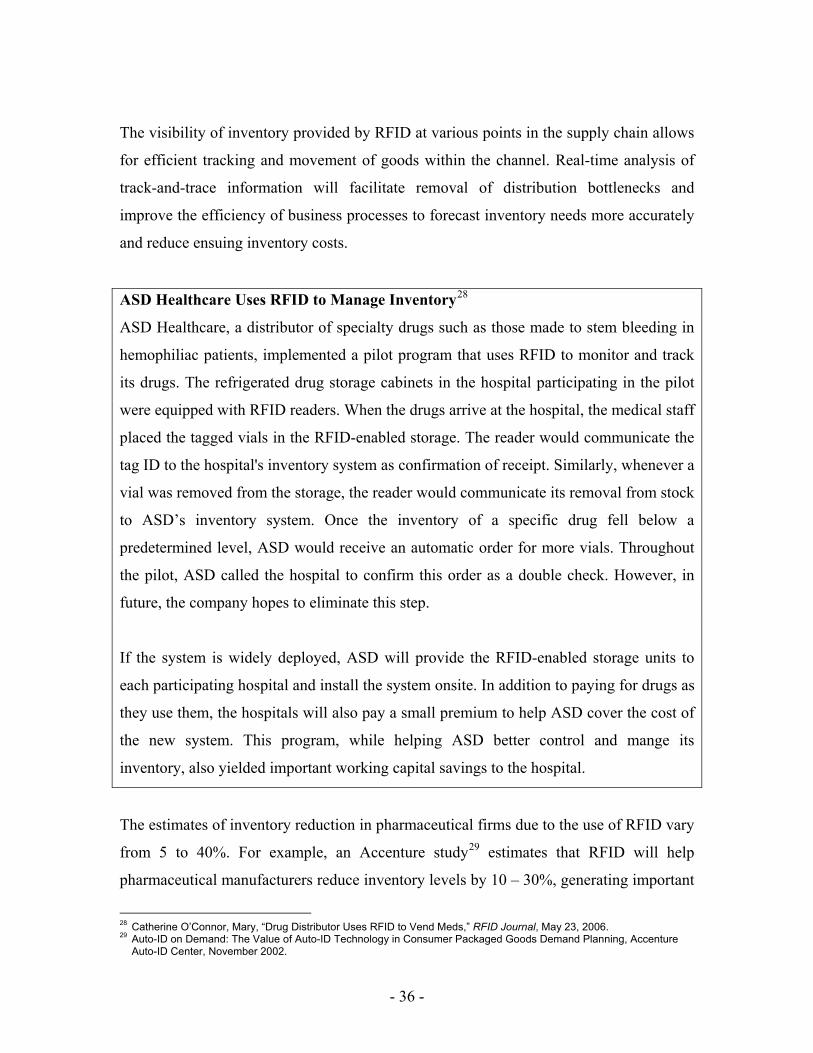
ASD Healthcare Uses RFID to Manage Inventory28
ASD Healthcare, a distributor of specialty drugs such as those made to stem bleeding in
hemophiliac patients, implemented a pilot program that uses RFID to monitor and track
its drugs. The refrigerated drug storage cabinets in the hospital participating in the pilot
were equipped with RFID readers. When the drugs arrive at the hospital, the medical staff
placed the tagged vials in the RFID-enabled storage. The reader would communicate the
tag ID to the hospital's inventory system as confirmation of receipt. Similarly, whenever a
vial was removed from the storage, the reader would communicate its removal from stock
to ASD’s inventory system. Once the inventory of a specific drug fell below a
predetermined level, ASD would receive an automatic order for more vials. Throughout
the pilot, ASD called the hospital to confirm this order as a double check. However, in
future, the company hopes to eliminate this step.
If the system is widely deployed, ASD will provide the RFID-enabled storage units to
each participating hospital and install the system onsite. In addition to paying for drugs as
they use them, the hospitals will also pay a small premium to help ASD cover the cost of
the new system. This program, while helping ASD better control and mange its
inventory, also yielded important working capital savings to the hospital.
The estimates of inventory reduction in pharmaceutical firms due to the use of RFID vary
from 5 to 40%. For example, an Accenture study29 estimates that RFID will help
pharmaceutical manufacturers reduce inventory levels by 10 – 30%, generating important
28 Catherine O’Connor, Mary, “Drug Distributor Uses RFID to Vend Meds,” RFID Journal, May 23, 2006. 29 Auto-ID on Demand: The Value of Auto-ID Technology in Consumer Packaged Goods Demand Planning, Accenture
Auto-ID Center, November 2002.
- 37 -
working capital savings and operational efficiencies. Greater inventory accuracy and
velocity are also manifest in reduced stock-outs and improved product availability. Total
losses due to pharmaceutical stock-outs are estimated at $3.41 billion, of which $545.44
million may be eliminated through the use of RFID.
The value of inventory cost savings that accrue to pharmaceutical manufacturers from the
use of RFID is estimated at $15.78 billion.
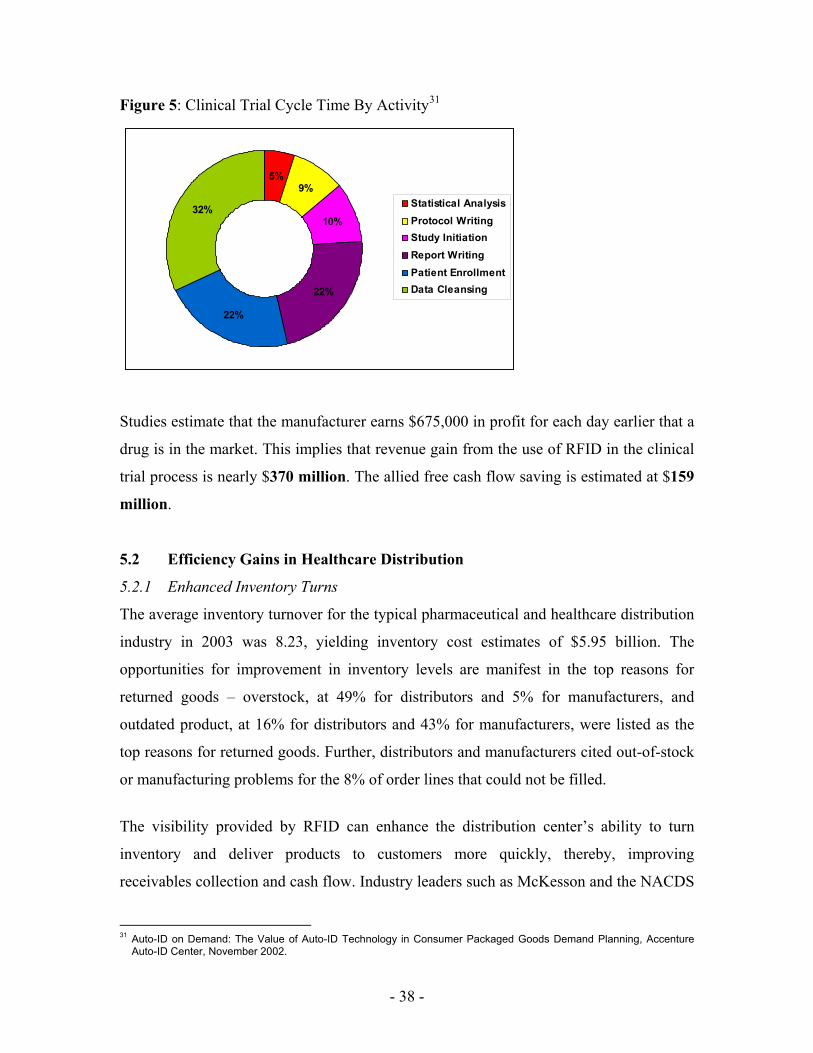
5.1.5 Shorter Clinical Trials and Faster Time-to-Market
A Capgemini study30 finds that it costs nearly $800 million over a period of more than 12
years to bring a drug to market. Of this time, the clinical development phase alone takes
over 6 years. As shown in Figure 5, data quality assurance processes currently consume
more than 32% of the clinical trial process.
RFID offers important benefits in the clinical trial process. The drugs administered in the
trial can be tracked across the supply chain, allowing for alerts to be generated if delivery
of doses is delayed, and correcting the situation before related data inaccuracies are
introduced into the system. Further, item-level tagging allows for positive identification
and verification that the correct dose is being delivered to the correct patient. The
Capgemini report notes that the ability of RFID to reduce data entry errors and stock-outs
during clinical trials as well as positively identify and verify trial drug dosages
administered to patients helps to reduce the duration of the clinical trial process by up to
5%.
30 Colin J. Towner, “Economic Benefits of EPC in Pharmaceuticals,” Capgemini Life Sciences, 2004.
- 38 -
Figure 5: Clinical Trial Cycle Time By Activity31
5%9%
10%
22%
22%
32% Statistical AnalysisProtocol WritingStudy InitiationReport WritingPatient EnrollmentData Cleansing
Studies estimate that the manufacturer earns $675,000 in profit for each day earlier that a
drug is in the market. This implies that revenue gain from the use of RFID in the clinical
trial process is nearly $370 million. The allied free cash flow saving is estimated at $159
million.
5.2 Efficiency Gains in Healthcare Distribution
5.2.1 Enhanced Inventory Turns
The average inventory turnover for the typical pharmaceutical and healthcare distribution
industry in 2003 was 8.23, yielding inventory cost estimates of $5.95 billion. The
opportunities for improvement in inventory levels are manifest in the top reasons for
returned goods – overstock, at 49% for distributors and 5% for manufacturers, and
outdated product, at 16% for distributors and 43% for manufacturers, were listed as the
top reasons for returned goods. Further, distributors and manufacturers cited out-of-stock
or manufacturing problems for the 8% of order lines that could not be filled.
The visibility provided by RFID can enhance the distribution center’s ability to turn
inventory and deliver products to customers more quickly, thereby, improving
receivables collection and cash flow. Industry leaders such as McKesson and the NACDS
31 Auto-ID on Demand: The Value of Auto-ID Technology in Consumer Packaged Goods Demand Planning, Accenture
Auto-ID Center, November 2002.
- 39 -
have expressed that RFID will facilitate knowledge of how much inventory is owned and
where it is located, thereby, significantly reducing the incidence of lost and stolen
shipments, inventory levels and allied costs.
The value of inventory cost savings to healthcare distribution centers that accrue from the
use of RFID is estimated at $1.78 billion.
5.2.2 Reduction in Labor Costs
The Healthcare Distribution Management Association (HDMA) estimates that the
average compensation per employee for a typical distribution center was $47,220
yielding total labor cost estimate of $1.88 billion. RFID has the potential to reduce labor
costs in the distribution center by more than 30%. Its impact, as in the case of retail
distribution, will be significant in various categories of warehouse labor, including
receiving, check-in, cycle counting and order filling.
The reduction in labor costs at the distribution center, due to RFID, is estimated at
$563.54 million.
5.3 Efficiency Gains in Hospitals
5.3.1 Better Equipment Tracking and Increased Asset Utilization
The problems with managing and tracking equipment and assets, ranging from infusion
pumps to surgical equipment to wheel chairs, plague hospitals and healthcare facilities
worldwide. Large hospitals lose hundreds of thousands of dollars worth of equipment
each year that costs them annually as much as $4,000 per bed. Patient care personnel
often expend important patient time searching for equipment that they need while
maintenance staff lose productive hours searching for specific items that need
maintenance. Further, the inability to track equipments and assets results in poor asset
utilization rates as well as high replacement and inventory costs. A Government
Accountability Office study32 found that hospitals purchase 20% - 50% more equipment
than they need because of loss, misplacement or theft.
32 Information available at: http://www.directionsmag.com/press.releases/index.php?duty=Show&id=14312&trv=1
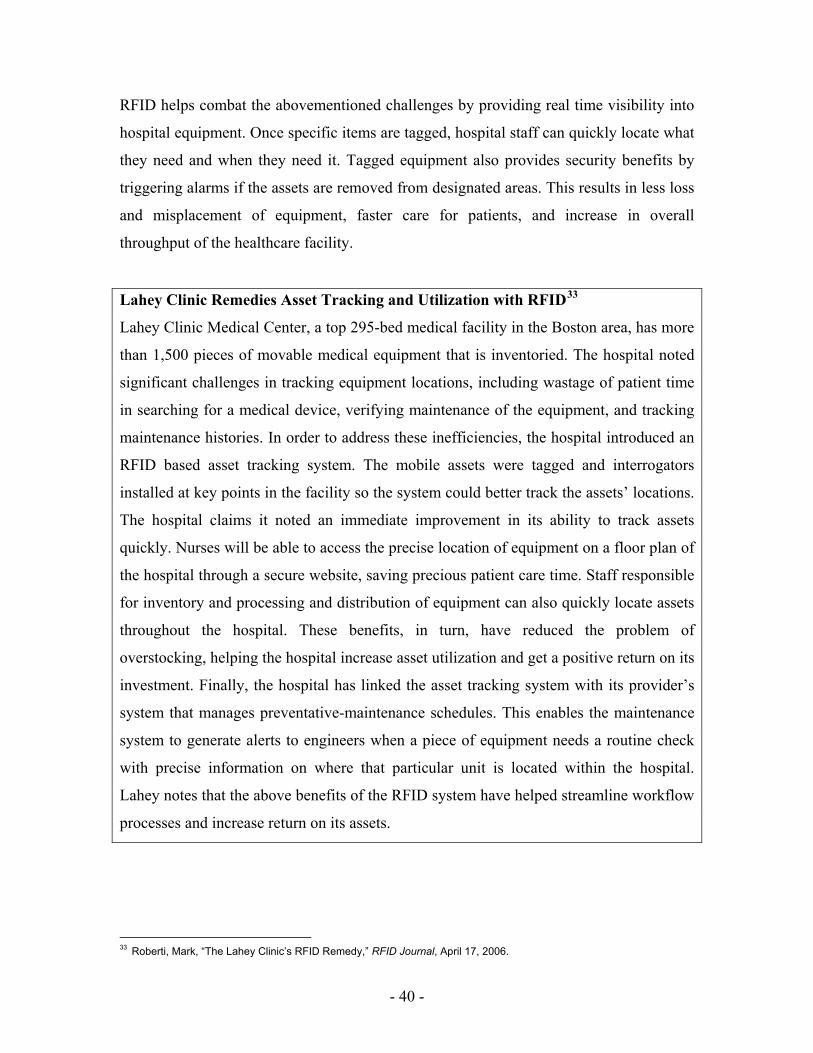
- 40 -
RFID helps combat the abovementioned challenges by providing real time visibility into
hospital equipment. Once specific items are tagged, hospital staff can quickly locate what
they need and when they need it. Tagged equipment also provides security benefits by
triggering alarms if the assets are removed from designated areas. This results in less loss
and misplacement of equipment, faster care for patients, and increase in overall
throughput of the healthcare facility.
Lahey Clinic Remedies Asset Tracking and Utilization with RFID33
Lahey Clinic Medical Center, a top 295-bed medical facility in the Boston area, has more
than 1,500 pieces of movable medical equipment that is inventoried. The hospital noted
significant challenges in tracking equipment locations, including wastage of patient time
in searching for a medical device, verifying maintenance of the equipment, and tracking
maintenance histories. In order to address these inefficiencies, the hospital introduced an
RFID based asset tracking system. The mobile assets were tagged and interrogators
installed at key points in the facility so the system could better track the assets’ locations.
The hospital claims it noted an immediate improvement in its ability to track assets
quickly. Nurses will be able to access the precise location of equipment on a floor plan of
the hospital through a secure website, saving precious patient care time. Staff responsible
for inventory and processing and distribution of equipment can also quickly locate assets
throughout the hospital. These benefits, in turn, have reduced the problem of
overstocking, helping the hospital increase asset utilization and get a positive return on its
investment. Finally, the hospital has linked the asset tracking system with its provider’s
system that manages preventative-maintenance schedules. This enables the maintenance
system to generate alerts to engineers when a piece of equipment needs a routine check
with precise information on where that particular unit is located within the hospital.
Lahey notes that the above benefits of the RFID system have helped streamline workflow
processes and increase return on its assets.
33 Roberti, Mark, “The Lahey Clinic’s RFID Remedy,” RFID Journal, April 17, 2006.
- 41 -
Pilot studies on the use of RFID to track value equipment indicate 50% decrease in lost
equipment. Thus, the benefits of equipment tracking using RFID are estimated at $3.63
billion. The allied benefits from increased asset utilization are estimated at $8.72 billion.
5.3.2 Enhanced Inventory Turns
Improved asset tracking and utilization yield important savings in reduced inventory
costs to hospitals. The total inventory levels in hospitals are estimated at $544.02 billion.
RFID applications will enable hospitals to ensure that they are ordering and receiving the
right amounts of assets and equipment, enhance inventory velocity and turns, and
ultimately reduce inventory levels and carrying costs.
The value of inventory cost savings to hospitals that accrue from the use of RFID is
estimated at $44.88 billion.
5.3.3 Wider Access to Healthcare at Reduced Costs
Administrative and bureaucratic issues often distract healthcare providers from their
relationship with the patient. In recent years, the number of administrators in U.S.
hospitals has grown by over four times and many doctors spend up to 25 hours a week
just filling out forms. Similarly, nurses are too often engaged in locating medical
equipment, retrieving and verifying patient information, and completing routine
administrative tasks. An internal study at Johns Hopkins found that direct patient “touch
time” amounted to only 35% - 40% of nurses’ workloads. These inefficiencies in the
system, in turn, impact the cost and quality of patient care. According to a recent study in
the New England Journal of Medicine, patients in the U.S. receive the care they should
only 55% of the time. For example, routine peak flow measurements are conducted in
only 28% of asthmatic pediatric patients. Only 50% of diabetics receive an annual eye
exam. Administrative costs consume up to 25 cents of every healthcare dollar.
RFID has the potential to automate and streamline workflow processes, thereby providing
patient with wider and faster access to healthcare, while reducing the cost of such
healthcare service. The tagging of assets and patient records will present providers with
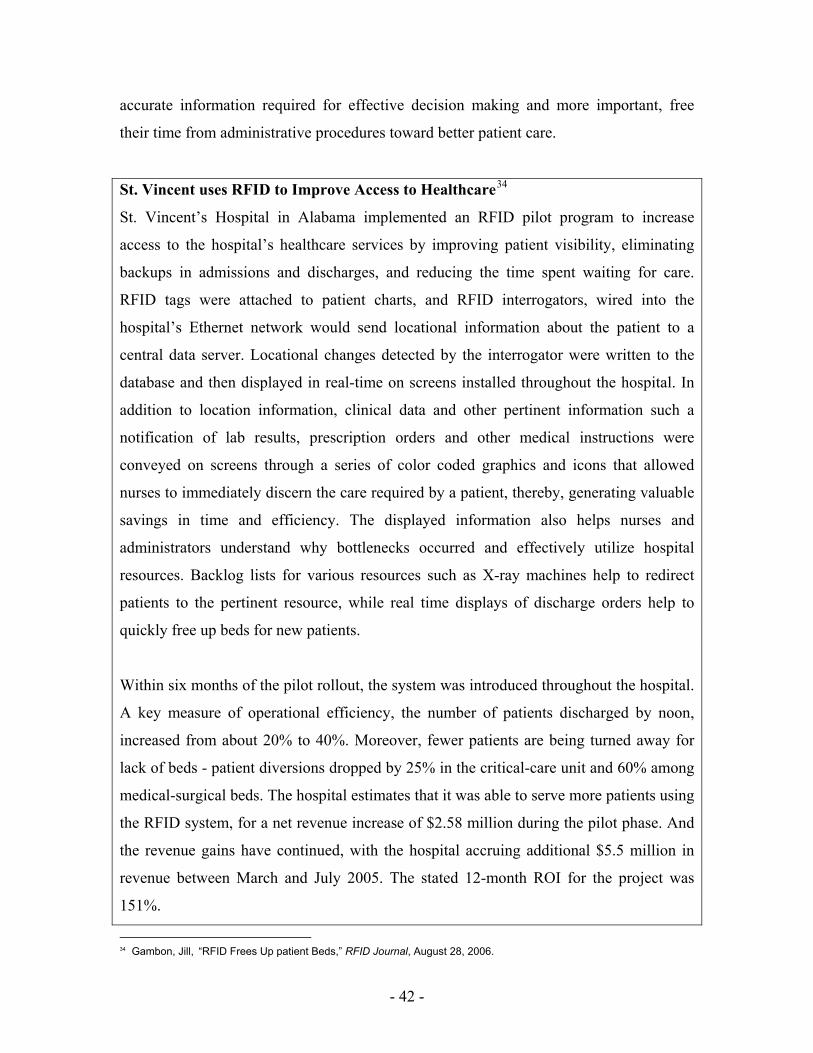
- 42 -
accurate information required for effective decision making and more important, free
their time from administrative procedures toward better patient care.
St. Vincent uses RFID to Improve Access to Healthcare34
St. Vincent’s Hospital in Alabama implemented an RFID pilot program to increase
access to the hospital’s healthcare services by improving patient visibility, eliminating
backups in admissions and discharges, and reducing the time spent waiting for care.
RFID tags were attached to patient charts, and RFID interrogators, wired into the
hospital’s Ethernet network would send locational information about the patient to a
central data server. Locational changes detected by the interrogator were written to the
database and then displayed in real-time on screens installed throughout the hospital. In
addition to location information, clinical data and other pertinent information such a
notification of lab results, prescription orders and other medical instructions were
conveyed on screens through a series of color coded graphics and icons that allowed
nurses to immediately discern the care required by a patient, thereby, generating valuable
savings in time and efficiency. The displayed information also helps nurses and
administrators understand why bottlenecks occurred and effectively utilize hospital
resources. Backlog lists for various resources such as X-ray machines help to redirect
patients to the pertinent resource, while real time displays of discharge orders help to
quickly free up beds for new patients.
Within six months of the pilot rollout, the system was introduced throughout the hospital.
A key measure of operational efficiency, the number of patients discharged by noon,
increased from about 20% to 40%. Moreover, fewer patients are being turned away for
lack of beds - patient diversions dropped by 25% in the critical-care unit and 60% among
medical-surgical beds. The hospital estimates that it was able to serve more patients using
the RFID system, for a net revenue increase of $2.58 million during the pilot phase. And
the revenue gains have continued, with the hospital accruing additional $5.5 million in
revenue between March and July 2005. The stated 12-month ROI for the project was
151%.
34 Gambon, Jill, “RFID Frees Up patient Beds,” RFID Journal, August 28, 2006.
- 43 -
The automation of administrative processes, in addition to helping the healthcare facility
increase the range of access to healthcare services, also helps reduce important labor
costs such as non-productive percentage of total hours and overtime percentage of
productive hours. A study by the Healthcare Financial Management Association35
estimates that for a typical community hospital, the median value for non-productive
percent of total hours is 12% and that for overtime as a percent of productive hours is 2%.
The corresponding best practices estimates are 10% and 1.8% respectively.
Reduction in the above components of labor costs also helps reduce contract percentage
of productive hours. For a typical community hospital, the median value for contract
agency hours as a percent of productive hours is 1.5% while the corresponding best
practice estimate is 1%. Contract labor is expensive, and reversing the trend may be a
significant opportunity to reduce labor costs. For example, a recent study36 by American
Hospital Directory estimates that nationwide, short term acute care hospitals in the
United States currently spend more than $7.8 billion per year on contract labor. Since
rates paid for contract labor are often twice what staff employees are paid, the study
estimates the opportunity for improvement in staffing costs at approximately $3.9 billion.
The benefits of wider and faster access to healthcare accruing from the use of RFID are
estimated at $15.65 billion. The corresponding free cash flow saving is estimated at $2.5
billion. The reduction in labor costs achieved through the use of RFID is estimated at
$4.72 billion.
5.4 Benefits to the Healthcare Consumer – Improved Quality of Patient Care
RFID helps healthcare providers to combat important issues in healthcare delivery such
as medical errors and non-compliance to significantly improve the overall quality of
patient care.
35 Back to Basics: A Self-Help Approach to Achieving Financial Success, Healthcare Financial Management Association,
Mar 2004. 36 Shoemaker, P. and D.H. Howell, “Trends in the Use of Contract Labor among Hospitals,” American Hospital Directory,
July 2005.
- 44 -
A 1999 Institute of Medicine (IOM) study concludes preventable medical errors in the
US cause between 44,000 and 98,000 people to die annually, exceeding deaths attributed
to motor vehicle wrecks, certain forms of cancer and AIDS. The IOM defines medical
errors as the failure of a planned action to be completed as intended or the use of a wrong
plan to achieve an aim. Common errors include adverse drug events and improper
transfusions, surgical injuries and wrong-site surgery, restraint related injuries or death,
and mistaken patient identities. Beyond the immeasurable cost on human lives,
preventable medical errors exact other significant costs in hospitals nationwide, including
the expense of additional care necessitated by the errors, lost income and household
productivity, and disability. These costs are estimated at between $17 billion to 29 billion
per year.
The tracking and tracing mechanisms provided by RFID help to significantly reduce
medical errors in healthcare. Hospitals are investing in electronic handshakes where an
RFID tag talks to an interrogator electronically and, if the interrogator is not satisfied, it
prevents a procedure taking place or alerts staff. The interrogator also keeps an electronic
record, useful for subsequent investigations including litigation. Examples of this are the
30 million tags fitted so far to AstraZeneca Diprivan syringes used in the operating
theatre. In seven years, there have been no dosage errors thanks to this automated
procedure. Similarly, MBBS of the UK tags surgeon's tools so they can be automatically
monitored going into and coming out of theatre. Innovision of the UK and Colder
Products of the US have RFID handshakes in couplings such as Luer connectors for vital
fluid. These prevent errors and record what was done.
Non-compliance with medication in the US is another important concern37 that causes
125,000 deaths yearly, accounting for 11% of hospital admissions and costing healthcare
payers $100 billion each year. $31.3 billion is spent on nursing home admission due to
non-compliance, and $15 billion is spent on hospital admissions due to noncompliance.
Patient tracking through RFID can virtually eliminate these non-compliance costs. RFID
with sensors on blisterpacks and plastic bottles records how many tablets were taken and
37 Information available at: http://www.medicom.bang-olufsen.com/sw1359.asp
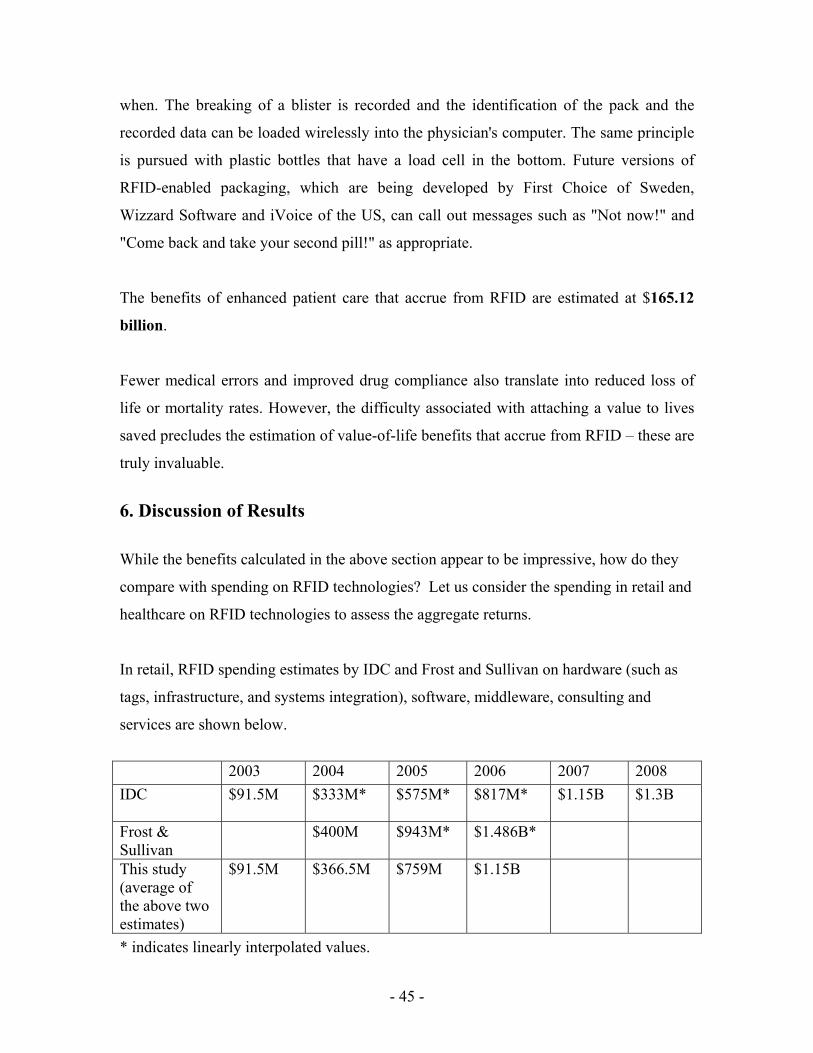
- 45 -
when. The breaking of a blister is recorded and the identification of the pack and the
recorded data can be loaded wirelessly into the physician's computer. The same principle
is pursued with plastic bottles that have a load cell in the bottom. Future versions of
RFID-enabled packaging, which are being developed by First Choice of Sweden,
Wizzard Software and iVoice of the US, can call out messages such as "Not now!" and
"Come back and take your second pill!" as appropriate.
The benefits of enhanced patient care that accrue from RFID are estimated at $165.12
billion.
Fewer medical errors and improved drug compliance also translate into reduced loss of
life or mortality rates. However, the difficulty associated with attaching a value to lives
saved precludes the estimation of value-of-life benefits that accrue from RFID – these are
truly invaluable.
6. Discussion of Results While the benefits calculated in the above section appear to be impressive, how do they
compare with spending on RFID technologies? Let us consider the spending in retail and
healthcare on RFID technologies to assess the aggregate returns.
In retail, RFID spending estimates by IDC and Frost and Sullivan on hardware (such as
tags, infrastructure, and systems integration), software, middleware, consulting and
services are shown below.
2003 2004 2005 2006 2007 2008 IDC $91.5M $333M* $575M*
$817M* $1.15B $1.3B
Frost & Sullivan
$400M $943M* $1.486B*
This study (average of the above two estimates)
$91.5M $366.5M $759M $1.15B
* indicates linearly interpolated values.
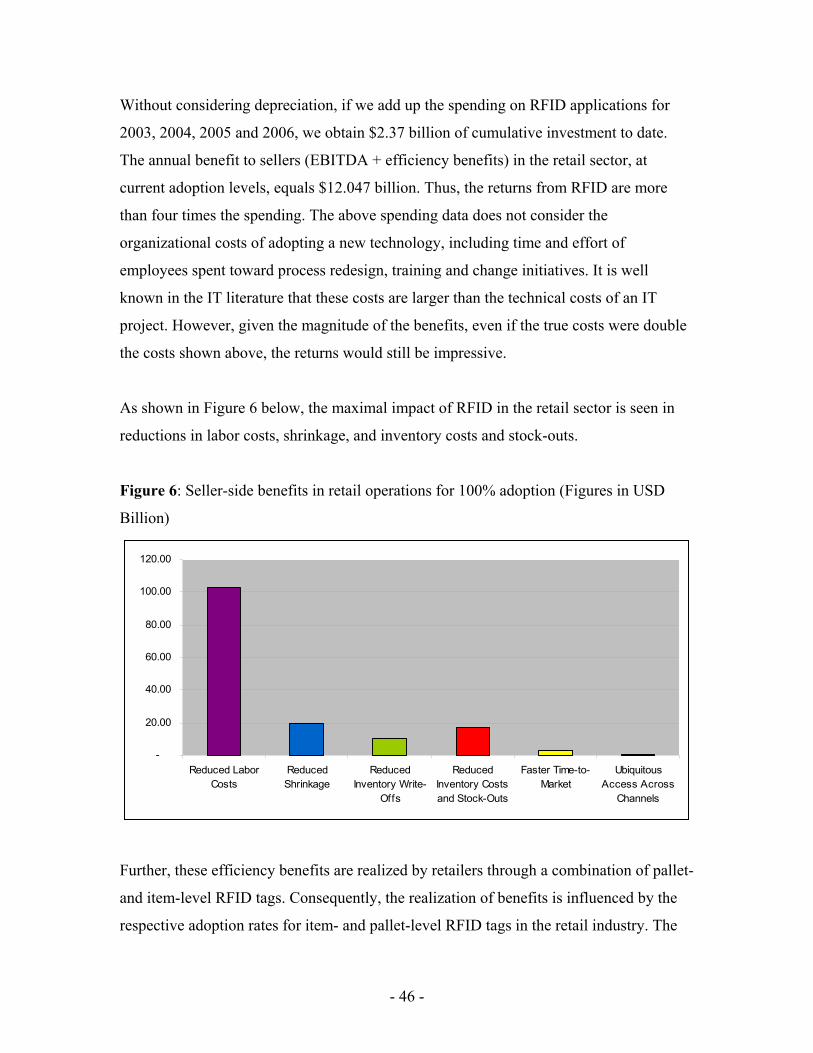
- 46 -
Without considering depreciation, if we add up the spending on RFID applications for
2003, 2004, 2005 and 2006, we obtain $2.37 billion of cumulative investment to date.
The annual benefit to sellers (EBITDA + efficiency benefits) in the retail sector, at
current adoption levels, equals $12.047 billion. Thus, the returns from RFID are more
than four times the spending. The above spending data does not consider the
organizational costs of adopting a new technology, including time and effort of
employees spent toward process redesign, training and change initiatives. It is well
known in the IT literature that these costs are larger than the technical costs of an IT
project. However, given the magnitude of the benefits, even if the true costs were double
the costs shown above, the returns would still be impressive.
As shown in Figure 6 below, the maximal impact of RFID in the retail sector is seen in
reductions in labor costs, shrinkage, and inventory costs and stock-outs.
Figure 6: Seller-side benefits in retail operations for 100% adoption (Figures in USD
Billion)
-
20.00
40.00
60.00
80.00
100.00
120.00
Reduced LaborCosts
ReducedShrinkage
ReducedInventory Write-
Offs
ReducedInventory Costsand Stock-Outs
Faster Time-to-Market
UbiquitousAccess Across
Channels
Further, these efficiency benefits are realized by retailers through a combination of pallet-
and item-level RFID tags. Consequently, the realization of benefits is influenced by the
respective adoption rates for item- and pallet-level RFID tags in the retail industry. The
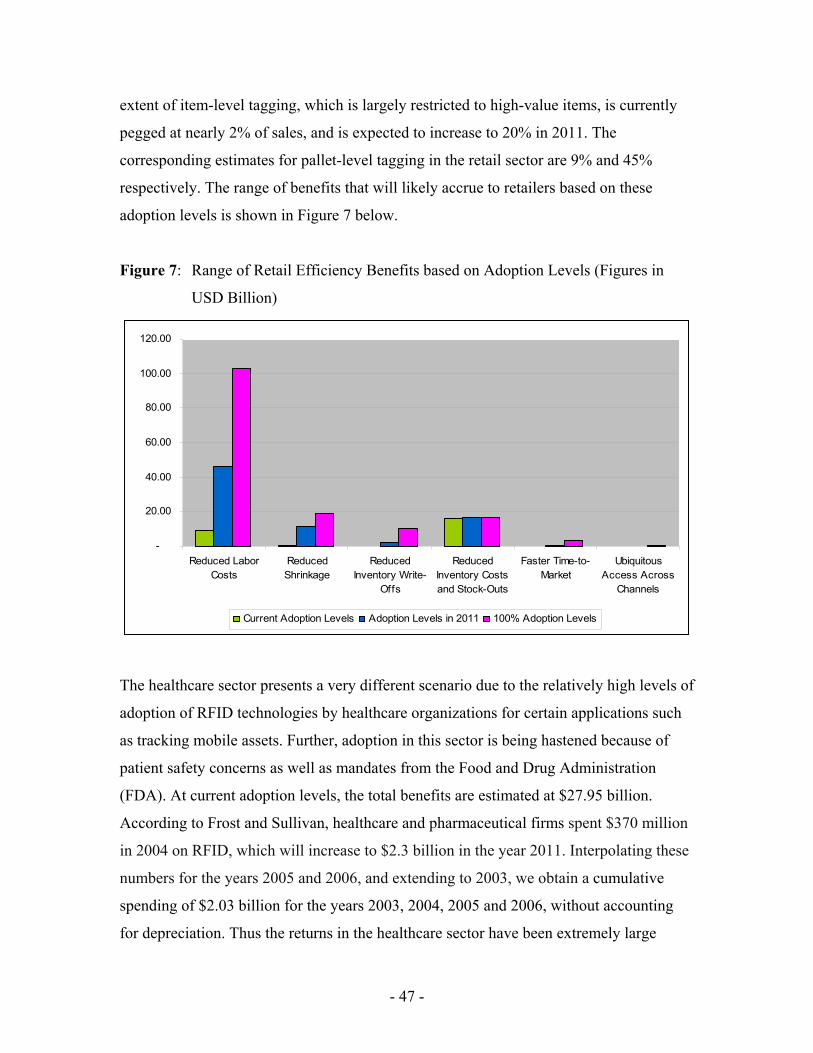
- 47 -
extent of item-level tagging, which is largely restricted to high-value items, is currently
pegged at nearly 2% of sales, and is expected to increase to 20% in 2011. The
corresponding estimates for pallet-level tagging in the retail sector are 9% and 45%
respectively. The range of benefits that will likely accrue to retailers based on these
adoption levels is shown in Figure 7 below.
Figure 7: Range of Retail Efficiency Benefits based on Adoption Levels (Figures in
USD Billion)
-
20.00
40.00
60.00
80.00
100.00
120.00
Reduced LaborCosts
ReducedShrinkage
ReducedInventory Write-
Offs
ReducedInventory Costsand Stock-Outs
Faster Time-to-Market
UbiquitousAccess Across
Channels
Current Adoption Levels Adoption Levels in 2011 100% Adoption Levels
The healthcare sector presents a very different scenario due to the relatively high levels of
adoption of RFID technologies by healthcare organizations for certain applications such
as tracking mobile assets. Further, adoption in this sector is being hastened because of
patient safety concerns as well as mandates from the Food and Drug Administration
(FDA). At current adoption levels, the total benefits are estimated at $27.95 billion.
According to Frost and Sullivan, healthcare and pharmaceutical firms spent $370 million
in 2004 on RFID, which will increase to $2.3 billion in the year 2011. Interpolating these
numbers for the years 2005 and 2006, and extending to 2003, we obtain a cumulative
spending of $2.03 billion for the years 2003, 2004, 2005 and 2006, without accounting
for depreciation. Thus the returns in the healthcare sector have been extremely large
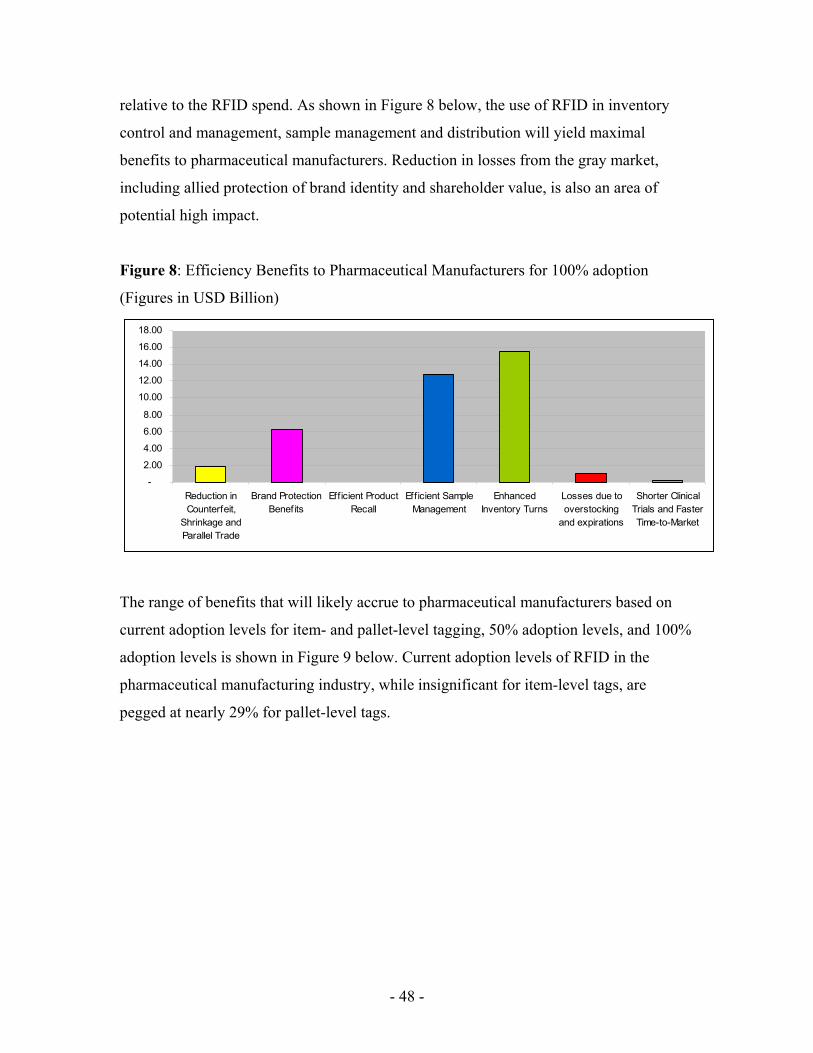
- 48 -
relative to the RFID spend. As shown in Figure 8 below, the use of RFID in inventory
control and management, sample management and distribution will yield maximal
benefits to pharmaceutical manufacturers. Reduction in losses from the gray market,
including allied protection of brand identity and shareholder value, is also an area of
potential high impact.
Figure 8: Efficiency Benefits to Pharmaceutical Manufacturers for 100% adoption
(Figures in USD Billion)
-
2.00
4.00
6.00
8.00
10.00
12.00
14.00
16.00
18.00
Reduction inCounterfeit,
Shrinkage andParallel Trade
Brand ProtectionBenefits
Efficient ProductRecall
Efficient SampleManagement
EnhancedInventory Turns
Losses due tooverstocking
and expirations
Shorter ClinicalTrials and FasterTime-to-Market
The range of benefits that will likely accrue to pharmaceutical manufacturers based on
current adoption levels for item- and pallet-level tagging, 50% adoption levels, and 100%
adoption levels is shown in Figure 9 below. Current adoption levels of RFID in the
pharmaceutical manufacturing industry, while insignificant for item-level tags, are
pegged at nearly 29% for pallet-level tags.
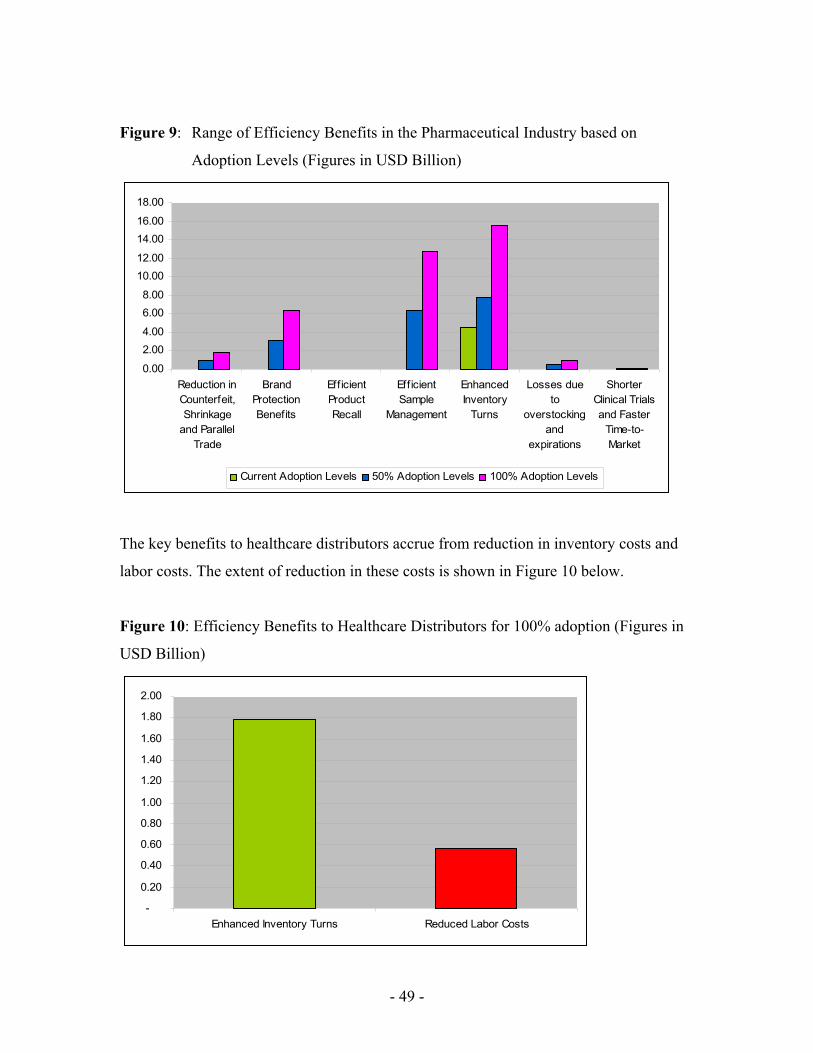
- 49 -
Figure 9: Range of Efficiency Benefits in the Pharmaceutical Industry based on
Adoption Levels (Figures in USD Billion)
0.00
2.004.00
6.008.00
10.0012.00
14.0016.00
18.00
Reduction inCounterfeit,Shrinkage
and ParallelTrade
BrandProtectionBenefits
EfficientProductRecall
EfficientSample
Management
EnhancedInventory
Turns
Losses dueto
overstockingand
expirations
ShorterClinical Trialsand Faster
Time-to-Market
Current Adoption Levels 50% Adoption Levels 100% Adoption Levels
The key benefits to healthcare distributors accrue from reduction in inventory costs and
labor costs. The extent of reduction in these costs is shown in Figure 10 below.
Figure 10: Efficiency Benefits to Healthcare Distributors for 100% adoption (Figures in
USD Billion)
-
0.20
0.40
0.60
0.80
1.00
1.20
1.40
1.60
1.80
2.00
Enhanced Inventory Turns Reduced Labor Costs
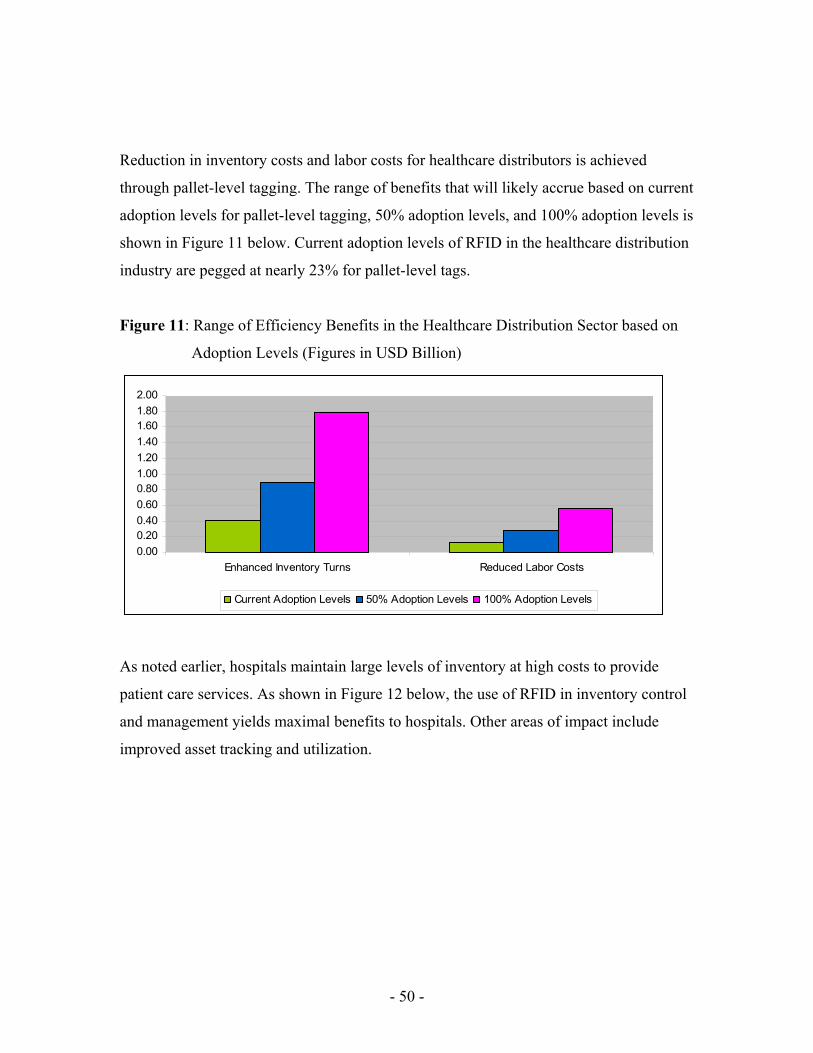
- 50 -
Reduction in inventory costs and labor costs for healthcare distributors is achieved
through pallet-level tagging. The range of benefits that will likely accrue based on current
adoption levels for pallet-level tagging, 50% adoption levels, and 100% adoption levels is
shown in Figure 11 below. Current adoption levels of RFID in the healthcare distribution
industry are pegged at nearly 23% for pallet-level tags.
Figure 11: Range of Efficiency Benefits in the Healthcare Distribution Sector based on
Adoption Levels (Figures in USD Billion)
0.000.200.400.600.801.001.201.401.601.802.00
Enhanced Inventory Turns Reduced Labor Costs
Current Adoption Levels 50% Adoption Levels 100% Adoption Levels
As noted earlier, hospitals maintain large levels of inventory at high costs to provide
patient care services. As shown in Figure 12 below, the use of RFID in inventory control
and management yields maximal benefits to hospitals. Other areas of impact include
improved asset tracking and utilization.
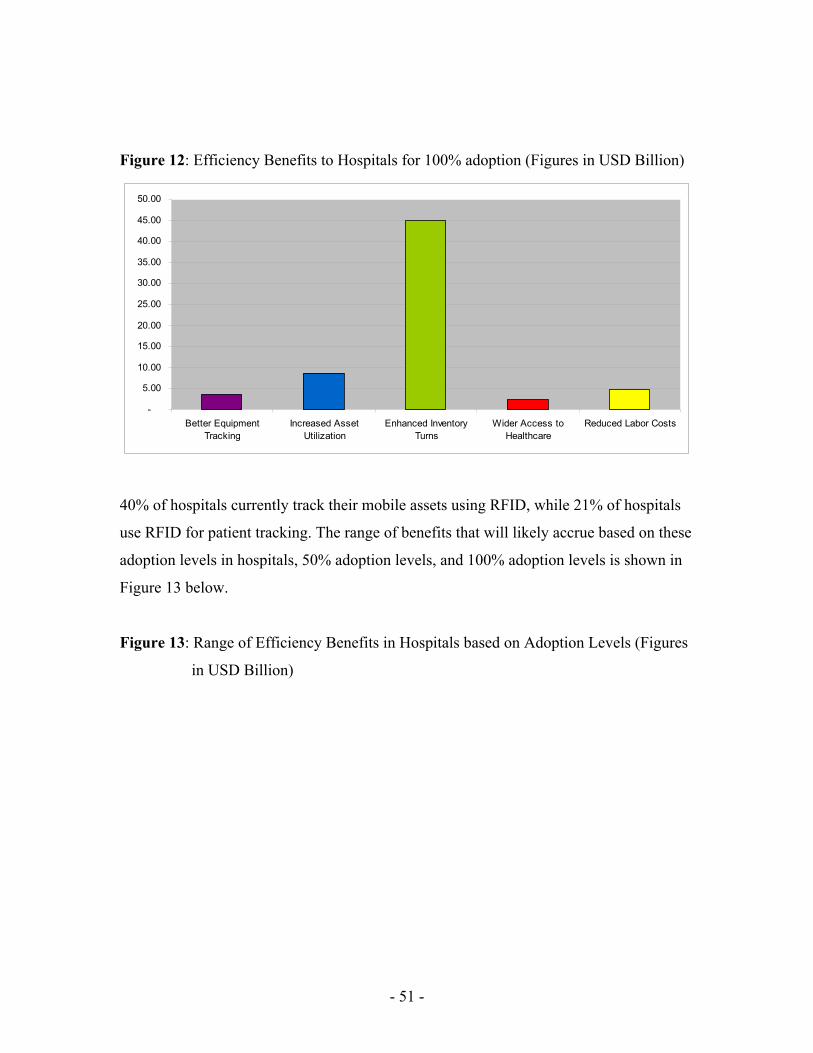
- 51 -
Figure 12: Efficiency Benefits to Hospitals for 100% adoption (Figures in USD Billion)
-
5.00
10.00
15.00
20.00
25.00
30.00
35.00
40.00
45.00
50.00
Better EquipmentTracking
Increased AssetUtilization
Enhanced InventoryTurns
Wider Access toHealthcare
Reduced Labor Costs
40% of hospitals currently track their mobile assets using RFID, while 21% of hospitals
use RFID for patient tracking. The range of benefits that will likely accrue based on these
adoption levels in hospitals, 50% adoption levels, and 100% adoption levels is shown in
Figure 13 below.
Figure 13: Range of Efficiency Benefits in Hospitals based on Adoption Levels (Figures
in USD Billion)
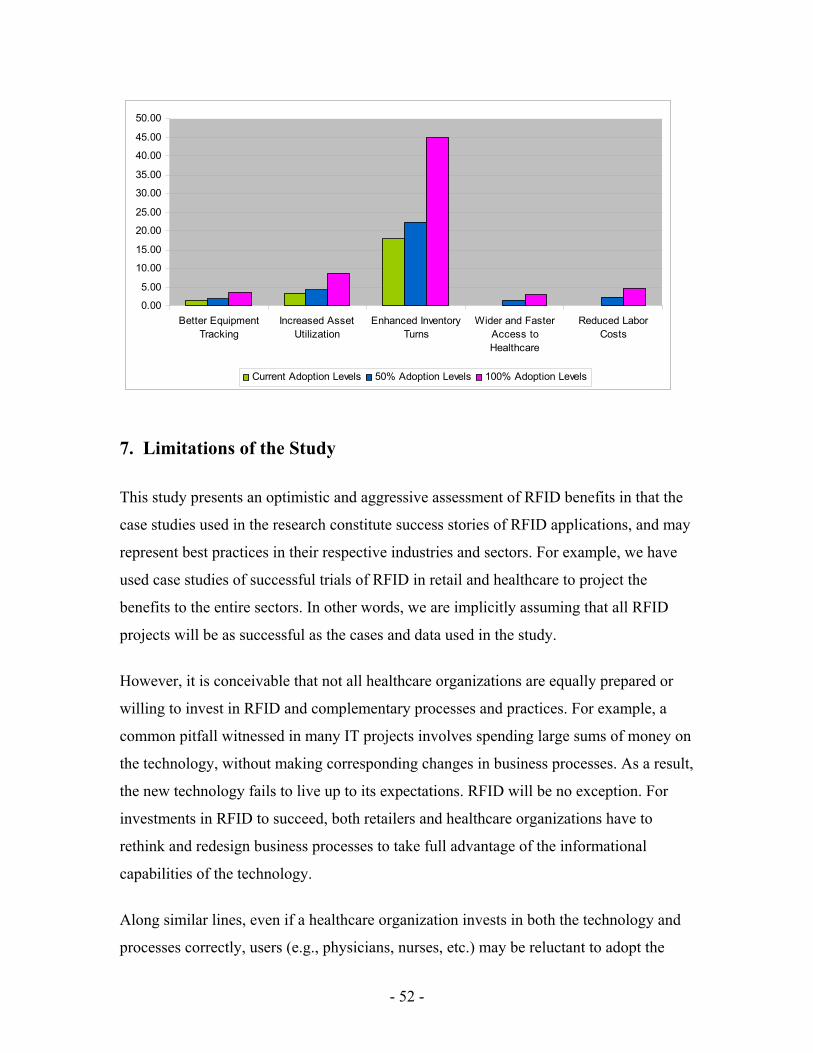
- 52 -
0.00
5.00
10.00
15.00
20.00
25.00
30.00
35.00
40.00
45.00
50.00
Better EquipmentTracking
Increased AssetUtilization
Enhanced InventoryTurns
Wider and FasterAccess toHealthcare
Reduced LaborCosts
Current Adoption Levels 50% Adoption Levels 100% Adoption Levels
7. Limitations of the Study
This study presents an optimistic and aggressive assessment of RFID benefits in that the
case studies used in the research constitute success stories of RFID applications, and may
represent best practices in their respective industries and sectors. For example, we have
used case studies of successful trials of RFID in retail and healthcare to project the
benefits to the entire sectors. In other words, we are implicitly assuming that all RFID
projects will be as successful as the cases and data used in the study.
However, it is conceivable that not all healthcare organizations are equally prepared or
willing to invest in RFID and complementary processes and practices. For example, a
common pitfall witnessed in many IT projects involves spending large sums of money on
the technology, without making corresponding changes in business processes. As a result,
the new technology fails to live up to its expectations. RFID will be no exception. For
investments in RFID to succeed, both retailers and healthcare organizations have to
rethink and redesign business processes to take full advantage of the informational
capabilities of the technology.
Along similar lines, even if a healthcare organization invests in both the technology and
processes correctly, users (e.g., physicians, nurses, etc.) may be reluctant to adopt the

- 53 -
technology in their daily activities. Therefore, it is critical to achieve a buy-in from
affected users even before the beginning of the actual project. Training in both the
technology and the new ways of doing work is also vital to the success of any IT
application.
Given the nascent state of RFID adoption, it is not easy to quantify the challenges of
successful implementation of RFID applications (which may include concurrent adoption
of the technology application and business processes by value chain partners, adopting
new ways of conducting business activities, redirecting labor, etc). However, judging by
failure statistics with complex but mature IT undertakings such as Enterprise Resource
Planning system implementation, it is probable that some RFID investments will fail to
deliver value, especially in the early phases of adoption.
Given the very large financial benefits we have found in this study, even if half of the
RFID implementation efforts resulted in failure, the aggregate benefits of RFID would
still be very impressive, with returns that far exceed that of any other non-IT capital
investment. It should be noted that there may be more failures in the early stages of the
technology life cycle. As adoption levels increase, best implementation practices will
come to light, enabling followers to adopt the technology and related processes with a
higher success rate. Further, early, successful adopters may enjoy a temporary but
significant competitive edge over followers until a large percentage of firms in a given
sector adopts the technology in business operations.
8. Conclusion While RFID adoption is in its early stages, there is much speculation about its potential
benefits and risks. Systematic studies assessing both benefits and risks can offer valuable
guidance to firms in various sectors of the economy in their adoption decisions. In this
research, we only focused on the benefits assessment problem. In spite of the scarcity of
data and case studies rich in quantifiable metrics, we demonstrated that best practices in
RFID deployment can lead to very large, measurable gains in the retail and healthcare
sectors for both sellers/providers and consumers. We believe that our approach of
- 54 -
considering early case studies and other sources of data to project the benefits to the
industry or sector level provides a useful methodology to analyze the financial impacts of
a new technology innovation.
We showed that in the retail sector, RFID benefits are largely driven by reduction in
labor, shrink and inventory costs. While these factors have always been problematic in
the retail business, RFID technologies offer a means to improve efficiency in these areas
to levels that were previously unattainable with existing IT applications. Given the very
low turnover of highly valuable and depreciable inventory of pharmaceutical products,
we find that inventory reduction is the biggest driver of RFID benefits for both
pharmaceutical firms and healthcare providers.
While the RFID benefits in both sectors appear to be unusually large, it is important to
note the extremely large size of these sectors. For example, retail constitutes a $3.5
trillion sector, and therefore, $12.05 billion in current benefits may not be excessively
large when compared to the sector size. Further, in the healthcare sector, a sizable
proportion of healthcare providers have already adopted RFID in certain activities such as
asset and patient tracking.
In calculating current benefits in the healthcare sector, we have not considered any
benefits of item-level tagging for pharmaceutical manufacturers, given the negligible
level of current adoption at the item level. With the proliferation in item-level tagging of
high value products, benefits of RFID in both retail and healthcare will increase to even
greater heights in the near future.
Future studies in this area should include risk in assessing the benefits of RFID
investments. Further, primary data collection, while costly and effort-intensive, can
provide deeper insights into how RFID and synergistic business processes lead to value

- 55 -
creation, and what factors (e.g., adoption of similar technologies and practices across the
entire value chain, the ability to manage technology-enabled change, etc.) can moderate
the relationship between technology spend and returns.
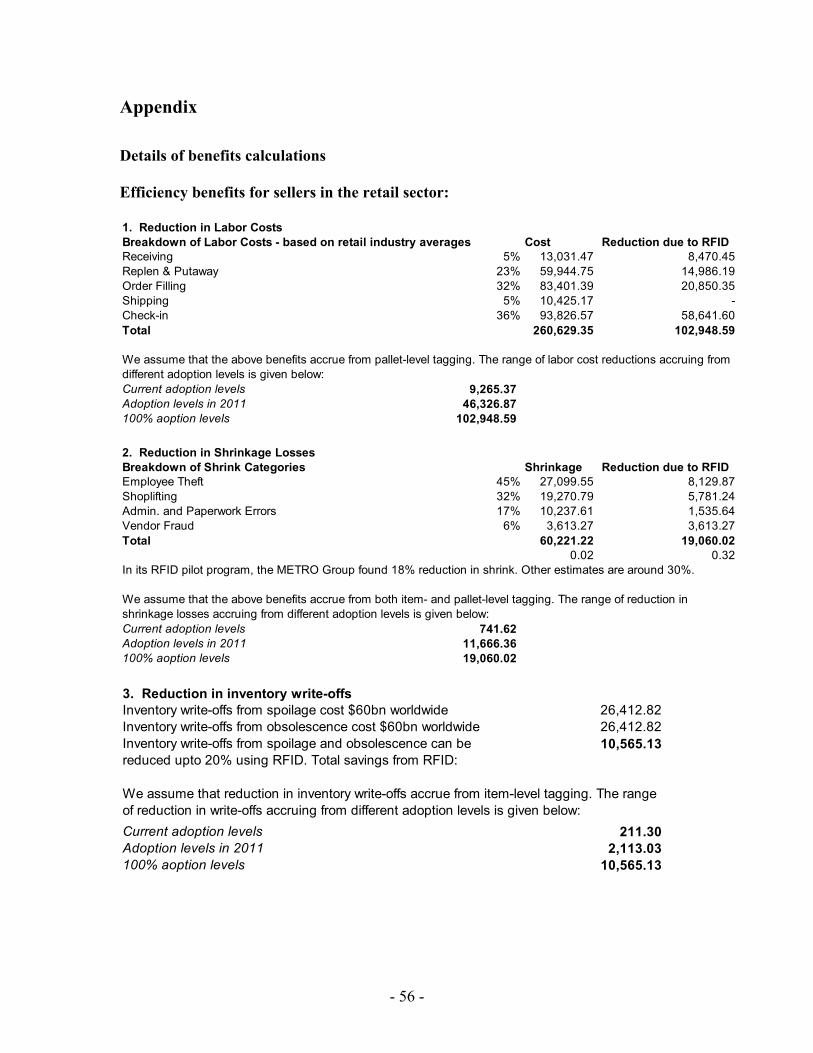
- 56 -
Appendix Details of benefits calculations Efficiency benefits for sellers in the retail sector: 1. Reduction in Labor CostsBreakdown of Labor Costs - based on retail industry averages Cost Reduction due to RFIDReceiving 5% 13,031.47 8,470.45 Replen & Putaway 23% 59,944.75 14,986.19 Order Filling 32% 83,401.39 20,850.35 Shipping 5% 10,425.17 -Check-in 36% 93,826.57 58,641.60 Total 260,629.35 102,948.59
Current adoption levels 9,265.37 Adoption levels in 2011 46,326.87 100% aoption levels 102,948.59
We assume that the above benefits accrue from pallet-level tagging. The range of labor cost reductions accruing from different adoption levels is given below:
2. Reduction in Shrinkage LossesBreakdown of Shrink Categories Shrinkage Reduction due to RFIDEmployee Theft 45% 27,099.55 8,129.87 Shoplifting 32% 19,270.79 5,781.24 Admin. and Paperwork Errors 17% 10,237.61 1,535.64 Vendor Fraud 6% 3,613.27 3,613.27 Total 60,221.22 19,060.02
0.02 0.32
Current adoption levels 741.62 Adoption levels in 2011 11,666.36 100% aoption levels 19,060.02
In its RFID pilot program, the METRO Group found 18% reduction in shrink. Other estimates are around 30%.
We assume that the above benefits accrue from both item- and pallet-level tagging. The range of reduction in shrinkage losses accruing from different adoption levels is given below:
3. Reduction in inventory write-offsInventory write-offs from spoilage cost $60bn worldwide 26,412.82 Inventory write-offs from obsolescence cost $60bn worldwide 26,412.82 Inventory write-offs from spoilage and obsolescence can be reduced upto 20% using RFID. Total savings from RFID:
10,565.13
Current adoption levels 211.30 Adoption levels in 2011 2,113.03 100% aoption levels 10,565.13
We assume that reduction in inventory write-offs accrue from item-level tagging. The range of reduction in write-offs accruing from different adoption levels is given below:
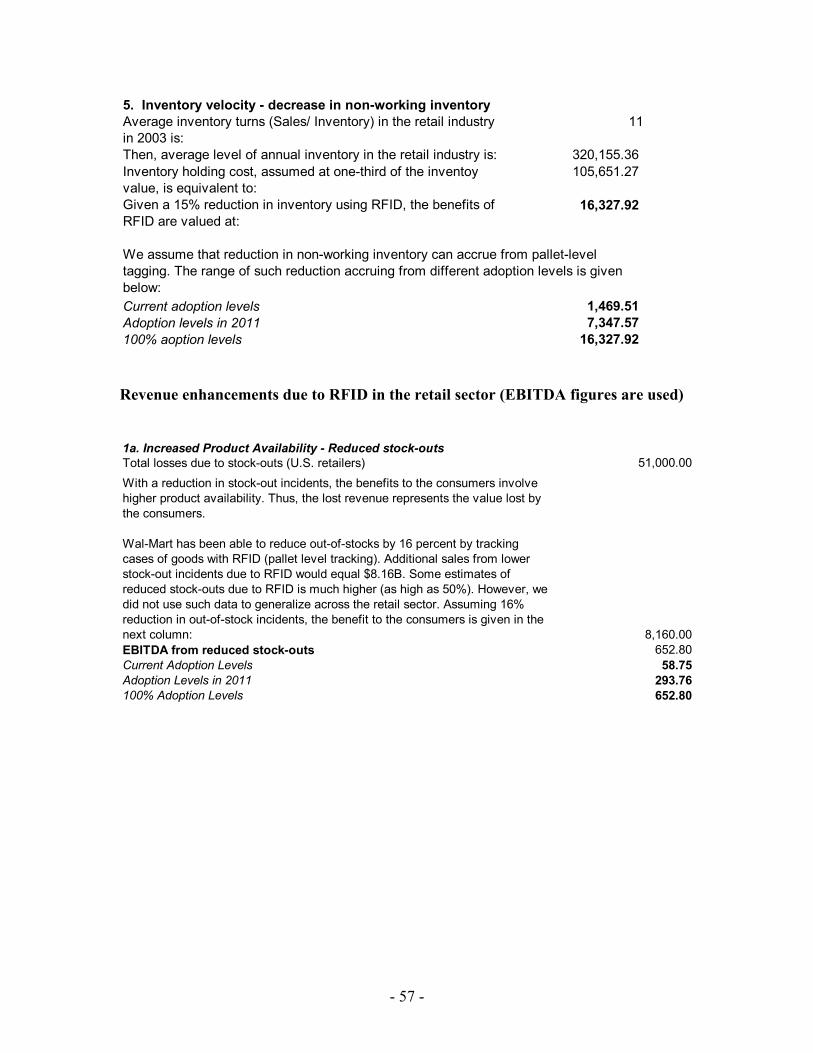
- 57 -
5. Inventory velocity - decrease in non-working inventoryAverage inventory turns (Sales/ Inventory) in the retail industry in 2003 is:
11
Then, average level of annual inventory in the retail industry is: 320,155.36 Inventory holding cost, assumed at one-third of the inventoy value, is equivalent to:
105,651.27
Given a 15% reduction in inventory using RFID, the benefits of RFID are valued at:
16,327.92
Current adoption levels 1,469.51 Adoption levels in 2011 7,347.57 100% aoption levels 16,327.92
We assume that reduction in non-working inventory can accrue from pallet-level tagging. The range of such reduction accruing from different adoption levels is given below:
Revenue enhancements due to RFID in the retail sector (EBITDA figures are used) 1a. Increased Product Availability - Reduced stock-outsTotal losses due to stock-outs (U.S. retailers) 51,000.00 With a reduction in stock-out incidents, the benefits to the consumers involve higher product availability. Thus, the lost revenue represents the value lost by the consumers.
Wal-Mart has been able to reduce out-of-stocks by 16 percent by tracking cases of goods with RFID (pallet level tracking). Additional sales from lower stock-out incidents due to RFID would equal $8.16B. Some estimates of reduced stock-outs due to RFID is much higher (as high as 50%). However, we did not use such data to generalize across the retail sector. Assuming 16% reduction in out-of-stock incidents, the benefit to the consumers is given in the next column: 8,160.00 EBITDA from reduced stock-outs 652.80 Current Adoption Levels 58.75 Adoption Levels in 2011 293.76 100% Adoption Levels 652.80

- 58 -
1b. Increased Product Availability - Reduced Shipment ErrorsJupiter Media Metrix estimates that in 2005, U.S. consumers made 90 million returns of merchandise bought over the Internet, representing nearly $6 billion worth of goods. Daugherty, Autry and Ellinger's survey of catalog retailers selling electronic products found that "defective, damaged, and/or incorrect merchandise shipped to consumers accounts for more than 40 percent of all returns".
The Annual Retail Trade survey by the U.S. Census estimates total ecommerce sales in 2004 at $71bn and total mail-order sales (net of ecommerce sales) in 2004 at $95bn. Unitary calculations suggest that the total returns for mail order sales are $8.028 billion. We assume that order processing and shipping errors do not occur in in-store sales, and are relevant only for online & mail-order sales. The total returns that can be attributed to shipment errors equal: 5,611.20 A study on returns by Harris Interactive concluded that 33% of consumers were likely to want to exchange merchandise, 24% will likely ask for a refund, and 40% were equally likely to ask for either. Using this statistic, lost sales on account of shipment errors that can be eliminated through RFID (assuming zero error due to RFID usage) is given as: 2,468.93 EBITDA from reduced shipment errors 197.51 Current Adoption Levels 17.78 Adoption Levels in 2011 88.88 100% Adoption Levels 197.51 2. Faster time to market for new productsGillette gets products on shelves 90% faster than normal (case study: Gillette Fusion razor) through the use of RFID. RFID enables faster product launches by providing real time end-to-end visibility in the retailer network and actionable information on various checkpoints along the launch continuum. This helps firms achieve product availability, effectively coordinate marketing plans, and effectively manage repeat demand, even when SKU offtake is different from plans across stores and channels. "Because the [cases of] Fusion product were EPC-enabled, it got onto the shelves in three days [of being sent from Gillette's distribution center]. This process typically takes 14 days for a new product launch." Deloitte Research found that the average time-to-market in 2004 was 15.5 months and new product revenue (NPR) was 29% of total sales. Projected time to market in 2007 is 12.8 months and NPR is 34% of sales. So, a reduction in time to market of 17% increases NPR by 5%. Reduction in time to market of 90% will increase sales by 26.47%. 14% of new product ideas make it to the market and 30% of those succeed. So the additional benefits to the consumers would be: 39,152.25 EBITDA from faster time to market 3,132.18 Current Adoption Levels 62.64 Adoption Levels in 2011 626.44 100% Adoption Levels 3,132.18
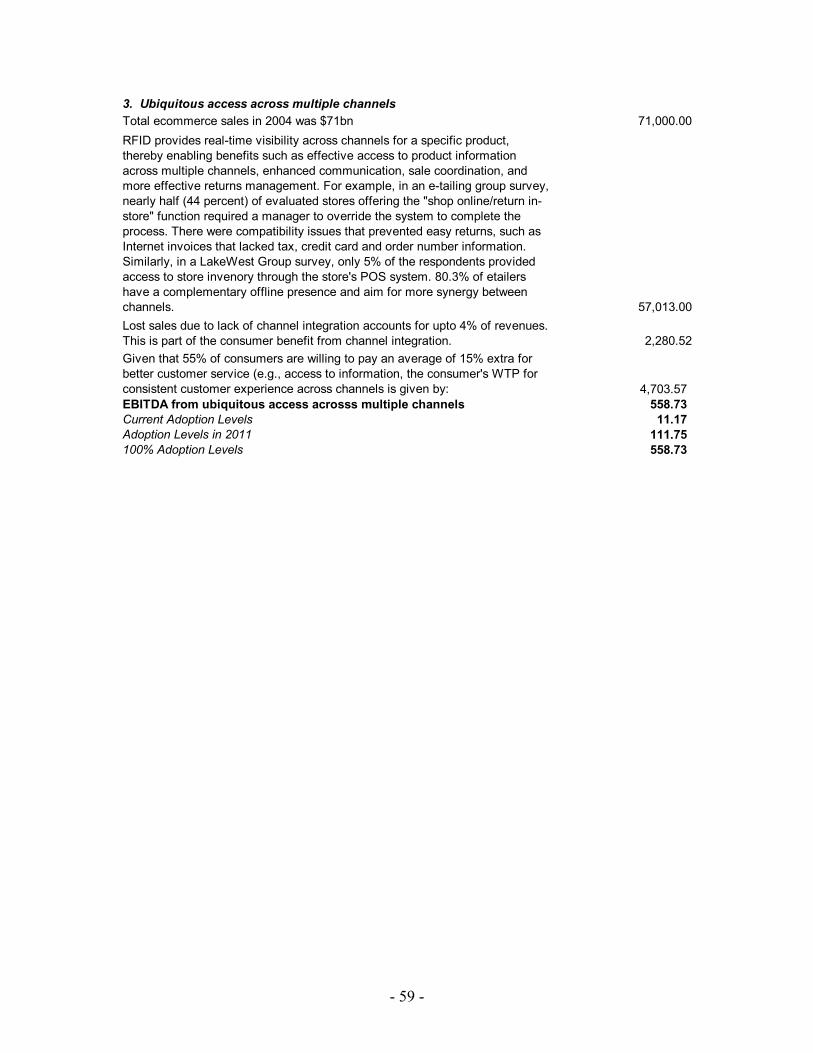
- 59 -
3. Ubiquitous access across multiple channelsTotal ecommerce sales in 2004 was $71bn 71,000.00 RFID provides real-time visibility across channels for a specific product, thereby enabling benefits such as effective access to product information across multiple channels, enhanced communication, sale coordination, and more effective returns management. For example, in an e-tailing group survey, nearly half (44 percent) of evaluated stores offering the "shop online/return in-store" function required a manager to override the system to complete the process. There were compatibility issues that prevented easy returns, such as Internet invoices that lacked tax, credit card and order number information. Similarly, in a LakeWest Group survey, only 5% of the respondents provided access to store invenory through the store's POS system. 80.3% of etailers have a complementary offline presence and aim for more synergy between channels. 57,013.00 Lost sales due to lack of channel integration accounts for upto 4% of revenues. This is part of the consumer benefit from channel integration. 2,280.52 Given that 55% of consumers are willing to pay an average of 15% extra for better customer service (e.g., access to information, the consumer's WTP for consistent customer experience across channels is given by: 4,703.57EBITDA from ubiquitous access acrosss multiple channels 558.73Current Adoption Levels 11.17Adoption Levels in 2011 111.75100% Adoption Levels 558.73
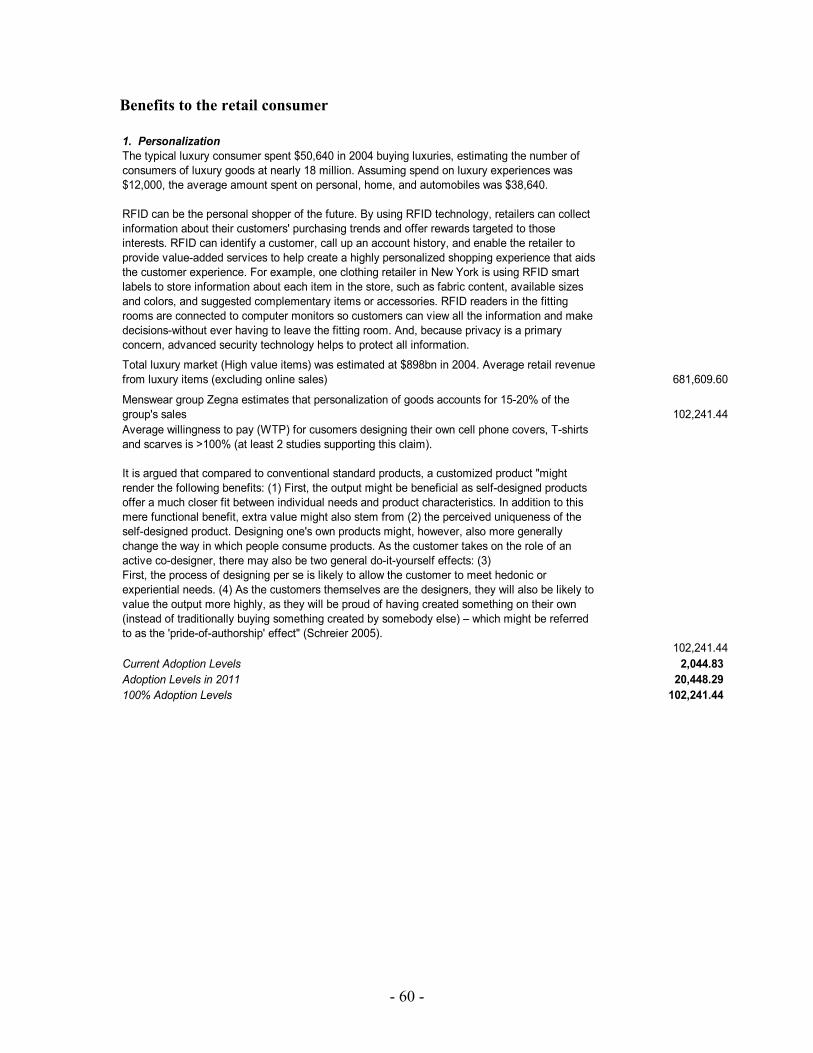
- 60 -
Benefits to the retail consumer 1. PersonalizationThe typical luxury consumer spent $50,640 in 2004 buying luxuries, estimating the number of consumers of luxury goods at nearly 18 million. Assuming spend on luxury experiences was $12,000, the average amount spent on personal, home, and automobiles was $38,640.
RFID can be the personal shopper of the future. By using RFID technology, retailers can collect information about their customers' purchasing trends and offer rewards targeted to those interests. RFID can identify a customer, call up an account history, and enable the retailer to provide value-added services to help create a highly personalized shopping experience that aids the customer experience. For example, one clothing retailer in New York is using RFID smart labels to store information about each item in the store, such as fabric content, available sizes and colors, and suggested complementary items or accessories. RFID readers in the fitting rooms are connected to computer monitors so customers can view all the information and make decisions-without ever having to leave the fitting room. And, because privacy is a primary concern, advanced security technology helps to protect all information.
Total luxury market (High value items) was estimated at $898bn in 2004. Average retail revenue from luxury items (excluding online sales) 681,609.60
Menswear group Zegna estimates that personalization of goods accounts for 15-20% of the group's sales 102,241.44 Average willingness to pay (WTP) for cusomers designing their own cell phone covers, T-shirts and scarves is >100% (at least 2 studies supporting this claim).
It is argued that compared to conventional standard products, a customized product "might render the following benefits: (1) First, the output might be beneficial as self-designed products offer a much closer fit between individual needs and product characteristics. In addition to this mere functional benefit, extra value might also stem from (2) the perceived uniqueness of the self-designed product. Designing one's own products might, however, also more generally change the way in which people consume products. As the customer takes on the role of an active co-designer, there may also be two general do-it-yourself effects: (3) First, the process of designing per se is likely to allow the customer to meet hedonic or experiential needs. (4) As the customers themselves are the designers, they will also be likely to value the output more highly, as they will be proud of having created something on their own (instead of traditionally buying something created by somebody else) – which might be referredto as the 'pride-of-authorship' effect" (Schreier 2005).
102,241.44 Current Adoption Levels 2,044.83Adoption Levels in 2011 20,448.29100% Adoption Levels 102,241.44
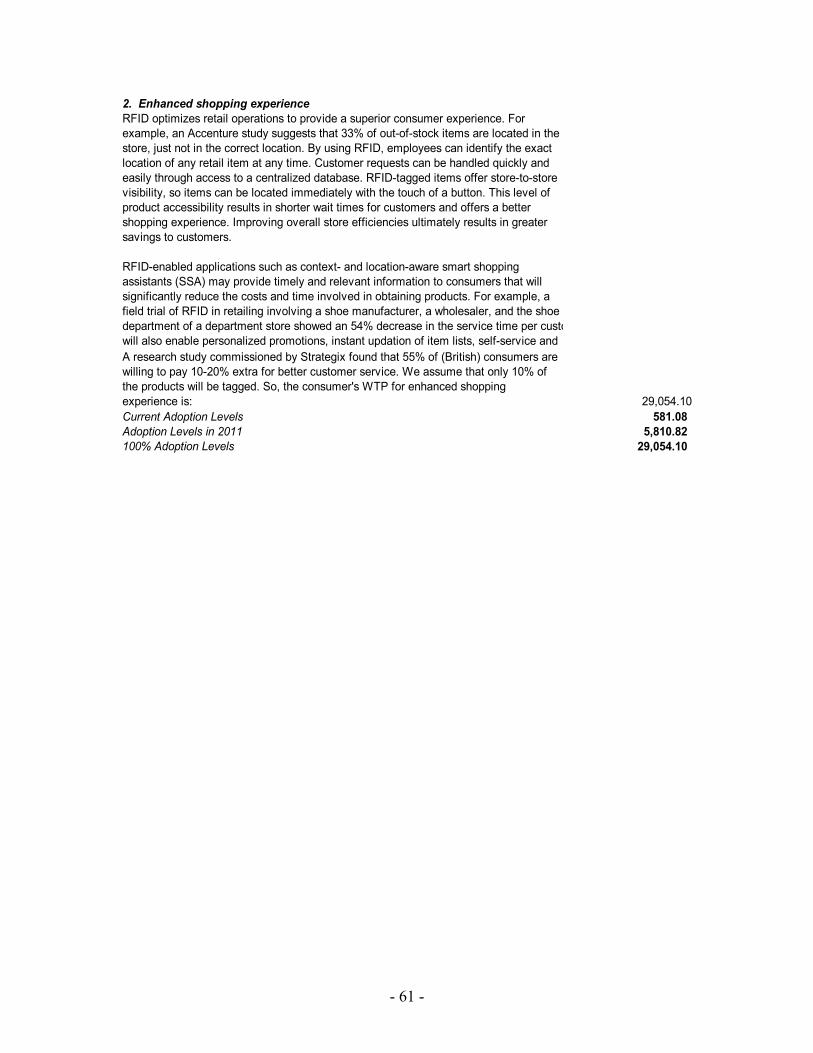
- 61 -
2. Enhanced shopping experienceRFID optimizes retail operations to provide a superior consumer experience. For example, an Accenture study suggests that 33% of out-of-stock items are located in the store, just not in the correct location. By using RFID, employees can identify the exact location of any retail item at any time. Customer requests can be handled quickly and easily through access to a centralized database. RFID-tagged items offer store-to-store visibility, so items can be located immediately with the touch of a button. This level of product accessibility results in shorter wait times for customers and offers a better shopping experience. Improving overall store efficiencies ultimately results in greater savings to customers.
RFID-enabled applications such as context- and location-aware smart shopping assistants (SSA) may provide timely and relevant information to consumers that will significantly reduce the costs and time involved in obtaining products. For example, a field trial of RFID in retailing involving a shoe manufacturer, a wholesaler, and the shoe department of a department store showed an 54% decrease in the service time per custowill also enable personalized promotions, instant updation of item lists, self-service andA research study commissioned by Strategix found that 55% of (British) consumers are willing to pay 10-20% extra for better customer service. We assume that only 10% of the products will be tagged. So, the consumer's WTP for enhanced shopping experience is: 29,054.10 Current Adoption Levels 581.08Adoption Levels in 2011 5,810.82100% Adoption Levels 29,054.10
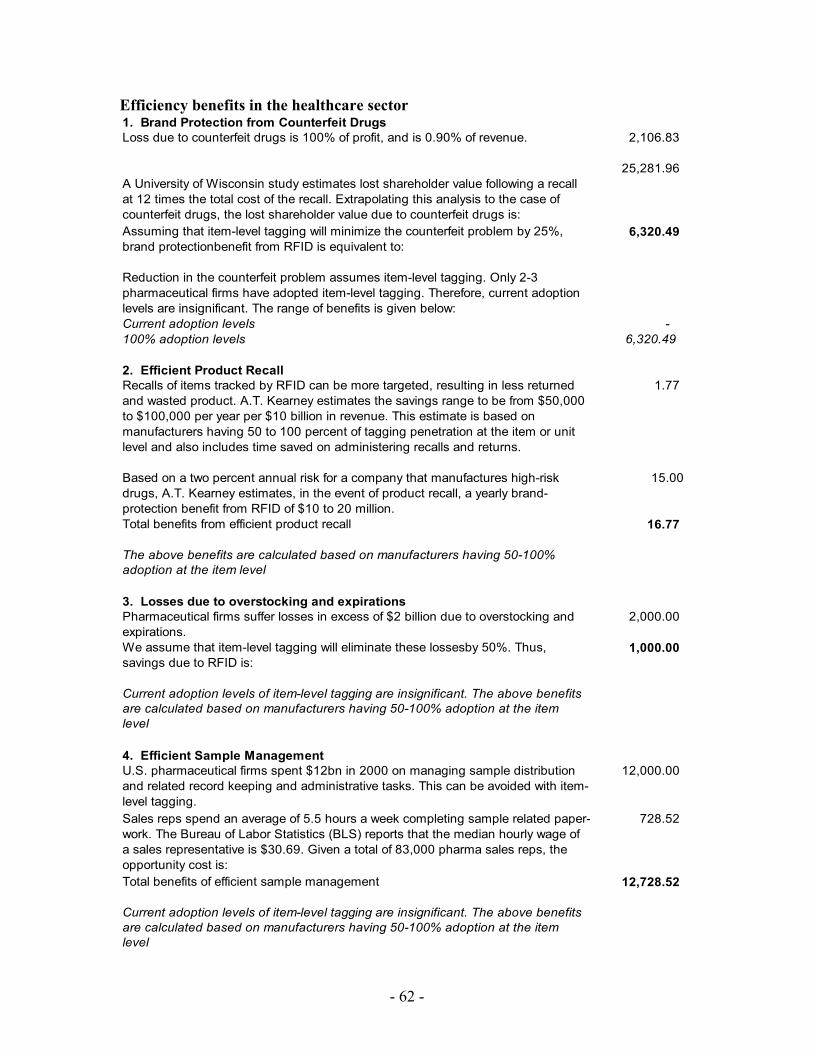
- 62 -
Efficiency benefits in the healthcare sector 1. Brand Protection from Counterfeit DrugsLoss due to counterfeit drugs is 100% of profit, and is 0.90% of revenue. 2,106.83
A University of Wisconsin study estimates lost shareholder value following a recall at 12 times the total cost of the recall. Extrapolating this analysis to the case of counterfeit drugs, the lost shareholder value due to counterfeit drugs is:
25,281.96
Assuming that item-level tagging will minimize the counterfeit problem by 25%, brand protectionbenefit from RFID is equivalent to:
6,320.49
Reduction in the counterfeit problem assumes item-level tagging. Only 2-3 pharmaceutical firms have adopted item-level tagging. Therefore, current adoption levels are insignificant. The range of benefits is given below:Current adoption levels - 100% adoption levels 6,320.49
2. Efficient Product RecallRecalls of items tracked by RFID can be more targeted, resulting in less returned and wasted product. A.T. Kearney estimates the savings range to be from $50,000 to $100,000 per year per $10 billion in revenue. This estimate is based on manufacturers having 50 to 100 percent of tagging penetration at the item or unit level and also includes time saved on administering recalls and returns.
1.77
Based on a two percent annual risk for a company that manufactures high-risk drugs, A.T. Kearney estimates, in the event of product recall, a yearly brand-protection benefit from RFID of $10 to 20 million.
15.00
Total benefits from efficient product recall 16.77
The above benefits are calculated based on manufacturers having 50-100% adoption at the item level
3. Losses due to overstocking and expirationsPharmaceutical firms suffer losses in excess of $2 billion due to overstocking and expirations.
2,000.00
We assume that item-level tagging will eliminate these lossesby 50%. Thus, savings due to RFID is:
1,000.00
Current adoption levels of item-level tagging are insignificant. The above benefits are calculated based on manufacturers having 50-100% adoption at the item level
4. Efficient Sample ManagementU.S. pharmaceutical firms spent $12bn in 2000 on managing sample distribution and related record keeping and administrative tasks. This can be avoided with item-level tagging.
12,000.00
Sales reps spend an average of 5.5 hours a week completing sample related paper-work. The Bureau of Labor Statistics (BLS) reports that the median hourly wage of a sales representative is $30.69. Given a total of 83,000 pharma sales reps, the opportunity cost is:
728.52
Total benefits of efficient sample management 12,728.52
Current adoption levels of item-level tagging are insignificant. The above benefits are calculated based on manufacturers having 50-100% adoption at the item level
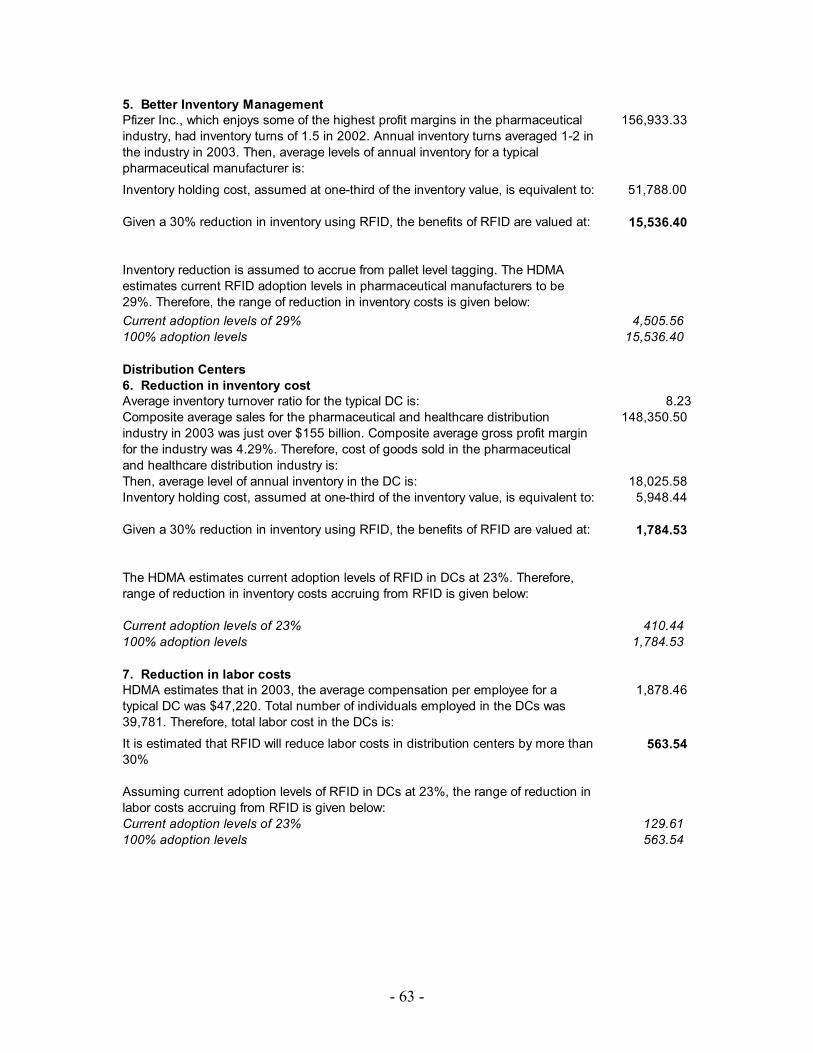
- 63 -
5. Better Inventory ManagementPfizer Inc., which enjoys some of the highest profit margins in the pharmaceutical industry, had inventory turns of 1.5 in 2002. Annual inventory turns averaged 1-2 in the industry in 2003. Then, average levels of annual inventory for a typical pharmaceutical manufacturer is:
156,933.33
Inventory holding cost, assumed at one-third of the inventory value, is equivalent to: 51,788.00
Given a 30% reduction in inventory using RFID, the benefits of RFID are valued at: 15,536.40
Inventory reduction is assumed to accrue from pallet level tagging. The HDMA estimates current RFID adoption levels in pharmaceutical manufacturers to be 29%. Therefore, the range of reduction in inventory costs is given below:Current adoption levels of 29% 4,505.56 100% adoption levels 15,536.40
Distribution Centers6. Reduction in inventory costAverage inventory turnover ratio for the typical DC is: 8.23Composite average sales for the pharmaceutical and healthcare distribution industry in 2003 was just over $155 billion. Composite average gross profit margin for the industry was 4.29%. Therefore, cost of goods sold in the pharmaceutical and healthcare distribution industry is:
148,350.50
Then, average level of annual inventory in the DC is: 18,025.58 Inventory holding cost, assumed at one-third of the inventory value, is equivalent to: 5,948.44
Given a 30% reduction in inventory using RFID, the benefits of RFID are valued at: 1,784.53
The HDMA estimates current adoption levels of RFID in DCs at 23%. Therefore, range of reduction in inventory costs accruing from RFID is given below:
Current adoption levels of 23% 410.44 100% adoption levels 1,784.53
7. Reduction in labor costsHDMA estimates that in 2003, the average compensation per employee for a typical DC was $47,220. Total number of individuals employed in the DCs was 39,781. Therefore, total labor cost in the DCs is:
1,878.46
It is estimated that RFID will reduce labor costs in distribution centers by more than 30%
563.54
Assuming current adoption levels of RFID in DCs at 23%, the range of reduction in labor costs accruing from RFID is given below:Current adoption levels of 23% 129.61 100% adoption levels 563.54
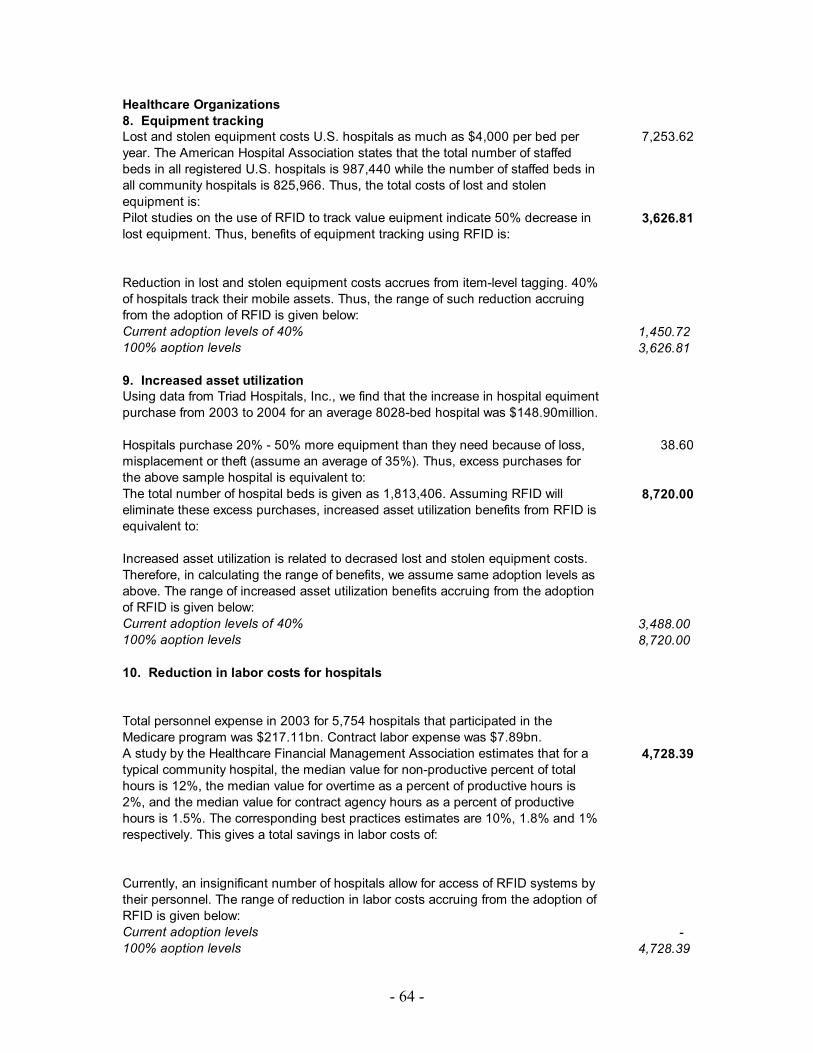
- 64 -
Healthcare Organizations8. Equipment trackingLost and stolen equipment costs U.S. hospitals as much as $4,000 per bed per year. The American Hospital Association states that the total number of staffed beds in all registered U.S. hospitals is 987,440 while the number of staffed beds in all community hospitals is 825,966. Thus, the total costs of lost and stolen equipment is:
7,253.62
Pilot studies on the use of RFID to track value euipment indicate 50% decrease in lost equipment. Thus, benefits of equipment tracking using RFID is:
3,626.81
Reduction in lost and stolen equipment costs accrues from item-level tagging. 40% of hospitals track their mobile assets. Thus, the range of such reduction accruing from the adoption of RFID is given below:Current adoption levels of 40% 1,450.72 100% aoption levels 3,626.81
9. Increased asset utilizationUsing data from Triad Hospitals, Inc., we find that the increase in hospital equiment purchase from 2003 to 2004 for an average 8028-bed hospital was $148.90million.
Hospitals purchase 20% - 50% more equipment than they need because of loss, misplacement or theft (assume an average of 35%). Thus, excess purchases for the above sample hospital is equivalent to:
38.60
The total number of hospital beds is given as 1,813,406. Assuming RFID will eliminate these excess purchases, increased asset utilization benefits from RFID is equivalent to:
8,720.00
Increased asset utilization is related to decrased lost and stolen equipment costs. Therefore, in calculating the range of benefits, we assume same adoption levels as above. The range of increased asset utilization benefits accruing from the adoption of RFID is given below:Current adoption levels of 40% 3,488.00 100% aoption levels 8,720.00
10. Reduction in labor costs for hospitals
Total personnel expense in 2003 for 5,754 hospitals that participated in the Medicare program was $217.11bn. Contract labor expense was $7.89bn.A study by the Healthcare Financial Management Association estimates that for a typical community hospital, the median value for non-productive percent of total hours is 12%, the median value for overtime as a percent of productive hours is 2%, and the median value for contract agency hours as a percent of productive hours is 1.5%. The corresponding best practices estimates are 10%, 1.8% and 1% respectively. This gives a total savings in labor costs of:
4,728.39
Currently, an insignificant number of hospitals allow for access of RFID systems by their personnel. The range of reduction in labor costs accruing from the adoption of RFID is given below:Current adoption levels - 100% aoption levels 4,728.39
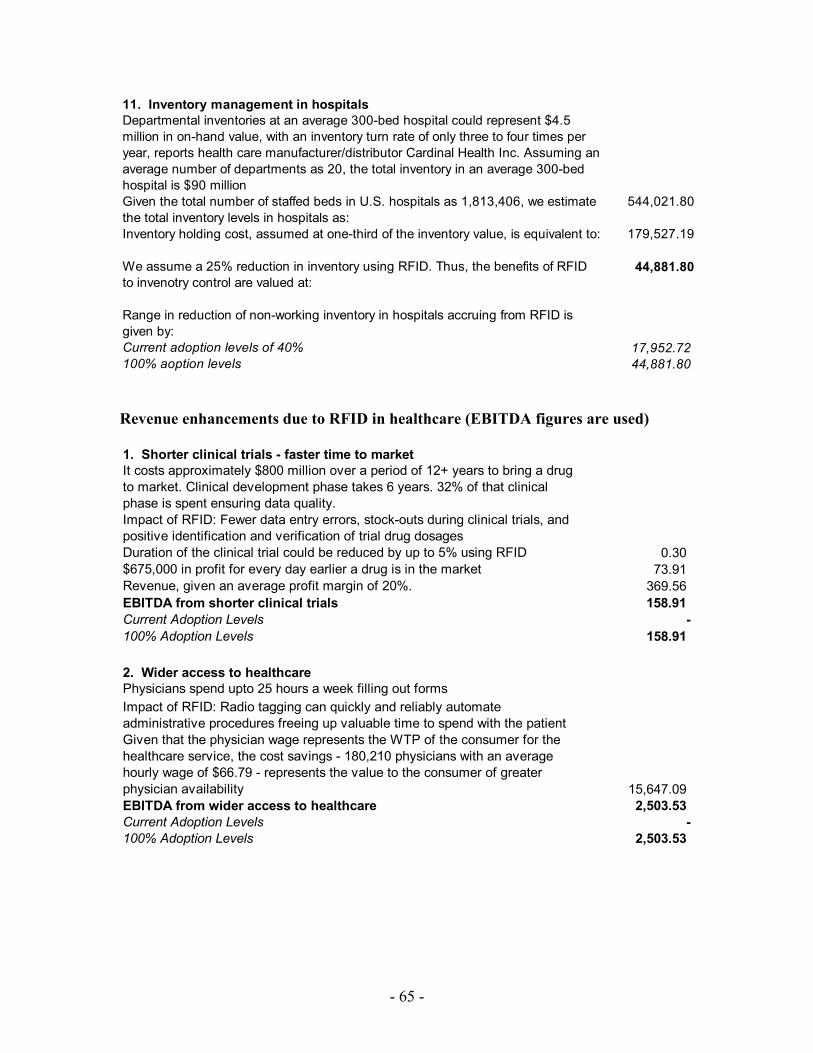
- 65 -
11. Inventory management in hospitalsDepartmental inventories at an average 300-bed hospital could represent $4.5 million in on-hand value, with an inventory turn rate of only three to four times per year, reports health care manufacturer/distributor Cardinal Health Inc. Assuming an average number of departments as 20, the total inventory in an average 300-bed hospital is $90 millionGiven the total number of staffed beds in U.S. hospitals as 1,813,406, we estimate the total inventory levels in hospitals as:
544,021.80
Inventory holding cost, assumed at one-third of the inventory value, is equivalent to: 179,527.19
We assume a 25% reduction in inventory using RFID. Thus, the benefits of RFID to invenotry control are valued at:
44,881.80
Range in reduction of non-working inventory in hospitals accruing from RFID is given by:Current adoption levels of 40% 17,952.72 100% aoption levels 44,881.80 Revenue enhancements due to RFID in healthcare (EBITDA figures are used) 1. Shorter clinical trials - faster time to marketIt costs approximately $800 million over a period of 12+ years to bring a drug to market. Clinical development phase takes 6 years. 32% of that clinical phase is spent ensuring data quality.Impact of RFID: Fewer data entry errors, stock-outs during clinical trials, and positive identification and verification of trial drug dosagesDuration of the clinical trial could be reduced by up to 5% using RFID 0.30$675,000 in profit for every day earlier a drug is in the market 73.91Revenue, given an average profit margin of 20%. 369.56EBITDA from shorter clinical trials 158.91Current Adoption Levels -100% Adoption Levels 158.91 2. Wider access to healthcarePhysicians spend upto 25 hours a week filling out formsImpact of RFID: Radio tagging can quickly and reliably automate administrative procedures freeing up valuable time to spend with the patientGiven that the physician wage represents the WTP of the consumer for the healthcare service, the cost savings - 180,210 physicians with an average hourly wage of $66.79 - represents the value to the consumer of greater physician availability 15,647.09EBITDA from wider access to healthcare 2,503.53Current Adoption Levels -100% Adoption Levels 2,503.53
- 66 -
3. Reduction in counterfeit, shrinkage and parallel tradeNearly $39 billion, or 11 percent, of global pharmaceutical commerce was counterfeit in 2005The U.S. drug market accounts for 50% of the world's medicine salesImpact of RFID: With RFID tags, pharmacists will be able to tell if the drug did not come from the manufacturer. Law enforcement officers using handheld readers also will be able to quickly check whether bottles they Assuming counterfeit and shrinkage (due to theft, damage, etc. and expiry of perishable items) loss is 100% of profit, and parallel trade and reimportation loss is 50% of profit, loss due to gray market is on average 1.83% of revenue. The assumption is that the value lost by buying a counterfeit product is reflected in the consumers' WTP, which is assumed to be equal to the sales. This is a conservative estimate as it does not include damage to patient health arising from a counterfeit product, measured by litigation costs arising from such administration. The lost revenue due to counterfeit is as follows: 4,307.82EBITDA from reduction in lost revenue in the gray market 1,852.36Current Adoption Levels -100% Adoption Levels 1,852.36 Consumer Benefits in Healthcare Improved patient care Fewer medical errors - A 1999 Institute of Medicine (IOM) study concludes that preventable medical errors in the US cause between 44,000 and 98,000 people to die 18,815.00Patient tracking - Non-compliance with medication in the US causes 125,000 deaths yearly, 11% of hospital admissions and costs healthcare payers $100 billion yearly in medication non-compliance. $31.3 billion is spent on nursing home admission due to noncompliance, $15 billion is spent on hospital admissions due to noncompliance. In principle, patient tracking through RFID can eliminate non-compliance.
Note: We did not use value-of-life measures in estimating the consumer benefit arising from the prevention of the 125,000 deaths due to non-compliance. 146,300.00Consumer Benefits from Improved Patient Care 165,115.00Current Adoption Levels 34,674.1550% Adoption Levels 82,557.50100% Adoption Levels 165,115.00 2. Faster access to healthcare (shorter wait times)The National Ambulatory Medical care survey estimates that in 2002, an estimated 890 million visits were made to physician offices in the United States. The average waiting time to see a physician was 46.5 minutes 890.00Impact of RFID: Radio tagging can quickly and reliably automate registration and other administrative procedures.Working population in the U.S. is nearly 81 millionPopulation of the U.S. is 295,734,134Average hourly wage of the American worker is $18.09Value of time saved 3,417.54