Embed Size (px)
Citation preview

Proceedings of the 2005 American Society for Engineering Education Annual Conference & Exposition Copyright © 2005, American Society for Engineering Education
Assessing Elementary School Students’ Conceptions of Engineering and Technology
Christine M. Cunningham, Cathy Lachapelle, Anna Lindgren-Streicher
Museum of Science, Boston
As our society becomes increasingly dependent on engineering and technology, it is more important than ever that our citizens are technologically literate [1]. There are many possible ways to develop technological literacy—one of the most wide-reaching is through K-12 schools. The Museum of Science, Boston is working to create curricular materials and professional development for K-12 students and teachers. However, previous research in science has evinced that responsible curriculum development draws upon and is shaped by students’ conceptions and misconceptions [2]. While the field of science education research has generated (and continues to develop) a strong base of research about students’ conceptions for educators, developers, and scholars to reference, similar efforts in technology and engineering education research are nascent. A literature review surfaced only a handful of relevant studies. There have been few studies that probe students’ understanding of design [3], and students’ conceptions of strength of materials and stability [4]. The International Technology Education Association (ITEA) has conducted one study of adults’ thinking about technology and engineering [5]. Clearly, much more research is needed in this area to guide the field [4-6]. One of stumbling blocks that has been identified is that scholars have not yet come to consensus on the specific concepts and process understandings that comprise technological literacy [7]. More clarification at the national, state, district, or project level could provide some guidelines. However, we have chosen to begin to investigate conceptions at a much more basic level; specifically, what do students think engineering and technology are? One could argue that for any person to be technologically literate, s/he must first have some idea of what engineering and technology are. Though they are surrounded by the products of engineering in our everyday lives, students and the general public generally don’t understand what engineers do [8-10]. A dearth of information currently exists that probes students’ understandings of these fundamental concepts. This paper reports the creation of one instrument developed to assess these concepts in students. It presents some statistical data from 504 students who have completed the survey and draws some preliminary conclusions about what the average child thinks engineering and technology are. It concludes with some further uses for the instrument and next steps for the research agenda. METHODS This study grew from a previous study that probed students’ conceptions of what engineers do [11]. We modified the “Draw A Scientist Test” [12] to focus on engineering as a “Draw an Engineer Test (DAET).” Respondents were asked what engineering is, were asked to draw a

Proceedings of the 2005 American Society for Engineering Education Annual Conference & Exposition Copyright © 2005, American Society for Engineering Education
picture of an engineer at work, and then were asked describe in their picture in writing. Over 900 students Grades K-12 have completed this instrument. In later survey instruments, we added a question that asked students to describe what technology was. The results of this survey supported our hypothesis that most students have a limited and often incorrect view of what engineers do and what technology is. While an interesting first diagnostic, the DAET had multiple limitations. With this instrument, students draw only one image, which does not allow researchers to fully understand the breadth of their understanding of what engineers do (and the range of fields of engineering). A single image also presents the possibility that students evoke a stereotyped image of what engineers do. Because the survey was an open-ended format, it was also not conducive to quantitative analysis. Therefore, we drew upon the findings of the DAET to develop a second set of instruments to more systematically probe students’ conceptions about engineering and technology. We were interested in creating an instrument that could be scored easily and that could be used to assess students’ growth in understanding of these fields. To this end, we aimed to create an instrument that would be somewhat difficult and nuanced so only students with a deep understanding would select all the correct items. Reviewing students’ conceptions and misconceptions about the work that engineers do, we created a table with 16 images and descriptions of people at work and asked students to circle the kinds of work that engineers do. (A copy of the instrument is included in the Appendix.) Pictures were included to help early readers and English language learners. The final items included:
• Improve machines • Supervise construction • Set up factories • Construct buildings • Drive machines • Arrange flowers • Read about inventions • Design ways to clean water • Work as a team • Make pizza • Install wiring • Sell food • Repair cars • Design things • Clean teeth • Teach children
The children were also asked to complete in writing the phrase “An engineering is a person who ….” Similarly we created an instrument to measure students’ conceptions of technology. The technology table also contained 16 images and descriptions and asked students to circle those items that were technology. (A copy of this instrument is also included in the Appendix.) The final items included:

Proceedings of the 2005 American Society for Engineering Education Annual Conference & Exposition Copyright © 2005, American Society for Engineering Education
• Shoes • Subway • Dandelions • Cellular phone • Oak tree • Bridge • Television • Cup • Parrot • Factory • Bandage • House • Power lines • Bicycle • Lightening • Books
Students were asked to respond to the open-ended question “How do you know if something is technology?” in writing. We have administered these two instruments to over 6000 students in Grades 1-5. This paper reports findings from a random sample of 504 students in Grades 1-5 from 18 elementary schools in one Massachusetts district. The district has a total of 11,697 students in Grades K-12. In the 2003-04 school year, 23.3% of students in this district were of a racial or ethnic minority (African American, Asian, Hispanic, or Native American), and 53.8% were from low-income families. Additionally, 30.2 % of students in the district spoke a first language other than English, and 4.7% were identified as having limited English proficiency. Of the students in our sample, 23.7% were of a racial or ethnic minority, and 60.0% were from low-income families. The students in the sample spoke a total of 10 different first languages (including English), and 27.3% spoke a first language other than English, the most common being Portuguese (16.1% of students). A total of 2.9% of students in our sample were identified as having limited English proficiency. Prior to 2004, the district had not implemented any efforts to teach concepts related to technology and engineering in the K-5 classes. In 2004, the district science supervisor identified technology and engineering learning, consistent with the Massachusetts State Frameworks [13], as one of the improvement goals for the district. To help meet these goals, the district partnered with the Museum of Science, Boston, to begin to implement the Engineering is Elementary (EiE): Engineering and Technology Lessons for Children curriculum. As part of this effort, district administrators agreed to administer baseline questionnaires about engineering and technology to all Grade 1-5 students (and their teachers). The questionnaires included both the “What is Technology?” and “What is Engineering?” instruments. The district administration has also agreed to provide basic demographic information for every student in the district so we can run statistical analyses using these variables.

Proceedings of the 2005 American Society for Engineering Education Annual Conference & Exposition Copyright © 2005, American Society for Engineering Education
Data analysis was conducted using basic statistics to generate frequencies of responses. To determine whether there were any differences in responses between the sexes or between students in different grades, chi-square analyses were run. Students’ open-ended comments were read and coded into categories. FINDINGS What is engineering? When asked to choose what kinds of work engineers do, over half of the students indicated that they thought engineers repair cars (78.4%), install wiring (75.2%), drive machines (70.7%), construct buildings (69.7%), set up factories (67.1%), and improve machines (63.5%). These data support DAET data that students perceive that engineers are auto mechanics and construction workers. Fewer students thought that engineers supervised construction (48.7%), designed things (32.1%), and worked as a team (26.9%). Students were more likely to associate any of these tasks with engineering than the least cited responses: clean teeth (17.7%), design ways to clean water (14.4%), teach children (14.0%), read about inventions (12.2%), make pizza (10.6%), sell food (10.4%), or arrange flowers (4.6%). Graph 1 displays these results. Graph 1: What kinds of work do engineers do?
What Kinds of Work Do Engineers Do?
0.010.020.030.040.050.060.070.080.090.0
Arrang
e Flow
ers
Sell Foo
d
Make P
izza
Read A
bout
Inven
tions
Teach
Chil
dren
Design
Way
s to C
lean W
...
Clean T
eeth
Work
as a
Team
Design
Things
Superv
ise C
onstr
uctio
n
Impro
ve M
achin
es
Set Up F
actor
ies
Constr
uct B
uildin
gs
Drive M
achin
es
Instal
l Wirin
g
Repair
Cars
% ofStudentsChoosing
A crosstab to determine whether there were differences in responses between male and female students and students in different grades indicated that no significant differences exist. A few major categories of codes emerged from students’ open-ended responses to complete the sentence “An engineer is a person who…”. The most commonly cited response was that engineers fix things. When students were more specific than “things” they indicated that the
Proceedings of the 2005 American Society for Engineering Education Annual Conference & Exposition Copyright © 2005, American Society for Engineering Education
items that were fixed included buildings, cars, electricity/wiring, phones, motors/engines and technology.
“I think that sell food and repair cars are an engineer because they both work like it” “works with special technology to fix things”
Second most commonly students indicated that engineers build things. Again, specificity about what was being built primarily included buildings and wiring.
“bills thing and wacks as a team. And most are boys.” “Makes stof and brakes stof.” “An engineer is some one how does lectrisady.”
Reciting examples in the table or indicating they didn’t know was the third most generated response. That engineers work with or on things was also common. General attributes of engineers such as people who have a job, people who work with other engineers, people who work hard, and people need science and math were also recognized.
“Has a vevry in porting job.” “is very, very very smart at math”
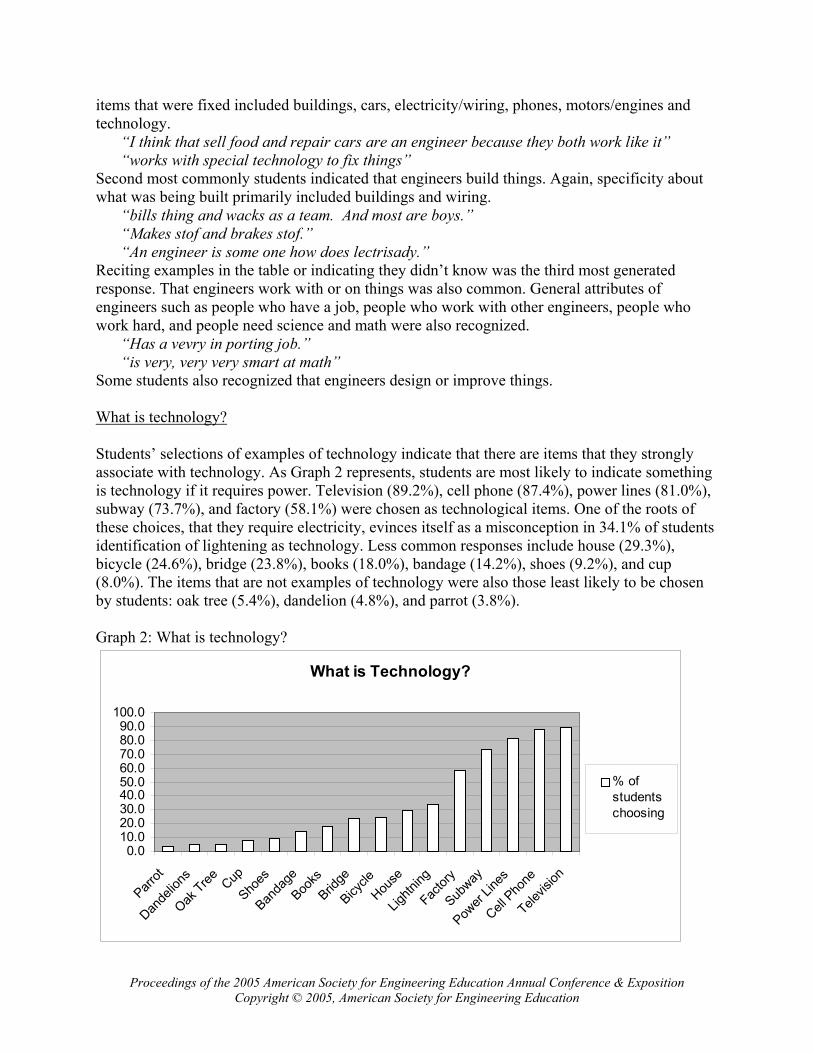
Some students also recognized that engineers design or improve things. What is technology? Students’ selections of examples of technology indicate that there are items that they strongly associate with technology. As Graph 2 represents, students are most likely to indicate something is technology if it requires power. Television (89.2%), cell phone (87.4%), power lines (81.0%), subway (73.7%), and factory (58.1%) were chosen as technological items. One of the roots of these choices, that they require electricity, evinces itself as a misconception in 34.1% of students identification of lightening as technology. Less common responses include house (29.3%), bicycle (24.6%), bridge (23.8%), books (18.0%), bandage (14.2%), shoes (9.2%), and cup (8.0%). The items that are not examples of technology were also those least likely to be chosen by students: oak tree (5.4%), dandelion (4.8%), and parrot (3.8%). Graph 2: What is technology?
What is Technology?
0.010.020.030.040.050.060.070.080.090.0
100.0
Parrot
Dande
lions
Oak Tree Cup
Shoes
Banda
ge
Books
Bridge
Bicycle
House
Lightn
ing
Factor
y
Subway
Power
Lines
Cell Pho
ne
Televis
ion
% ofstudentschoosing

Proceedings of the 2005 American Society for Engineering Education Annual Conference & Exposition Copyright © 2005, American Society for Engineering Education
Male and female student responses about technology differed only for one item—lightening. Female students were significantly more likely to choose this item (41.1%) than male students (28.7%). A crosstab analysis by grade indicated that there was also one item that first graders were significantly more likely to choose than second-fifth graders—12% of first graders indicated that a parrot was technology while 2.9% or fewer of students in higher grade chose this item. Students’ open-ended responses to how they knew something was technology most commonly cited the fact that it uses or has electricity. Responses such as:
“I think I know because I think that technology is something with power or electrisaty” “stuf that thay did not have in the old day's that runs on elechric” “I know technologh because you need to plug it in that is why I know.” “it works by bataries or by a plug. A lot of the time you miteuse a charger.” “I think I know because these thing work on electricity. These thing can eletrify you.”
were extremely common. The second most cited set of reasons had students referencing their knowledge—they recited specific examples, indicated that they were smart “I no cus I am smart”, or admitted that they didn’t know. Students responses also referenced what the function of the technology was, for example, helping you, learning from it, or the ability to use it
“Technology is something that makes you learn like books and a computer.” “technology is something that makes it easyer for people so they won't have to do all that stofe”
Other students explained that they knew it was technology because it was created by people. “you can find out if something is technology if it is made by human minds” “I know if something is technology because it takes lots of men to build something and because it takes a very long time.”
DISCUSSION The results of our survey further bolster the findings of our previous work about some of the conceptions and misconceptions that students hold about engineering and technology. The top six student choices of what engineers do are all rooted in activities that focus on construction, building, machinery, and vehicles, which suggests that students are identifying them as engineering based on their association with these attributes, not based on the type of work engineers do. Students strongly conflate construction workers and auto mechanics with engineers. While this is understandable (engineering has the word engine in it), it are also concerning, especially since these are fields that are not traditionally populated by women. Thus, these conceptions might be one reason for the lower number of girls that enter engineering than boys. Students’ identification of engineering with civil engineering is also illustrated by this survey. While machines, factories, construction, and building all ranked high (regardless of whether people were supervising, improving, or designing or working as a tradesperson), the lack of understanding about the breadth of the fields of engineering begins to be captured by the survey. Children are more likely to think that engineers clean teeth than design ways to clean water! This suggests that much more education is needed to help children understand the range of the type of work engineers do. Fewer than third of the students recognized one of the central features of engineering—design.

Proceedings of the 2005 American Society for Engineering Education Annual Conference & Exposition Copyright © 2005, American Society for Engineering Education
To better assess the degree to which students understand the range of types of engineering, we have now modified the survey and replaced half of the six items that focused on machinery and construction with items that reflect other engineering fields such as chemical and biomedical engineering. We hypothesize that students will not recognize these disciplines as engineering. It is clear that for the majority of students, technology is closely linked with power and electricity. While was also expected and is certainly understandable, it presents a narrow (and developed country’s) view of technology. Less than a third of the students identified any of the everyday human-made objects as technology. Clearly students need to be educated about what technology is and the prevalence of technology not only in our society, but also in societies across the world. The statistical results of these surveys have helped us to identify some conceptions and misconceptions that students hold. We have modified the engineering survey (as mentioned above) to further probe the range of students’ understandings and in future months we plan to conduct interviews with students to get more in-depth information about how and why they are thinking about engineering and technology. We are also using these two survey instruments in two additional ways. First, because the surveys are nuanced, we can use them as a measure of students’ growth in understanding. Thus, we will administer these instruments again at the end of the school year and annually to the same students to assess how their knowledge has changed and what effect, if any, of our curricular program has had on their knowledge. Second, we have begun to use these assessments with our teachers to evaluate what they think engineering and technology are and how these understandings change. Based on these uses, we believe that these instruments provide one way to assess what students think and how their perceptions change. We hope that the findings from this first study can be used by educators and curriculum developers to help them design materials and pedagogical techniques that address students’ misconceptions and help them to develop an understanding of technology and engineering that is more robust and accurate. BIBLIOGRAPHY 1. Pearson, G. and T. Young, eds. Technically speaking: Why all Americans need to know
more about technology. 2002, National Academy Press: Washington, D.C. 2. Posner, G.J., et al., Accommodation of a scientific conception: Toward a theory of
conceptual change. Science Education, 1982. 66: p. 211-227. 3. Sadler, P.M., H.P. Coyle, and M. Schwartz, Engineering competitions in the middle
school classroom: Key elements in developing effective design challenges. Journal of the Learning Sciences, 2000. 9(3): p. 299-327.
4. Davis, R.S., I.S. Ginns, and C.J. McRobbie, Elementary school students' understandings of technology concepts. Journal of Technology Education, 2002. 14(1): p. 35-50.
5. Rose, L.C., et al., The second installment of the ITEA/Gallup poll and what it reveals as to how Americans think about technology. 2004, International Technology Education Association. p. 12.

Proceedings of the 2005 American Society for Engineering Education Annual Conference & Exposition Copyright © 2005, American Society for Engineering Education
6. Lewis, T., Research in technology education--Some areas of need. Journal of Technology Education, 1999. 10(2): p. 41-55.
7. Boser, R.A., J.D. Palmer, and M.K. Daugherty, Students attitudes toward technology in selected technology education programs. Journal of Technology Education, 1998. 10(1): p. 4-19.
8. Frehill, L.M., Education and occupational sex segregation: The decision to major in engineering. The Sociological Quarterly, 1997. 38(2): p. 225-249.
9. Wulf, W., The image of engineering. Issues in Science and Technology online, 1998. Winter 1998.
10. Davis, L.A. and R.D. Gibbons, eds. Raising public awareness of engineering. 2002, The National Academies Press: Washington, D.C.
11. Knight, M. and C.M. Cunningham. Draw an Engineer Test (DAET): Development of a tool to investigate students' ideas about engineers and engineering. in American Society of Engineering Education. 2004. Salt Lake City, UT.
12. Chambers, D.W., Stereotypic images of the scientist: The Draw-A-Scientist Test. Science Education, 1983. 67(2): p. 255-265.
13. Massachusetts Department of Education, Massachusetts science and technology/engineering curriculum framework. 2001, Massachusetts Department of Education: Malden, MA.

5
Engineering is Elementary © Museum of Science, Boston
Version 3/1/2005 Student Assessment Sheet
An engineer is a person who…_________________________________ _________________________________________________________ _________________________________________________________
What is an Engin e er? What kinds of work do engineers do? Circle the kinds of work tha t you think engineers do for their jobs.
Improve Machines
Supervise Construction
Set Up Factories
Construct Buildings
Drive Machines
Arrange Flowers
Read about Inventions
Design Ways to Clean Water
Work as a Team
Make Pizza
Install Wiring
Sell Food
Repair Cars
Design Things
Clean Teeth
Teach Children

3
Engineering is Elementary © Museum of Science, Boston
Version 3/1/2005 Student Assessment Sheet
What is Tech nology? Which of these things are examples of technology? Circle the items tha t you think are technology.
Shoes
Subway
Dandelions
Cellular Phone
Oak Tree
Bridge
Television
Cup
Pa r rot
Factory
Bandage
House
Power Lines
Bicycle
Lightning
Books
How do you know if something is technology? _________________________________________________________ _________________________________________________________ _________________________________________________________