Embed Size (px)
Citation preview

Catalase Assay: Extracts and Inhibitors
By Lucky Surendra, Farhan Rahman, and Samdeet Khan

Experimental SignificancePart I: Extracts
- The first part of the experiment was established to measure the catalase activity of various tissues and compare them across the board to determine consistent trends between different organisms.
Part II: Inhibitor
- In the second part of the experiment, we measured the effectiveness of varying concentrations of Triton X-100 in inhibiting catalase activity

CatalaseCatalase is an enzyme found in nearly all living organisms; it is responsible for catalyzing the breakdown of hydrogen peroxide into water and oxygen.
H2
02
itself is a harmful byproduct of many metabolic processes, which makes the role of catalase all the more important in functioning organisms.
Two stages:
1. H2
O2
+ Fe(III)-E → H2
O + O=Fe(IV)-E(.+) 2. H
2O
2 + O=Fe(IV)-E(.+) → H
2O + Fe(III)-E + O
2

History of Catalase1811: Louis Jacques Thenard upon discovering the presence of hydrogen peroxide suggested its breakdown is caused by an unnamed substance.
1900: Oscar Loew finally coined the term “catalase” after discovering its presence in many plants and animals.
1937-1938: James Sumner and Alexander Dounce crystallized beef liver catalase
and procured its molecular weight.
1981: The 3D structure of catalase was established.
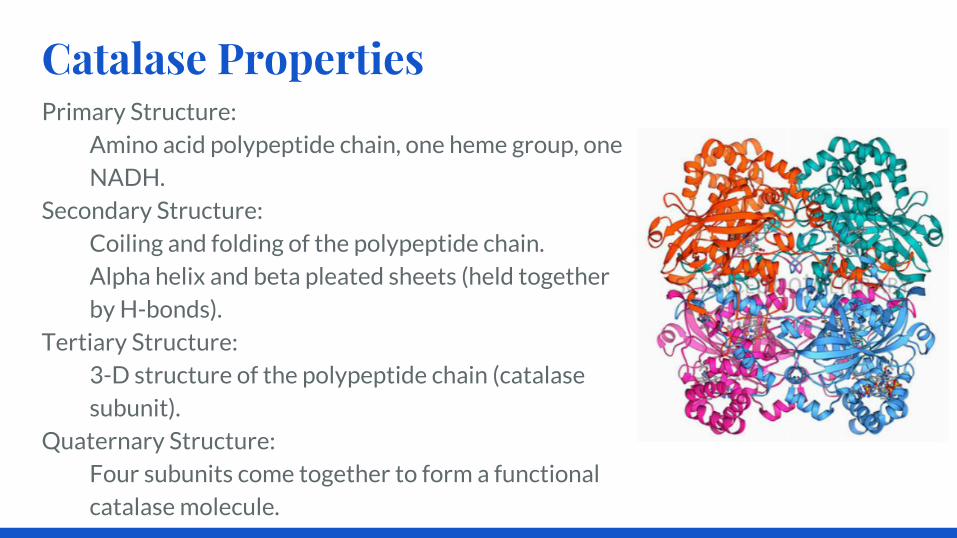
Catalase PropertiesPrimary Structure:
Amino acid polypeptide chain, one heme group, one NADH.
Secondary Structure:Coiling and folding of the polypeptide chain.Alpha helix and beta pleated sheets (held together by H-bonds).
Tertiary Structure:3-D structure of the polypeptide chain (catalase subunit).
Quaternary Structure:Four subunits come together to form a functional catalase molecule.

Catalase Properties ContinuedCatalase is a tetramer of four polypeptide chains composed of four heme groups which readily bind to hydrogen peroxide.
Each monomer of the catalase enzyme weighs about 57.5 kDA which means the entire molecule weighs close to 230 kDA.
In humans, the optimum condition for the catalase enzyme is at a pH of 7 and a
temperature of 37 degrees Celsius. These properties vary among different organisms depending on their environments.
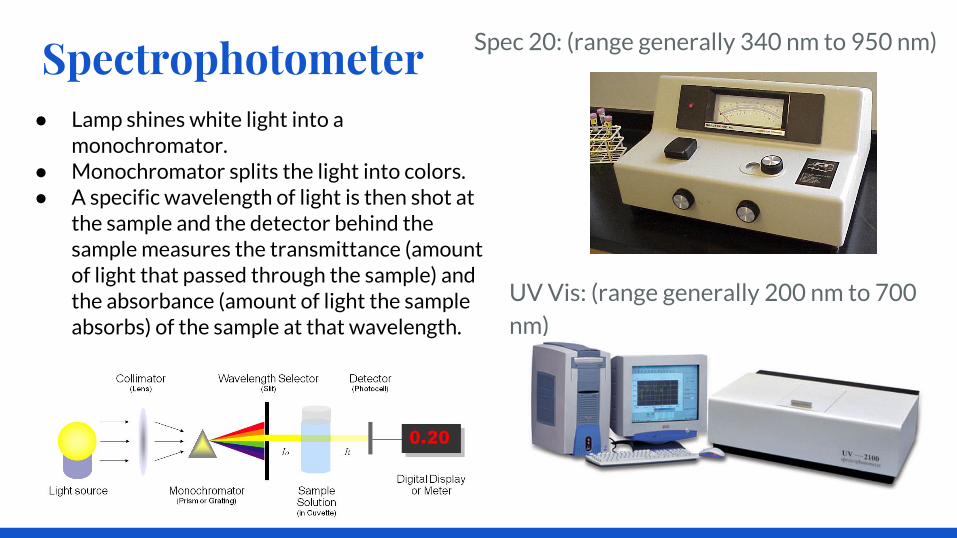
Spectrophotometer Spec 20: (range generally 340 nm to 950 nm)
UV Vis: (range generally 200 nm to 700 nm)
● Lamp shines white light into a monochromator.
● Monochromator splits the light into colors. ● A specific wavelength of light is then shot at
the sample and the detector behind the sample measures the transmittance (amount of light that passed through the sample) and the absorbance (amount of light the sample absorbs) of the sample at that wavelength.

Part I Measuring Catalase Activity
in Various Extracts

Extracts
Calf Liver Chicken Liver Gala Apple
Clementine Orange Lemon Leaf
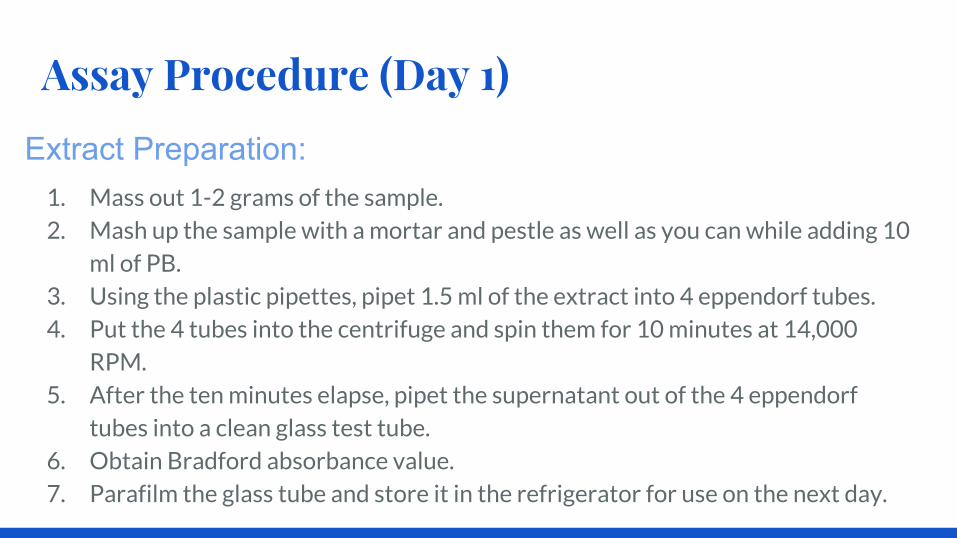
Assay Procedure (Day 1)
1. Mass out 1-2 grams of the sample.2. Mash up the sample with a mortar and pestle as well as you can while adding 10
ml of PB.3. Using the plastic pipettes, pipet 1.5 ml of the extract into 4 eppendorf tubes.4. Put the 4 tubes into the centrifuge and spin them for 10 minutes at 14,000
RPM.5. After the ten minutes elapse, pipet the supernatant out of the 4 eppendorf
tubes into a clean glass test tube.6. Obtain Bradford absorbance value.7. Parafilm the glass tube and store it in the refrigerator for use on the next day.
Extract Preparation:
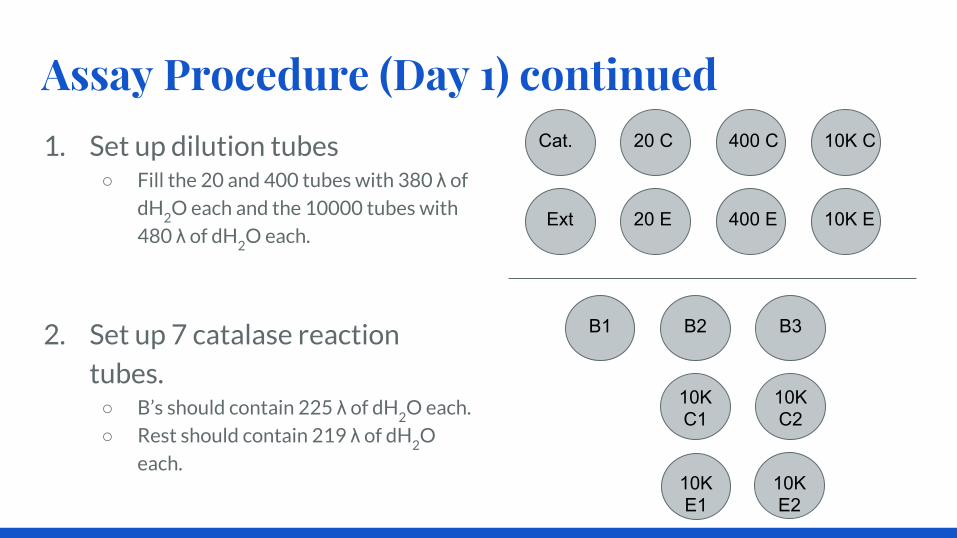
Assay Procedure (Day 1) continued1. Set up dilution tubes
○ Fill the 20 and 400 tubes with 380 λ of
dH2
O each and the 10000 tubes with
480 λ of dH2
O each.
2. Set up 7 catalase reaction
tubes.○ B’s should contain 225 λ of dH
2O each.
○ Rest should contain 219 λ of dH2
O
each.
400 C 10K C20 CCat.
400 E 10K E20 EExt
B1
10K C1
B2 B3
10K C2
10K E1
10K E2
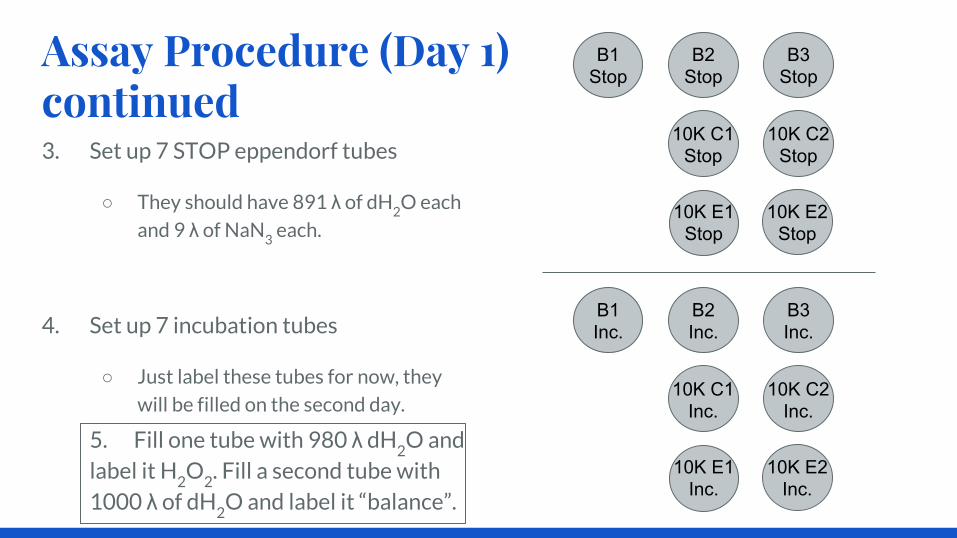
Assay Procedure (Day 1) continued3. Set up 7 STOP eppendorf tubes
○ They should have 891 λ of dH2
O each
and 9 λ of NaN3
each.
4. Set up 7 incubation tubes
○ Just label these tubes for now, they
will be filled on the second day.
B1Stop
10K C1Stop
B2Stop
B3Stop
10K C2Stop
10K E1Stop
10K E2Stop
B1Inc.
10K C1Inc.
B2Inc.
B3Inc.
10K C2Inc.
10K E1Inc.
10K E2Inc.
5. Fill one tube with 980 λ dH2
O and label it H
2O
2. Fill a second tube with
1000 λ of dH2
O and label it “balance”.

Assay Procedure (Day 2)1. One group member should prepare the dilutions.
Pipet 20 λ of catalase into the 20C dilution tube
and 20 λ of the extract supernatant into the 20E
dilution tube. Mix and bump. Then pipet 20 λ from
those tubes to their respective 400 tubes. Mix and
bump. Repeat with the 10000 tubes.
2. While dilutions are being made, have another
group member pipet 20 λ of H2
O2
into the H2
O2
tube. Mix and bump the tube against the balance
tube. Use the 1000 λ of dH2
O in the balance tube
to blank the UV Vis three times using a glass
cuvette, and measure the A240
of the H2
O2
dilution.
400 C 10K C20 CCat.
20 λ 20 λ 20 λ
400 E 10K E20 EExt
20 λ 20 λ 20 λ
20 EH2O2 Bottle
H2O2 Epp. Tube
20 λ
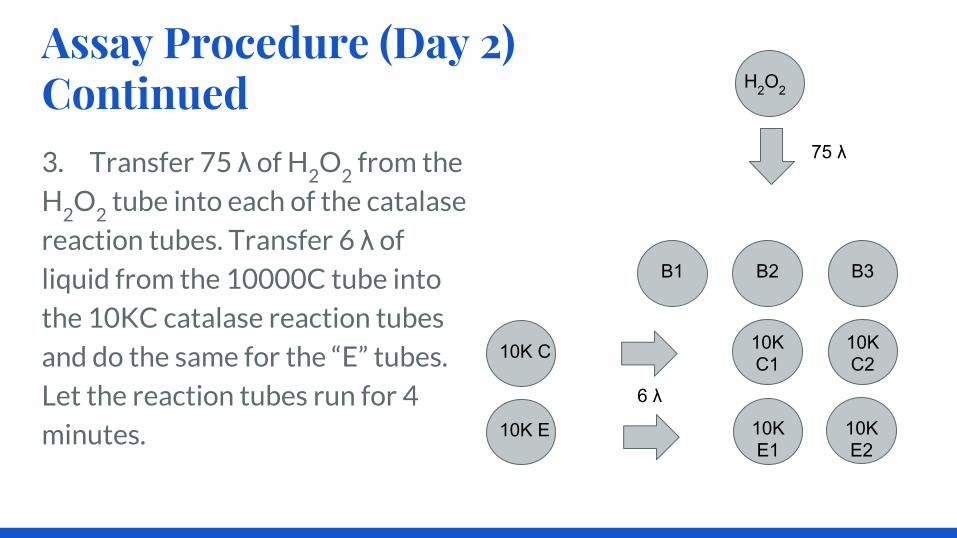
Assay Procedure (Day 2) Continued3. Transfer 75 λ of H
2O
2 from the
H2
O2
tube into each of the catalase
reaction tubes. Transfer 6 λ of
liquid from the 10000C tube into
the 10KC catalase reaction tubes
and do the same for the “E” tubes.
Let the reaction tubes run for 4
minutes.
B1
10K C1
B3
10K C2
10K E1
10K E2
10K C
10K E
B2
H2O2
75 λ
6 λ
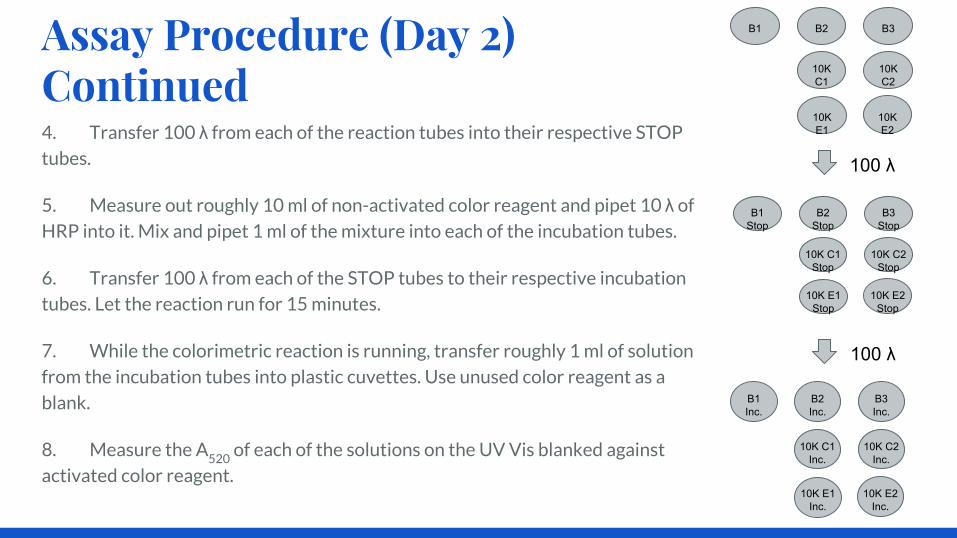
Assay Procedure (Day 2) Continued4. Transfer 100 λ from each of the reaction tubes into their respective STOP
tubes.
5. Measure out roughly 10 ml of non-activated color reagent and pipet 10 λ of
HRP into it. Mix and pipet 1 ml of the mixture into each of the incubation tubes.
6. Transfer 100 λ from each of the STOP tubes to their respective incubation
tubes. Let the reaction run for 15 minutes.
7. While the colorimetric reaction is running, transfer roughly 1 ml of solution
from the incubation tubes into plastic cuvettes. Use unused color reagent as a
blank.
8. Measure the A520
of each of the solutions on the UV Vis blanked against
activated color reagent.
B1
10K C1
B2 B3
10K C2
10K E1
10K E2
B1Stop
10K C1Stop
B2Stop
B3Stop
10K C2Stop
10K E1Stop
10K E2Stop
B1Inc.
10K C1Inc.
B2Inc.
B3Inc.
10K C2Inc.
10K E1Inc.
10K E2Inc.
100 λ
100 λ

How to Find Activity● Convert absorbances into micromoles of H
20
2.
○ H2O2 Standard Curve

How to Find Activity Continued● Perform these steps for both pure catalase and crude extract:
○ Find delta micromoles of H2
02
subtracting pure catalase or crude extract values from blank
values.
○ Calculate activity using this equation:
= Activity (micromoles H2
02
)/((ml)(min))
-->

How to Find Specific Activity
● Protein Quantitation (using Bradford)○ Using different concentrations of bovine serum albumin (BSA) in
water and Bradford reagent■ Dye creates a complex with the protein■ Can measure absorbance at 596 nm.
○ High End: y = 0.0076x + 0.5217
○ Low End: y = 1.9388x + 0.106
● Use equations to determine catalase concentration.

How to Find Specific Activity Continued
● Activity divided by protein concentration in mg/ml○ Pure Catalase: Given
○ Crude Extract: Bradford equations■ Chicken Liver and Calf Liver
● y = 0.0076x + 0.5217
■ Apple, Orange, and Lemon Leaf● y = 1.9388x + 0.106
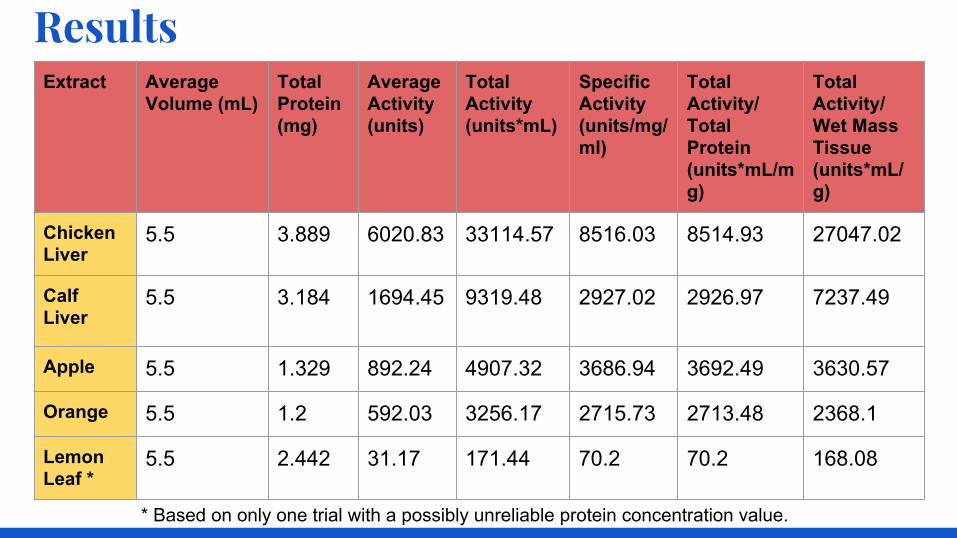
Results
* Based on only one trial with a possibly unreliable protein concentration value.
Extract Average Volume (mL)
Total Protein (mg)
Average Activity (units)
Total Activity (units*mL)
Specific Activity(units/mg/ml)
Total Activity/ Total Protein (units*mL/mg)
Total Activity/ Wet Mass Tissue (units*mL/g)
Chicken Liver
5.5 3.889 6020.83 33114.57 8516.03 8514.93 27047.02
Calf Liver
5.5 3.184 1694.45 9319.48 2927.02 2926.97 7237.49
Apple 5.5 1.329 892.24 4907.32 3686.94 3692.49 3630.57
Orange 5.5 1.2 592.03 3256.17 2715.73 2713.48 2368.1
Lemon Leaf *
5.5 2.442 31.17 171.44 70.2 70.2 168.08
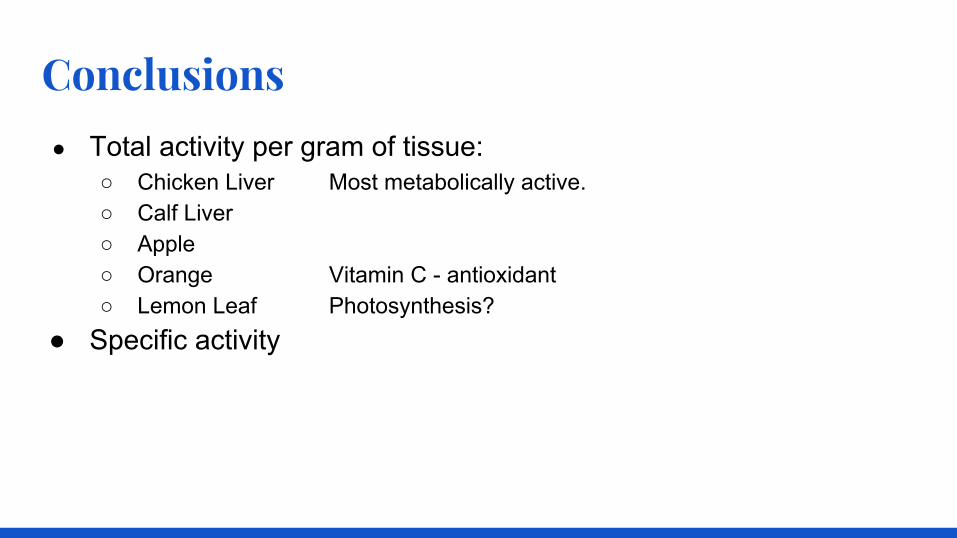
Conclusions● Total activity per gram of tissue:
○ Chicken Liver Most metabolically active.○ Calf Liver○ Apple ○ Orange Vitamin C - antioxidant○ Lemon Leaf Photosynthesis?
● Specific activity

Part IIEffects of Triton X-100
Inhibitor on Catalase
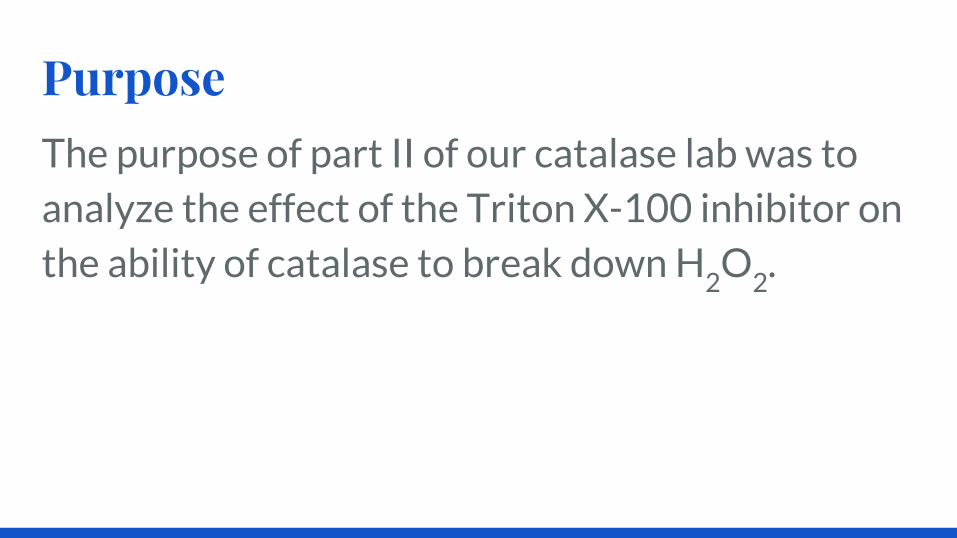
PurposeThe purpose of part II of our catalase lab was to analyze the effect of the Triton X-100 inhibitor on the ability of catalase to break down H
2O
2.

History of Triton X-100● Triton X-100 was originally a registered trademark of Rohm &
Haas Co.
● It was then purchased by Union Carbide and then acquired by Dow
Chemical Company
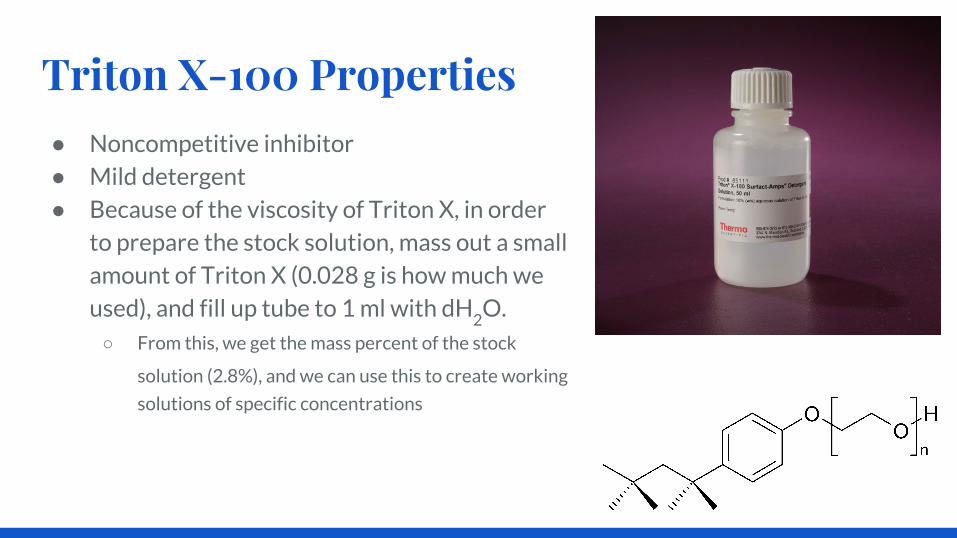
Triton X-100 Properties● Noncompetitive inhibitor● Mild detergent● Because of the viscosity of Triton X, in order
to prepare the stock solution, mass out a small amount of Triton X (0.028 g is how much we used), and fill up tube to 1 ml with dH
2O.
○ From this, we get the mass percent of the stock
solution (2.8%), and we can use this to create working
solutions of specific concentrations

Assay Procedure (Day 1)● Set up tubes
● Pretty much the same as the Catalase assay, but with a few
modifications:○ No longer have dilution tubes for extract.○ Replace extract experimental tubes with inhibitor experimental tubes.○ Add specific concentrations of Triton X-100 to the different inhibitor
reaction tubes.■ 0.1%, 0.3%, 0.5%, 0.7%, 0.9%

Assay Procedure (Day 1) continued● Calculate % mass:
■ (0.028/1) x 100% = 2.8%○ Use this stock solution to make your inhibitor reaction tubes of specific % masses:
■ (x)(2.8) = (0.1)(300 λ)● x = 10.7 λ
● Adding Triton X-100 to inhibitor reaction tubes○ Add the calculated amount of Triton X-100○ Volume of Triton X-100 + Volume of dH
2O = 219 λ
■ Subtract volume of Triton X-100 from the original 219 λ dH2
O, and add the resulting volume of dH
2O to the reaction tube.

Assay Procedure (Day 2)● Carry out the same procedure as the catalase assay with the few
modifications indicated on the previous slides.
● We did two % masses for the first two trials and one % mass for the
third trial.
● Extra measures taken to ensure relatively reliable results:○ We conducted all the trials during the same week so that the concentration
of catalase would remain constant.○ The absorbances of H
2O
2 varied slightly for each of the three trials, but we
tried to keep them as constant as possible and managed to keep the absorbances at around 0.66.
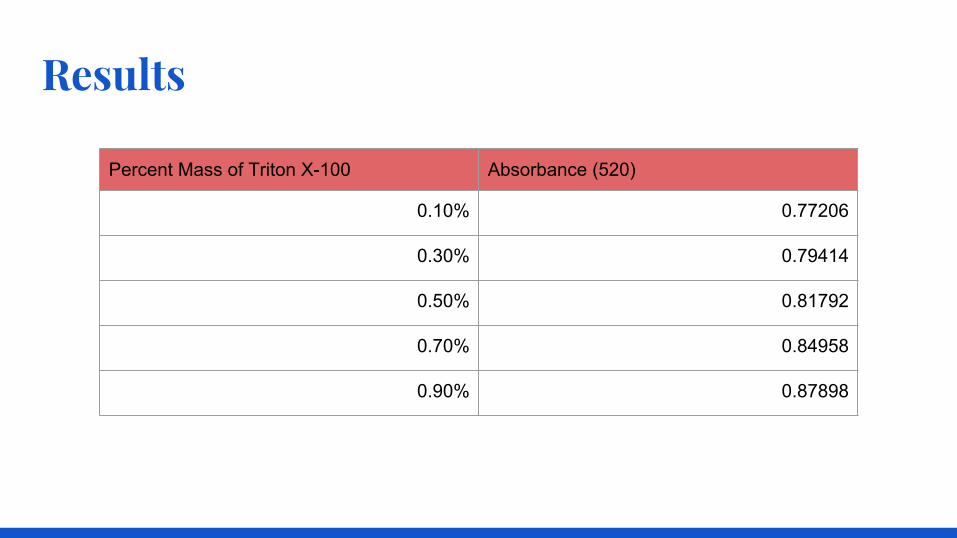
Results
Percent Mass of Triton X-100 Absorbance (520)
0.10% 0.77206
0.30% 0.79414
0.50% 0.81792
0.70% 0.84958
0.90% 0.87898

Results

Conclusions● Upward trend in absorbances
○ More H2
O2
is present due to inhibition of catalase.
○ Triton X-100 does in fact inhibit catalase.
● Data does not completely match published results
○ Our Triton X-100 tubes’ absorbances
were not usually the same as our Blank
tubes’ absorbances.
○ Variation could be due to sources of
error.

Sources of Error● Contamination
○ Scalpel
○ Tip of pipet
● Not reacting for exactly 4 minutes● Low-end Bradford curve● Time pressure
○ Forgetting to mix and bump
○ Forgetting to add H2O2
● Pipetting!
Acknowledgements
● We’d like to thank:○ Dr. Pete for teaching us all the Chemistry we know, helping us plan out our
procedures and make sense of our results, preparing the catalase and color reagent every day, making a very low-end Bradford curve for us to use, and providing some of his own lab equipment.
○ BASIS Chandler for providing us with facilities and equipment.○ Ms. Terrell for assisting in the lab.

Referenceshttp://fg.cns.utexas.edu/fg/course_notebook_appendix_ii_files/Spectronic_20_D.pdf
http://chemwiki.ucdavis.
edu/Organic_Chemistry/Organic_Chemistry_With_a_Biological_Emphasis/Chapter_04%
3A_Structure_Determination_I/Section_4.3%3A_Ultraviolet_and_visible_spectroscopy
http://earth.callutheran.
edu/Academic_Programs/Departments/BioDev/omm/catalase/frames/cattx.htm
http://www.ncbi.nlm.nih.gov/pubmed/17325747
https://umm.edu/health/medical/altmed/supplement/vitamin-c-ascorbic-acid
http://citeseerx.ist.psu.edu/viewdoc/download?doi=10.1.1.416.301&rep=rep1&type=pdf


![Catalase - Saylor · PDF fileCatalase is used in the food industry for removing hydrogen peroxide from milk prior to cheese production.[128] Another use is in food wrappers where it](https://img.dokumen.tips/doc/110x75/5abca5c47f8b9a441d8e5428/catalase-saylor-is-used-in-the-food-industry-for-removing-hydrogen-peroxide-from.jpg)