Embed Size (px)
Citation preview
1
i ASEAN Regional RVA: Guidelines for Implementation
CONTRIBUTING AUTHORS AND ACKNOWLEDGMENTS
Heather Bell
Director of Applied Science
Pacific Disaster Center
Doug Bausch
Science Advisor
Pacific Disaster Center
Daniel Morath
Senior Disaster Risk Analyst
Pacific Disaster Center
John Livengood
Geospatial Information Specialist
Pacific Disaster Center
ACKNOWLEDGMENTS: These Guidelines were developed in consultation and collaboration with
representatives of ASEAN Member States, the ASEAN Secretariat, the ASEAN Partnership Group, and the
AHA Centre. Particular thanks are extended to the technical officers from the Working Group on Risk
Assessment and Awareness.
The ASEAN Regional Risk and Vulnerability Assessment (RVA) Guidelines for Implementation were made
possible through the United States Agency for International Development (USAID) and the support of
the American people. The contents of the Guidelines were obtained from consultation and discussions with the members of the ASEAN Committee on Disaster Management Working Group on Risk
Assessment and Awareness. They do not necessarily reflect the views of USAID or the United States
Government.
ii ASEAN Regional RVA: Guidelines for Implementation
ACRONYMS
AADMER ASEAN Agreement on Disaster Management and Emergency Response
ABS Absolute value
AHA Centre ASEAN Centre for the Coordination of Humanitarian Assistance
AMS Association of Southeast Asian Nations (ASEAN) Member States
ASEAN Association of Southeast Asian Nations
CHRR Center for Hazards and Risk Research
CIESIN Center for International Earth Science and Information Network
DMRS Disaster Monitoring and Response System
DRG Disaster Risk Governance
DRR Disaster Risk Reduction
DRM Disaster Risk Management
DRMC Disaster Risk Management Capacity
EM-DAT Emergency Events Database
ESA European Space Agency
FAO Food and Agriculture Organization of the United Nations
GAR Global Assessment Report on Disaster Risk Reduction
GAUL Global Administrative Unit Layers
GDP Gross Domestic Product
GIS Geographic Information Systems
GPW Gridded Population of the World
HFA Hyogo Framework for Action
IFRC International Federation of Red Cross and Red Crescent Societies
LGSAT Local Government Self Assessment Tool
LR Lack of Resilience
iii ASEAN Regional RVA: Guidelines for Implementation
MDG Millennium Development Goals
MHE Multi-hazard Exposure
MMI Modified Mercalli Intensity
NDMO National Disaster Management Organization
PDC Pacific Disaster Center
RAA Risk Assessment and Awareness
RAEWM Risk Assessment, Early Warning and Monitoring
RVA Risk and Vulnerability Assessment
SFDRR Sendai Framework for Disaster Risk Reduction
SDG Sustainable Development Goals
UN United Nations
UNDP United Nations Development Programme
UN-ISDR United Nations International Strategy for Disaster Reduction
WG Working Group
WRI World Resources Institute
iv ASEAN Regional RVA: Guidelines for Implementation
CONTENTS
Acronyms ...................................................................................................................................................... ii
1. Introduction .............................................................................................................................................. 1
Purpose and Structure .............................................................................................................................. 1
Background ............................................................................................................................................... 1
General Goals ............................................................................................................................................ 4
Resource Allocation Must Address More than Response ..................................................................... 4
2. Concepts and Framework ......................................................................................................................... 5
Risk Assessment ........................................................................................................................................ 5
Developing the Framework ....................................................................................................................... 7
Scale and Resolution ............................................................................................................................. 8
Definitions ............................................................................................................................................. 8
Conceptualization ............................................................................................................................... 10
General Methods ................................................................................................................................ 11
Representation and Reporting ............................................................................................................ 11
3. Data Supporting Decision Making and Assessment ................................................................................ 13
Hazard Data ............................................................................................................................................. 13
Elements of Interest ................................................................................................................................ 15
Data for Monitoring Vulnerability ........................................................................................................... 18
Data for Monitoring Disaster Risk Management Capacity ..................................................................... 21
4. Constructing the Societal Risk Index ....................................................................................................... 25
General Steps for Constructing Composite Indices ................................................................................ 25
Step 1: Conceptual Framework ........................................................................................................... 25
Step 2: Data Collection ........................................................................................................................ 25
Step 3: Missing Data ........................................................................................................................... 26
Step 4: Derivation ............................................................................................................................... 26
Step 5: Scaling ..................................................................................................................................... 26
Step 6: Aggregation ............................................................................................................................. 28
The ASEAN RVA Template and Interoperability...................................................................................... 28
The Multi-hazard Exposure Index ........................................................................................................... 30

v ASEAN Regional RVA: Guidelines for Implementation
The Vulnerability Index ........................................................................................................................... 32
The Disaster Risk Management Capacity Index ...................................................................................... 34
Assessing Societal Risk ............................................................................................................................ 36
Visualization ............................................................................................................................................ 36
Appendix A: Local Government Assessment Tool (LGSAT) ......................................................................... 38
Appendix B: List of References ................................................................................................................... 57
1 ASEAN Regional RVA: Guidelines for Implementation
1. INTRODUCTION
PURPOSE AND STRUCTURE
The purpose of this document is to provide high level guidance to the National Disaster Management
Organizations (NDMOs) of Association of Southeast Asian Nations (ASEAN) Member States (AMS) on the
implementation of a regionally consistent approach to Risk and Vulnerability Assessment (RVA) at the
national level. It is not intended as a training manual.
The Guidelines comprise one of three documents related to ASEAN Regional RVA. The others include a
summary for policy makers and a supplementary handbook containing additional detail and materials
supporting RVA implementation within ASEAN. Auxiliary resources include an Excel template that will
facilitate data management and calculation of the Societal Risk Index described in the Guidelines, as well
as an exercise manual that leads users through several key steps of the assessment process.
It is assumed that users of these Guidelines have moderate familiarity with and access to Excel (or a
similar spreadsheet program) and some form of Geographic Information Systems (GIS) software (e.g.,
ArcGIS or QGIS). All basic data management and analyses outlined here can be performed on a personal
computer. However, the institutional and technical requirements associated with collecting, managing,
storing, analyzing, and disseminating the underlying data are much greater. More advanced analyses will
also require specialized software and technical capacity.
This document is made up of four major sections. The first provides background and outlines the general
goals of the Regional RVA. The second describes the concepts and framework which underpin the
Guidelines. The third highlights data that support analysis and decision making across multiple phases
and communities of practice. The fourth outlines the data, methods, and specific calculations that will
be employed in the construction of a Societal Risk Index.
BACKGROUND
RVA is recognized by the United Nations International Strategy for Disaster Reduction (UN-ISDR) as one
of the most important elements of long-term Disaster Risk Reduction (DRR) and Disaster Risk
Management (DRM). RVA is prominent in the Hyogo Framework of Action (HFA) 2005-2015 and further
emphasized in the Sendai Framework for Disaster Risk Reduction (SFDRR). Within the regional context,
the former recommends “development of methodologies and standards for hazard and vulnerability
monitoring and assessment” and “undertaking and publishing regional and sub-regional baseline
assessments.” Regional contributions related to coordination and guidance are also highlighted in the
Sendai Framework. The Sendai Framework emphasizes the importance of collecting, managing, sharing,
analyzing, and applying appropriate risk information for improved decision making and outcomes and
shifts focus to addressing the multi-dimensional drivers of risk.
Affirming ASEAN’s commitment to the Hyogo Framework of Action (HFA) for disaster risk reduction, the
ASEAN Agreement on Disaster Management and Emergency Response (AADMER) sets “a regional
2 ASEAN Regional RVA: Guidelines for Implementation
framework for cooperation, coordination, technical assistance, and resource mobilization in all aspects
of disaster management.”1 This agreement was ratified by all ten (10) Member States and entered into
force on 24 December 2009. In AADMER, risk assessment is viewed as a necessary step in identifying
risks, devising mitigation strategies, and ultimately reducing disaster losses. Highlighted here are a few
specific Articles of AADMER to help demonstrate the policy background and rationale for the approach.
AADMER Article 2 establishes the objective of the Agreement “to provide effective mechanisms to
achieve substantial reduction of disaster losses in lives and in the social, economic and environmental
assets of the Parties” while Article 3.4 clearly prioritizes “prevention and mitigation.” These two Articles
provide the context for Article 4.a, which sets “identification of disaster risk” and “development of
monitoring, assessment and early warning systems” as explicit General Obligations of the Parties.
AADMER Part II, Article 5.1, specifically outlines responsibilities related to risk identification and
assessment: identifying hazards, conducting risk assessment, and monitoring vulnerabilities and disaster
management capacities. While these assessments are of primary benefit to the Member States
themselves, AADMER highlights regional responsibilities as well. For example, in section 5.3, each Party
(AMS) is to “ensure that its National Focal Point, at agreed regular intervals, communicates the above
information” to the authorities designated by the Agreement. Finally, in section 5.4, the Article
highlights consolidation and integration of the results, while considering the need to “conduct analysis
on possible regional-level implications,” which would also benefit AMS. HFA and Article 5 of AADMER
motivate development of regionally consistent national level assessment guidelines to help establish
consistent methodologies, methods, measurements, and data that can facilitate decision making at both
the national and regional levels.
1 http://www.asean.org/resources/publications/asean-publications/item/asean-agreement-on-disaster-management-and-emergency-response-aadmer-work-programme-2010-2015-4th-reprint
3 ASEAN Regional RVA: Guidelines for Implementation
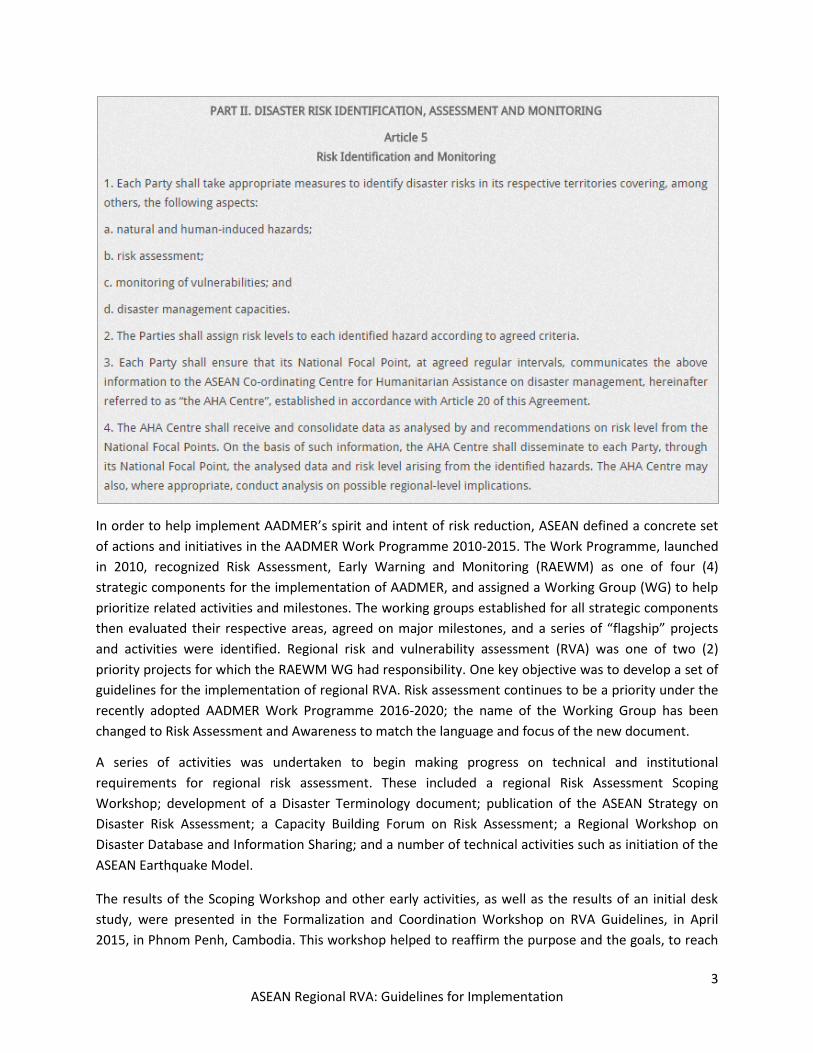
In order to help implement AADMER’s spirit and intent of risk reduction, ASEAN defined a concrete set
of actions and initiatives in the AADMER Work Programme 2010-2015. The Work Programme, launched
in 2010, recognized Risk Assessment, Early Warning and Monitoring (RAEWM) as one of four (4)
strategic components for the implementation of AADMER, and assigned a Working Group (WG) to help
prioritize related activities and milestones. The working groups established for all strategic components
then evaluated their respective areas, agreed on major milestones, and a series of “flagship” projects
and activities were identified. Regional risk and vulnerability assessment (RVA) was one of two (2)
priority projects for which the RAEWM WG had responsibility. One key objective was to develop a set of
guidelines for the implementation of regional RVA. Risk assessment continues to be a priority under the
recently adopted AADMER Work Programme 2016-2020; the name of the Working Group has been
changed to Risk Assessment and Awareness to match the language and focus of the new document.
A series of activities was undertaken to begin making progress on technical and institutional
requirements for regional risk assessment. These included a regional Risk Assessment Scoping
Workshop; development of a Disaster Terminology document; publication of the ASEAN Strategy on
Disaster Risk Assessment; a Capacity Building Forum on Risk Assessment; a Regional Workshop on
Disaster Database and Information Sharing; and a number of technical activities such as initiation of the
ASEAN Earthquake Model.
The results of the Scoping Workshop and other early activities, as well as the results of an initial desk
study, were presented in the Formalization and Coordination Workshop on RVA Guidelines, in April
2015, in Phnom Penh, Cambodia. This workshop helped to reaffirm the purpose and the goals, to reach
4 ASEAN Regional RVA: Guidelines for Implementation
consensus on key themes and priorities, and to establish the principles for the guidelines. The
Formalization Workshop also served as a conduit to gather more complete information on capabilities,
constraints, and priorities related to data, methods and tools, applications, and institutional
mechanisms. The Formalization Workshop, in addition to surveys and a desk study, provided inputs to a
gap analysis.
The gap analysis was used to develop preliminary recommendations on the approach, data, outputs,
and institutional mechanisms required to implement a reasonable, useful, and consistent RVA. The gap
analysis and preliminary recommendations were presented at a second Workshop on Regional RVA
Guidelines. This provided an opportunity to gather additional input from AMS, the AHA Centre, the
ASEAN Secretariat, and other regional stakeholders on constraints, practices, and priorities.
Representatives of NDMOs from all AMS but Singapore participated in at least one of the workshops.
Most attended both.
Guidelines in this document were developed considering input from all of the above activities and
participating bodies.
GENERAL GOALS
The purposes and goals of the Regional Risk Assessment were captured in the ASEAN Strategy on
Disaster Risk Assessment and confirmed at the Formalization Workshop.
At the regional level, these included:
Supporting cross-boundary response planning;
Helping to anticipate potential impacts and relative ability to cope at the national level;
Helping to identify high risk areas; and
Supporting cross-boundary risk governance initiatives.
At the national level, these included:
Providing a starting point for national assessment and disaster risk information initiatives;
Helping to anticipate potential impacts and relative ability to cope at the subnational level; and
Supporting prioritization and resource allocation.
At the community level, the identified purpose was to encourage consistent and actionable local-level
assessments.
RESOURCE ALLOCATION MUST ADDRESS MORE THAN RESPONSE
NDMOs are the primary audience for these guidelines. At the national level, “supporting prioritization
and resource allocation” is conceived of broadly, applying to planning and implementation activities in
all phases of Disaster Risk Management and across communities of practice. RVA is seen as a means by
which to enhance decision making processes and outcomes by facilitating access and application of
relevant information. Information deemed “relevant” or “high priority” for decision makers spanned
physical, social, economic, institutional, and environmental dimensions.
5 ASEAN Regional RVA: Guidelines for Implementation
2. CONCEPTS AND FRAMEWORK
RISK ASSESSMENT
UN-ISDR has defined risk assessment as “A methodology to determine the nature and extent of risk by
analyzing potential hazards and evaluating existing conditions of vulnerability that together could
potentially harm exposed people, property, services, livelihoods and the environment on which they
depend.” Risk assessments, and associated assessments of exposure, vulnerability, and various
capacities provide evidence for decision making when considering mitigation and development
strategies, and when planning and implementing preparedness, response, and recovery activities. The
risk and vulnerability assessment (RVA) process focuses attention on areas most in need by evaluating to
what extent mortality, economic losses, general disruption, and secondary impacts may occur.
Data and results obtained during the risk assessment process can help identify service and infrastructure
gaps, develop realistic exercise scenarios, deliver appropriate help to those who are likely to need it
most, serve as a baseline for monitoring development and recovery activities, and identify the most
effective structural and non-structural mitigation measures. The RVA process provides context and
visibility, and can help describe how future events might unfold and what intervention points might be
most effective in reducing losses and suffering.
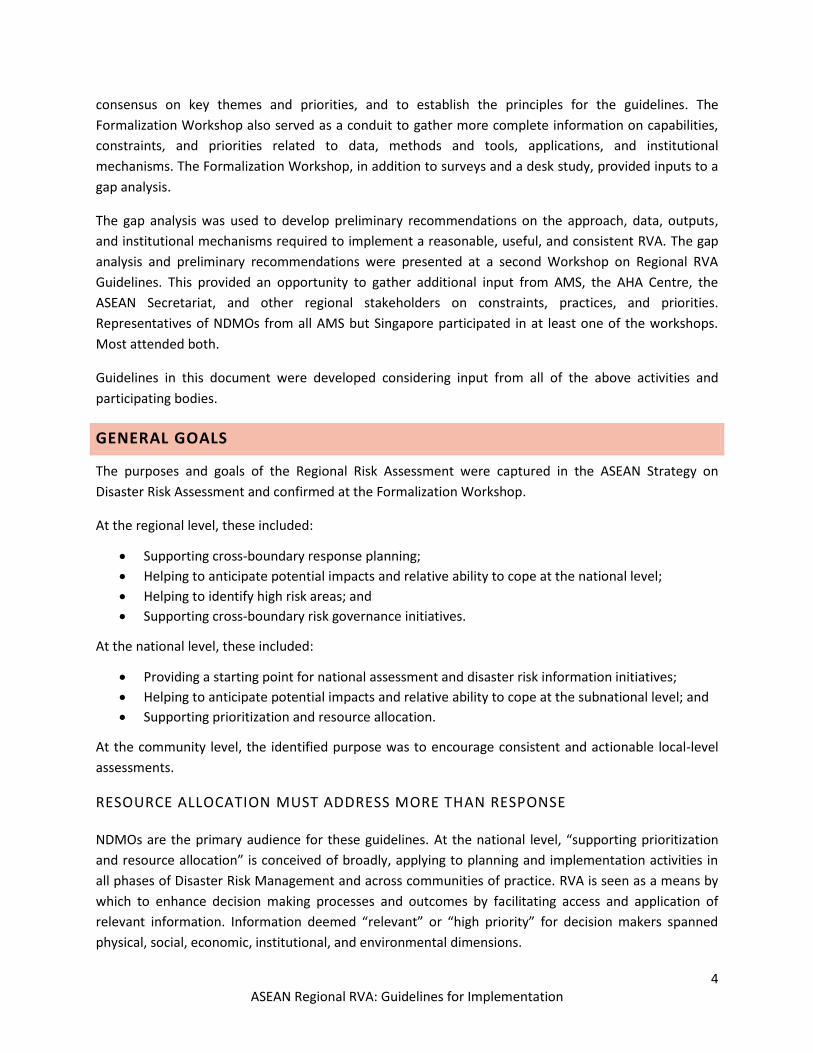
Disasters can be defined in a variety of ways and depend on the level of analysis. What is a disaster for a
community may not greatly affect a nation as a whole. At the most basic level, disasters are the result of
a hazardous set of conditions coming into contact with a set of elements that are susceptible to negative
impacts associated with that hazard. For communities or societies, disasters occur when impacts cause
disruption that cannot be addressed through internal capacities. Figure 1 provides a basic illustration of
the components of disaster. The risk and vulnerability assessment process may examine each of these
components individually and then in combination.
In general, the assessment process may include:
Review of the location, intensity, frequency, and probability of hazards to which the region or
community is susceptible;
Analysis of exposure and vulnerability including the physical, social, health, economic, and
environmental dimensions;
Evaluation of the effectiveness of prevailing and alternative coping capacities in respect to likely
risk scenarios2; and
The potential losses and patterns of disruption that will ultimately drive mitigation strategies
and priorities, and what AMS should plan for in order to address future disaster impacts.
2 Adapted from ASEAN Disaster Terminology document and UN-ISDR Terminology on Disaster Risk Reduction: http://www.unisdr.org/we/inform/terminology
6 ASEAN Regional RVA: Guidelines for Implementation
Figure 1: Basic components of disaster
However, there are a broad range of assessment types, from qualitative profiling to sophisticated loss-
estimation analyses; each requires a different level of input and technical capacity. Assessments can be
performed for facilities, systems, sectors, or communities. Which approach is chosen depends largely on
the purpose and constraints. An RVA may include phases, where the phase 1 effort is broad and helps
identify priorities or focus-areas for additional phases of work. Before launching an RVA effort, a
planning stage can be used to assess resource and data availability, as well as to determine the goals
and intended applications of the RVA and to develop a realistic and feasible approach.
Three basic types of assessments are outlined below.
Probabilistic. This approach generally requires the most significant level of effort, incorporating a
systematic and comprehensive quantitative methodology that considers the possible combinations of
event occurrences with associated consequences, each with an associated probability3. The results of a
probabilistic assessment are commonly applied to cost-benefit analyses and other specific financial
evaluations. Probability data and associated analyses can be adapted to multiple timeframes (e.g.,
annual or the lifetime of a proposed improvement project), and so are very flexible in their application.
Probabilistic RVA can be challenging since hazard frequency or intensity data may not be comprehensive
and often represent relatively small timeframes, introducing significant uncertainty. Additionally,
localized exposure databases and damage relationships may not be developed. Methods are available to
3 Adapted from ASEAN Disaster Terminology document and US Department of Homeland Security Risk Lexicon, 2010 Edition: https://www.dhs.gov/xlibrary/assets/dhs-risk-lexicon-2010.pdf
7 ASEAN Regional RVA: Guidelines for Implementation
incorporate uncertainty into the results and provide a potential range of losses. Depending on the
application, the level of effort may be warranted.
Scenario Based. This type of RVA typically incorporates a “what-if” scenario. The scenario might be
based on a historical event or selected based on probabilistic analysis. Scenario based assessments are
most often applied within exercise or planning contexts. Inputs and outputs of scenario based
assessments are generally understood by a wide range of stakeholders. When realistic and sound
scenarios are selected, the information is widely applicable; there are frequent cases where the “what
if” scenario occurs and the estimated impacts become real. Scenario based RVAs also help address data
gaps. For example, where a small incomplete set of historic events does not support evaluation of
frequency or implementation of a probabilistic analysis, a single event is all that is needed for an
actionable scenario based RVA.
Composite Index. Composite indices are created by selecting sets of variables that represent general
concepts (e.g., access to information, health status, or strength of governance). The individual variables,
or “indicators,” are then scaled to a standardized value range (e.g., 0-1 or 1-100) so they can be
mathematically combined into a relative measure of the theme of interest. Composite indices can be
created at multiple levels (e.g., household, community, province, country) and are generally used for
unit comparisons within a specific context. While the approach has limitations and is not used for
precise financial decisions such as cost-benefit analyses or insurance schemes, composite indices can
help make contextual information more visible within decision making processes and facilitate
monitoring, comparison, communication, and the prioritization of investment. When disaggregated,
composite indices enable the potential drivers behind similar final “scores” to be examined.
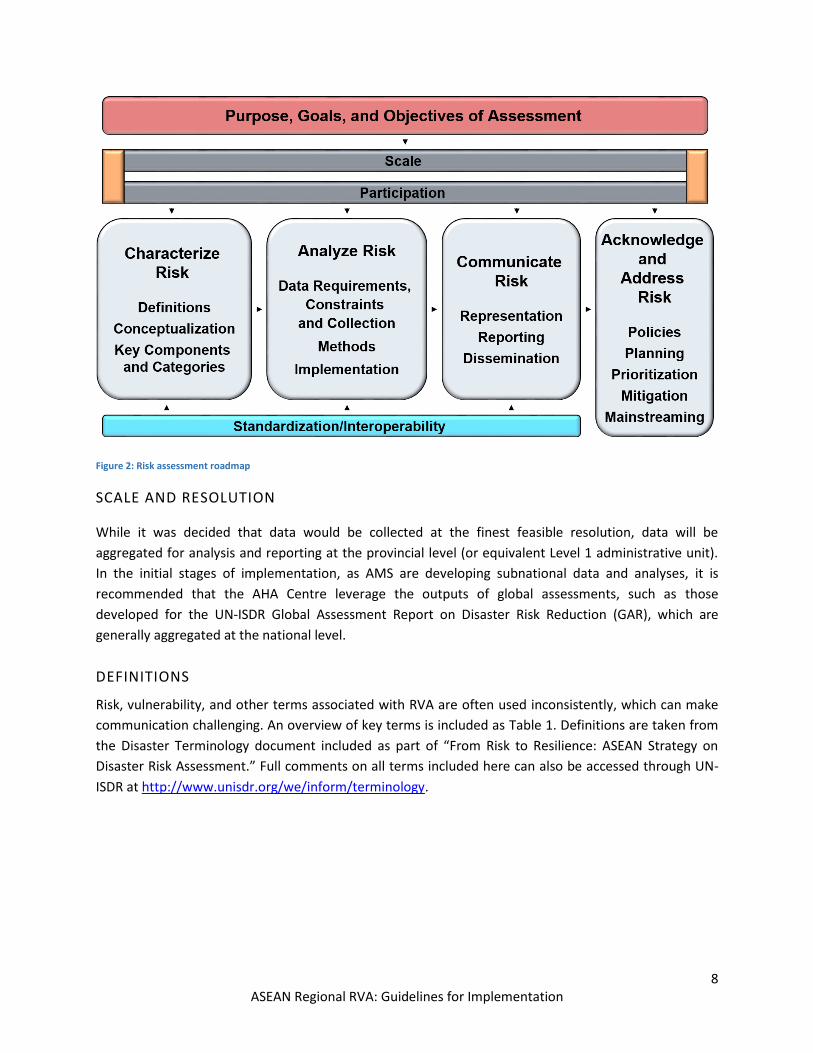
DEVELOPING THE FRAMEWORK
Deciding on the specifics of an approach to RVA can be challenging. Figure 2 illustrates the major
considerations in the decision making process. Each choice affects what options are available at the next
stage. These Guidelines represent the result of a collaborative process and address each of the
considerations depicted below, at least in part. The goals and participants in the process were outlined
in Section 1. Scale and resolution, the conceptualization of risk, as well as basic methods and outputs
selected are discussed below. Additional information on data, analysis methods, reporting, and
interoperability are discussed in more detail in subsequent sections.
8 ASEAN Regional RVA: Guidelines for Implementation
Figure 2: Risk assessment roadmap
SCALE AND RESOLUTION
While it was decided that data would be collected at the finest feasible resolution, data will be
aggregated for analysis and reporting at the provincial level (or equivalent Level 1 administrative unit).
In the initial stages of implementation, as AMS are developing subnational data and analyses, it is
recommended that the AHA Centre leverage the outputs of global assessments, such as those
developed for the UN-ISDR Global Assessment Report on Disaster Risk Reduction (GAR), which are
generally aggregated at the national level.
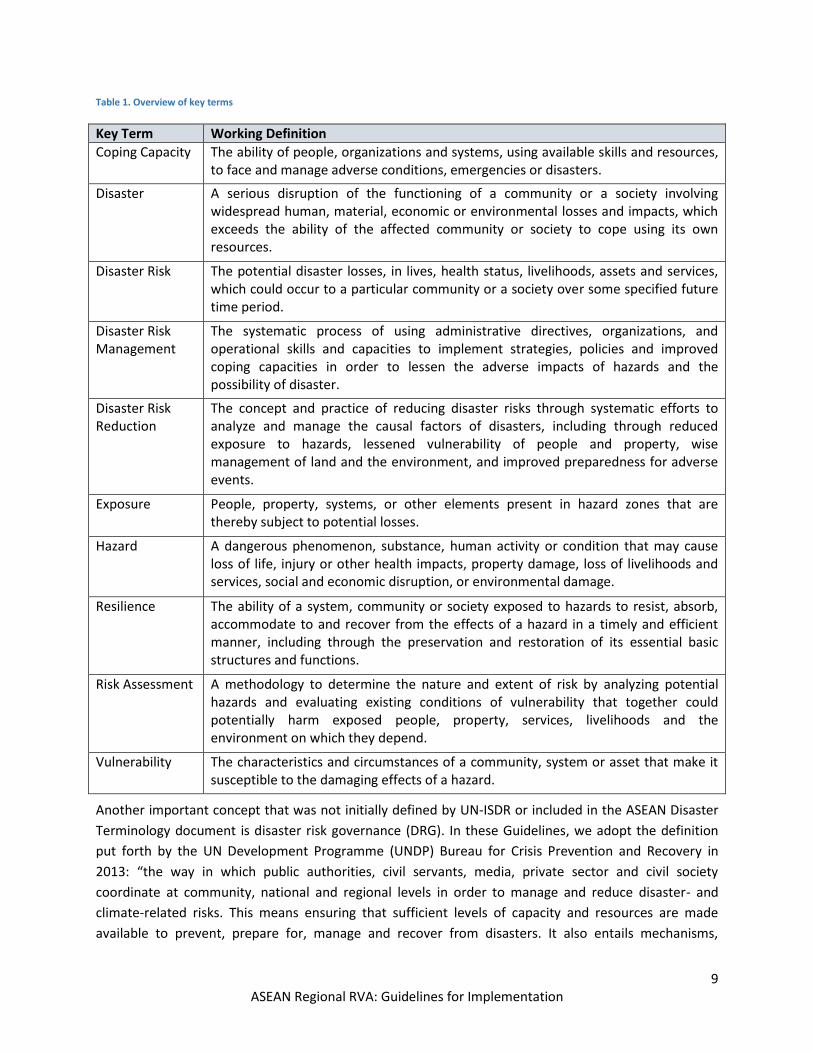
DEFINITIONS
Risk, vulnerability, and other terms associated with RVA are often used inconsistently, which can make
communication challenging. An overview of key terms is included as Table 1. Definitions are taken from
the Disaster Terminology document included as part of “From Risk to Resilience: ASEAN Strategy on
Disaster Risk Assessment.” Full comments on all terms included here can also be accessed through UN-
ISDR at http://www.unisdr.org/we/inform/terminology.
9 ASEAN Regional RVA: Guidelines for Implementation
Table 1. Overview of key terms
Key Term Working Definition
Coping Capacity The ability of people, organizations and systems, using available skills and resources, to face and manage adverse conditions, emergencies or disasters.
Disaster A serious disruption of the functioning of a community or a society involving widespread human, material, economic or environmental losses and impacts, which exceeds the ability of the affected community or society to cope using its own resources.
Disaster Risk The potential disaster losses, in lives, health status, livelihoods, assets and services, which could occur to a particular community or a society over some specified future time period.
Disaster Risk Management
The systematic process of using administrative directives, organizations, and operational skills and capacities to implement strategies, policies and improved coping capacities in order to lessen the adverse impacts of hazards and the possibility of disaster.
Disaster Risk Reduction
The concept and practice of reducing disaster risks through systematic efforts to analyze and manage the causal factors of disasters, including through reduced exposure to hazards, lessened vulnerability of people and property, wise management of land and the environment, and improved preparedness for adverse events.
Exposure People, property, systems, or other elements present in hazard zones that are thereby subject to potential losses.
Hazard A dangerous phenomenon, substance, human activity or condition that may cause loss of life, injury or other health impacts, property damage, loss of livelihoods and services, social and economic disruption, or environmental damage.
Resilience The ability of a system, community or society exposed to hazards to resist, absorb, accommodate to and recover from the effects of a hazard in a timely and efficient manner, including through the preservation and restoration of its essential basic structures and functions.
Risk Assessment A methodology to determine the nature and extent of risk by analyzing potential hazards and evaluating existing conditions of vulnerability that together could potentially harm exposed people, property, services, livelihoods and the environment on which they depend.
Vulnerability The characteristics and circumstances of a community, system or asset that make it susceptible to the damaging effects of a hazard.
Another important concept that was not initially defined by UN-ISDR or included in the ASEAN Disaster
Terminology document is disaster risk governance (DRG). In these Guidelines, we adopt the definition
put forth by the UN Development Programme (UNDP) Bureau for Crisis Prevention and Recovery in
2013: “the way in which public authorities, civil servants, media, private sector and civil society
coordinate at community, national and regional levels in order to manage and reduce disaster- and
climate-related risks. This means ensuring that sufficient levels of capacity and resources are made
available to prevent, prepare for, manage and recover from disasters. It also entails mechanisms,
10 ASEAN Regional RVA: Guidelines for Implementation
institutions and processes for citizens to articulate their interests, exercise their legal rights and
obligations and mediate their differences.4”
CONCEPTUALIZATION
AADMER highlights four components requiring identification and analysis: hazards, risk, vulnerabilities,
and disaster management capacities. Disaster risk is conceived of as a function of hazard exposure,
vulnerability, and coping capacity, which is closely associated with a traditional conceptualization of
disaster management that highlights response and recovery activities. However, over the 10 years of
implementing the HFA and developing the Sendai Framework, emphasis has increasingly been placed on
the policies, programs, and institutional mechanisms that enable coordinated, flexible, multi-
dimensional means of enacting interventions that more effectively reduce hazard exposure and
vulnerability, improve capacity, and increase overall resilience. DRM and DRR are made possible through
good risk governance.
In order to be consistent with current guidance documents inspired by the HFA (such as SFDRR), it is
proposed that the Disaster Management Capacity component instead be identified as Disaster Risk
Management Capacity. This change perhaps better highlights the relationship of DRR and DRG to risk
outcomes. It is these aspects which, in part, enable adaptation and the enhancement of adaptive
capacity, critical in an increasingly dynamic and uncertain riskscape.
In these Guidelines and associated documents, risk will be treated in two ways: 1) as physical risk that
emphasizes impacts in terms of economic losses and deaths, and 2) societal risk, which highlights the
social, economic, environmental, and institutional factors that could increase the likelihood of disruption
and secondary impacts. This document focuses on the representation and assessment of relative
societal risk. Societal vulnerabilities and capacities will be considered hazard independent.
Because of differences in data constraints, reporting requirements, and relevant communities of
practice, the Vulnerability component will focus on information that also supports what are traditionally
looked at as “development” activities and associated monitoring. The Disaster Risk Management
Capacities Component will emphasize the risk governance, risk management, and risk reduction
connection, but will also include information primarily associated with response and short term
recovery. This will facilitate reporting associated with DRR related frameworks such as HFA and the
Sendai Framework.
The first component enables monitoring of conditions that may reduce or exacerbate impacts. The
second enables monitoring of mechanisms that may change these conditions for the better and support
successful adaptation. Together, they enable tracking of overall resilience.
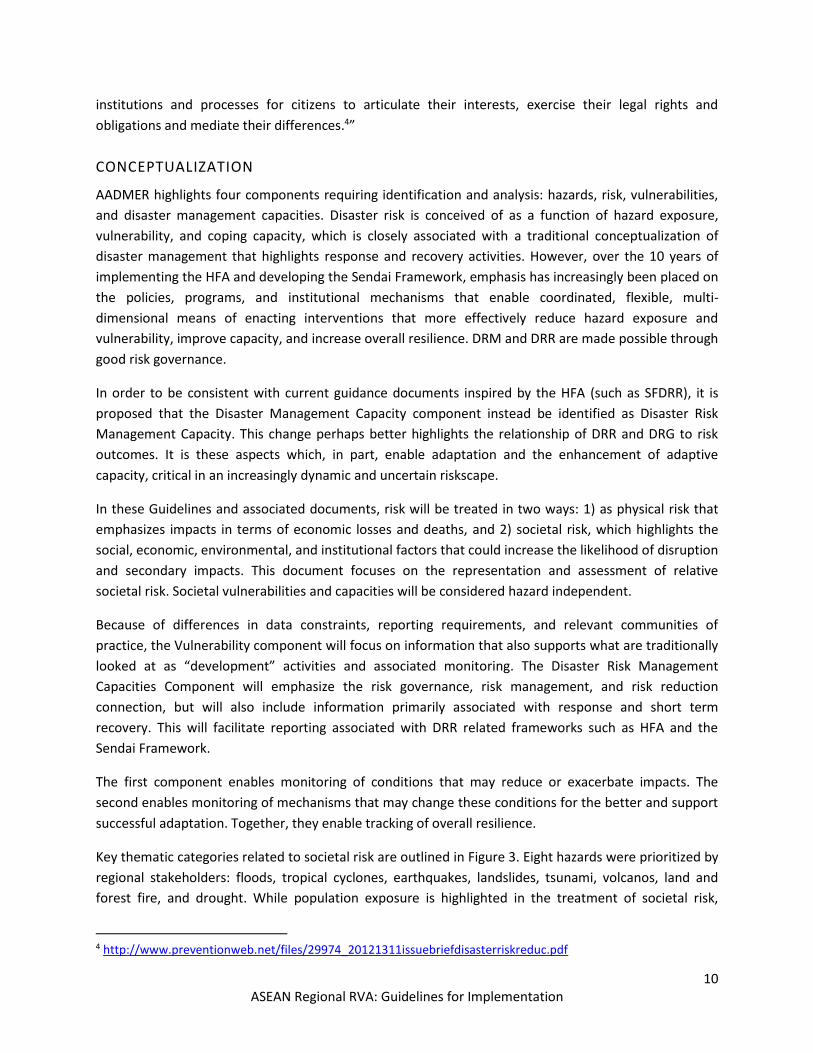
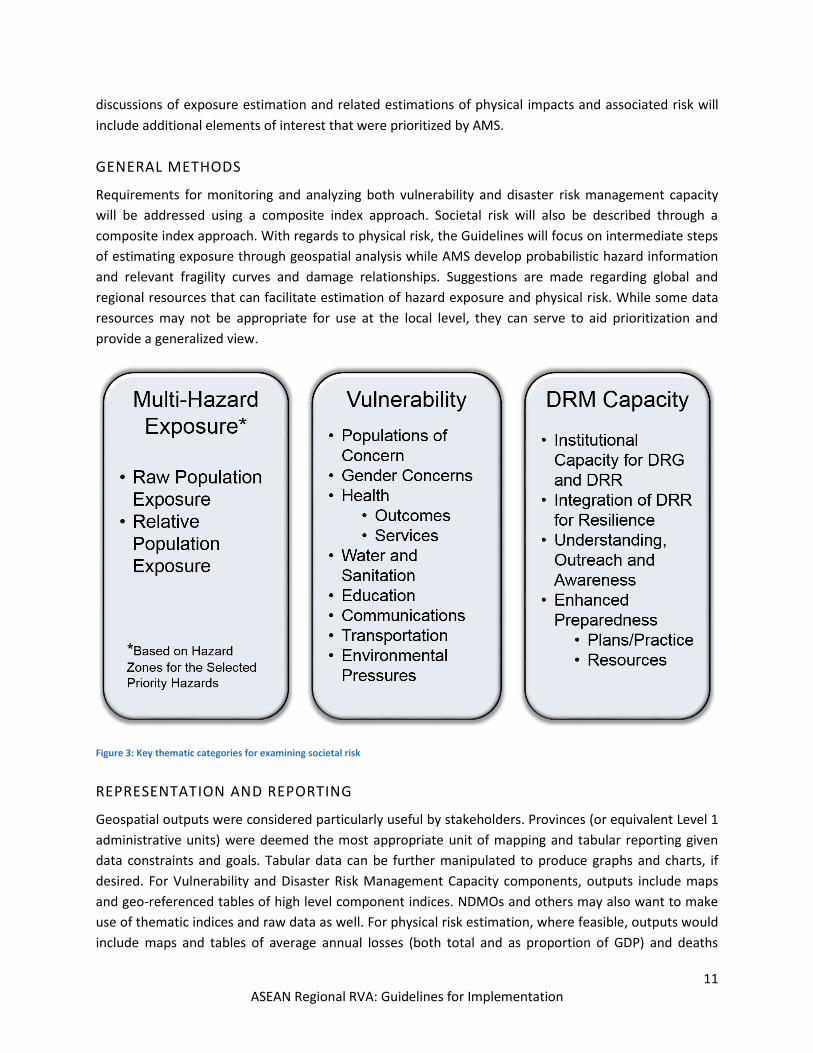
Key thematic categories related to societal risk are outlined in Figure 3. Eight hazards were prioritized by
regional stakeholders: floods, tropical cyclones, earthquakes, landslides, tsunami, volcanos, land and
forest fire, and drought. While population exposure is highlighted in the treatment of societal risk,
4 http://www.preventionweb.net/files/29974_20121311issuebriefdisasterriskreduc.pdf
11 ASEAN Regional RVA: Guidelines for Implementation
discussions of exposure estimation and related estimations of physical impacts and associated risk will
include additional elements of interest that were prioritized by AMS.
GENERAL METHODS
Requirements for monitoring and analyzing both vulnerability and disaster risk management capacity
will be addressed using a composite index approach. Societal risk will also be described through a
composite index approach. With regards to physical risk, the Guidelines will focus on intermediate steps
of estimating exposure through geospatial analysis while AMS develop probabilistic hazard information
and relevant fragility curves and damage relationships. Suggestions are made regarding global and
regional resources that can facilitate estimation of hazard exposure and physical risk. While some data
resources may not be appropriate for use at the local level, they can serve to aid prioritization and
provide a generalized view.
Figure 3: Key thematic categories for examining societal risk
REPRESENTATION AND REPORTING
Geospatial outputs were considered particularly useful by stakeholders. Provinces (or equivalent Level 1
administrative units) were deemed the most appropriate unit of mapping and tabular reporting given
data constraints and goals. Tabular data can be further manipulated to produce graphs and charts, if
desired. For Vulnerability and Disaster Risk Management Capacity components, outputs include maps
and geo-referenced tables of high level component indices. NDMOs and others may also want to make
use of thematic indices and raw data as well. For physical risk estimation, where feasible, outputs would
include maps and tables of average annual losses (both total and as proportion of GDP) and deaths
12 ASEAN Regional RVA: Guidelines for Implementation
(total and as proportion of population). These latter outputs support monitoring related to targets
outlined in the Sendai Framework. Regional reporting guidance and supporting materials are included in
the Supplemental Implementation Handbook.
13 ASEAN Regional RVA: Guidelines for Implementation
3. DATA SUPPORTING DECISION MAKING AND
ASSESSMENT
Data provide evidence for decision making. This section highlights some of the key data that support
multiple types of disaster-risk-related analyses, including the construction of the Societal Risk Index
outlined in these Guidelines. In general, disaster-related assessment and decision making requires three
types of information: information on hazards, information on elements or assets of interest that may be
exposed to those hazards, and information on how susceptible those elements are to impact and how
well they may be able to resist, cope, and recover. Information on historical events and impacts can be
useful in understanding and validating relationships between hazards, exposure, vulnerability, and
capacities.
The data categories listed here have been prioritized by AMS based on relevance to high-level disaster
risk management decision making, flexibility in application, consistency with AADMER requirements and
practical frameworks such as the UN Cluster Approach, and consistency with other development data
collection and monitoring efforts such as the Millennium Development Goals and Sustainable
Development Goals (MDG, SDG). Political and technical constraints were also considered. A discussion of
historical disaster data and its application is included in the Supplemental Implementation Handbook.
These recommended data are intended as a base for the region. The needs and capacities of each AMS
vary; an AMS may want to add datasets of particular interest. Since conditions change, it is also
recommended that the RAA Working Group revisit the Guidelines and the data recommendations at
regular intervals. The Guidelines and associated materials are intended to be living documents.
HAZARD DATA
Regionally, eight hazard types were prioritized for data collection and analysis. These include floods,
tropical cyclones, earthquakes, landslides, tsunami, volcanos, land and forest fire, and drought. Data on
each of the relevant hazards of interest, including the frequency, spatial delineation, and severity of the
hazard, are key components of an RVA. However, not all AMS are affected by every hazard. Since
developing detailed hazard data can be resource intensive, it is recommended that each AMS prioritize
hazards that have the greatest potential impact and work from there. Initial prioritization can be based
on a combination of historical records (global and/or local) and global assessments such as the GAR.
Ideally, hazard data are spatially referenced and include information on how likely it is that a particular
hazard will affect an area (probability); how severe the hazard will be (magnitude or intensity); the
geographic extent of the affected area; and conditions in the region that may increase or reduce the
effects of hazards. These elements are closely related, and are often combined in expressions linking
probability (or frequency) and magnitude (or extent). Probabilistic hazard data are the “gold standard”
since they facilitate more advanced analysis, enable comparison across time periods, and make it easier
to compare one area to another.
14 ASEAN Regional RVA: Guidelines for Implementation
In many cases, however, not all of this information is available. At minimum, a record of historical
occurrences of various hazards should be maintained. These data can support a basic hazard profile and
preliminary estimates of probability, if the period of record is relatively long and events are linked to
administrative units. Low probability events are likely to be missed, however. Disaster databases such as
the Emergency Events Database (EM-DAT) and DesInventar serve this purpose at global and national
levels. Related data and applications are discussed in the Supplemental Implementation Handbook. This
basic information can be augmented in a number of ways, including through the identification of spatial
“hazard zones.”
Many AMS do not have consistent, probabilistic, spatialized hazard data for all hazards that affect them.
However, some global and regional datasets, such as those developed for the GAR 2013 and 2015 may
help augment data limitations. These should be used with caution, as they are generally not appropriate
for localized planning and may pose challenges for basic unit comparisons if Level 1 administrative units
are small. Regardless of the limitations, though, these data do provide a useful starting point for
comparative assessments. For AMS that do not have access to more tailored spatial datasets, those
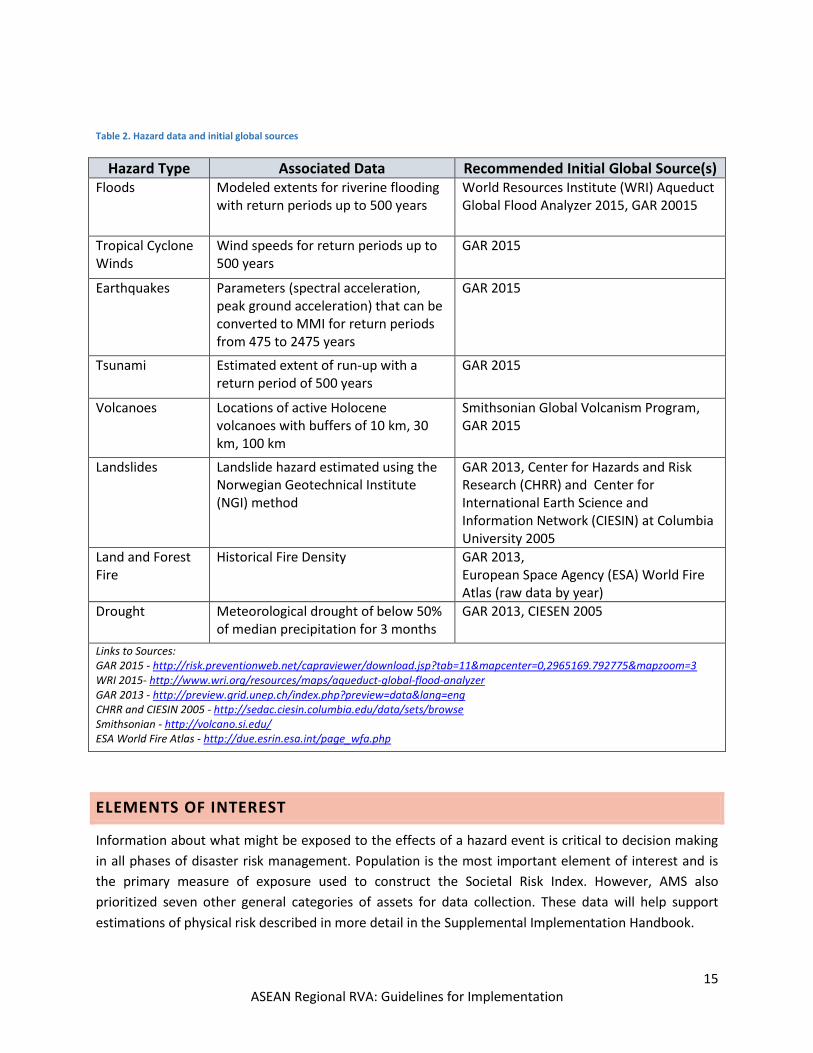
included in Table 2 might be used for initial representations of various hazards. These datasets can then
be leveraged to create regionally consistent hazard zones when estimating multi-hazard exposure for
inclusion in the Societal Risk Index.
15 ASEAN Regional RVA: Guidelines for Implementation
Table 2. Hazard data and initial global sources
Hazard Type Associated Data Recommended Initial Global Source(s) Floods Modeled extents for riverine flooding
with return periods up to 500 years World Resources Institute (WRI) Aqueduct Global Flood Analyzer 2015, GAR 20015
Tropical Cyclone Winds
Wind speeds for return periods up to 500 years
GAR 2015
Earthquakes Parameters (spectral acceleration, peak ground acceleration) that can be converted to MMI for return periods from 475 to 2475 years
GAR 2015
Tsunami Estimated extent of run-up with a return period of 500 years
GAR 2015
Volcanoes Locations of active Holocene volcanoes with buffers of 10 km, 30 km, 100 km
Smithsonian Global Volcanism Program, GAR 2015
Landslides Landslide hazard estimated using the Norwegian Geotechnical Institute (NGI) method
GAR 2013, Center for Hazards and Risk Research (CHRR) and Center for International Earth Science and Information Network (CIESIN) at Columbia University 2005
Land and Forest Fire
Historical Fire Density GAR 2013, European Space Agency (ESA) World Fire Atlas (raw data by year)
Drought Meteorological drought of below 50% of median precipitation for 3 months
GAR 2013, CIESEN 2005
Links to Sources: GAR 2015 - http://risk.preventionweb.net/capraviewer/download.jsp?tab=11&mapcenter=0,2965169.792775&mapzoom=3 WRI 2015- http://www.wri.org/resources/maps/aqueduct-global-flood-analyzer GAR 2013 - http://preview.grid.unep.ch/index.php?preview=data&lang=eng CHRR and CIESIN 2005 - http://sedac.ciesin.columbia.edu/data/sets/browse Smithsonian - http://volcano.si.edu/ ESA World Fire Atlas - http://due.esrin.esa.int/page_wfa.php
ELEMENTS OF INTEREST
Information about what might be exposed to the effects of a hazard event is critical to decision making
in all phases of disaster risk management. Population is the most important element of interest and is
the primary measure of exposure used to construct the Societal Risk Index. However, AMS also
prioritized seven other general categories of assets for data collection. These data will help support
estimations of physical risk described in more detail in the Supplemental Implementation Handbook.
16 ASEAN Regional RVA: Guidelines for Implementation
In order to estimate exposure and apply this information quickly to preparedness, response, and
recovery contexts, data must be spatially referenced. Data on the key elements of interest can be either
aggregated to a geographic region, common for population data, or assigned a specific location or point
on the map, as with essential facilities or lifelines.
In order to better model physical damage in subsequent analyses, building and construction
characteristics should also be captured where appropriate and feasible. Construction information is
critical to assessing the vulnerability of building stock, and size is used in estimating replacement value
or the value at risk. Occupancy information is useful in assessing where populations may be working,
going to school, or residing at different times of the day, as well as more accurately defining buildings
and content value based on use.
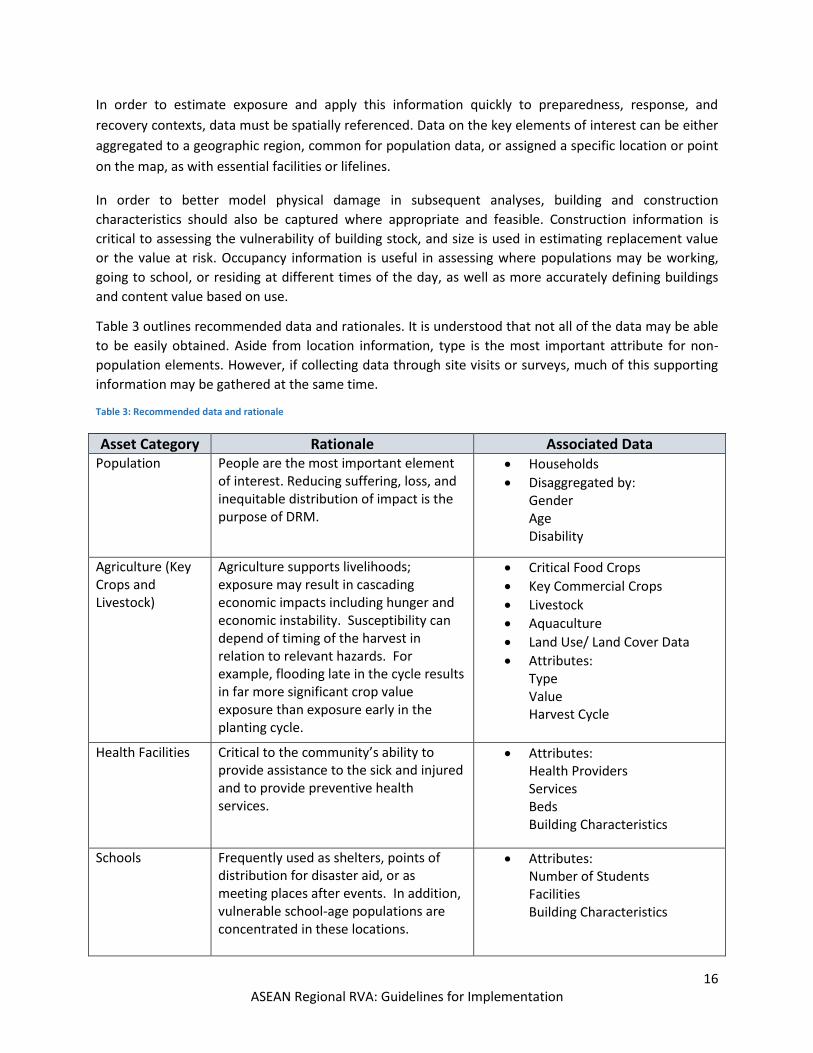
Table 3 outlines recommended data and rationales. It is understood that not all of the data may be able
to be easily obtained. Aside from location information, type is the most important attribute for non-
population elements. However, if collecting data through site visits or surveys, much of this supporting
information may be gathered at the same time.
Table 3: Recommended data and rationale
Asset Category Rationale Associated Data Population People are the most important element
of interest. Reducing suffering, loss, and inequitable distribution of impact is the purpose of DRM.
Households
Disaggregated by: Gender Age Disability
Agriculture (Key Crops and Livestock)
Agriculture supports livelihoods; exposure may result in cascading economic impacts including hunger and economic instability. Susceptibility can depend of timing of the harvest in relation to relevant hazards. For example, flooding late in the cycle results in far more significant crop value exposure than exposure early in the planting cycle.
Critical Food Crops
Key Commercial Crops
Livestock
Aquaculture
Land Use/ Land Cover Data
Attributes: Type Value Harvest Cycle
Health Facilities Critical to the community’s ability to provide assistance to the sick and injured and to provide preventive health services.
Attributes: Health Providers Services Beds Building Characteristics
Schools Frequently used as shelters, points of distribution for disaster aid, or as meeting places after events. In addition, vulnerable school-age populations are concentrated in these locations.
Attributes: Number of Students Facilities Building Characteristics
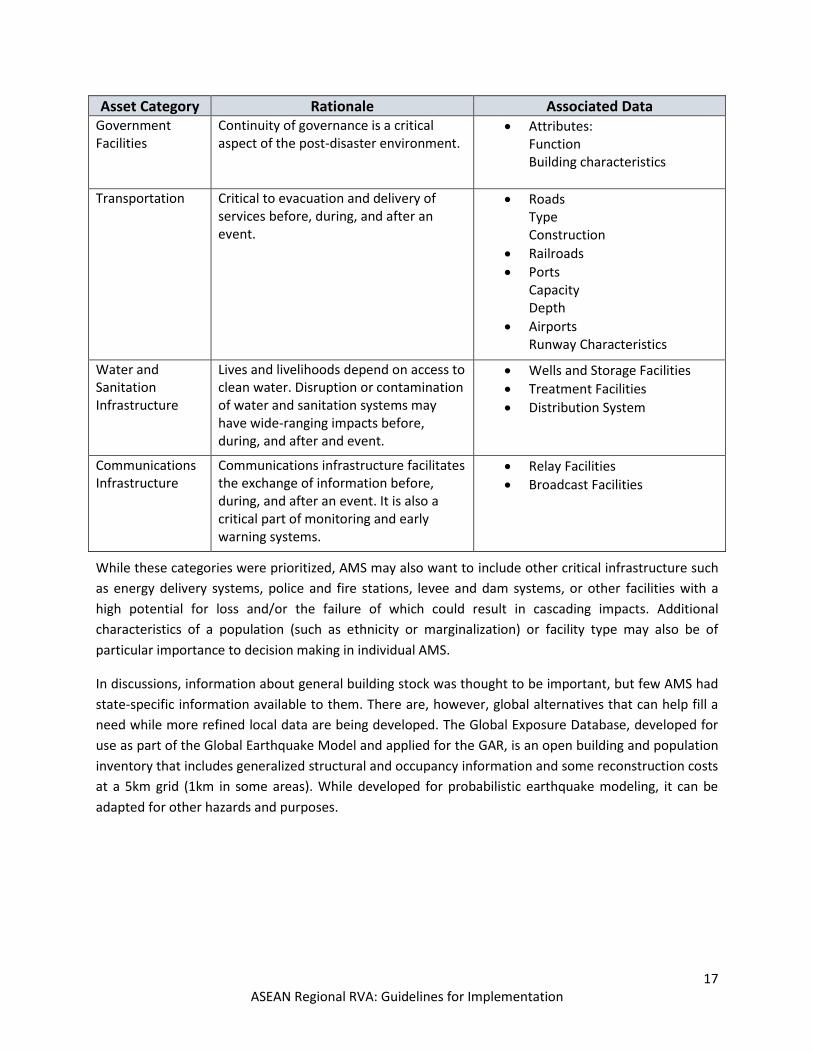
17 ASEAN Regional RVA: Guidelines for Implementation
Asset Category Rationale Associated Data Government Facilities
Continuity of governance is a critical aspect of the post-disaster environment.
Attributes: Function Building characteristics
Transportation Critical to evacuation and delivery of services before, during, and after an event.
Roads Type Construction
Railroads
Ports Capacity Depth
Airports Runway Characteristics
Water and Sanitation Infrastructure
Lives and livelihoods depend on access to clean water. Disruption or contamination of water and sanitation systems may have wide-ranging impacts before, during, and after and event.
Wells and Storage Facilities
Treatment Facilities
Distribution System
Communications Infrastructure
Communications infrastructure facilitates the exchange of information before, during, and after an event. It is also a critical part of monitoring and early warning systems.
Relay Facilities
Broadcast Facilities
While these categories were prioritized, AMS may also want to include other critical infrastructure such
as energy delivery systems, police and fire stations, levee and dam systems, or other facilities with a
high potential for loss and/or the failure of which could result in cascading impacts. Additional
characteristics of a population (such as ethnicity or marginalization) or facility type may also be of
particular importance to decision making in individual AMS.
In discussions, information about general building stock was thought to be important, but few AMS had
state-specific information available to them. There are, however, global alternatives that can help fill a
need while more refined local data are being developed. The Global Exposure Database, developed for
use as part of the Global Earthquake Model and applied for the GAR, is an open building and population
inventory that includes generalized structural and occupancy information and some reconstruction costs
at a 5km grid (1km in some areas). While developed for probabilistic earthquake modeling, it can be
adapted for other hazards and purposes.

18 ASEAN Regional RVA: Guidelines for Implementation
DATA FOR MONITORING VULNERABILITY
The data described in the previous two sections is critical to determining potential physical impacts and
losses associated with a hazard event. This section outlines data supporting the identification, analysis
and monitoring of multi-dimensional vulnerabilities that can increase the likelihood of disruption and
make it more difficult for communities to cope and recover. These data are associated with
development objectives and monitoring programs and can support multiple communities of practice.
Because of differences in data type, availability, and reporting requirements, Disaster Risk Management
Capacity is treated separately.
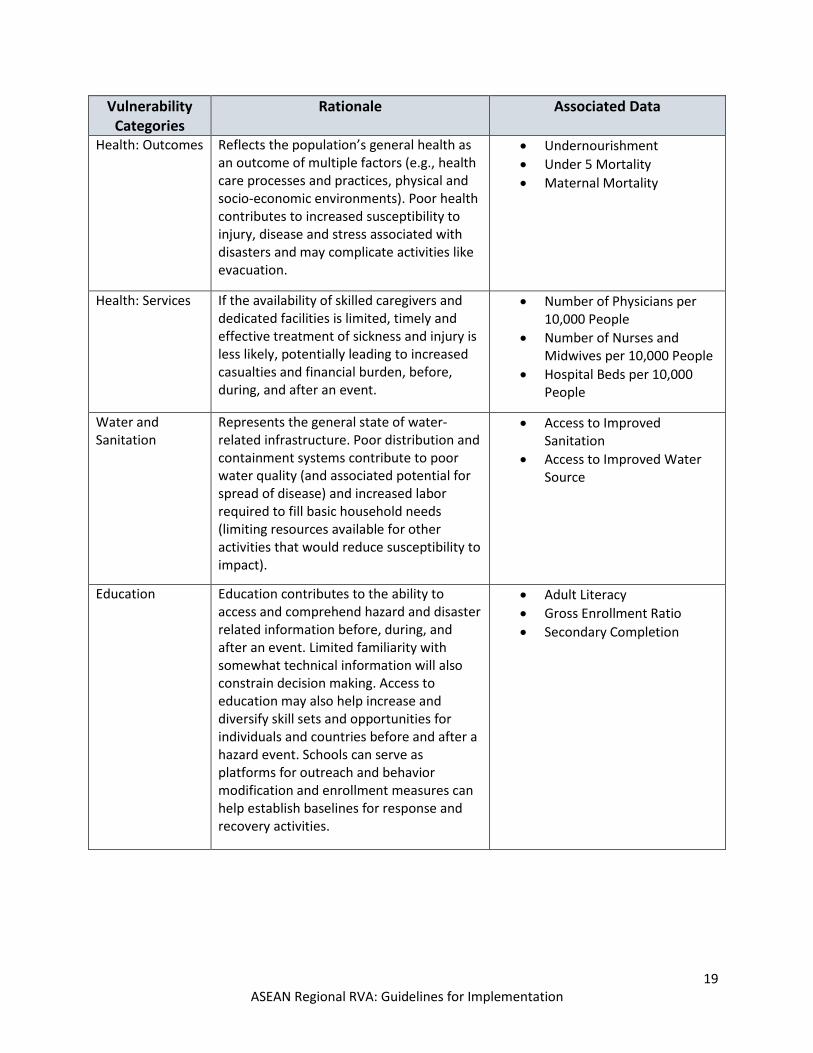
Table 4 outlines general vulnerability categories, rationale, and associated data.
Table 4: Vulnerability subcomponent themes
Vulnerability Categories
Rationale Associated Data
Populations of Concern
Represents populations who may need more tailored interventions prior to an event or specific arrangements during mass care operations (e.g., sheltering, health care delivery). These groups may be excluded from and/or overlooked in mitigation and preparedness planning and subsequent response and recovery activities. Where marginalized, may be less likely to have their needs met under “normal” conditions, and therefore become more susceptible to harm during times of disaster. Exclusion also limits the pool of ideas from which effective innovations emerge.
Children and Elderly
Disabled Population
Population in Poverty (National Measure)
Gender Concerns Represents gender-based differences in access to resources, services, opportunities, and formal economic and political structures. As with other populations, women may be excluded from and/or overlooked in mitigation and preparedness planning and subsequent response and recovery activities. Here, gender inequality focuses on inequalities in male/female representation in government and formal employment. Additionally, early pregnancy can limit opportunities among young women with primary caregiving responsibilities.
Proportional Representation in Local Government
Ratio of Female to Male Labor Participation
Adolescent Fertility Rate
19 ASEAN Regional RVA: Guidelines for Implementation
Vulnerability Categories
Rationale Associated Data
Health: Outcomes Reflects the population’s general health as an outcome of multiple factors (e.g., health care processes and practices, physical and socio-economic environments). Poor health contributes to increased susceptibility to injury, disease and stress associated with disasters and may complicate activities like evacuation.
Undernourishment
Under 5 Mortality
Maternal Mortality
Health: Services If the availability of skilled caregivers and dedicated facilities is limited, timely and effective treatment of sickness and injury is less likely, potentially leading to increased casualties and financial burden, before, during, and after an event.
Number of Physicians per 10,000 People
Number of Nurses and Midwives per 10,000 People
Hospital Beds per 10,000 People
Water and Sanitation
Represents the general state of water-related infrastructure. Poor distribution and containment systems contribute to poor water quality (and associated potential for spread of disease) and increased labor required to fill basic household needs (limiting resources available for other activities that would reduce susceptibility to impact).
Access to Improved Sanitation
Access to Improved Water Source
Education Education contributes to the ability to access and comprehend hazard and disaster related information before, during, and after an event. Limited familiarity with somewhat technical information will also constrain decision making. Access to education may also help increase and diversify skill sets and opportunities for individuals and countries before and after a hazard event. Schools can serve as platforms for outreach and behavior modification and enrollment measures can help establish baselines for response and recovery activities.
Adult Literacy
Gross Enrollment Ratio
Secondary Completion
20 ASEAN Regional RVA: Guidelines for Implementation
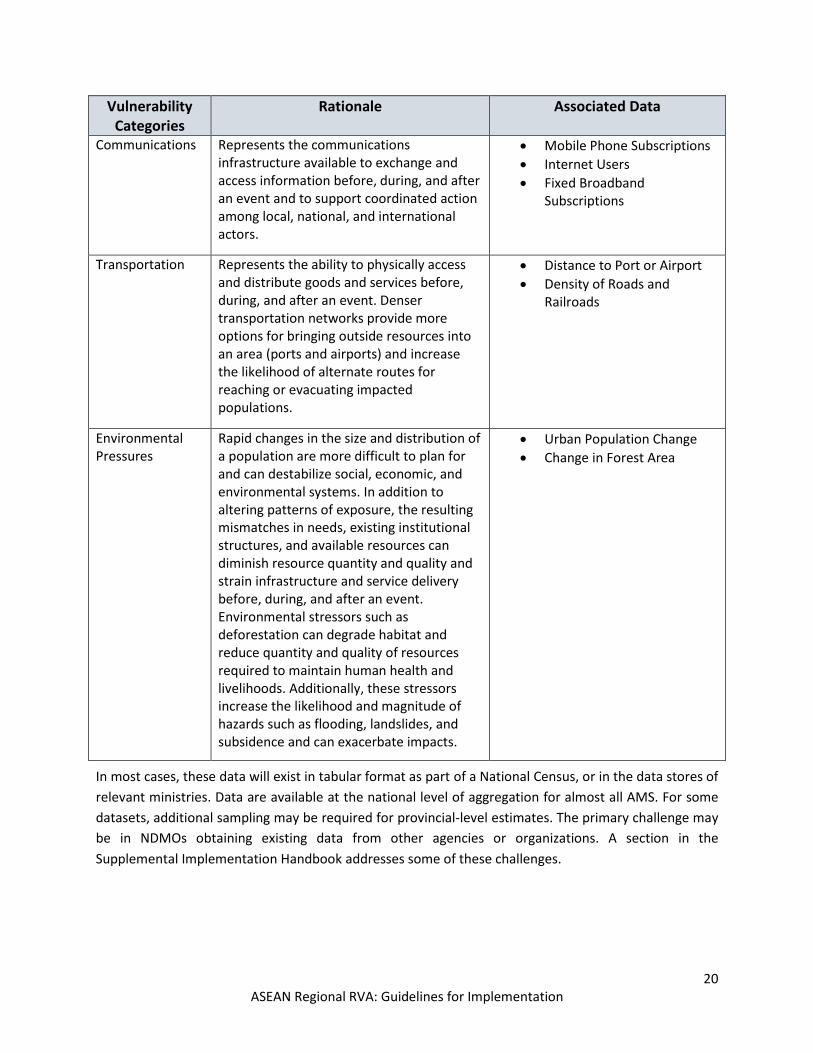
Vulnerability Categories
Rationale Associated Data
Communications Represents the communications infrastructure available to exchange and access information before, during, and after an event and to support coordinated action among local, national, and international actors.
Mobile Phone Subscriptions
Internet Users
Fixed Broadband Subscriptions
Transportation Represents the ability to physically access and distribute goods and services before, during, and after an event. Denser transportation networks provide more options for bringing outside resources into an area (ports and airports) and increase the likelihood of alternate routes for reaching or evacuating impacted populations.
Distance to Port or Airport
Density of Roads and Railroads
Environmental Pressures
Rapid changes in the size and distribution of a population are more difficult to plan for and can destabilize social, economic, and environmental systems. In addition to altering patterns of exposure, the resulting mismatches in needs, existing institutional structures, and available resources can diminish resource quantity and quality and strain infrastructure and service delivery before, during, and after an event. Environmental stressors such as deforestation can degrade habitat and reduce quantity and quality of resources required to maintain human health and livelihoods. Additionally, these stressors increase the likelihood and magnitude of hazards such as flooding, landslides, and subsidence and can exacerbate impacts.
Urban Population Change
Change in Forest Area
In most cases, these data will exist in tabular format as part of a National Census, or in the data stores of
relevant ministries. Data are available at the national level of aggregation for almost all AMS. For some
datasets, additional sampling may be required for provincial-level estimates. The primary challenge may
be in NDMOs obtaining existing data from other agencies or organizations. A section in the
Supplemental Implementation Handbook addresses some of these challenges.
21 ASEAN Regional RVA: Guidelines for Implementation
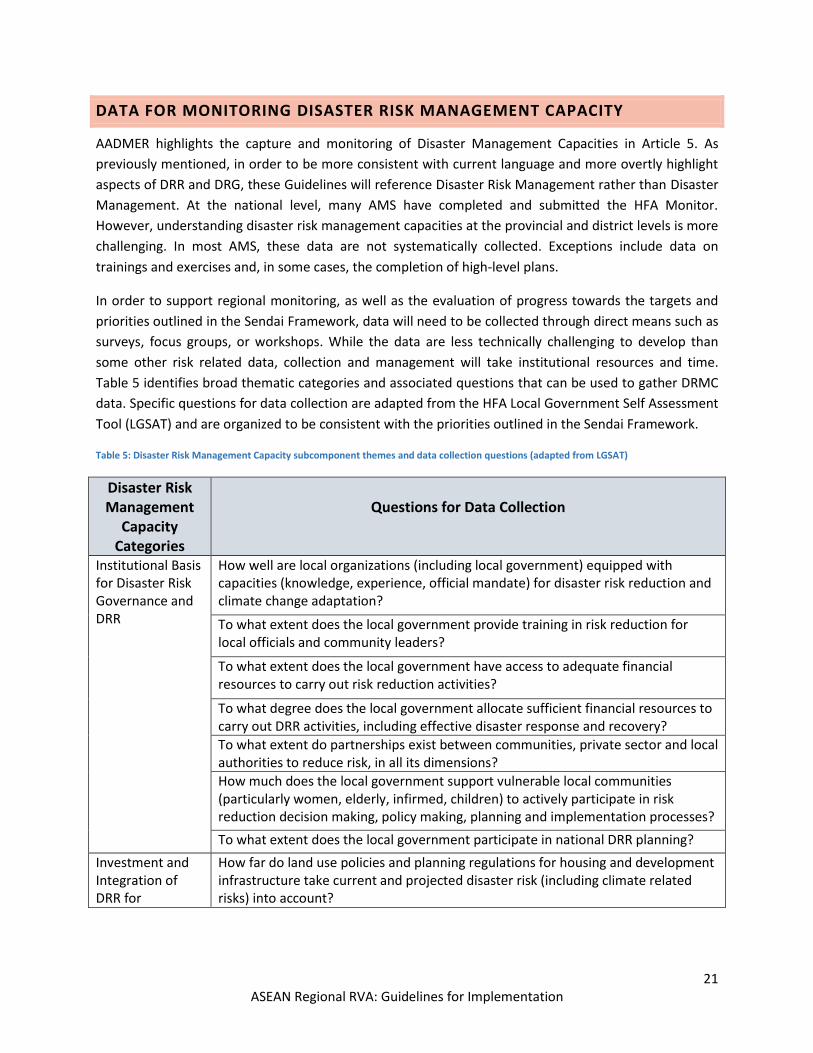
DATA FOR MONITORING DISASTER RISK MANAGEMENT CAPACITY
AADMER highlights the capture and monitoring of Disaster Management Capacities in Article 5. As
previously mentioned, in order to be more consistent with current language and more overtly highlight
aspects of DRR and DRG, these Guidelines will reference Disaster Risk Management rather than Disaster
Management. At the national level, many AMS have completed and submitted the HFA Monitor.
However, understanding disaster risk management capacities at the provincial and district levels is more
challenging. In most AMS, these data are not systematically collected. Exceptions include data on
trainings and exercises and, in some cases, the completion of high-level plans.
In order to support regional monitoring, as well as the evaluation of progress towards the targets and
priorities outlined in the Sendai Framework, data will need to be collected through direct means such as
surveys, focus groups, or workshops. While the data are less technically challenging to develop than
some other risk related data, collection and management will take institutional resources and time.
Table 5 identifies broad thematic categories and associated questions that can be used to gather DRMC
data. Specific questions for data collection are adapted from the HFA Local Government Self Assessment
Tool (LGSAT) and are organized to be consistent with the priorities outlined in the Sendai Framework.
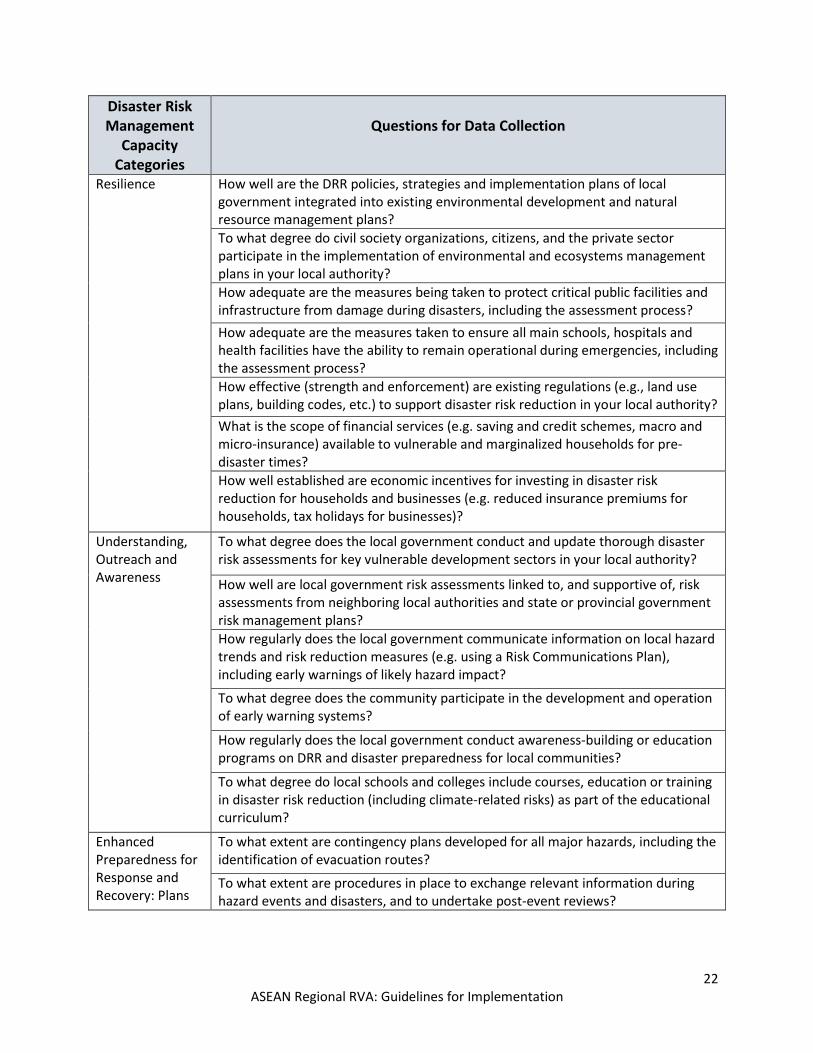
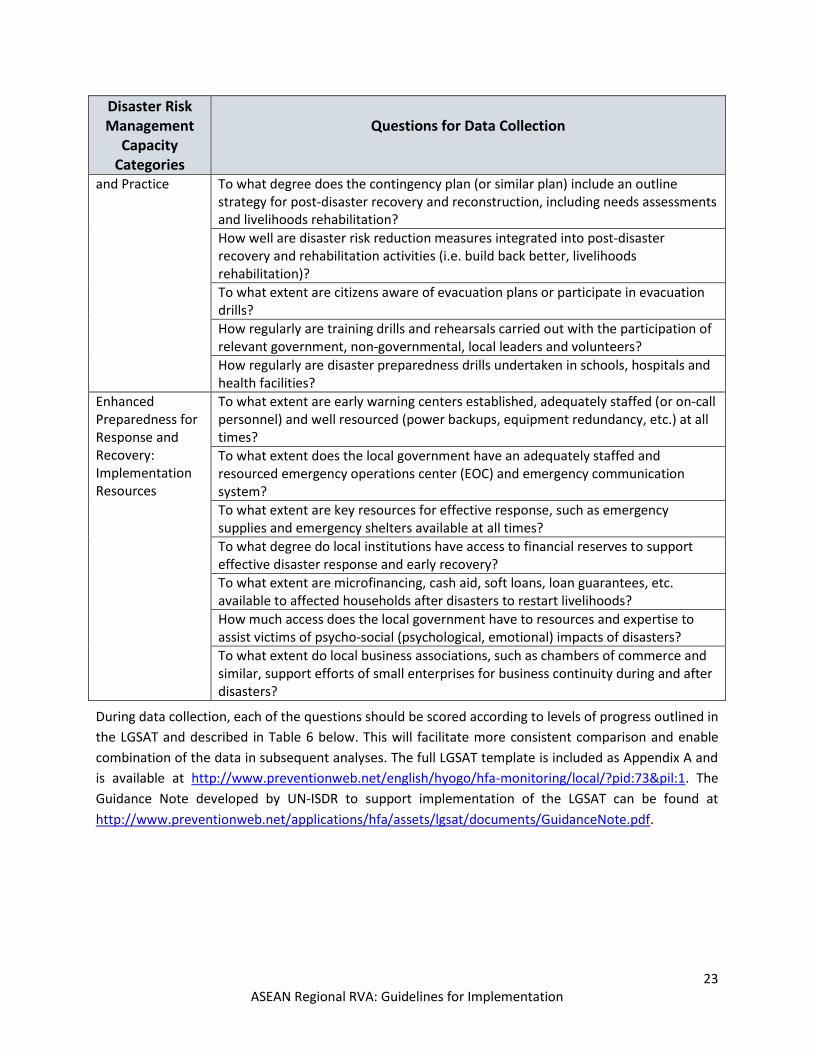
Table 5: Disaster Risk Management Capacity subcomponent themes and data collection questions (adapted from LGSAT)
Disaster Risk Management
Capacity Categories
Questions for Data Collection
Institutional Basis for Disaster Risk Governance and DRR
How well are local organizations (including local government) equipped with capacities (knowledge, experience, official mandate) for disaster risk reduction and climate change adaptation?
To what extent does the local government provide training in risk reduction for local officials and community leaders?
To what extent does the local government have access to adequate financial resources to carry out risk reduction activities?
To what degree does the local government allocate sufficient financial resources to carry out DRR activities, including effective disaster response and recovery?
To what extent do partnerships exist between communities, private sector and local authorities to reduce risk, in all its dimensions?
How much does the local government support vulnerable local communities (particularly women, elderly, infirmed, children) to actively participate in risk reduction decision making, policy making, planning and implementation processes?
To what extent does the local government participate in national DRR planning?
Investment and Integration of DRR for
How far do land use policies and planning regulations for housing and development infrastructure take current and projected disaster risk (including climate related risks) into account?
22 ASEAN Regional RVA: Guidelines for Implementation
Disaster Risk Management
Capacity Categories
Questions for Data Collection
Resilience How well are the DRR policies, strategies and implementation plans of local government integrated into existing environmental development and natural resource management plans?
To what degree do civil society organizations, citizens, and the private sector participate in the implementation of environmental and ecosystems management plans in your local authority?
How adequate are the measures being taken to protect critical public facilities and infrastructure from damage during disasters, including the assessment process?
How adequate are the measures taken to ensure all main schools, hospitals and health facilities have the ability to remain operational during emergencies, including the assessment process?
How effective (strength and enforcement) are existing regulations (e.g., land use plans, building codes, etc.) to support disaster risk reduction in your local authority?
What is the scope of financial services (e.g. saving and credit schemes, macro and micro‐insurance) available to vulnerable and marginalized households for pre‐disaster times?
How well established are economic incentives for investing in disaster risk reduction for households and businesses (e.g. reduced insurance premiums for households, tax holidays for businesses)?
Understanding, Outreach and Awareness
To what degree does the local government conduct and update thorough disaster risk assessments for key vulnerable development sectors in your local authority?
How well are local government risk assessments linked to, and supportive of, risk assessments from neighboring local authorities and state or provincial government risk management plans?
How regularly does the local government communicate information on local hazard trends and risk reduction measures (e.g. using a Risk Communications Plan), including early warnings of likely hazard impact?
To what degree does the community participate in the development and operation of early warning systems?
How regularly does the local government conduct awareness‐building or education programs on DRR and disaster preparedness for local communities?
To what degree do local schools and colleges include courses, education or training in disaster risk reduction (including climate‐related risks) as part of the educational curriculum?
Enhanced Preparedness for Response and Recovery: Plans
To what extent are contingency plans developed for all major hazards, including the identification of evacuation routes?
To what extent are procedures in place to exchange relevant information during hazard events and disasters, and to undertake post‐event reviews?
23 ASEAN Regional RVA: Guidelines for Implementation
Disaster Risk Management
Capacity Categories
Questions for Data Collection
and Practice To what degree does the contingency plan (or similar plan) include an outline strategy for post‐disaster recovery and reconstruction, including needs assessments and livelihoods rehabilitation?
How well are disaster risk reduction measures integrated into post‐disaster recovery and rehabilitation activities (i.e. build back better, livelihoods rehabilitation)?
To what extent are citizens aware of evacuation plans or participate in evacuation drills?
How regularly are training drills and rehearsals carried out with the participation of relevant government, non‐governmental, local leaders and volunteers?
How regularly are disaster preparedness drills undertaken in schools, hospitals and health facilities?
Enhanced Preparedness for Response and Recovery: Implementation Resources
To what extent are early warning centers established, adequately staffed (or on‐call personnel) and well resourced (power backups, equipment redundancy, etc.) at all times?
To what extent does the local government have an adequately staffed and resourced emergency operations center (EOC) and emergency communication system?
To what extent are key resources for effective response, such as emergency supplies and emergency shelters available at all times?
To what degree do local institutions have access to financial reserves to support effective disaster response and early recovery?
To what extent are microfinancing, cash aid, soft loans, loan guarantees, etc. available to affected households after disasters to restart livelihoods?
How much access does the local government have to resources and expertise to assist victims of psycho‐social (psychological, emotional) impacts of disasters?
To what extent do local business associations, such as chambers of commerce and similar, support efforts of small enterprises for business continuity during and after disasters?
During data collection, each of the questions should be scored according to levels of progress outlined in
the LGSAT and described in Table 6 below. This will facilitate more consistent comparison and enable
combination of the data in subsequent analyses. The full LGSAT template is included as Appendix A and
is available at http://www.preventionweb.net/english/hyogo/hfa-monitoring/local/?pid:73&pil:1. The
Guidance Note developed by UN-ISDR to support implementation of the LGSAT can be found at
http://www.preventionweb.net/applications/hfa/assets/lgsat/documents/GuidanceNote.pdf.
24 ASEAN Regional RVA: Guidelines for Implementation
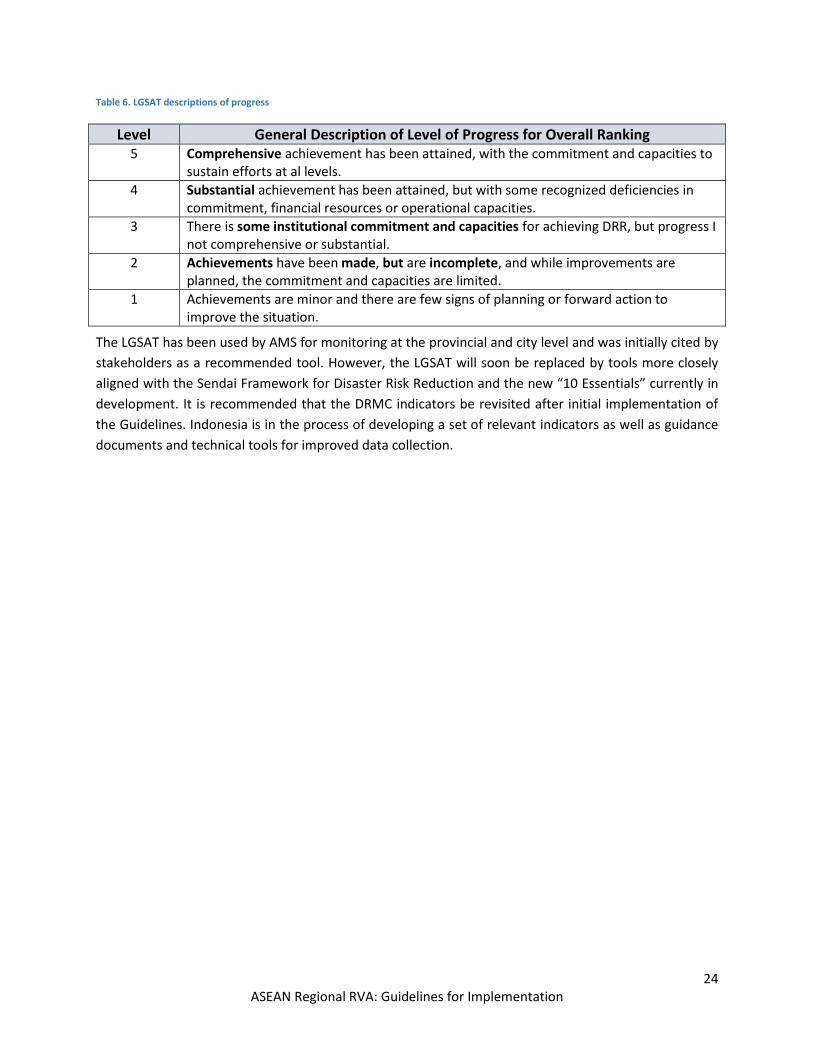
Table 6. LGSAT descriptions of progress
Level General Description of Level of Progress for Overall Ranking 5 Comprehensive achievement has been attained, with the commitment and capacities to
sustain efforts at al levels.
4 Substantial achievement has been attained, but with some recognized deficiencies in commitment, financial resources or operational capacities.
3 There is some institutional commitment and capacities for achieving DRR, but progress I not comprehensive or substantial.
2 Achievements have been made, but are incomplete, and while improvements are planned, the commitment and capacities are limited.
1 Achievements are minor and there are few signs of planning or forward action to improve the situation.
The LGSAT has been used by AMS for monitoring at the provincial and city level and was initially cited by
stakeholders as a recommended tool. However, the LGSAT will soon be replaced by tools more closely
aligned with the Sendai Framework for Disaster Risk Reduction and the new “10 Essentials” currently in
development. It is recommended that the DRMC indicators be revisited after initial implementation of
the Guidelines. Indonesia is in the process of developing a set of relevant indicators as well as guidance
documents and technical tools for improved data collection.
25 ASEAN Regional RVA: Guidelines for Implementation
4. CONSTRUCTING THE SOCIETAL RISK INDEX
As discussed in Section 2, a comparative assessment of Societal Risk will leverage a composite index
approach. Composite indices are created by selecting sets of variables that represent general concepts
(e.g., access to information, health status, or inequality). The individual variables, or “indicators,” are
then scaled to a standardized value range (e.g., 0-1 or 1-100) so they can be mathematically combined
into a relative measure of the theme of interest. These measures can then be combined to represent
more complex multi-dimensional concepts. This section describes the general steps required to
construct composite indices and provides specific guidance on the construction of the Societal Risk
Index and each of its components.
GENERAL STEPS FOR CONSTRUCTING COMPOSITE INDICES
The following six steps can be used to guide index development:
1. Establishing a conceptual framework
2. Collecting data
3. Dealing with missing data
4. Deriving indicators
5. Scaling indicators
6. Aggregating indicators and indices
STEP 1: CONCEPTUAL FRAMEWORK
In order for indices to be useful, the concepts and themes being represented must be defined and the
rationale for inclusion clear. Additionally, the conceptual framework should identify how themes are
linked and how they relate to larger multi-dimensional concepts. A high level framework was presented
in Figure 3 and further specified in Section 3. Specific structures of the component indices will be
described in more detail later in this section.
STEP 2: DATA COLLECTION
Section 3 outlined many of the types of data needed to support DRM related decision making and
construct the Societal Risk Index. Input data used to prepare indicators should represent the latest data
available, preferably collected or estimated within the last 5 years. The quality of data collected has a
substantial effect on the utility of an index. Data should be relevant and reliable and have good
temporal and spatial coverage. Data should also be formally documented by both the source and the
user. Table 7 outlines some key considerations and questions that can help evaluate data.
26 ASEAN Regional RVA: Guidelines for Implementation
Table 7. Considerations when collecting data
Consideration Related Questions Relevance Do the data truly represent the intended concepts or themes?
Source Is the source reputable and reliable? Is it the official source for the dataset of interest?
Timeliness Are the data current? How often are they published?
Spatial Coverage Are the data available for all administrative areas or other units of analysis?
Caveats/constraints Are there known limitations to the quality of the data or constraints on how it can be used? Can it be used to make meaningful comparisons?
Documentation Does the data have accompanying metadata? Is there enough information about the data to make an evaluation?
STEP 3: MISSING DATA
Missing data is a common problem. Data may go unreported for technical, political, or organizational
reasons. There are a number of ways to “fill in the blanks,” ranging from substitution to statistical
analysis. For the construction of the Societal Risk Index, it is recommended that if data are missing for
select administrative units, earlier versions of the same datasets are consulted. It is recommended that
data older than 10 years old should not be used, however. Alternative sources that are reliable and
collect and/or maintain similar datasets as the primary source might also be consulted. If these two
approaches are ineffective, leave the record blank. Missing data will also need to be considered during
the aggregation process; if several indicators are missing, the province may need to be excluded from
the index. Missing data should be documented for transparency.
STEP 4: DERIVATION
Depending on the data collected, it may be necessary to derive variables from multiple input datasets or
to perform an intermediate calculation on a single dataset to create the specific indicator used to
construct the indices. For example, in order to facilitate meaningful comparison across administrative
units of varying size and population, indicators should be reported as a rate, percentage, or density
measure (e.g., GDP per capita or physicians per 10,000 persons). Or forest cover might be reported in
hectares or square kilometers at specific points in time rather than as a measure of change, which is
really what we’re interested in. Units will also need to be consistent. Additional calculations may be
needed to convert measurements to metric units or to change data that may be reported as “per 1000”
persons to “per 10,000” persons. All derivations should be documented.
STEP 5: SCALING
The indicators used to create sub-indices and sub-component indices measure unlike things and have
inconsistent units, ranges, and scales. In order to combine them and perform the mathematical
operations required to create a single composite index score, indicator values must be standardized or
27 ASEAN Regional RVA: Guidelines for Implementation
normalized. Prior to aggregation, the indicators must also have the same value range and directionality.
This requires three steps.
Step 1: Normalization
In order to normalize values, it is recommended that AMS leverage a commonly used process to create
scaled scores ranging from 0 to 1:
(Observed indicator value – Indicator minimum value) / (Indicator maximum value – Indicator minimum value).
Here, minimums and maximums represent reasonable bounds that will facilitate comparison both
within AMS and between AMS and provide relevant points of reference for improvement. They are not
intended to capture the full range of conditions within the region; data for some provinces at the very
high end or very low end of the Vulnerability or Multi-hazard Exposure spectrum will fall outside the
given range. As noted in Section 3, all Disaster Risk Management Capacity data have a consistent set
range of 1-5. For Vulnerability indicators, minimums and maximums were selected based on the range
and distribution of data available at the national level within ASEAN (mean +/- two standard deviations).
The intent was to simplify the scaling process and provide meaningful anchor points that limit the
influence of extreme values. It is important to remember that “0” does not represent “no vulnerability”
or “no exposure,” but instead the minimum reasonable case relative to others. Minimums and
maximums should be reviewed after a testing period.
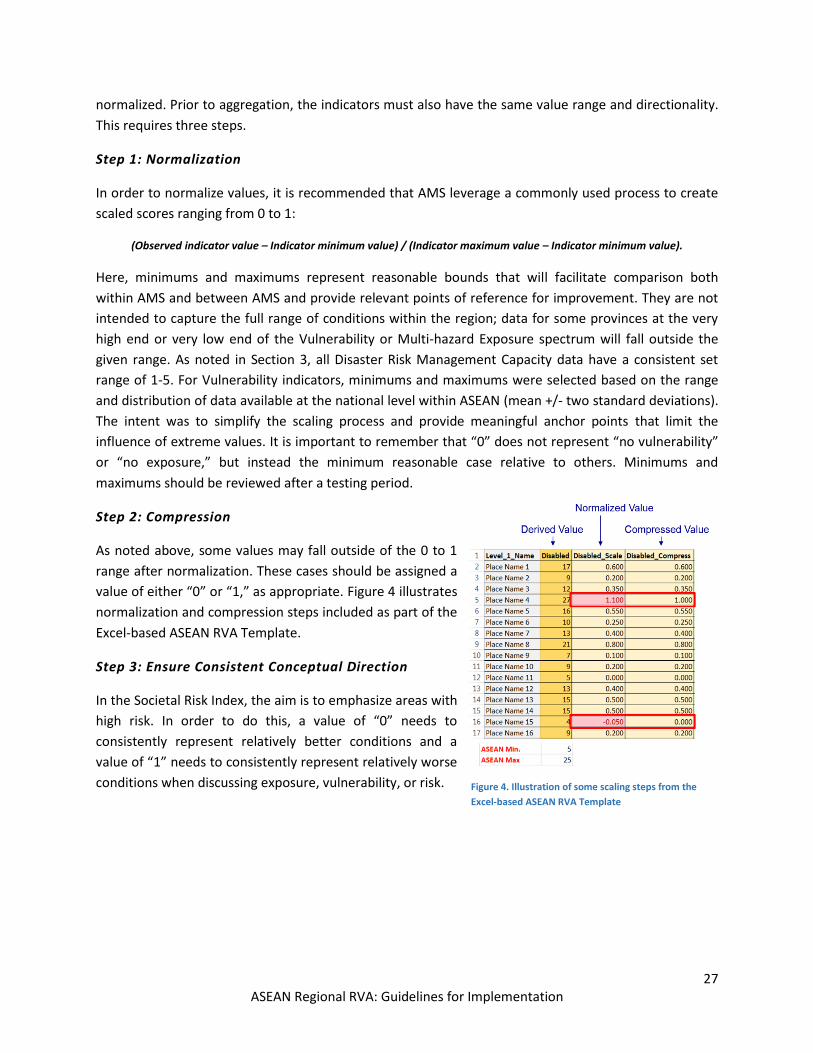
Step 2: Compression
As noted above, some values may fall outside of the 0 to 1
range after normalization. These cases should be assigned a
value of either “0” or “1,” as appropriate. Figure 4 illustrates
normalization and compression steps included as part of the
Excel-based ASEAN RVA Template.
Step 3: Ensure Consistent Conceptual Direction
In the Societal Risk Index, the aim is to emphasize areas with
high risk. In order to do this, a value of “0” needs to
consistently represent relatively better conditions and a
value of “1” needs to consistently represent relatively worse
conditions when discussing exposure, vulnerability, or risk. Figure 4. Illustration of some scaling steps from the
Excel-based ASEAN RVA Template
28 ASEAN Regional RVA: Guidelines for Implementation
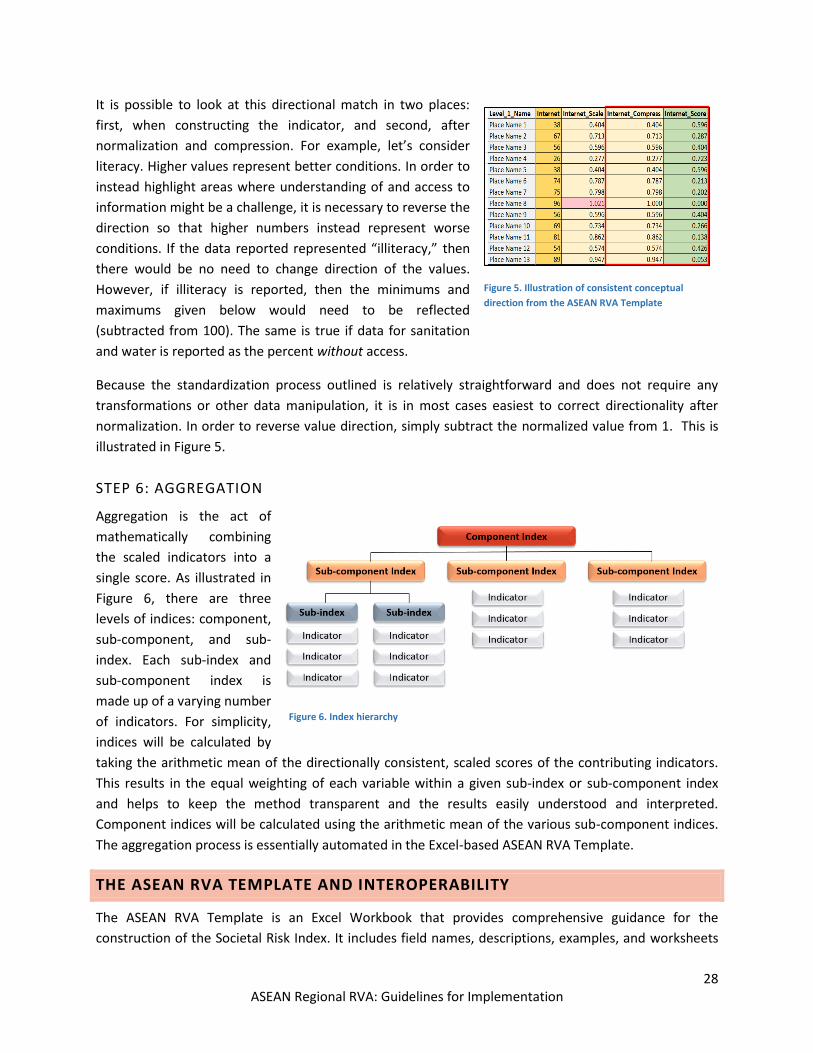
It is possible to look at this directional match in two places:
first, when constructing the indicator, and second, after
normalization and compression. For example, let’s consider
literacy. Higher values represent better conditions. In order to
instead highlight areas where understanding of and access to
information might be a challenge, it is necessary to reverse the
direction so that higher numbers instead represent worse
conditions. If the data reported represented “illiteracy,” then
there would be no need to change direction of the values.
However, if illiteracy is reported, then the minimums and
maximums given below would need to be reflected
(subtracted from 100). The same is true if data for sanitation
and water is reported as the percent without access.
Because the standardization process outlined is relatively straightforward and does not require any
transformations or other data manipulation, it is in most cases easiest to correct directionality after
normalization. In order to reverse value direction, simply subtract the normalized value from 1. This is
illustrated in Figure 5.
STEP 6: AGGREGATION
Aggregation is the act of
mathematically combining
the scaled indicators into a
single score. As illustrated in
Figure 6, there are three
levels of indices: component,
sub-component, and sub-
index. Each sub-index and
sub-component index is
made up of a varying number
of indicators. For simplicity,
indices will be calculated by
taking the arithmetic mean of the directionally consistent, scaled scores of the contributing indicators.
This results in the equal weighting of each variable within a given sub-index or sub-component index
and helps to keep the method transparent and the results easily understood and interpreted.
Component indices will be calculated using the arithmetic mean of the various sub-component indices.
The aggregation process is essentially automated in the Excel-based ASEAN RVA Template.
THE ASEAN RVA TEMPLATE AND INTEROPERABILITY
The ASEAN RVA Template is an Excel Workbook that provides comprehensive guidance for the
construction of the Societal Risk Index. It includes field names, descriptions, examples, and worksheets
Figure 5. Illustration of consistent conceptual
direction from the ASEAN RVA Template
Figure 6. Index hierarchy
29 ASEAN Regional RVA: Guidelines for Implementation
with active formulas to partially automate each step of the scaling and aggregation process. All
components are represented, and the template also contains active formulas for the calculation of the
Societal Risk Index and a hazard independent Lack of Resilience Index. The intent is to simplify the RVA
process while facilitating good data management practices and interoperability through consistent
naming conventions, formatting, rounding, as well as clear instructions and preliminary documentation.
Interoperability will be particularly important when merging individual AMS outputs into a regional
index. Care should be taken not to change or delete the formulas and to maintain field names and
formatting.
All data should be referenced to the consistently formatted name (be sure to avoid special characters)
and/or code of the associated Level 1 administrative unit (e.g., province). Regardless of how you choose
to organize your data or which program you use to derive indicators, it is always critical that the
administrative units are sorted in the same manner before adding new data to a worksheet or database.
That is one reason why all input datasets should include the full set of standardized province names and
codes prior to subsequent processing. This step enables a consistent sorting and a “key” through which
to join tables.
Technical officers with GIS experience from each AMS should work with the AHA Centre to establish an
acceptable working dataset with consistent names and codes that will support interoperability. The
Global Administrative Unit Layers (GAUL) dataset developed by the Food and Agriculture Organization of
the United Nations (FAO) could provide a good potential starting point for the development of a regional
dataset that would support the implementation, compilation, and visualization of the ASEAN Regional
RVA. The latest files are available for review and request at
http://www.fao.org/geonetwork/srv/en/metadata.show?id=12691.
The GAUL dataset (or any other dataset used as a base) may need to be updated or adapted before use
by AMS and the AHA Centre to ensure that recent administrative boundary changes are reflected. Key
considerations raised during the review and collaboration process are the inclusion of the relatively new
provinces of Xaysomboun (Lao PDR), Tbong Khmum (Cambodia), and Bueng Kan (Thailand); the merging
of Ha Tay with Ha Noi City in Viet Nam; and the proper coding of Langkawi Island as part of the State of
Kedah in Malaysia. It is recommended that AMS work directly with those that maintain the data to
update any dataset used as a base for the RVA. The distributor of the GAUL dataset can be reached at
In order to improve compatibility with mapping software, it is recommended that outputs be saved with
an “.xls” extension rather than as “.xlsx” and that underscores are used rather than spaces in all file and
field names. It is also helpful to create a copy of the final scale that is not tied to the formulas used to
create it and represents the values only. Additional information on the ASEAN RVA Template and its use
can be found in the Exercise Handbook.
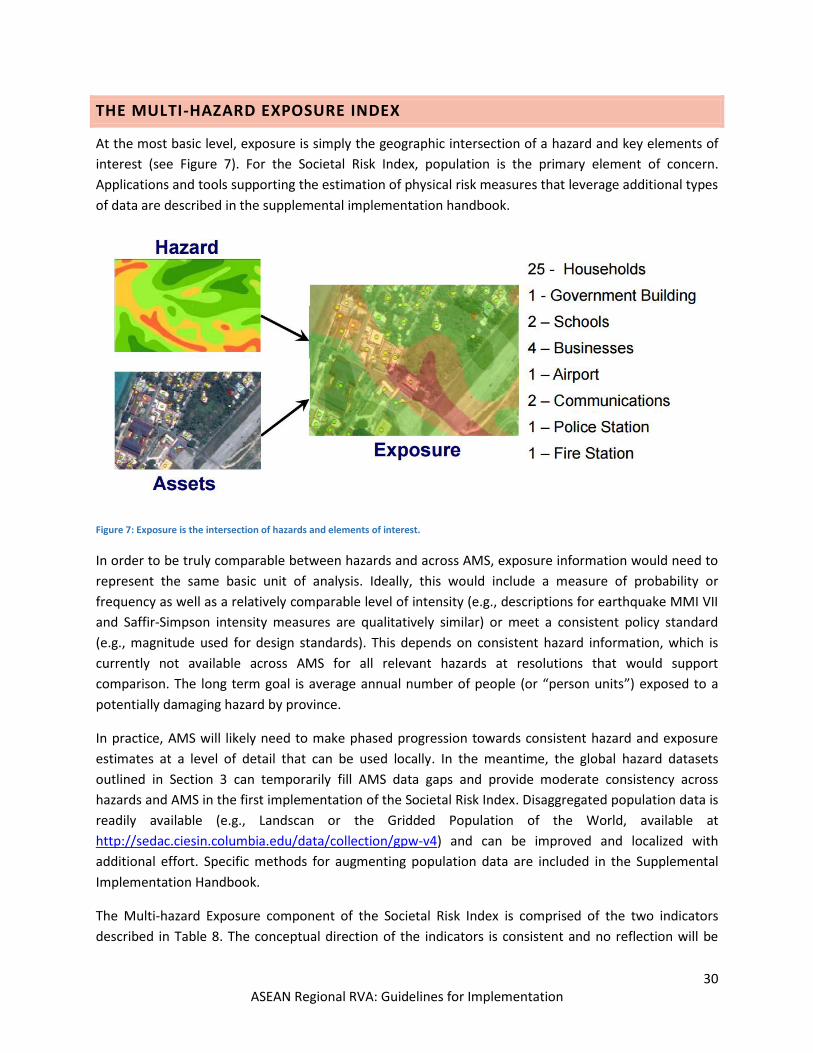
30 ASEAN Regional RVA: Guidelines for Implementation
THE MULTI-HAZARD EXPOSURE INDEX
At the most basic level, exposure is simply the geographic intersection of a hazard and key elements of
interest (see Figure 7). For the Societal Risk Index, population is the primary element of concern.
Applications and tools supporting the estimation of physical risk measures that leverage additional types
of data are described in the supplemental implementation handbook.
Figure 7: Exposure is the intersection of hazards and elements of interest.
In order to be truly comparable between hazards and across AMS, exposure information would need to
represent the same basic unit of analysis. Ideally, this would include a measure of probability or
frequency as well as a relatively comparable level of intensity (e.g., descriptions for earthquake MMI VII
and Saffir-Simpson intensity measures are qualitatively similar) or meet a consistent policy standard
(e.g., magnitude used for design standards). This depends on consistent hazard information, which is
currently not available across AMS for all relevant hazards at resolutions that would support
comparison. The long term goal is average annual number of people (or “person units”) exposed to a
potentially damaging hazard by province.
In practice, AMS will likely need to make phased progression towards consistent hazard and exposure
estimates at a level of detail that can be used locally. In the meantime, the global hazard datasets
outlined in Section 3 can temporarily fill AMS data gaps and provide moderate consistency across
hazards and AMS in the first implementation of the Societal Risk Index. Disaggregated population data is
readily available (e.g., Landscan or the Gridded Population of the World, available at
http://sedac.ciesin.columbia.edu/data/collection/gpw-v4) and can be improved and localized with
additional effort. Specific methods for augmenting population data are included in the Supplemental
Implementation Handbook.
The Multi-hazard Exposure component of the Societal Risk Index is comprised of the two indicators
described in Table 8. The conceptual direction of the indicators is consistent and no reflection will be
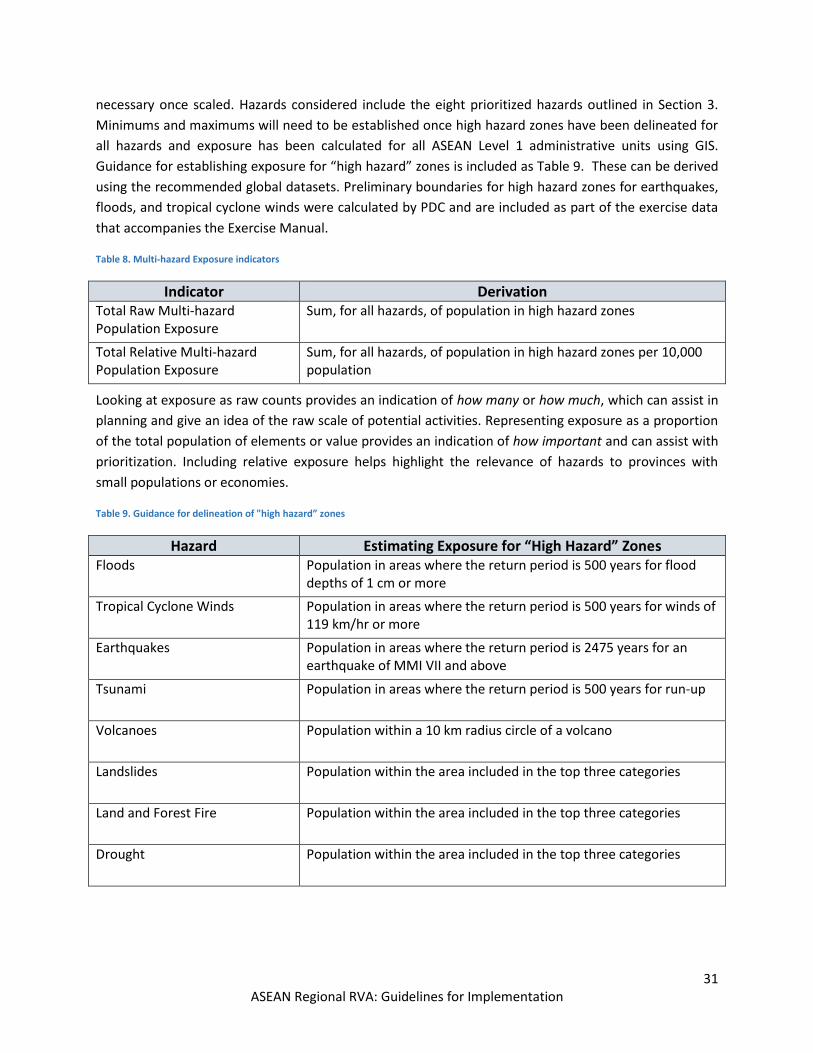
31 ASEAN Regional RVA: Guidelines for Implementation
necessary once scaled. Hazards considered include the eight prioritized hazards outlined in Section 3.
Minimums and maximums will need to be established once high hazard zones have been delineated for
all hazards and exposure has been calculated for all ASEAN Level 1 administrative units using GIS.
Guidance for establishing exposure for “high hazard” zones is included as Table 9. These can be derived
using the recommended global datasets. Preliminary boundaries for high hazard zones for earthquakes,
floods, and tropical cyclone winds were calculated by PDC and are included as part of the exercise data
that accompanies the Exercise Manual.
Table 8. Multi-hazard Exposure indicators
Indicator Derivation Total Raw Multi-hazard Population Exposure
Sum, for all hazards, of population in high hazard zones
Total Relative Multi-hazard Population Exposure
Sum, for all hazards, of population in high hazard zones per 10,000 population
Looking at exposure as raw counts provides an indication of how many or how much, which can assist in
planning and give an idea of the raw scale of potential activities. Representing exposure as a proportion
of the total population of elements or value provides an indication of how important and can assist with
prioritization. Including relative exposure helps highlight the relevance of hazards to provinces with
small populations or economies.
Table 9. Guidance for delineation of "high hazard” zones
Hazard Estimating Exposure for “High Hazard” Zones Floods Population in areas where the return period is 500 years for flood
depths of 1 cm or more
Tropical Cyclone Winds Population in areas where the return period is 500 years for winds of 119 km/hr or more
Earthquakes Population in areas where the return period is 2475 years for an earthquake of MMI VII and above
Tsunami Population in areas where the return period is 500 years for run-up
Volcanoes Population within a 10 km radius circle of a volcano
Landslides Population within the area included in the top three categories
Land and Forest Fire Population within the area included in the top three categories
Drought Population within the area included in the top three categories
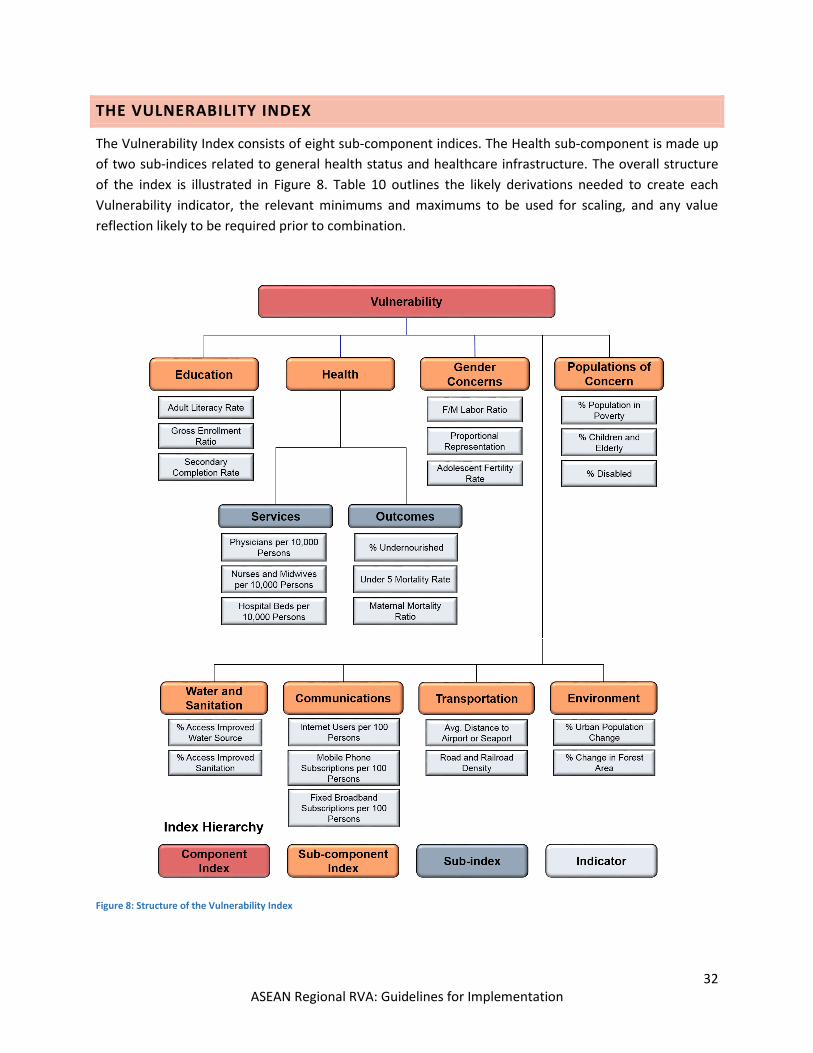
32 ASEAN Regional RVA: Guidelines for Implementation
THE VULNERABILITY INDEX
The Vulnerability Index consists of eight sub-component indices. The Health sub-component is made up
of two sub-indices related to general health status and healthcare infrastructure. The overall structure
of the index is illustrated in Figure 8. Table 10 outlines the likely derivations needed to create each
Vulnerability indicator, the relevant minimums and maximums to be used for scaling, and any value
reflection likely to be required prior to combination.
Figure 8: Structure of the Vulnerability Index
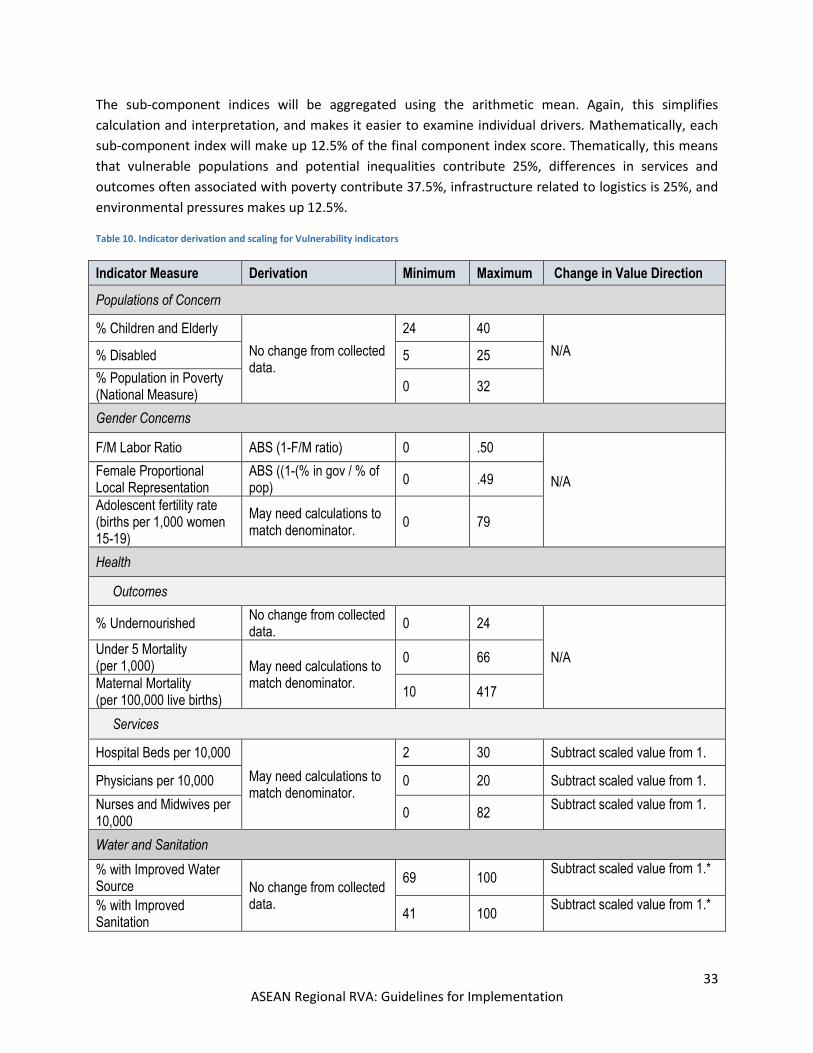
33 ASEAN Regional RVA: Guidelines for Implementation
The sub-component indices will be aggregated using the arithmetic mean. Again, this simplifies
calculation and interpretation, and makes it easier to examine individual drivers. Mathematically, each
sub-component index will make up 12.5% of the final component index score. Thematically, this means
that vulnerable populations and potential inequalities contribute 25%, differences in services and
outcomes often associated with poverty contribute 37.5%, infrastructure related to logistics is 25%, and
environmental pressures makes up 12.5%.
Table 10. Indicator derivation and scaling for Vulnerability indicators
Indicator Measure Derivation Minimum Maximum Change in Value Direction
Populations of Concern
% Children and Elderly
No change from collected data.
24 40
N/A
% Disabled 5 25
% Population in Poverty (National Measure)
0 32
Gender Concerns
F/M Labor Ratio ABS (1-F/M ratio) 0 .50
N/A
Female Proportional Local Representation
ABS ((1-(% in gov / % of pop)
0 .49
Adolescent fertility rate (births per 1,000 women 15-19)
May need calculations to match denominator.
0 79
Health
Outcomes
% Undernourished No change from collected data.
0 24
N/A Under 5 Mortality (per 1,000) May need calculations to
match denominator.
0 66
Maternal Mortality (per 100,000 live births)
10 417
Services
Hospital Beds per 10,000
May need calculations to match denominator.
2 30 Subtract scaled value from 1.
Physicians per 10,000 0 20 Subtract scaled value from 1.
Nurses and Midwives per 10,000
0 82 Subtract scaled value from 1.
Water and Sanitation
% with Improved Water Source No change from collected
data.
69 100 Subtract scaled value from 1.*
% with Improved Sanitation
41 100 Subtract scaled value from 1.*
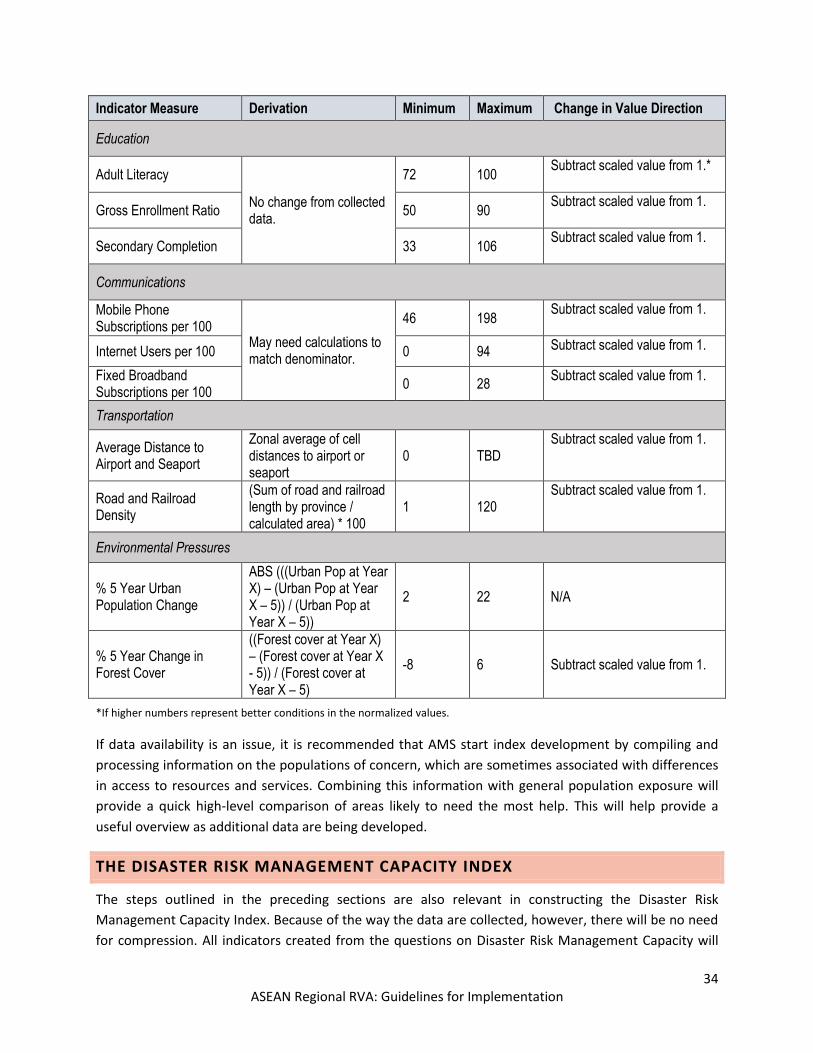
34 ASEAN Regional RVA: Guidelines for Implementation
Indicator Measure Derivation Minimum Maximum Change in Value Direction
Education
Adult Literacy
No change from collected data.
72 100 Subtract scaled value from 1.*
Gross Enrollment Ratio 50 90 Subtract scaled value from 1.
Secondary Completion 33 106 Subtract scaled value from 1.
Communications
Mobile Phone Subscriptions per 100
May need calculations to match denominator.
46 198 Subtract scaled value from 1.
Internet Users per 100 0 94 Subtract scaled value from 1.
Fixed Broadband Subscriptions per 100
0 28 Subtract scaled value from 1.
Transportation
Average Distance to Airport and Seaport
Zonal average of cell distances to airport or seaport
0 TBD Subtract scaled value from 1.
Road and Railroad Density
(Sum of road and railroad length by province / calculated area) * 100
1 120 Subtract scaled value from 1.
Environmental Pressures
% 5 Year Urban Population Change
ABS (((Urban Pop at Year X) – (Urban Pop at Year X – 5)) / (Urban Pop at Year X – 5))
2 22 N/A
% 5 Year Change in Forest Cover
((Forest cover at Year X) – (Forest cover at Year X - 5)) / (Forest cover at Year X – 5)
-8 6 Subtract scaled value from 1.
*If higher numbers represent better conditions in the normalized values.
If data availability is an issue, it is recommended that AMS start index development by compiling and
processing information on the populations of concern, which are sometimes associated with differences
in access to resources and services. Combining this information with general population exposure will
provide a quick high-level comparison of areas likely to need the most help. This will help provide a
useful overview as additional data are being developed.
THE DISASTER RISK MANAGEMENT CAPACITY INDEX
The steps outlined in the preceding sections are also relevant in constructing the Disaster Risk
Management Capacity Index. Because of the way the data are collected, however, there will be no need
for compression. All indicators created from the questions on Disaster Risk Management Capacity will
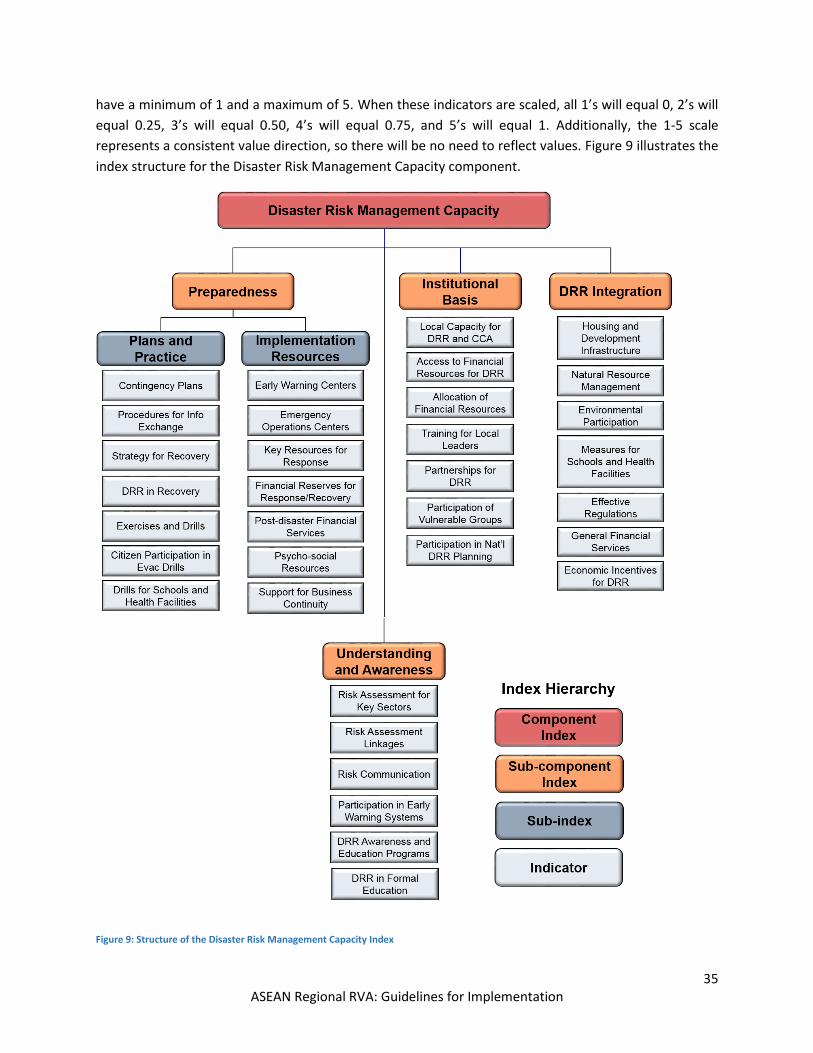
35 ASEAN Regional RVA: Guidelines for Implementation
have a minimum of 1 and a maximum of 5. When these indicators are scaled, all 1’s will equal 0, 2’s will
equal 0.25, 3’s will equal 0.50, 4’s will equal 0.75, and 5’s will equal 1. Additionally, the 1-5 scale
represents a consistent value direction, so there will be no need to reflect values. Figure 9 illustrates the
index structure for the Disaster Risk Management Capacity component.
Figure 9: Structure of the Disaster Risk Management Capacity Index
36 ASEAN Regional RVA: Guidelines for Implementation
As with the Vulnerability Index, all sub-component indices will be weighted equally when averaged. The
Preparedness Plans and Practice and Preparedness Implementation Resources sub-indices will be
averaged to create the Preparedness sub-component index. In the Disaster Risk Management Capacity
Index, all sub-components contribute 25% to the final score.
ASSESSING SOCIETAL RISK
In order to maintain consistency, transparency, and ease of interpretation, the index representing
relative societal risk will be created using an arithmetic mean. However, because the Disaster Risk
Management Capacity Index is conceptually reversed, it is necessary to subtract the index score from 1
before averaging. The calculation can be represented as R = [MHE + V + (1-DRMC)] / 3. Once preliminary
Multi-Hazard Exposure indicator minimums and maximums are established, the final index and all
contributing indices index will be directly comparable at a regional level. It is recommended that the
RAA Working Group revisit all components after 1-2 years and consistently evaluate changes in data
availability and quality as well as any changes in priorities or constraints.
A hazard independent Lack of Resilience Index would also be comparable across AMS and might be
beneficial for dynamic estimation of Risk based on impending hazard events in addition to guiding
general investment focus and prioritization. Lack of Resilience can be calculated as LR = [V + (1-DRMC)] /
2. In later phases of implementation, this index can be used to modify and contextualize measures of
physical risk, aspects of which are addressed in the supplemental implementation handbook.
VISUALIZATION
Visualization is the last step of index development, helping to communicate results to those who will use
the inputs and outputs for decision making. Tables and maps are both useful decision support tools;
integration into DMRS will further increase the utility of the assessment and supporting data. Figure 10
illustrates outputs in two different forms. Figure 11 depicts the login page of DMRS, which is maintained
by the AHA Centre and available to support all AMS.
High-level outputs sent to the AHA Center will be compiled and ranked, and likely visualized using equal
intervals. For visualization at the national level, it is recommended that indices be ranked and then
visualized using quantiles instead. The ASEAN RVA Template supports national level ranking.

37 ASEAN Regional RVA: Guidelines for Implementation
Figure 10. Visualizing data for decision makers (sample)
Figure 11. Login page of the Disaster Monitoring and Response System (DMRS)
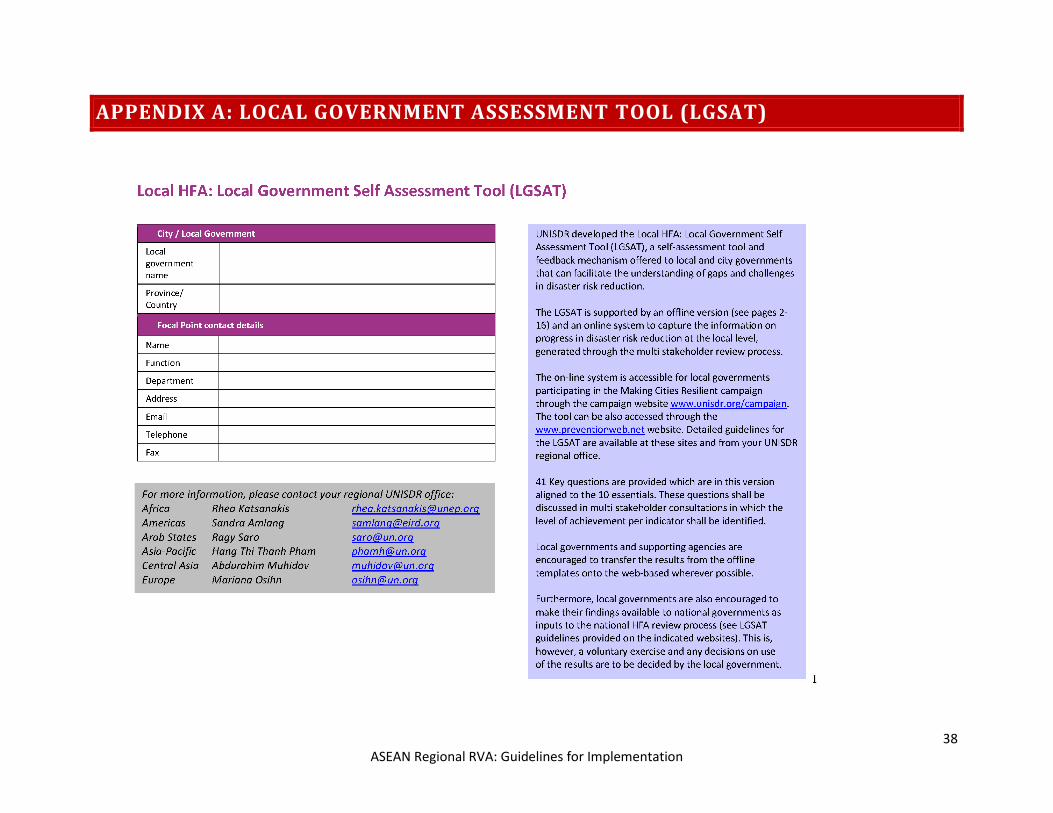
38 ASEAN Regional RVA: Guidelines for Implementation
APPENDIX A: LOCAL GOVERNMENT ASSESSMENT TOOL (LGSAT)
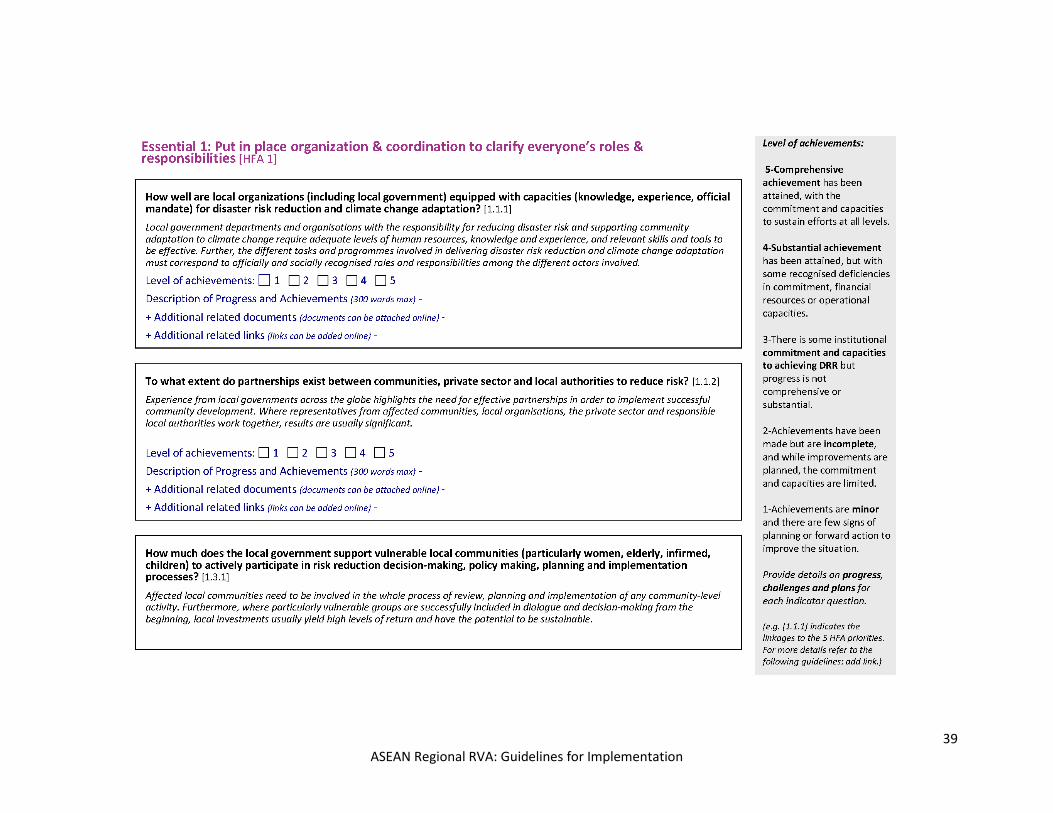
39 ASEAN Regional RVA: Guidelines for Implementation
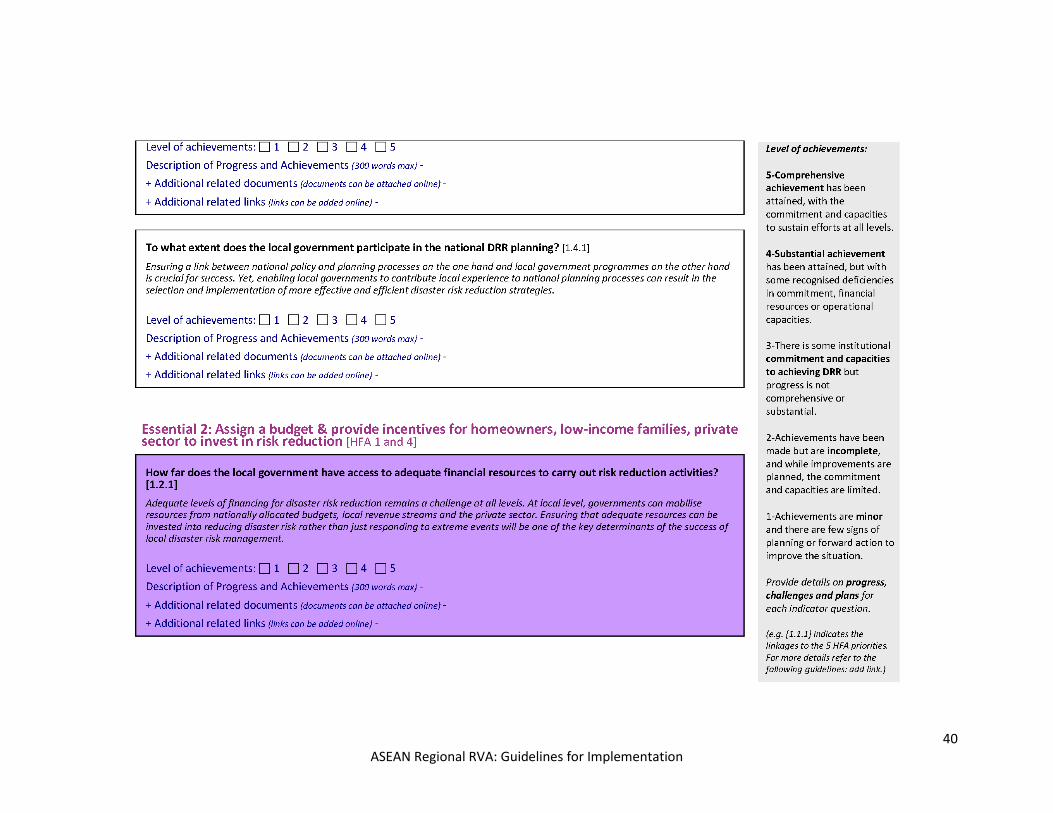
40 ASEAN Regional RVA: Guidelines for Implementation
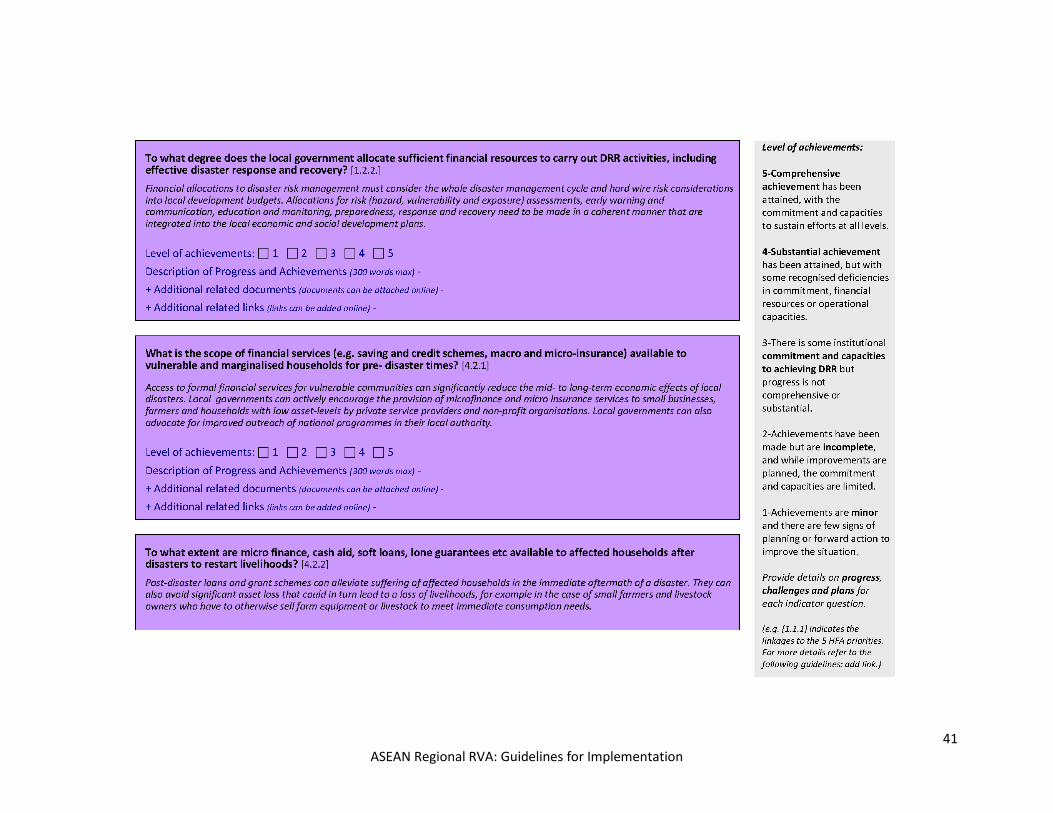
41 ASEAN Regional RVA: Guidelines for Implementation

42 ASEAN Regional RVA: Guidelines for Implementation
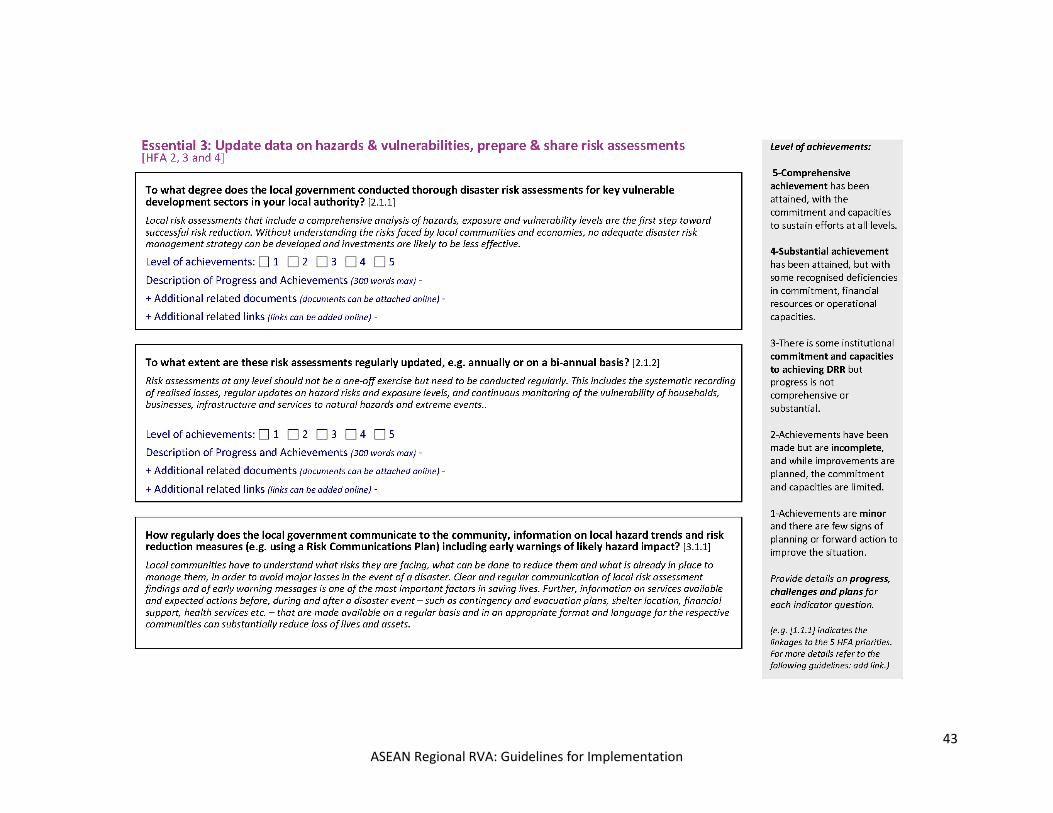
43 ASEAN Regional RVA: Guidelines for Implementation

44 ASEAN Regional RVA: Guidelines for Implementation
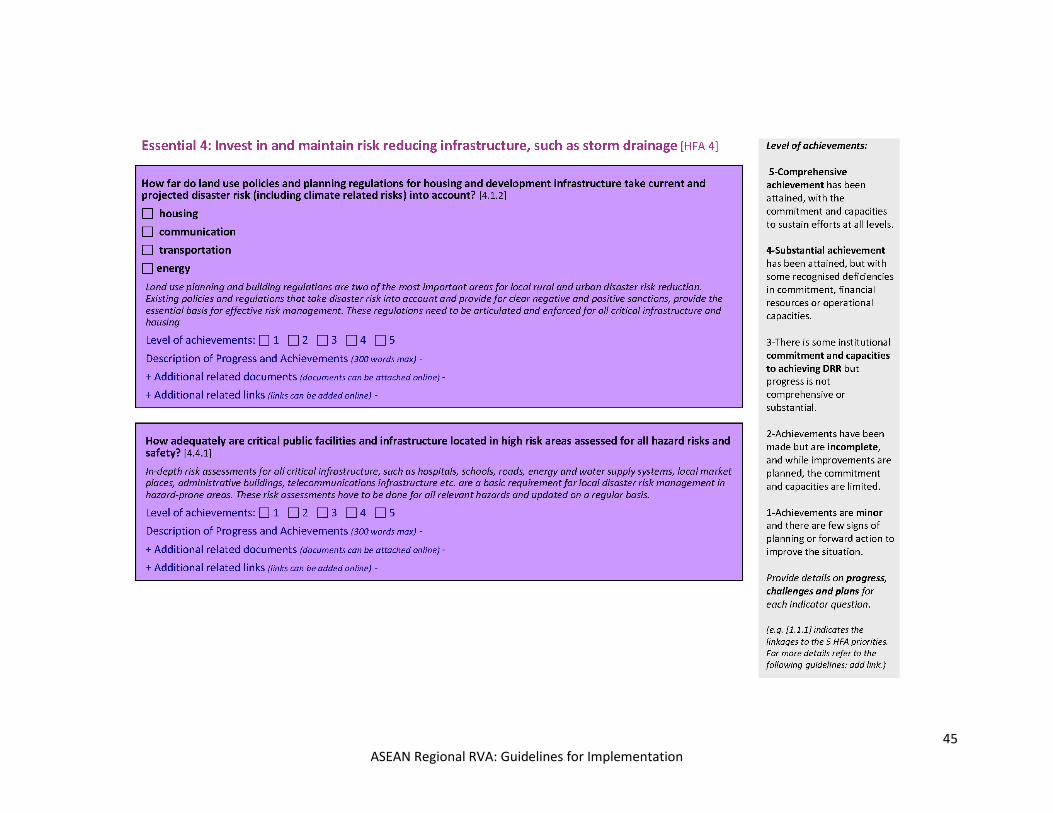
45 ASEAN Regional RVA: Guidelines for Implementation
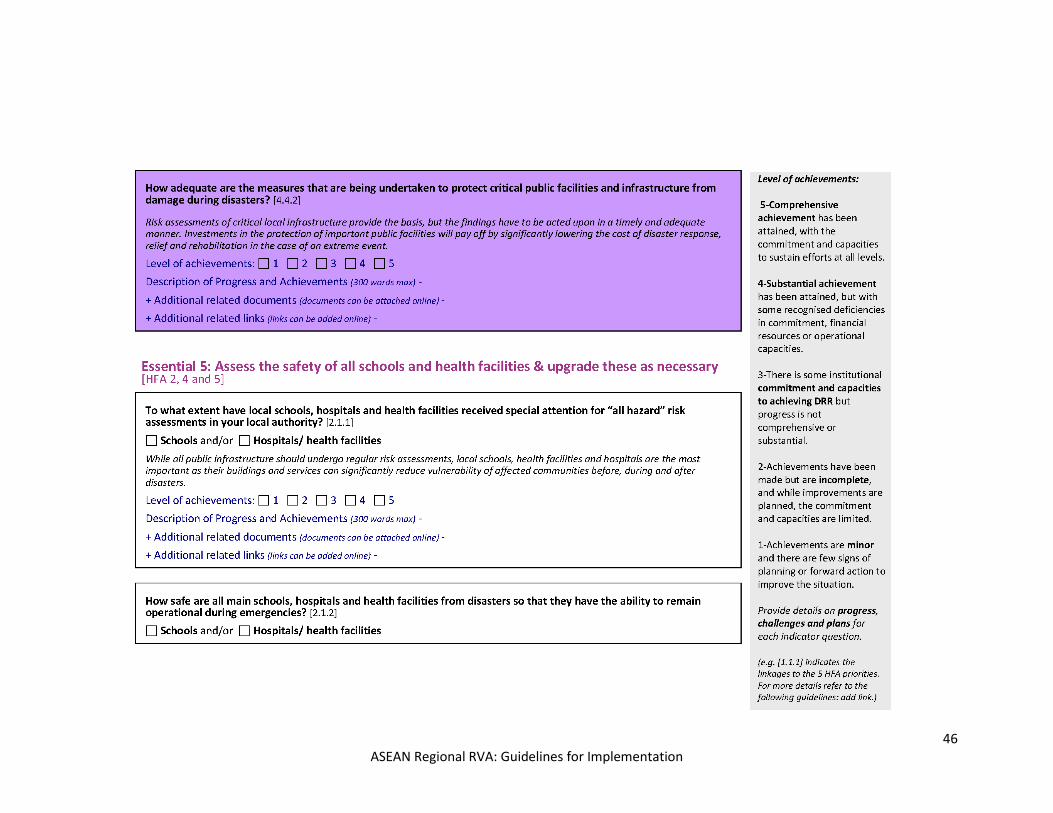
46 ASEAN Regional RVA: Guidelines for Implementation
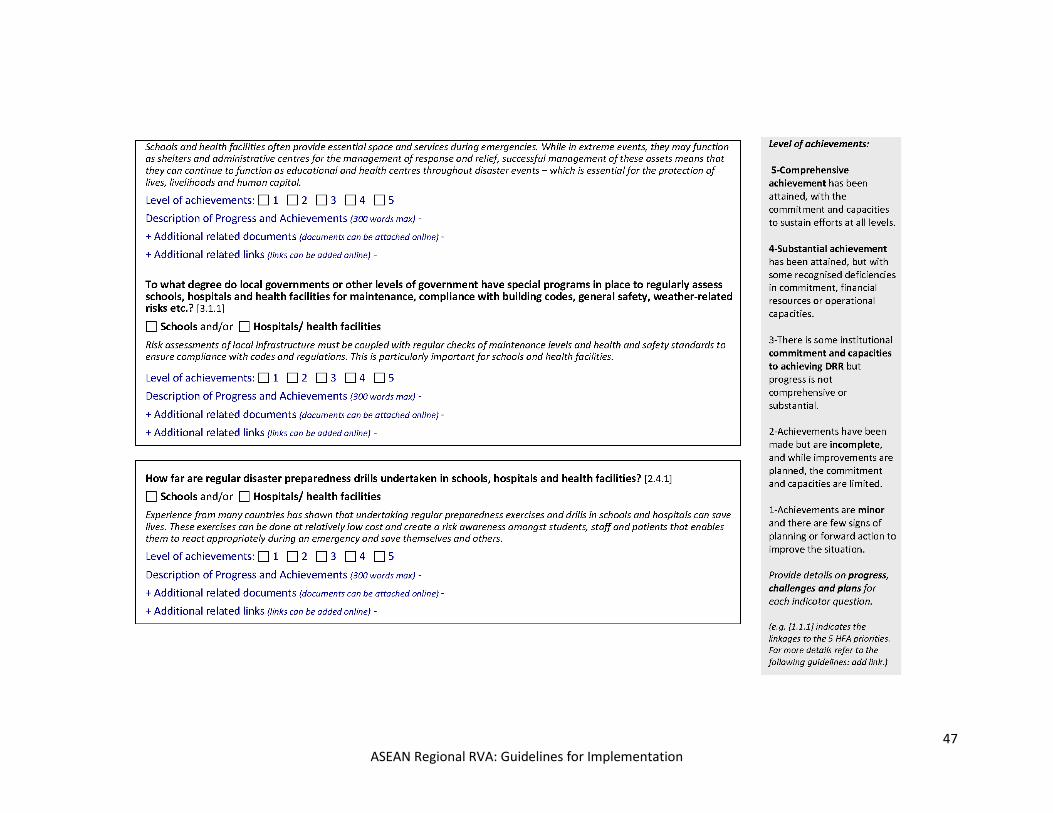
47 ASEAN Regional RVA: Guidelines for Implementation
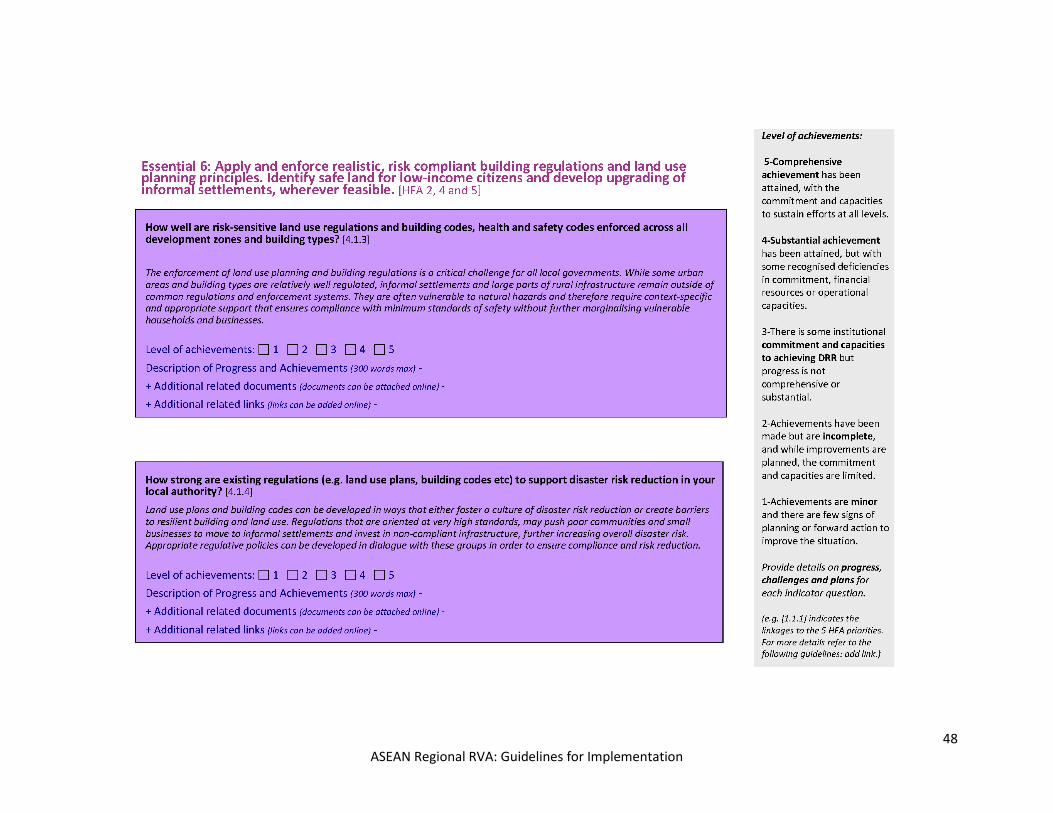
48 ASEAN Regional RVA: Guidelines for Implementation
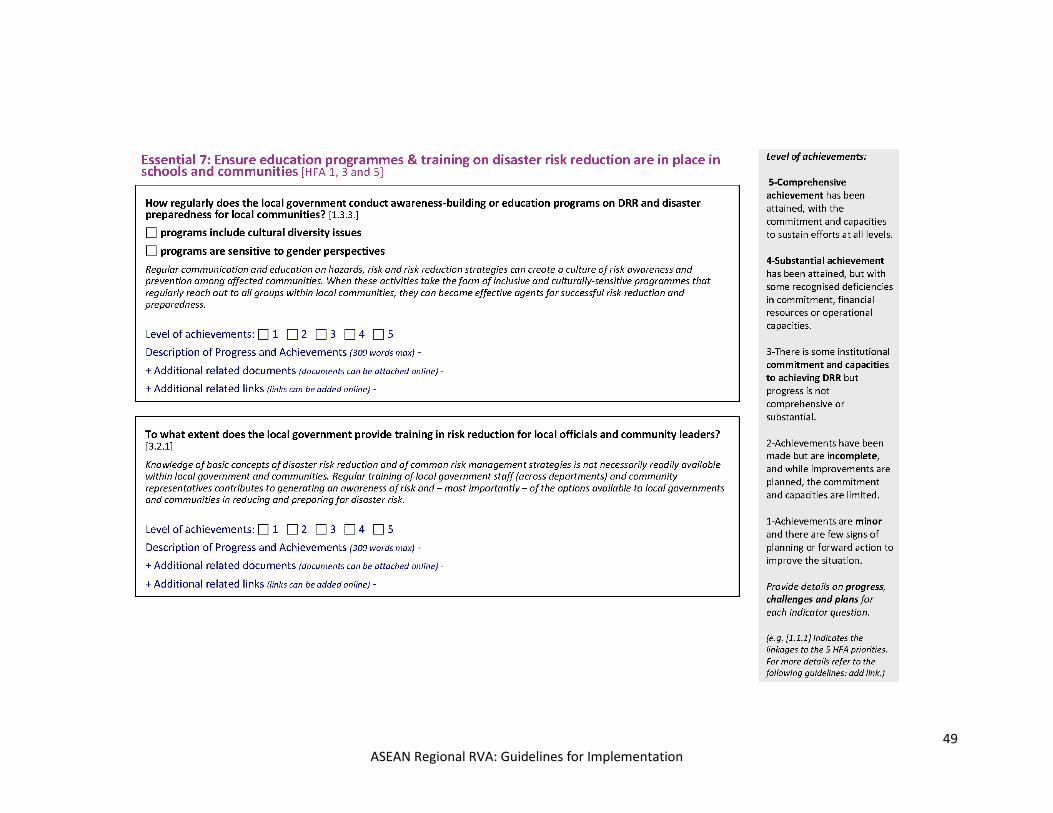
49 ASEAN Regional RVA: Guidelines for Implementation
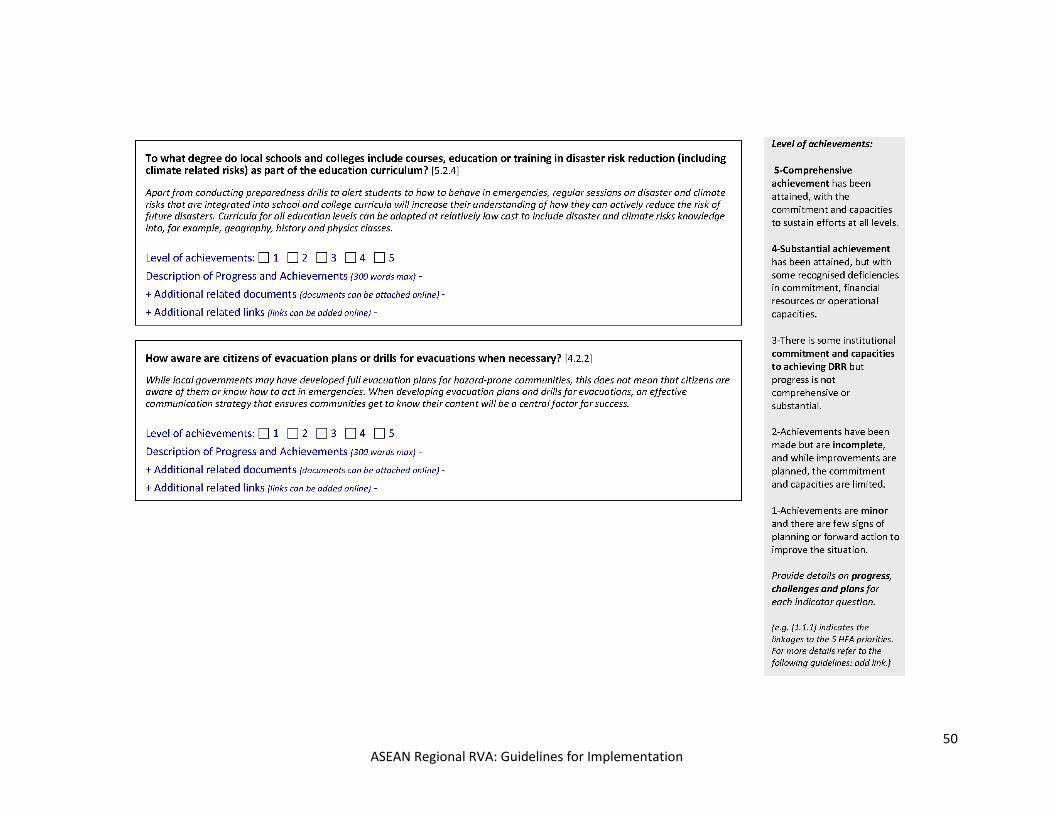
50 ASEAN Regional RVA: Guidelines for Implementation
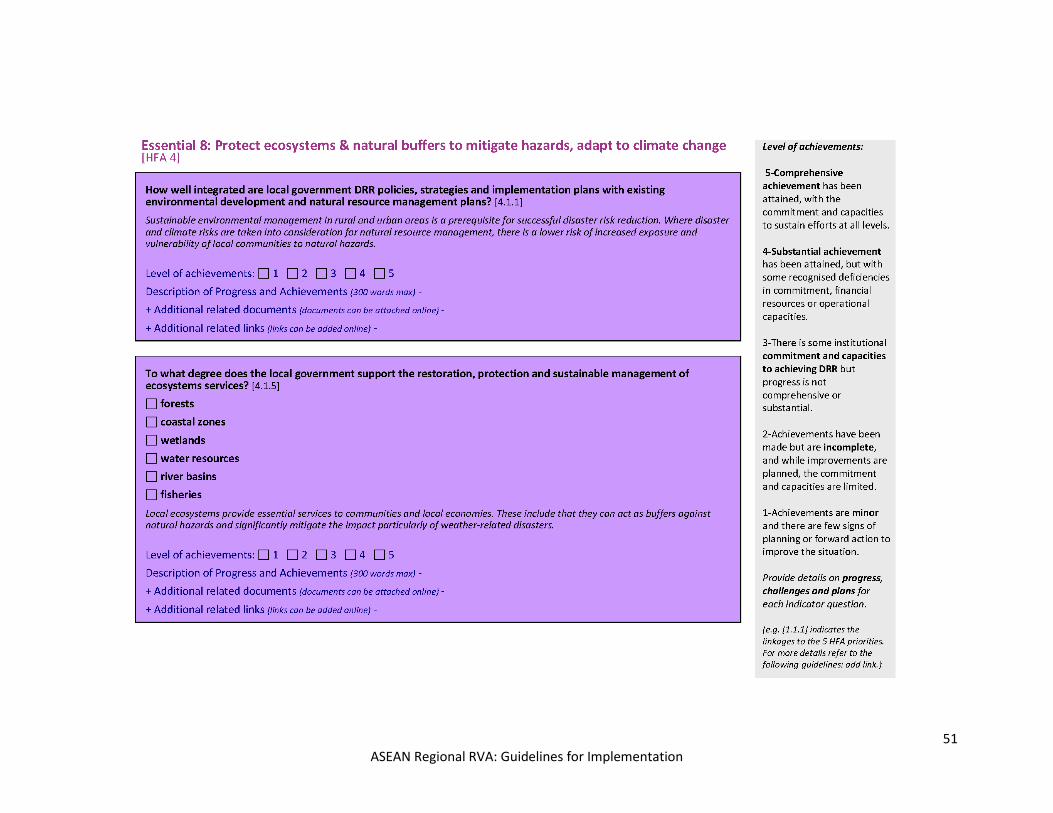
51 ASEAN Regional RVA: Guidelines for Implementation
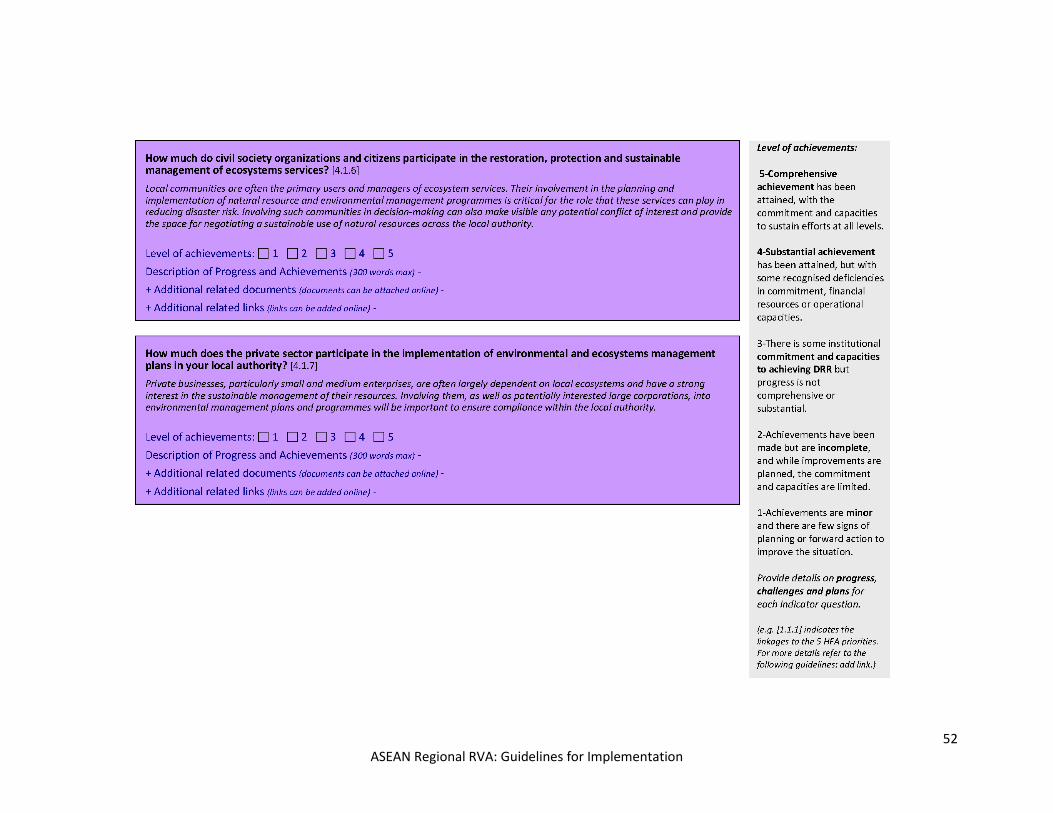
52 ASEAN Regional RVA: Guidelines for Implementation
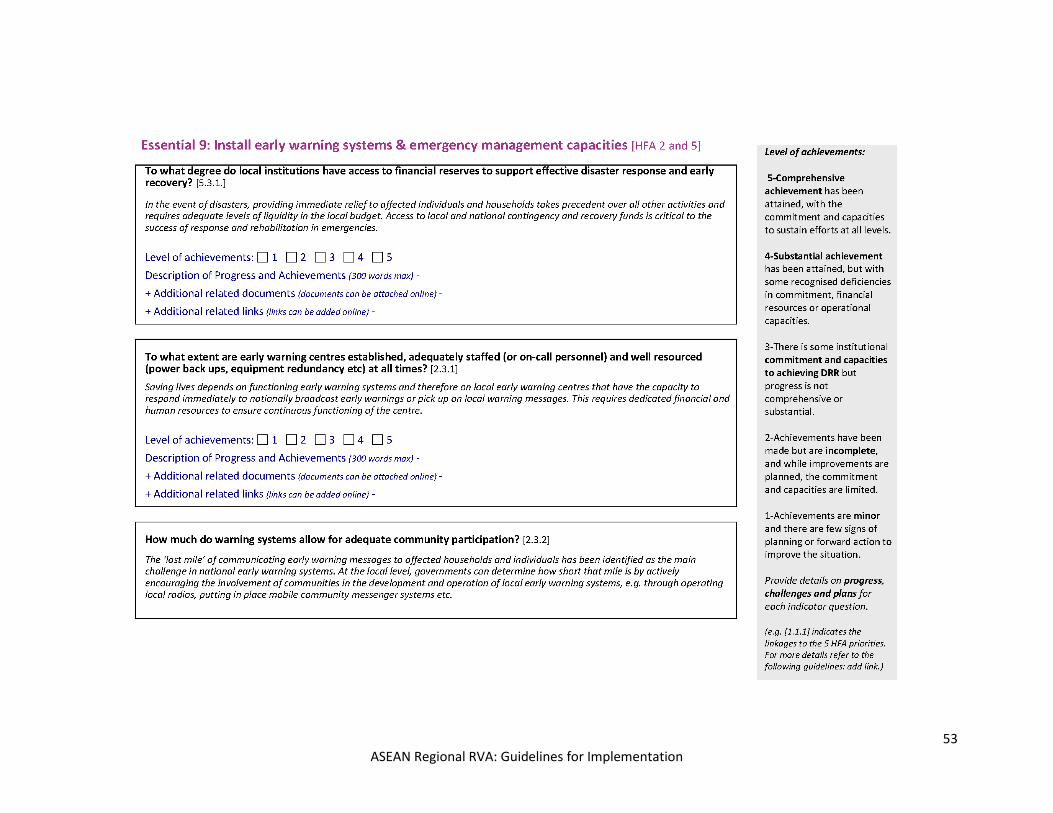
53 ASEAN Regional RVA: Guidelines for Implementation

54 ASEAN Regional RVA: Guidelines for Implementation
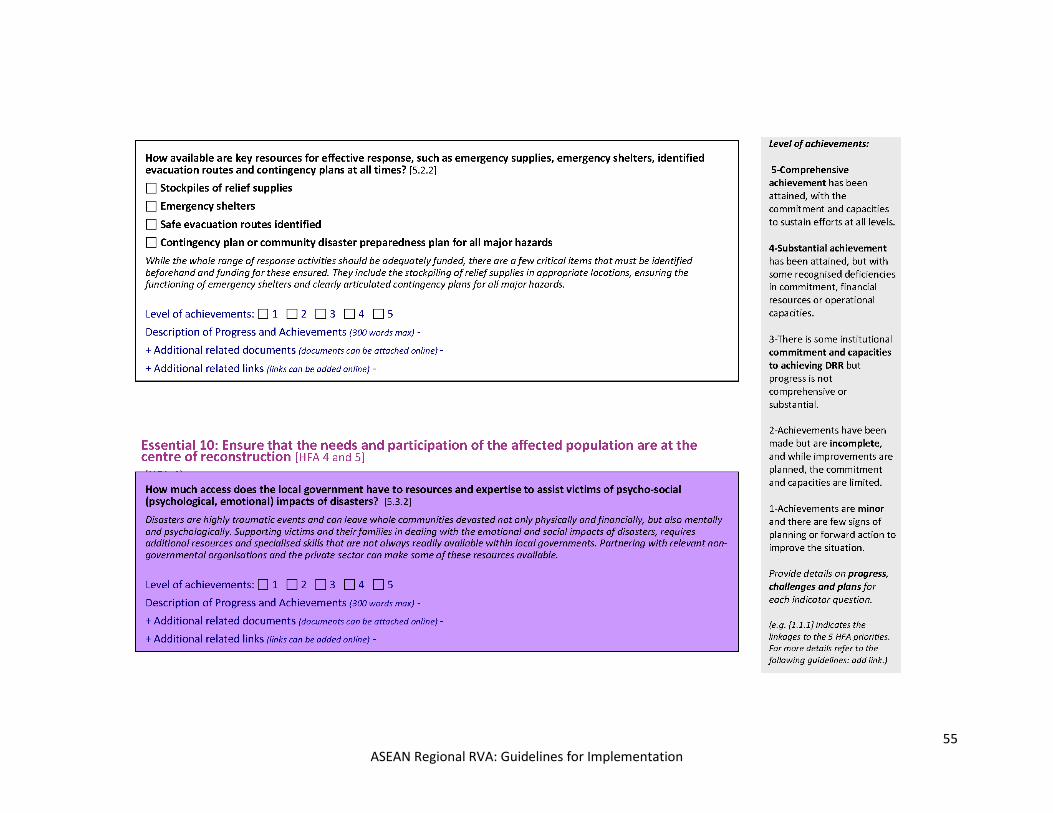
55 ASEAN Regional RVA: Guidelines for Implementation
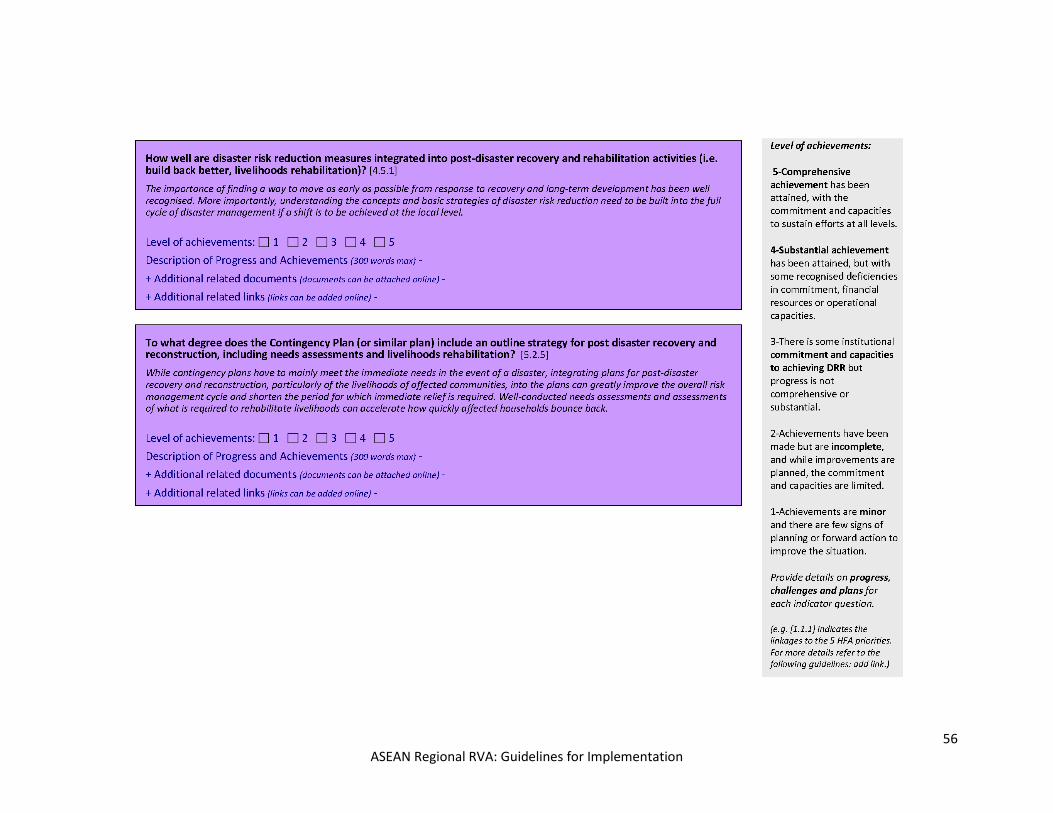
56 ASEAN Regional RVA: Guidelines for Implementation
57 ASEAN Regional RVA: Guidelines for Implementation
APPENDIX B: LIST OF REFERENCES ASEAN Committee on Disaster Management (ACDM). (2016). AADMER Work Programme 2016-2020.
Launched at the 28th Meeting of the ASEAN Committee on Disaster Management, 26-28 April, Semarang, Indonesia.
ASEAN. (2013). ASEAN Agreement on Disaster Management and Response (AADMER) Work Programme for 2010-2015, 4th Reprint. Jakarta: ASEAN Secretariat. Retrieved from: http://www.asean.org/resources/publications/asean-publications/item/asean-agreement-on-disaster-management-and-emergency-response-aadmer-work-programme-2010-2015-4th-reprint.
ASEAN Secretariat. (2006). ASEAN Agreement on Disaster Management and Response. Jakarta: ASEAN Secretariat.
ASEAN Secretariat. (2012). From Risk to Resilience: ASEAN Strategy on Disaster Risk Assessment. ASEAN Regional Risk Assessment Scoping Workshop Report. Jakarta Indonesia: ASEAN_UNISDR.
Badan Informasi Geospasial (BIG) Geoportal. (2015). Retrieved from: http://tanahair.indonesia.go.id/home/
Bell, H.M., Green, J.W., and Livengood, J.T. (2015). Gap Analysis Report: Supporting the Development of ASEAN Risk and Vulnerability Assessment (RVA) Guidelines. Report prepared for ASEAN-US PROGRESS. Maui, HI: PDC.
Center for International Earth Science and Information Network (CIESIN). Socioeconomic Data and Applications Center (SEDAC). Available at: http://sedac.ciesin.columbia.edu/data/sets/browse.
Department of Ecnomic Planning and Development, Brunei Darussalam. (2010-2015). Census Data. Retrieved from http://www.depd.gov.bn/statistic_data.html
Department of Public Works, Republic of the Philippines. (2013). DPWH Atlas 2013. Retrieved from http://www.dpwh.gov.ph/infrastructure/infra_stat/2013%20Atlas/index.htm
Department of Statistics (DOS), Ministry of Planning and Investment Lao PDR,. (2005). The Geography of Poverty and Inequality in the Lao PDR: An analysis based on the 2005 Population and Housing Census. Retrieved from http://www.laoatlas.net/Welcome.html
Department of Statistics Malaysia. (2015). Official Census Portal. Retrieved from https://www.statistics.gov.my/.
Department of Statistics Singapore. (2015). Singapore Census. Retrieved from http://www.singstat.gov.sg/.
DesInventar: Disaster Information Management System. Available at: http://www.desinventar.net/index_www.html.
European Space Agency (ESA). “ASTR World Fire Atlas.” Available at: http://due.esrin.esa.int/page_wfa.php.
Food and Agriculture Organization of the United Nations (FAO). GeoNetwork. Available at: http://www.fao.org/geonetwork/srv/en/main.home.
General Statistics Office of Viet Nam. (1999). Population and Housing Census Vietnam. Retrieved from: http://www.gso.gov.vn/default_en.aspx?tabid=476&idmid=4&ItemID=1841.
General Statistics Office of Viet Nam. (2015). Tranport, Postal Services and Telecommunications. Retrieved from: http://www.gso.gov.vn/default_en.aspx?tabid=473&idmid=&ItemID=3.
Guha-Sapir, D., Below, R., and Hoyois, Ph. EM-DAT: The CRED/OFDA International Disaster Database. Brussels: Université Catholique de Louvain. Available at: http://www.emdat.be/.
Malaysian Center for Geospatial Data Infrastructure (MaCGDI). Malaysia Map - GIS System. Retrieved from: http://1malaysiamap.mygeoportal.gov.my/
58 ASEAN Regional RVA: Guidelines for Implementation
Malaysian Remote Sensing Agency. (2015). Data Catalogue. Retrieved from: http://rsdc.remotesensing.gov.my/rsdc/Searching.aspx?Pid=4&TempId=1DDD86DF-1DD4-BF52-E050-0007F01004EB8.
Myanmar Information Management Unit (MIMU). (2015). Retrieved from: http://themimu.info/baseline-datasets.
Ministry of Agriculture, Indonesia (Kementerian Pertanian RI). (2015). Agricultural Census. Retrieved from: http://www.pertanian.go.id/ap_indikator/view.
Ministry of Education, Youth and Sport, Cambodia. (2014). Education Statistics and Indicators. Retrieved from: http://www.moeys.gov.kh/en/emis/577.html#.VdfWwPlVhHx.
Ministry of Health, Brunei Darussalam,. (2013). Minsitry of Health Indicators. Retrieved from: http://www.moh.gov.bn/satisticshealthguidelines/indicators.htm.
Ministry of Health, Myanmar. (2014). Health Statistics Census 2014. Retrieved from: http://www.moh.gov.mm/file/HEALTH%20STATISTICS.pdf.
Ministry of Health, Singapore. (2015). Statistics. Retrieved from: https://www.moh.gov.sg/content/moh_web/home/statistics.html.
Ministry of Public Works and Transport, Kingdom of Cambodia. (2015). Retrieved from http://www.mpwt.gov.kh/.
Ministry of Transportation, Kingdom of Thailand. (2010). Ministry of Transportation GIS Portal. Retrieved from: http://gisportal.mot.go.th/.
Minstry of Health, Department of Planning and Health Information, Kingdom of Cambodia. (2011). National Health Information System (NHIS) in Cambodia. Retrieved from: http://www.hiscambodia.org/public/health_statistic_en.php?m=6.
National Board for Disaster Management (BNPB). (2015b). Indonesian Disaster Data and Information Retrieved from: http://dibi.bnpb.go.id/.
National Committee for Disaster Managment (NCDM). (2015). Cambodia Disaster Loss and Damage Information System (CamDi). Retrieved from: http://camdi.ncdm.gov.kh/DesInventar/profiletab.jsp.
National Geographic Department, Lao PDR. (2010). Geoportal. Retrieved from: http://www.ngd.la/?p=1378&lang=en.
National Institute of Statistics- Minstry of Planning- Directorate General for Health - Minstry of Health. (2008). Cambodia General Population Census 2008. Retrieved from: http://nada.nis.gov.kh/index.php/catalog/1.
National Institute of Statistics- Minstry of Planning- Directorate General for Health - Minstry of Health. (2010). Cambodia Demographic and Health Survey. Retrieved from http://nada.nis.gov.kh/index.php/catalog/5.
National Institute of Statistics- Minstry of Planning- Directorate General for Health - Minstry of Health. (2011). Economic Census of Cambodia. Retrieved from: http://nada.nis.gov.kh/index.php/catalog/27.
National Institute of Statistics- Minstry of Planning- Directorate General for Health - Minstry of Health. (2012a). Cambodia Labor Force and Child Labor Survey 2012. Retrieved from: http://nada.nis.gov.kh/index.php/catalog/22.
National Institute of Statistics- Minstry of Planning- Directorate General for Health - Minstry of Health. (2012b). Cambodia School-to-Work Transition Survey 2012. Retrieved from: http://nada.nis.gov.kh/index.php/catalog/26.
National Institute of Statistics- Minstry of Planning- Directorate General for Health - Minstry of Health. (2012c). Cambodia Socio-Economic Survey 2012. Retrieved from: http://nada.nis.gov.kh/index.php/catalog/25.
59 ASEAN Regional RVA: Guidelines for Implementation
National Institute of Statistics- Minstry of Planning- Directorate General for Health - Minstry of Health. (2013a). Inter-Censal Population Survey 2013, Count People and Households. Retrieved from: http://nada.nis.gov.kh/index.php/catalog/21.
National Institute of Statistics- Minstry of Planning- Directorate General for Health - Minstry of Health. (2013b). National Census of Agriculture in Cambodia 2013. Retrieved from: http://nada.nis.gov.kh/index.php/catalog/29.
National Mapping and Resource Information Authority (NAMRIA). (2015). Retrieved from http://namria.gov.ph/
National Security Council Prime Minister's Department Malaysia. (2015). Disaster Portal (Portal Bencana) Retrieved from: http://portalbencana.mkn.gov.my/Portal/Disaster/StatsByDisasterType.
National Statistical Office, Ministry of Information and Communicatoin Technology, Kingdom of Thailand. (2000). Year 2000 Population and Housing Census. Retrieved from http://web.nso.go.th/en/census/poph/cen_poph.htm
National Statistical Office, Ministry of Information and Communicatoin Technology, Kingdom of Thailand. (2010). Economic Indicators. Retrieved from http://web.nso.go.th/en/stat_theme_eco.htm
Republic of the Philippines, Department of Education. (2015). Education Datasets. Retrieved from http://www.deped.gov.ph/datasets
Republic of the Philippines, Department of Health. (2015a). National Health Facility Registry v2.0. Retrieved from http://nhfr.doh.gov.ph/login.php
Republic of the Philippines, Department of Health. (2015b). Philippine Health Atlas. Retrieved from http://maps.doh.gov.ph/
Reyes, Marqueza and Pulmano, Nadia. (2013). ASEAN Capacity Building Forum of Risk Assessment. Bridging Science and Practice in Disaster Risk Management Towards Community Resilience. Bangkok, Thailand.
Singapore Government. (2015a). Singapore Government Data: Finance. Retrieved from http://data.gov.sg/common/search.aspx?theme=10
Singapore Government. (2015b). Singapore Government Data: Population and Household Data. Retrieved from http://data.gov.sg/common/search.aspx?theme=11
Sistem Informasi Geografis Infrastruktur Kementerian Pu (SIGI-PU) (2015). Retrieved from http://sigi.pu.go.id/
Smithsonian Institution Global Volcanism Program. (2013). Volcanoes of the World. Available at: http://volcano.si.edu/.
Statistics Bureau, Lao PDR. (2005). Population Census. Retrieved from http://nsc.gov.la/en/Census1.php Statistics Indonesia (Badan Pusat Statistik). (2015a). Social and Population Statistics. Retrieved from
http://www.bps.go.id/Subjek/view/id/12#subjekViewTab3|accordion-daftar-subjek1. Statistics Indonesia (Badan Pusat Statistik). (2015b). Transportation Statistics. Retrieved from
http://www.bps.go.id/index.php/subjek/17. The Steering Committee for the Agricultural Census Agriculturla Census Office Lao PDR. (2012). Lao
Census of Agriculture 2010/11 Highlights. Retrieved from http://nsc.gov.la/en/PDF/up%20date%20Agriculture%20census_2010_2011_English.pdf
The Steering Committee on Economic Census Lao PDR. (2002). Report of Economic Census, 2006. Volume 1. Retrieved from http://nsc.gov.la/en/PDF/Final_report_Economic%20census_2006.pdf.
Survey Department, Ministry of Development, Brunei. (2015). Geoportal. Retrieved from http://survey.gov.bn/web/survey_department/home
United Nations. (2008). “Official List of the Millennium Development Goals Indicators.” Available at: http://mdgs.un.org/unsd/mdg/Host.aspx?Content=Indicators/OfficialList.htm.
60 ASEAN Regional RVA: Guidelines for Implementation
United Nations. (2016). Official List of Sustainable Development Goals Indicators. Available at: http://unstats.un.org/sdgs/indicators/indicators-list/.
UN Development Programme (UNDP) Bureau for Crisis Prevention and Recovery. (2013). Issue Brief: Disaster Risk Governance. Retrieved from: http://www.preventionweb.net/files/29974_20121311issuebriefdisasterriskreduc.pdf.
UNEP/UNISDR. (2013). Global Risk Data Platform. Available at: http://preview.grid.unep.ch/. UNISDR. (2005). Hyogo Framework for Action 2005-2015: Building the Resilience of Nations and
Communities to Disaster. Retrieved from: https://www.unisdr.org/we/inform/publications/1037.
UNISDR. (2009).Terminology on Disaster Risk Reduction. Retrieved from: http://www.unisdr.org/we/inform/terminology.
UNISDR. (2011a). Local HFA: Local Government Self Assessment Tool (LGSAT). Available at: http://www.preventionweb.net/english/hyogo/hfa-monitoring/local/?pid:73&pil:1.
UNISDR. (2011b). A Practical Guide to Local HFA: Local Self-Assessment of Progress in Disaster Risk Reduction. Available at: http://www.preventionweb.net/applications/hfa/assets/lgsat/documents/GuidanceNote.pdf.
UNISDR. (2015a). The Sendai Framework for Disaster Risk Reduction 2015-2030. Retrieved from: http://www.unisdr.org/we/inform/publications/43291.
UNISDR. (2015b). Global Assessment Report on Disaster Risk Reduction 2015. Retrieved from: http://www.preventionweb.net/english/hyogo/gar/2015/en/home/GAR_2015/GAR_2015_1.html.
UNISDR. (2015c). GAR Risk Data Platform. Available at: http://risk.preventionweb.net/capraviewer/main.jsp?countrycode=g15.
UNOCHA. “Cluster Coordination.” Available at: http://www.unocha.org/what-we-do/coordination-tools/cluster-coordination.
US Department of Homeland Security Risk Steering Committee. (2010). DHS Risk Lexicon, 2010 Edition. Retrieved from: https://www.dhs.gov/xlibrary/assets/dhs-risk-lexicon-2010.pdf.
Viet Nam Department of Natural Disaster Prevention and Control Committee. (2015). Disaster Database. Retrieved from http://phongchongthientai.vn/t-t/ql-thien-tai/-c43.html#
WHO. (2011). World Report on Disability. Retrieved from: http://www.who.int/disabilities/world_report/2011/en/.
World Resources Institute (WRI) (2015). Aqueduct Global Flood Analyzer. Available at: http://www.wri.org/resources/maps/aqueduct-global-flood-analyzer.


![[Ci2015] sim rva](https://img.dokumen.tips/doc/110x75/55c9636bbb61eb75578b45e9/ci2015-sim-rva.jpg)