Embed Size (px)
Citation preview

WP/15/34
ASEAN Financial Integration
Geert Almekinders, Satoshi Fukuda, Alex Mourmouras, Jianping Zhou
& Yong Sarah Zhou

© 2015 International Monetary Fund WP/15/34
IMF Working Paper
Asia and Pacific Department
ASEAN Financial Integration1 2
Geert Almekinders, Satoshi Fukuda, Alex Mourmouras, Jianping Zhou and Yong Sarah Zhou
February 2015
Abstract
The establishment of the ASEAN Economic Community (AEC) at end-2015 has brought into sharp focus the issue of financial and economic integration in the region. This paper takes stock of ASEAN’s financial integration and prospects. ASEAN integration could accelerate in the years ahead; it will likely be a safe, gradual process consistent with the “ASEAN way” of consensus decision-making. Properly phased and sequenced, closer financial integration has the potential to help increase real incomes and accelerate real convergence within ASEAN and narrow the region’s gap with advanced Asia. Realizing the promise of financial integration will require ASEAN countries to make long-term investments in financial infrastructure. Policymakers can draw on the experience of their more advanced peers and of other regions. Gradualism and safeguards should not be excuses for inaction or financial protectionism. Reliance on flexible policy frameworks and a strengthened and tested regional financial safety net should be part of the agenda. Closer engagement with the Fund could also help.
JEL Classification Numbers: F21, F33
Keywords: ASEAN, Financial integration, capital flows, financial sector liberalization.
Author’s E-Mail Addresses: [email protected]; [email protected]; [email protected]; [email protected]; [email protected]
1 A shorter version of this paper will appear in the forthcoming book on The Future of Asia’s Finance, edited by Cheng Hoon Lim and Chikahisa Sumi. The authors are grateful for helpful discussions with, and comments from, Vivek Arora, Sanchita Basu Das, Pek Koon Heng, Heedon Kang, Hoe Ee Khor, Kenneth Koh, the authorities of ASEAN member countries, Steve Russell, Jerry Schiff, Chikahisa Sumi, Shinji Takagi, and participants at a seminar in the IMF’s Asia and Pacific Department.
2 Mr. Satoshi Fukuda was a Summer Intern in the IMF’s Asia and Pacific Department when this paper was written.
This Working Paper should not be reported as representing the views of the IMF. The views expressed in this Working Paper are those of the author(s) and do not necessarily represent those of the IMF or IMF policy. Working Papers describe research in progress by the author(s) and are published to elicit comments and to further debate.

3
I. INTRODUCTION
The Association of Southeast Asian Nations (ASEAN) consists of a diverse group of ten fast-growing countries at different stages of economic and financial development: Brunei Darussalam, Cambodia, Indonesia, Lao P.D.R., Malaysia, Myanmar, the Philippines, Singapore, Thailand, and Vietnam. Their populations are young and growing and have high saving rates. But investment needs are also large, related to advancing urbanization, the region’s growing middle class, and the need to increase connectivity and provide hard and soft infrastructure. Coming out of the Asian financial crisis, ASEAN countries have made great strides in strengthening their macroeconomic frameworks and their external positions. The region has witnessed an increase in trade and capital flows, both within the region and with the rest of Asia and the world. ASEAN financial integration has also progressed. Direct investment has risen; cross-border banking linkages have deepened; and foreign participation in ASEAN capital markets has increased. This paper takes stock of ASEAN’s financial integration and its prospects. Financial integration in ASEAN could accelerate in the years ahead, including in the context of the establishment of the ASEAN Economic Community (AEC) in 2015 (Box 1). This will be a gradual, long term process that follows the “ASEAN way” of consensus decision-making. It provides a critical review of the AEC agenda, including impediments to (and risks from) closer financial integration from insufficient real and financial infrastructure in some countries. It concludes that greater the building of a modern, integrated financial services system in ASEAN together with greater integration with capital-abundant regions, including the “plus three” of Asia (China, Japan, and Korea), could end up pulling large amounts of capital into ASEAN even as global interest rates gradually increase. These pull forces could be potentially large, especially in less open ASEAN member countries. More open financial accounts could bring important benefits for ASEAN countries’ growth and development. Financial inclusion could increase and real convergence in per capita incomes could accelerate. This could help reduce poverty and ameliorate strong migration incentives in the region generated by large wage disparities. Realizing the promise of greater financial liberalization and capital market integration hinges critically on its proper phasing and sequencing. Theory and experience from other geographic regions suggest that greater financial openness could lead to greater volatility in some ASEAN countries. As the region’s financial integration gathers pace and barriers to cross-border flows are gradually removed, larger current account deficits will be financed by a mix of capital flows and risks will rise. The resulting increased macroeconomic volatility would need to be managed at the individual, regional, and global levels. The bouts of

4
volatility of cross-border capital flows since May 2013 related to the asynchronous unwinding of unconventional monetary policies in advanced economies serve as a reminder that the regional financial architecture is still a work in progress. In view of this, and given existing financial sector vulnerabilities in some of the low-income ASEAN countries, policymakers have been taking a cautious approach in moving forward with further financial and capital account liberalization. As they move further along with this process, ASEAN countries should continue to strengthen their macroeconomic frameworks and financial systems. They can rely on substantial quantities of international reserves and other buffers, including bilateral credit lines and regional financial safety nets (the Chiang Mai Initiative Multilaterilization (CMIM)), which could help their resilience to risk-on-risk-off cycles in capital flows. The rest of the paper is organized as follows. Section II briefly takes stock of growth and trade integration in ASEAN and assesses the state of ASEAN financial integration to date. Section III discusses benefits of further liberalization and regional integration in ASEAN. This is supported by the analysis, in the Appendix, of potential capital flows to ASEAN countries in the context of two benchmark open economy models. The Appendix also highlights barriers that typically inhibit cross-border flows and financial integration. This is used as a stepping stone to discuss policy measures at the national, ASEAN, and regional levels that would help promote further safe financial development and financial integration, including in the context of ASEAN countries’ commitment to establish the AEC (Section IV). Section V presents brief conclusions.
II. GROWTH, TRADE INTEGRATION, AND FINANCIAL INTEGRATION IN ASEAN
ASEAN countries have performed very well over the past decade. Since the turn of the century, ASEAN-wide economic growth has averaged 5¼ percent per annum (weighted average) and the economies of the individual member countries expanded by 5¾ percent per annum, on average (Text Figures, Table 1). As a result, important gains in living standards have been made. The success of most ASEAN member states has been associated with a long-standing export-oriented development strategy. Therefore, except for Indonesia, Myanmar, and the Philippines, ASEAN countries boast large trade openness with the sum of imports and exports of goods and services exceeding 100 percent of GDP. The downside of this large trade openness was visible when the slump in international trade in 2008–09 triggered by the global financial crisis (GFC) caused growth to slow in ASEAN. But this was followed by a pronounced rebound when international trade recovered.
Intra-ASEAN trade has grown rapidly but there is scope for further regional trade liberalization with potentially important benefits for growth and employment:

5
0
5
10
15
20
25
30
0
5
10
15
20
25
30
1990
1991
1992
1993
1994
1995
1996
1997
1998
1999
2000
2001
2002
2003
2004
2005
2006
2007
2008
2009
2010
2011
2012
2013
ASEAN trade with China (excl. Singapore)Singapore trade with ChinaSingapore's trade with ASEANIntra-ASEAN trade (excl. Singapore)
ASEAN: Intraregional Trade and Trade with China(In percent of total merchandise trade)
Sources: IMF, Direction of Trade Statistics; and IMF staff calculations.
Intra-ASEAN trade almost quadrupled since 2000, to US$630 billion in 2013. Excluding Singapore, whose large gross trade flows can cloud underlying trends in the other member countries, intra-ASEAN trade now represents 23 percent of total ASEAN trade, up from 21 percent in 2000. As such, ASEAN countries’ intra-regional trade remains considerably smaller than intraregional trade in the European Union (50 percent of total trade). Recent studies indicate that nontariff measures (NTMs) may be holding back the growth of regional trade in ASEAN (see, e.g., Basu Das and others, 2013 and World Bank, 2014). The gradual removal of these NTMs, consistent with the Strategic Schedule in the AEC 2015 Blueprint, could give a renewed impetus to the creation of the single ASEAN market for goods and services. China’s rising importance as a trading partner for ASEAN countries reflects increasing trade in intermediate goods as ASEAN countries and China integrate to form supply chain networks (IMF, 2010).
There are also signs that regional trade within ASEAN has become increasingly oriented to final consumer goods. This, together with a large and vibrant domestic market and a growing middle class, appears to provide the region with a potential source of resilience against global demand shocks. For instance, Cubero and others (2014) find that, besides global demand, intraregional demand is an important driver of ASEAN-5 growth (excluding Indonesia, which has a lower trade-to-GDP ratio and sends the bulk of its commodity-heavy exports outside ASEAN).
-8-6-4-202468101214
-8-6-4-202468
101214
1995
1996
1997
1998
1999
2000
2001
2002
2003
2004
2005
2006
2007
2008
2009
2010
2011
2012
2013
2014
Pro
j.20
15 P
roj.
ChinaASEAN (weighted avg.)ASEAN (simple avg.)Non-Asia World
Real GDP Growth(In percent)
Sources: IMF, World Economic Outlook; and IMF staff calculations.
4
5
6
7
8
9
10
4
5
6
7
8
9
10
19
90
19
91
19
92
19
93
19
94
19
95
19
96
19
97
19
98
19
99
20
00
20
01
20
02
20
03
20
04
20
05
20
06
20
07
20
08
20
09
20
10
20
11
20
12
20
13
GDP per Capita in Selected Asian Countries(in logs of current US$s)
ChinaThailandIndonesiaPhilippinesVietnamIndiaMalaysia
Source: IMF World Economic Outlook database.
10
12
14
16
18
20
22
24
26
28
10
12
14
16
18
20
22
24
26
28
1990
1991
1992
1993
1994
1995
1996
1997
1998
1999
2000
2001
2002
2003
2004
2005
2006
2007
2008
2009
2010
2011
2012
Capital goods Consumption goods Intermediate goods
ASEAN-5: Intraregional Exports by Category(In percent of total exports in each category)
Sources: UN, Comtrade; and IMF staff calculations.

6
Indonesia Malaysia Philippines Singapore ThailandBrunei
DarussalamCambodia Lao P.D.R. Myanmar Vietnam
GDP in 2013 (US$ billions) 870 313 272 298 387 16 16 11 57 171Population in 2013 (in millions) 248.0 29.9 97.5 5.4 68.2 0.4 15.1 6.8 51.0 89.7
GDP per capita in 2013 (in US$)Headline 3,510 10,457 2,791 55,182 5,676 39,659 1,028 1,594 1,113 1,902PPP-basis (2012) 1/ 4,272 14,775 3,803 53,266 8,459 45,979 2,150 4,335 3,989 3,133
Poverty in 2012 (percent of population) 1/Below US$2 per day 13.0 0.2 13.8 n.a. 0.7 n.a. 15.1 24.8 n.a. 13.5Below national poverty line 12.0 1.7 26.5 n.a. 13.2 n.a. 20.5 27.6 n.a. 20.7
Income inequality (Gini coefficient) 2000 29.7 37.9 46.1 43.4 42.8 n.a. 41.9 32.6 n.a. 37.62012 (or latest available year) 38.1 46.2 43.0 41.2 39.4 n.a. 36.0 36.7 n.a. 35.6
Growth (in percent)2010-12 (average) 6.3 6.1 6.0 7.9 4.8 2.3 6.8 8.0 6.2 6.02013 5.8 4.7 7.2 3.9 2.9 -1.8 7.4 8.0 8.3 5.4
Inflation (in percent, period average)2010-12 (average) 4.8 2.2 3.9 4.2 3.4 0.2 4.1 5.9 4.6 12.32013 6.4 2.1 2.9 2.4 2.2 0.4 3.0 6.4 5.7 6.6
Fiscal balance (in percent of GDP)2010-12 (average) -1.2 -4.0 -1.1 7.0 -1.1 17.8 -3.6 -1.8 -3.9 -3.52013 -2.1 -4.6 -0.1 6.2 -0.2 16.8 -2.7 -5.6 -1.6 -5.6
Public debt (in percent of GDP)Public debt in 2010 26 54 43 97 43 1 29 62 50 48Public debt in 2013 26 58 39 103 46 2 28 61 40 52
Of which : external debt 14 23 18 … 6 0 32 43 19 21
Current account balance (in percent of GDP)2013 -3.3 3.9 3.5 18.3 -0.6 31.5 -8.5 -27.7 -5.4 5.6
Gross reserves Level at end-2013 (US$ billions) 99.4 134.9 83.2 273.1 167.3 3.4 3.6 0.7 5.5 26.0
In months of imports 5.8 6.8 11.9 6.2 7.7 6.1 3.6 1.2 3.5 2.3
Trade openness in 2013 (imports plus exports in goods and services in percent of GDP)Total trade 48 154 53 358 144 115 141 112 53 163Intra-ASEAN merchandise trade 11 38 9 70 26 35 27 60 22 23
Total 4.2 6.3 1.1 29.1 6.9 0.7 2.1 2.8 1.2 3.3From within ASEAN 2/ 0.7 1.2 0.3 2.7 1.7 … 1.0 … 0.6 0.6
Portfolio inflows during 2010-12 Total 2.7 9.8 6.7 9.3 5.4 0.0 0.2 2.4 0.0 0.4From within ASEAN 0.8 1.7 0.5 1.7 0.7 0.0 0.0 0.2 0.0 -0.2
Private credit in 2013Growth (in percent) 20 10 16 54 10 7 27 36 66 13Private credit (in percent of GDP) 36 134 36 173 121 31 45 39 15 97
Number of banks in 2012 3/ 119 27 49 124 30 8 35 32 10 47Of which : foreign and joint banks 24 19 15 119 14 5 12 21 0 6
2/ Excluding services.3/ Data for Vietnam refer to 2011.
Table 1. ASEAN Countries: Selected Economic Indicators
1/ Constant 2005 international US$, except for Lao and Myanmar data from WEO (nominal PPPGDP/population)
Sources: IMF, World Economic Outlook, Direction of Trade Statistics, Coordinated Direct Investment Survey, Coordinated Portfolio Investment Survey ; World Bank, World Development Indicators ; CEIC Data Co.Ltd; country authorities; Bankscope; and IMF staff calculations.
FDI inflows during 2010-12 (average, in percent of GDP)

7
Box 1. ASEAN and ASEAN Economic Community (AEC) 2015: A Brief Chronology
ASEAN is home to more than 610 million people, of whom about 100 million live below the poverty line. In its early days, the primary focus of ASEAN was on reducing geopolitical tensions in the region. In 2003, ASEAN leaders decided to establish an ASEAN Economic Community (AEC) by 2020. The target date for the AEC was subsequently brought forward by five years. Amid growing concerns about the ASEAN region’s perceived loss of competitiveness to China and India, there was a strong desire to enhance the region’s role against the backdrop of a proliferation of free trade agreements between ASEAN and its trade partners. Accordingly, in 2007, ASEAN leaders agreed on a Blueprint for an integrated AEC by 2015.
The AEC has set four main targets: (i) fostering a single market and production base with a free flow of goods, services, investment, and skilled labor, and freer flow of capital within ASEAN; (ii) developing a highly competitive economic region nurturing fair competition, consumer protection, intellectual property rights, and infrastructure development; (iii) attaining equitable economic development by strengthening SMEs; and (iv) achieving ever greater integration into the global economy. The AEC Blueprint lays out 176 priority actions including nine actions related to the free flow of financial services, strengthening ASEAN capital market development and integration, and allowing greater capital mobility. An AEC Scorecard mechanism was introduced in 2008 to monitor progress in achieving the milestones laid out in the Blueprint and track the priority actions undertaken by ASEAN member states, both individually and collectively.
Key initiatives to support ASEAN financial integration
In 2010, ASEAN leaders adopted the Master Plan on ASEAN Connectivity. The objective is to facilitate the establishment of the AEC by 2015 by enhancing intraregional connectivity in areas such as trade, investment, tourism, and development. ASEAN Connectivity comprises three main elements: (i) enhancing Physical Connectivity by improving transportation, information, and communication technology (ICT), and energy infrastructure; (ii) improving Institutional Connectivity by setting up procedures to facilitate international transactions of goods, services, and the cross-border movement of skilled workers; and (iii) strengthening People-to-People Connectivity through socio-cultural initiatives such as education and tourism within ASEAN. While improving intra-ASEAN connectivity would bring significant benefits, it also poses important challenges, including cross-border crime, illegal immigration, and environmental degradation.
Several initiatives have been taken to enhance cross-border collaboration among the various capital markets in ASEAN, including by building capacity and infrastructure:
o The Working Committee on Capital Account Liberalization monitors the implementation of priority actions to achieve freer flow of capital in the region as per the AEC Blueprint.
o The ASEAN Capital Markets Forum (ACMF) focuses on the harmonization of domestic laws and regulations and the development of market infrastructure with a view to integrate the region’s equities markets.
o In April 2010, ASEAN Central Bank Governors endorsed the creation of the Working Committee on Payment and Settlement Systems (WC-PSS), which focuses on policy, legal frameworks, instruments, institutions, and market infrastructure.
o In April 2011, ASEAN Central Bank Governors endorsed the creation of the Task Force on the ASEAN Banking Integration Framework (ABIF), which aims to achieve ASEAN-wide banking sector liberalization by 2020. The Working Committee on Financial Service Liberalization focuses on further liberalization of the banking and insurance sectors.
o The ASEAN Capital Markets Infrastructure (ACMI) Blueprint was developed in 2013. Accordingly, the Working Committee on Capital Market Development aims to enable ASEAN issuers and investors to access cross-border ASEAN equity and bond markets through integrated access, clearing, custody, and settlement systems and arrangements.

8
Box 1. ASEAN and ASEAN Economic Community (AEC): A Brief Chronology (concluded)
Initiatives to strengthen regional economic surveillance and crisis management To complement the integration initiatives, considerable progress has been made in setting up regional institutions to enhance information sharing, improve economic surveillance and crisis management, and provide a regional safety net:
The ASEAN Integration Monitoring Office (AIMO) was established in 2010 to enhance the ASEAN Secretariat’s monitoring capacity in tracking progress of regional economic integration.
The Chiang Mai Initiative Multilateralization (CMIM), established in March 2010 among the ASEAN+3 countries, is a multilateral currency swap arrangement that replaced the pre-existing Chiang Mai Initiative (CMI)’s network of bilateral swap lines.
A crisis prevention facility, the CMIM Precautionary Line, has been introduced. An independent regional macroeconomic surveillance unit—the ASEAN+3 Macroeconomic
Research Office (AMRO)—has been operating in Singapore since 2011. In their New Delhi communiqué of May 2013, ASEAN+3 Ministers of Finance and Central Bank
Governors called for an “effective cooperative relationship with the International Monetary Fund (IMF) and other multilateral financial institutions in the areas of surveillance, liquidity support arrangements and capacity development.”
Further progress in advancing regional surveillance and strengthening crisis management institutions, including in their analytical capacity and cooperation with the IMF, is high on ASEAN’s agenda. In this regard, recent initiatives have included information sharing on macroprudential policies and capital flow management measures. Initiatives have also been taken to expand the scope of integration to other partners in Asia, including through the ASEAN+3 initiative and the Regional Comprehensive Economic Partnership (ASEAN+6; comprising ASEAN countries and Australia, China, India, Japan, Korea, and New Zealand). The U.S.-ASEAN Expanded Economic Engagement (E3) initiative, agreed in late 2012, calls for expanding trade and investment and engaging with regional institutions.
Typically, a country’s degree of financial integration tends to increase with its degree of trade integration. However, as noted by Pongsaparn and Unteroberdoerster (2011), compared with the rest of the world, most Asian economies’ rapid expansion into global trade has not been matched by a commensurate increase in their degree of financial integration. This is true especially for ASEAN economies for which the main channel of financial integration is through FDI flows. Pongsaparn and Unteroberdoerster (2011) estimate a model that relates the degree of financial integration, measured by countries’ ratio of capital flows to GDP, to a set of country characteristics including trade integration, relative GDP growth, interest and exchange rate movements, and exchange rate volatility. They consider a panel of 90 advanced and emerging markets. Except for the financial centers of Hong Kong SAR and Singapore, the degree of financial integration of many Asian economies is below the level predicted by the model for all economies, and in several cases falls behind the norm for Latin America and Eastern Europe. FDI inflows are generally regarded as a desirable form of capital inflows. In addition to capital, they can bring improved technology, generating knowledge spillovers that can result in total factor productivity growth (TFP) in recipient countries. Moreover, though net FDI flows to emerging and developing countries do exhibit fluctuations, they have consistently been positive during the past three decades (Park and Takagi, 2012). Recent trends and the outlook for FDI flows to ASEAN are favorable:

9
FDI flows to ASEAN amounted to a record high of US$125 billion in 2013, up 7 percent from 2012. Moreover, at almost 9 percent of world FDI inflows, ASEAN’s share of total global FDI is back to the level during the boom years preceding the Asian financial crisis.
The trend of rising FDI inflows, in U.S. dollar terms and in relative terms, applies equally to the group of ASEAN-4 countries (Indonesia, Malaysia, the Philippines, and Thailand), Singapore (which continues to receive half of all FDI inflows into ASEAN), and the group of 5 other ASEAN countries (which now account for about 11 percent of FDI inflows into ASEAN). Figure 1 shows the generally rising trend in FDI flows to ASEAN countries from China, Japan, and Korea (the “plus-3” countries), as well as from the United States and Malaysia and Singapore, two ASEAN countries with persistent current account surpluses.
Several factors may be helping to make ASEAN an attractive investment destination. Wage costs in manufacturing in ASEAN have been declining relative to China owing to divergent demographics and exchange rate movements. The favorable trend in relative wage costs is expected to continue in the coming years, reflecting the stronger labor force growth in ASEAN. Geopolitical considerations and ASEAN’s growing middle class could also drive more FDI into ASEAN. The U.S.-ASEAN Expanded Economic Engagement initiative, calls for expanding trade and investment and engaging with regional institutions. Last but not least, ASEAN’s commitment to form a single market and production base can be expected to reduce trade and investment barriers and provide economies of scale.
A recent study (World Bank, 2014) finds that foreign ownership restrictions are still common in ASEAN countries, particularly in the services sector. Relaxing these restrictions could give rise to substantial productivity-enhancing FDI inflows and provide an impetus to the structural transformation and convergence of the emerging and frontier economies in ASEAN.
0
5
10
15
20
25
30
2000 2001 2002 2003 2004 2005 2006 2007 2008 2009 2010 2011 2012 2013
Other Emerging Asia 1/IndiaHong Kong SARChinaSingaporeOther ASEAN (excl. SGP)ASEAN-4
Emerging Asia: FDI inflows, 2000−13(In percent of world FDI inflows)
Source: UNCTAD.1/ Other Emerging Asia includes Bangladesh, Bhutan, Korea, Macao SAR, Mongolia, Nepal, Sri Lanka, Taiwan Province of China and Timor-Leste.
0
50
100
150
200
250
300
350
400
2000 2001 2002 2003 2004 2005 2006 2007 2008 2009 2010 2011 2012 2013
Other Emerging Asia 1/IndiaHong Kong SARChinaSingaporeOther ASEAN (excl. SGP)ASEAN-4
Emerging Asia: FDI inflows, 2000−13(In billions of U.S. dollars)
Source: UNCTAD.1/ Other Emerging Asia includes Bangladesh, Bhutan, Korea, Macao SAR, Mongolia, Nepal, Sri Lanka, Taiwan Province of China and Timor-Leste.

10
Source: UNCTAD Bilateral FDI Statistics 2014
Figure 1: FDI Flows to ASEAN Countries
0
2
4
6
8
10
12
14
16
18
20
0
2
4
6
8
10
12
14
16
18
20
2007 2008 2009 2010 2011 2012
(percent)(Billion US$)
FDI Flows from Japan
Viet NamThailandSingaporePhilippinesMyanmarMalaysiaLao P. D. R.IndonesiaCambodiaFDI to ASEAN/Total (RHS)
0
2
4
6
8
10
12
14
16
18
20
0
1
2
3
4
5
6
2007 2008 2009 2010 2011 2012
(percent)(Billion US$)
FDI Flows from the Republic of Korea
Viet NamThailandSingaporePhilippinesMyanmarMalaysiaLao P. D. R.IndonesiaCambodiaBrunei DarussalamFDI to ASEAN/Total FDI (RHS)
-4
0
4
8
12
16
20
24
28
32
36
40
44
48
-1
0
1
2
3
4
5
6
7
8
9
10
11
12
2007 2008 2009 2010 2011 2012
(percent)(Billion US$)
FDI flows from Malaysia
Viet Nam
Thailand
Singapore
Philippines
Indonesia
Cambodia
FDI to ASEAN/World (RHS)
-4
0
4
8
12
16
20
24
28
32
36
40
44
48
-1
0
1
2
3
4
5
6
7
8
9
10
11
12
2007 2008 2009 2010 2011 2012
(percent)(Billion US$)
FDI flows from Singapore
Viet Nam
Thailand
Philippines
Malaysia
Lao P. D. R.
Indonesia
Cambodia
Brunei Darussalam
FDI to ASEAN/Total 1/ (RHS)
1/ Total is approximated by the sum of: Australia, Belgium, Brunei Darussalam, Cambodia, China, Hong Kong SAR, India, Indonesia, Japan, Korea, Lao, P. D.R.,Luxemburg, Malaysia, Mexico, Myanmar, New Zealand, Philippines, Taiwan Province of China, Thailand, United States, and Vietnam
0
2
4
6
8
10
12
14
16
18
20
0
2
4
6
8
10
12
14
16
18
20
2007 2008 2009 2010 2011 2012
(percent)(Billion US$)
FDI Flows from China
Viet NamThailandSingaporePhilippinesMyanmarMalaysiaLao P. D. R.IndonesiaCambodiaBrunei DarussalamFDI to ASEAN/Total (excl. HGK) (RHS)FDI to ASEAN (excl. SGP)/Total (excl. HGK) (RHS)
-5
0
5
10
15
20
-5
0
5
10
15
20
2007 2008 2009 2010 2011 2012
(percent)(Billion US$)
FDI Flows from the United StatesViet NamThailandSingaporePhilippinesMyanmarMalaysiaIndonesiaCambodiaBrunei DarussalamFDI to ASEAN/Total (RHS)

11
The level of banking integration in ASEAN is rising but from a low base and global banks have a bigger footprint in ASEAN than regional banks.
BIS locational banking statistics indicate that BIS reporting banks’ cross-border exposure to Asia and ASEAN-5 countries in U.S. dollar terms increased during 2012–13. Meanwhile, deleveraging from the euro area and Eastern Europe continued and banks’ cross-border assets in Latin America were flat in 2012–13. BIS reporting banks’ cross-border liabilities have, for the most part, been little changed over the past two years. Relative to GDP, the value of BIS reporting banks’ cross-border assets trended upward vis-à-vis Malaysia, Thailand, and Indonesia in 2012–13. It remained mostly flat in Singapore and the Philippines.
Bilateral banking integration is particularly low in ASEAN. ADB (2013) reports that foreign banks accounted for 18 percent of total commercial bank assets in Malaysia, the Philippines, and Thailand in 2009. The share of ASEAN-based banks in Malaysia, at 8.5 percent, was the highest among the three member states; the share was 0.4 percent in the Philippines and 3.7 percent in Thailand. Based on detailed country-by-country BIS data, Duval and others (2014) calculate that the level of bilateral banking integration in Asia has continued to lag the rest of the world. Their calculations echo the ADB (2013)’s finding that it is particularly low among ASEAN-5 countries.
Banks are likely to be the leaders of ASEAN financial integration given the opportunities provided by European banks deleveraging and the prospects of the ASEAN Economic Community. They also remain key to financial intermediation in the region. Singapore, as one of the largest financial centers in the world, plays a dominant role in regional financial integration. Malaysian banks have also expanded abroad significantly. Cross-border portfolio investment inflows to ASEAN countries have been on a rising trend. However, as noted by Pongsaparn and Unteroberdoerster (2011), relative to GDP, cross-border portfolio investment in Asia and other emerging markets has remained well below that of the euro area. Moreover, the bulk of Asia’s portfolio investment has remained interregional (that is, with economies outside the region), especially after adjusting for the role of Hong Kong SAR and Singapore in intermediating inflows from outside the region. In contrast, in the case of the euro area, portfolio investment is mostly intraregional. As was the case with other emerging market economies, ASEAN economies experienced a strong pickup in portfolio investment during 2010–12, following the temporary retreat caused by the global financial crisis. Advanced economies’ unprecedented liquidity-easing measures undertaken to mitigate the effects of the global financial crisis were a key contributing factor to the acceleration of portfolio flows to ASEAN countries. ASEAN-5 economies may have
0
1
2
3
4
5
Asia ASEAN-5 Non-Asia
Bilateral Banking Integration 1/
1990s 2000s
Source: Duval and others (2014).1/ Calculated as period medians of the median country pairs in each group, expressed in percent of the total external position with the world.

12
received a relatively larger share of these inflows by virtue of the ongoing progress in developing local currency bond markets, the Asian Bond Markets Initiative, and the linking of stock markets in Malaysia, Singapore, and Thailand. Data on inflows in equity and bond funds for ASEAN-5 countries show that overall portfolio flows surged in the first four months of 2013. After that, expectations of a reduction in the U.S. Federal Reserve System’s monetary stimulus (“tapering”) ignited capital outflows from the group of ASEAN-5 countries and many other emerging markets. An improvement in global risk appetite in the second quarter of 2014 caused capital flows to improve again (text chart).
Price measures also suggest that financial integration in ASEAN, while increasing, has some way to go. Cross-border interest rate and bond yield differentials have narrowed in recent years. However, these differentials remain substantial, even after controlling for exchange rate movements (see also ADB, 2013). Comovements in ASEAN interest rates and bond yields have increased in recent years, but this may also reflect increasing integration with the global market and/or improving fundamentals (such as lower inflation rates and differentials and improved sovereign credit ratings). Increased comovements in equity market returns, even after controlling for global factors, suggest that stock markets are more integrated than money and bond markets.
III. TOWARD FURTHER FINANCIAL INTEGRATION IN ASEAN
Most ASEAN countries are still at a relatively early stage of development and have large infrastructure gaps. Further liberalization of inter- and intraregional flows of goods, services, and capital could be beneficial for growth, the creation of jobs, and inclusion in ASEAN. Accordingly, the ASEAN Economic Community is about creating a common market with “free movement of goods, services, investment, skilled labor, and freer flow of capital” (ASEAN, 2008, p.5). This is envisaged to be a multiyear process with countries for the most part moving at their own pace. The “ASEAN Way” means that individual ASEAN member countries can take steps toward further financial sector liberalization and capital account liberalization if and when they believe to be ready. This readiness could be a function of several things, including achieving an adequate strengthening of relevant policy frameworks
-1,000
-800
-600
-400
-200
0
200
400
600
800
1,000
Dec
-07
Jun-
08
Dec
-08
Jun-
09
Dec
-09
Jun-
10
Dec
-10
Jun-
11
Dec
-11
Jun-
12
Dec
-12
Jun-
13
Dec
-13
Jun-
14
Equity funds
Bond funds
Source: EPFR Global, accessed through Haver Analytics.1/ Includes exchange-traded fund flows and mutual fund flows.
ASEAN-5: Equity and Bond Funds—Weekly Net Flows, 2008-14 1/ (In millions of U.S. dollars)

13
and institutions, as well as broadly favorable domestic economic and financial conditions. While this flexible approach could make for a long, drawn-out process, it does ensure ownership and incentive compatibility. This is important given that considerable risks involved in further opening up the financial sector and the capital accounts have been visible around the world and are by now well documented. In light of this, the diligence of the various ASEAN working groups that have been meeting regularly to review progress made by individual member countries and discuss next steps is commendable. For instance, the 27th meeting of the Working Committee on Capital Account Liberalization (WC-CAL) was held in Myanmar in February 2014. This coincided with a meeting of the Working Committee on Capital Market Development, also in Myanmar.
A. ASEAN Financial Sector Liberalization: What is at Stake?
In theory, financial integration can bring important benefits to a country and a region. ASEAN countries’ financial systems remain for the most part bank-centered, particularly in the countries at earlier stages of economic development. However, the role of insurance companies, investment funds, and pension funds is growing, particularly in Malaysia and Singapore. Financial integration can spur the development of the financial sector and product innovation. This can boost growth, employment, and financial inclusion, including in the poorer regions of higher-income ASEAN members, by enhancing financial institutions’ competitiveness and efficiency. Financial integration can also help to facilitate the development of larger, deeper, and more liquid markets. This can lower the cost of capital, improve resource allocation, enhance diversification of risks, lengthen the maturity of financing, and improve trading and settlement practices. It could also impose greater discipline on governments, banks, and non-bank corporations, and make the economy more resilient to shocks. For ASEAN, an important aspect of financial integration will be that the less-financially developed economies will catch up with the more developed ones. Table 2 highlights the wide divergence in financial development among ASEAN countries. In most of them the outstanding stock of credit to the private sector remains below 50 percent of GDP. These are the countries that would stand to gain the most from increased financial integration. At the same time, these are also the countries that currently have the highest credit growth. As discussed extensively in Chapter 7 of Schipke (2015), financial innovation and development in frontier economies and emerging market economies—when poorly supervised or unregulated—can, in some cases, negatively affect macroeconomic stability. State-owned banks continue to have a significant presence in several ASEAN countries, and
GDPper capita
1990 2000 2010 2013 (US$, 2013) 2010–12 2013(Avg.)
Indonesia 46 20 28 36 3,510 23 20Malaysia 105 137 120 134 10,457 11 10Philippines 18 42 30 36 2,791 15 16Singapore 84 96 130 173 55,182 14 16Thailand 83 108 97 121 5,676 15 10
Brunei 50 41 31 39,659 -1 7
Cambodia 6 28 45 1,028 27 27Lao P.D.R. 14 22 39 1,594 41 36Myanmar 5 15 1,113 59 66Vietnam 35 115 97 1,902 18 13
China 87 122 130 136 6,747 17 15India 35 36 54 57 1,505 18 15Japan 126 117 107 115 38,491 0 5Korea 122 129 154 156 24,329 5 3
Sources: CEIC Data Company Ltd.; Haver Analytics; and IMF staff estimates.
Private Sector Credit Credit Growth(in percent of GDP) (in percent)
Table 2. Credit to the Private Sector

14
often have ties to state enterprises. Some economies also engage in directed credit operations as part of a development strategy, which can impose quasi-fiscal liabilities and impinge on the profitability of private banks. The Asian financial crisis of the late 1990s highlighted the critical vulnerabilities to which rapid (and inadequately supervised) growth in banking and capital markets can give rise. Poor risk management, overexposure to cyclical economic activities, weak governance, and directed and connected lending are only some of the potential hazards. These problems and associated risks can be exacerbated as cross-border linkages grow, and can ultimately prove costly to output, international reserves, and public finances in the event of a crisis. If managed well, ASEAN financial integration can play a key role in raising living standards in ASEAN’s frontier and emerging markets by spurring financial development and deepening. By contributing to the creation of ASEAN-wide financial markets, financial integration would help overcome the present fragmentation of national financial sectors caused by national regulations and standards (e.g., bank supervision, rating agencies, credit bureaus, and securities commissions). The lack of mutual recognition and common disclosure requirements are also standing in the way of the creation of a common market. In this regard it is important to note that the AEC Blueprint calls for regulatory harmonization and the strengthening of policy coordination among member states. The recent experience in the European Union underscores that it is equally important to take a regional approach to financial stability. In particular, a supranational oversight framework may be necessary in a single market for financial services, and this needs to be supported by a single resolution regime with a common backstop (e.g., deposit insurance).
B. ASEAN Financial Sector Liberalization: Reform Initiatives
The ASEAN nations continue to move toward achieving greater regional financial integration. For example, in 2013, the Securities Regulators of Malaysia, Singapore, and Thailand signed a Memorandum of Understanding (MOU) to establish and implement a framework for cross-border trade of collective investment schemes. Details of the broader integration framework are being worked out. While the AEC Blueprint indentifies freer capital movements and financial integration as two of the key elements of the AEC, it is brief on specifics, such as the desirable degree of financial integration and the necessary legal, institutional, and regulatory requirements for achieving the financial integration (ASEAN, 2008). A recent report by the Asian Development Bank (ADB, 2013) lays out the current state of thinking among ASEAN countries on the steps needed to achieve a certain degree of financial integration over the next ten years:
The ADB report sees a need for the ASEAN region to nurture globally competitive banks as one key objective for the banking integration project. Commercial banks remain by far the most important type of financial institutions in ASEAN. Given that banks headquartered in ASEAN countries (“ASEAN banks”), on average, remain rather small on an international scale, the proposed “ASEAN banking framework” would give market access preference to ASEAN banks over other banks. In doing so, large globally competitive ASEAN banks could develop over time with a customer base large enough to support their growth and allowing them to take the lead in

15
ASEAN finance in the future. These banks would also be able to obtain a foothold in global banking through mergers and the acquisition of smaller banks.
The report concludes that full banking integration, such as governed by the “single passport” system in the European Union, would be too ambitious for ASEAN for the next ten years. Instead, it proposes steps for partial banking integration over a ten-year period with different timelines for each individual ASEAN member state. This is to be supported by an institutional approach based on regulatory harmonization and the strengthening of policy coordination among the ASEAN member states, in line with the principles set out in the 2008 AEC Blueprint.
In addition to the preferential market access for ASEAN banks, the proposed strategy includes the following elements:
A two-track approach for banking integration, supported by the regional harmonization of regulations. Accordingly, member states should immediately start phasing out most of the remaining restrictions on wholesale banking, while delaying the completion of the liberalization of cross-border retail banking (deposit taking).
A three-dimensional framework (equal access, equal treatment, and equal environment) to guide the long process of financial services liberalization in ASEAN. Accordingly, ASEAN member states should agree on a set of minimum conditions that ASEAN-based banks must meet to be named a Qualified ASEAN Bank (QAB) and be eligible to enter into the banking sector of other member states, which is to include minimum capital adequacy requirements, consolidation requirements and authority for consolidated supervision, restrictions on large exposure, and minimum accounting and transparency requirements. The principle of mutual recognition has also governed the EU's "single bank license" approach, in which a bank licensed in an EU member state is also authorized to open branches in other EU countries without any other formalities or requirements.
The proposals in the ADB report identify key elements of a framework for financial integration in ASEAN. But they also leave several unanswered questions:
The ADB report suggests that “a carefully planned market integration process can help more ASEAN-based banks develop faster than their non-ASEAN based counterparts” (ADB, 2013, p.8). This could potentially reduce the efficiency and competitiveness gains from banking integration.3 It could also create too-big-to-fail
3 Empirical research shows that the presence of foreign banks is in general associated with increased efficiency and competition in local banking sectors, with lower net interest margins, reduced excessive profits, and lower cost ratios (for example, see Claessens and Van Horen, 2014).

16
problems that many countries, especially the United States and countries in Europe, have found to be costly to their citizens and difficult to resolve.
One or more member countries may want to delay, for economic or political reasons, the opening up of their markets to banks from other ASEAN countries. This could make it very difficult to agree on a comprehensive set of minimum conditions that ASEAN-based banks must meet to be eligible to enter into the banking sector of other member states. One commonly mentioned solution could be for two or more countries to move ahead with opening their markets for each other’s banks. Other ASEAN countries could then join these front-runners at a later stage. This is often called the “2+x” approach (ASEAN (2008) calls it the “ASEAN minus x” approach (p.11)). The 2+x approach is consistent with the “ASEAN way.” It is incentive compatible and would allow the front-runners to start reaping some of the benefits from increased financial integration, albeit on a smaller scale compared to an ASEAN-wide move. This could trigger action on the part of the other ASEAN members to catch up.
Not only do the member states, on an ASEAN-wide basis or a 2+x basis, need to agree to facilitate QABs’ access to their banking markets. QABs and local banks should be treated equally by host country supervisors. The harmonization of banking regulation should start with the licensing requirements and extend to cover (i) bank accounting standards and disclosure requirements; (ii) minimum capital requirements; (iii) risk management; (iv) prompt corrective action (PCA) and resolution methods for failed banks; (v) restrictions on large exposure; and (vi) anti-money laundering and consumer protection regulations.
There is also a need for clarity regarding the institutional set up and legislative process at the regional level to ensure effective cross-border supervision and resolution.
The choice of the organizational structure for cross-border banking groups has not been addressed explicitly. Fiechter and others (2011) conclude that there is no one size that fits all when it comes to the choice between subsidiaries and branches. Home authorities typically prefer a cross-border bank structure with stricter firewalls across parts of the group (the subsidiary model) when their banks expand into weaker, more risky country markets. Host authorities might also prefer the subsidiary model if conditions in their country are better than those in the home country, to shield the local subsidiaries from potential problems of the parent. In contrast, countries with underdeveloped financial systems and weak economies may prefer regional or global banks to enter via branches that can facilitate credit services based on the parent’s strength. The quality of supervision, adequacy of information-sharing systems, and systemic importance of the affiliate for home and host financial systems also play a role in home/host preferences.

17
The success of financial integration hinges on active cooperation between public and private sector players. It is mostly up to the national authorities to design and roll out policy reforms. However, successful implementation requires close collaboration with financial institutions and other private agents.
C. ASEAN Financial Sector Liberalization: Lessons from Europe
What lessons can we draw from the European experience in establishing a single market in banking? ASEAN nations are in many ways very different from the EU countries. Unlike the EU countries, ASEAN countries have a diversity of exchange rate regimes (Table 3). ASEAN nations are more diverse in terms of the stage of their economic and financial development. They also display differences in terms of political systems, and cultural backgrounds. Europe’s recent history and its devastation from the two world wars also set it apart from Asia not least in terms of the desire for political unity in Europe. Despite these important differences, the EU’s experience in creating a single market for banking and the weaknesses in its approach as exposed by the recent crisis could offer some lessons for ASEAN. Achieving banking integration requires strong political commitment from all ASEAN nations. To achieve this, it is important for ASEAN leaders to spell out clearly the objective of the banking integration and how each ASEAN member state, large or small, will benefit from it. It is equally important to have a clear grasp of the potential contagion and spillover risks brought on by integrated banking markets, as well as transition and operational risks, especially for the less-developed ASEAN countries that are catching up. Once these risks are identified, strong policy frameworks at national and regional levels would need to be put in place to properly manage these risks. Progress toward banking integration would need to be supported by sound institutional and legislative frameworks. The plan to establish a single market for ASEAN banking would need to specify: (i) the minimum regulatory requirements for entry; (ii) permissible banking activities (that are consistent with the current stage of ASEAN development and growth objectives); (iii) regional arrangements for effective cross-border bank supervision and resolution; and (iv) (new) regional institutions to set standards and rules and to enforce national compliance of regional rules. A harmonized set of core regulatory rules is necessary to ensure the efficient functioning of the single market. A level playing field would be difficult to ensure when rules, supervisory practices, and resolution regimes differ substantially at the national level. The EU members
Table 3. De facto Exchange Rate Arrangements, April 30, 2014
Indonesia Floating arrangementMalaysia Other managed arrangementPhilippines Floating arrangementSingapore Stabilized arrangementThailand Floating arrangement
Brunei Darussalam Currency board with the Singapore dollarCambodia Other managed arrangementLao P.D.R. Crawl-like arrangementMyanmar Other managed arrangementVietnam Stabilized arrangement
Source: IMF, 2014 Annual Report on Exchange Arrangements
and Exchange Restrictions.

18
were able to maintain considerable flexibility in the interpretation and enforcement of common EU directives, which led to wide divergences in national banking regulations. Different national rules and regulations resulted in competitive distortions and encouraged regulatory arbitrage. In particular, for cross-border financial groups, such regulatory differences go against efficient group approaches toward risk management and capital allocation, and made the resolution of cross-border financial institutions even more difficult. However, regulatory harmonization and regional coordination, as implemented in Europe and proposed by the AEC Blueprint, may not be sufficient to ensure financial stability of the single market. The financial stability arrangements for the Single Market in Europe were strongly based on national financial stability frameworks. When the crisis hit Europe in 2008, the initial policy response was handicapped by the absence of robust national, and more importantly, EU-wide crisis management frameworks. The lack of ex ante and ex post burden sharing agreements led to national ring fencing and increased EU financial market segmentation, thus reversing the progress achieved toward EU financial integration. An ASEAN-wide framework for banking oversight may be necessary to sustain a single market for banking services. The EU crisis has shown that national decisions, even well-intended ones, can have region-wide repercussions on financial stability. Following the example of the Single Supervisory Mechanism recently introduced in Europe, the future ASEAN supervisor could be responsible for the oversight of the systemic ASEAN banks. The effectiveness of the single supervisor would need to be safeguarded by giving it powers to maintain general oversight over all banks and to intervene in any bank it deems necessary. Its governance and its “will to act” would need to be robust, including through ensuring that “nationality dominance” is avoided and that a regional perspective is consistently maintained. An effective cross-border bank resolution framework for the banks headquartered in ASEAN countries would be another critical element of the ASEAN banking integration framework. At a minimum, ASEAN nations should be advised to strengthen their bank resolution frameworks by adopting the best international practice and the Financial Stability Board (FSB) initiatives. When ASEAN markets for banking and financial services become fully integrated, it may be necessary to put in place a single resolution mechanism that includes a single resolution agency, and a common deposit guarantee scheme (DGS), with common backstops. But as revealed by the ongoing discussion of the banking union in Europe, there will be political resistance, since this may involve burden-sharing with net resources flowing from the countries with strong financial systems to those with weaker ones.
D. ASEAN Capital Account Liberalization: What is at Stake?
In addition to financial sector liberalization, there is ample scope for further capital account liberalization to spur the development of ASEAN countries. Despite high overall savings in the region, investment needs are huge, including in infrastructure. Rapid urbanization and the growth of the ASEAN middle class requires improved infrastructure in urban communities, including amenities, utilities, and links between production locations and centers of domestic consumption. In all of this, there is a growing need for more (and cheaper) infrastructure finance to be provided by banks and nonbank intermediaries alike, even as banks adjust their

19
business models in response to changes in global regulatory standards.4 The large education gap also requires resources. ADB (2012) calculates that the region needs US$0.6 trillion over the next ten years. Recently, ASEAN policymakers have raised the figure to about US$1 trillion (see, for example, the April 10, 2014 speech by Philippines Secretary of Finance Cesar V. Purisima at the Center for Strategic and International Studies in Washington, D.C.). Capital flows from within and outside the region could supplement domestic savings generated in individual ASEAN countries. The removal of restrictions on capital outflows from ASEAN countries could also contribute to reducing the round-tripping of regional savings through financial centers in advanced economies. For instance, owing to the fungibility of capital, some of the funds invested abroad by ASEAN central banks as they greatly expanded their holdings of official reserves after 1997–98 may have returned to the region in the form of interregional portfolio investments. The gradual relaxation of restrictions on capital outflows from ASEAN countries would likely lead to increased intra-regional capital flows, in part by virtue of the commonly observed “home bias” whereby investors invest a relatively large share of their portfolio in their home country and home region because of familiarity and information advantages. The pickup in cross-border financial activity in recent years, both with the rest of Asia and within ASEAN, is a testament to the pull forces driving capital flows into ASEAN. Increased ASEAN integration and openness could, in theory, unleash large flows of investment goods from capital-abundant sources, including the “plus three” (China, Japan, and Korea) and from elsewhere within ASEAN (Singapore and Malaysia). The large potential for such flows is discussed and analyzed further in the context of two benchmark open economy models of capital flows in the Appendix to this paper. When financial integration within ASEAN and with the rest of the world is incomplete, large differences in GDP per capita (and hence output per worker) can persist, and real convergence can be slow, reflecting long-lasting differences in capital-labor ratios. Financial integration can help accelerate economic growth by facilitating capital deepening. Countries at early stages of development should receive the largest inflows with large potential gains for growth, real convergence, and poverty reduction. In the simplest case, in which there are no adjustment costs to investment and no legal barriers or informational or other impediments to international capital mobility, capital would quickly move across borders until risk-adjusted rates of return are equalized internationally. In reality, the size of capital flows would depend critically on the removal of remaining barriers and establishing complementary public factors of production. Raising total factor productivity, as reflected in a country’s institutional development (well-defined and respected private property rights, including on intellectual property, a good business climate, and so forth), is a powerful pull force for capital flows.
4 Banks are dominant in ASEAN and generally rely largely on demand deposits for funding. They tend to focus on commercial and household lending. Maturity transformation is essential in banking and banks would be involved more in financing long-term, risky infrastructure projects if these projects were profitable, taking into account risk, externalities, and local public good aspects of many such projects.

20
The simple neoclassical view of real convergence underscores the potential benefits of removing capital controls but omits the dangers lurking in improperly sequenced, rash liberalizations. The problems are well known from an extensive literature on financial crises. They include original sin (borrowing in foreign currency and at short maturities to finance long-lived projects) followed by “sudden stops” of foreign capital from emerging markets. Appropriate policy responses include self-insurance, including through the accumulation of international reserves and through taxation measures, to internalize Pigouvian externalities (Aizenman, 2009, Jeanne and Korinek, 2010) and incomplete labor insurance markets present in many recipient countries (Mourmouras and Russell, 2013). The IMF’s institutional view on this issue (IMF, 2012, 2013c), acknowledges the benefits from capital flow liberalization—the higher efficiency in resource allocation, technological improvement, higher investment, and better consumption smoothing—while also emphasizing the risks of capital flows, including higher volatility and increased vulnerability to capital account crises. These risks are magnified for countries that are still lagging in financial and institutional development. That is an important lesson: economic development requires more advanced financial systems, which go hand in hand with greater capital flows. Accordingly, the Fund’s institutional view on capital flows stresses that the benefits from capital flow liberalization are greatest when financial/institutional development is adequate and the macroeconomic situation is sound. There is no presumption that full liberalization is appropriate for all countries at all times. Consistent with this approach, the ASEAN capital account integration agenda is properly gradualist in nature, emphasizing the correct sequencing of liberalization and the putting in place of regulatory safeguards to protect individual countries from capital flow volatility. ADB (2013) defines capital account liberalization as a process of dismantling legal and administrative impediments to the freedom with which economic agents can transfer ownership claims across national borders. The wide divergence among ASEAN economies observed in the area of financial sector development extends to capital account openness. One way to compare countries’ openness and assess the scope to increase it is to look at the various de jure indices of capital account openness used in the empirical literature (Box 2).5
5 In all cases, a higher value of the index denotes a higher degree of capital account openness. A common characteristic of these indices is that the primary source of information for the indices is the IMF’s Annual Report on Exchange Arrangements and Exchange Restrictions (the “AREAER”). The IMF’s AREAER provides a wealth of detailed information. But it does not accompany this detail with any form of summary or bottom-line characterization of a country’s overall degree of openness/restrictiveness. The IMF also does not produce an index of its own.

21
-2
-1.5
-1
-0.5
0
0.5
1
1.5
2
2.5
3Chinn-Ito Index for CLMV
Myanmar
Cambodia
Lao P.D.R.
Vietnam
Box 2. De jure indices of capital account openness in ASEAN countries The Quinn-Toyoda and Schindler indices of capital controls focus on capital account restrictions (see Vargas (2014)). In contrast, the Chinn-Ito index measures four categories of restrictions on external transactions: (i) the presence of multiple exchange rates; (ii) restrictions on current account transactions; (iii) restrictions on capital account transactions; and (iv) requirements regarding the repatriation of export proceeds.
A comparison over time of the evolution of the Chinn-Ito index suggests that Singapore has maintained a high degree of financial openness since the early 1980s. Restrictions introduced around the time of the Asian financial crisis (AFC) were quickly unwound. ASEAN-4 countries (Indonesia, Malaysia, the Philippines, and Thailand) maintain only few restrictions on the buying and selling of domestic securities by nonresidents. This is reflected in relatively high de facto financial openness, measured, for instance, by the level of actual cross-border portfolio flows. However, some restrictions apply to capital account transactions by residents. Moreover, in the aftermath of the AFC and the GFC, ASEAN-4 countries introduced or intensified some restrictions on current account transactions, including with regard to the repatriation of export proceeds and verification procedures for service payments.
According to the Chinn-Ito index, as a result of a package of liberalization measures phased in from 2001 onward, Cambodia was the second most financially open economy in ASEAN in 2011. However, capital flows mostly take the form of FDI and official grants. Portfolio inflows remain limited (low de facto financial openness) given that the relevant domestic financial markets are still being developed. Similarly,
Lao P.D.R., Vietnam, and Myanmar have historically displayed relatively low financial openness. Perhaps reflecting their limited exposure to volatile portfolio flows, the CLMV countries did not tighten their capital account restrictions with the onset of the GFC. It should be noted that Myanmar’s recent liberalization and unification of the exchange rate is not yet reflected in the Chinn-Ito index shown in the chart. A comparison with other emerging market economies suggests that ASEAN-4 countries are not as open in de jure classifications of capital account openness. The chart above shows the three de jure indices for 2005, the latest year for which all the three indices are available. All are scaled to a common zero-to-one range, where a larger number represents a higher level of capital control openness. The chart ranks the countries by their score on the Quinn-Toyoda index. The three indices show a substantial correlation and all put the ASEAN-4 countries among the emerging market economies with less open capital accounts.
-2
-1.5
-1
-0.5
0
0.5
1
1.5
2
2.5
3Chinn-Ito Index for ASEAN-4
Indonesia Malaysia
Philippines Singapore

22
Box 2. De jure indices of capital account openness in ASEAN countries (concluded)
Asian countries have had diverse experiences with capital flows over the past 20 years. This goes to illustrate that, while the scope to remove capital account restrictions is clear, there is no guarantee that this will lead to a significant increase in net capital inflows. Net capital flows to ASEAN countries have been large at times, including for many years before the Asian financial crisis (1997–98). However, on average over the period 2000–12, notwithstanding rising FDI and portfolio inflows discussed in the previous sections, only four ASEAN countries (Lao P.D.R., Cambodia, and, to a lesser extent, Vietnam and Myanmar) were net capital importers. Remarkably, despite large infrastructure needs and development potential, Indonesia, the Philippines, and Thailand were net capital exporters with average current account surpluses of about 2 percent of GDP per annum during 2000–12. Malaysia’s net capital exports were even larger, averaging 12 percent of GDP per annum during this period.
0
0.1
0.2
0.3
0.4
0.5
0.6
0.7
0.8
0.9
1
Be
lgiu
m
Can
ada
Ch
ile
Co
sta
Ric
aC
zech
Re
pu
blic
De
nm
ark
Egyp
t, A
rab
Re
p.
Fin
lan
dFr
ance
Ge
rman
yG
ree
ceG
uat
em
ala
Hu
nga
ryIr
ela
nd
Isra
el
Ital
yJa
pan
Ne
the
rlan
dsN
ew
Ze
alan
dP
eru
Po
rtu
gal
Spai
nSw
itze
rlan
dU
nit
ed
Kin
gdo
m
Un
ite
d S
tate
sU
rugu
ayA
ust
ria
No
rway
Swe
de
nA
ust
rali
aP
hil
ipp
ines
Po
lan
d
Turk
ey
Bra
zil
Ko
rea,
Re
p.
Me
xico
Co
lom
bia
Ind
iaIn
do
ne
sia
Ru
ssia
n F
ed
era
tio
n
Sou
th A
fric
aSr
i Lan
kaTu
nis
iaA
rge
nti
na
Mal
aysi
aM
oro
cco
Pak
ista
n
Thai
lan
dC
hin
a
Capital Account Openness Indices (2005)
Quinn-Toyoda
Chinn-Ito
Schindler
Source: Vargas (2014).
1990−97 2000−12 2013(Avg.) (Avg.)
Indonesia -2.5 1.8 -3.3Malaysia -5.6 11.9 3.9Philippines -3.7 1.8 3.5Singapore 12.3 18.9 18.3Thailand -6.4 2.9 -0.6
Brunei 43.4 44.1 31.5Cambodia -2.8 -3.8 -8.5Lao P.D.R. -6.6 -16.2 -27.7Myanmar … -0.4 -5.4Vietnam -6.8 -2.3 5.6
Source: IMF, WEO.
(In percent of GDP)Table 4. Current account balances

23
ASEAN countries’ net exports of capital in the 2000s reflected the accumulation of official reserves for self-insurance and precautionary purposes in the aftermath of the AFC. As reserves now seem broadly adequate in most ASEAN countries, there is scope for a change in the direction of intra- and interregional net capital flows. Park and Takagi (2012) note that the tendency of most ASEAN countries to maintain relatively tighter controls on outflows has acted to discourage capital inflows from within ASEAN while encouraging inflows from advanced countries outside the region.6 ASEAN capital account liberalization will be an ongoing process over the coming years with the end goal of achieving a high degree of capital account openness while preserving adequate financial stability. Discussions among the member countries in this area continue to be led by guidelines established in the AEC Blueprint: (i) ensuring an orderly capital account liberalization consistent with member countries’ national agenda and readiness of the economy; (ii) allowing adequate safeguards against potential macroeconomic instability and systemic risk that may arise from the liberalization process, including the right to adopt necessary measures to ensure macroeconomic stability; and (iii) ensuring that the benefits of liberalization will be shared by all ASEAN countries. An important challenge for capital account liberalization is to harness benefits while minimizing risks. In light of this, Ishii and others (2002) recommend a gradualist approach, emphasizing the need for careful sequencing and establishing preconditions to be observed before a country could safely move to the next step. As observed by Park and Takagi (2012) and ADB (2013), ASEAN countries maintain several classes of restrictions that may currently be providing legitimate safeguards against speculation and prevent the buildup of financial sector risk. This includes restrictions on the offshore use of almost all ASEAN countries’ currencies and external lending in domestic currency as well as limits on the ability of investors to hedge foreign currency risk. Some of these restrictions may have to be phased out as the region moves along the path to regional financial integration. However, it may be appropriate to maintain these restrictions as long as relevant thresholds for upgrading macroeconomic and financial policy frameworks have not been met.7 Empirical research suggests that financial depth and institutional quality are the two most important preconditions for a positive effect of foreign capital inflows on economic growth.
IV. PROMOTING SAFE FINANCIAL INTEGRATION IN ASEAN
This section reviews policies that could be adopted by ASEAN countries, individually and collectively with each other and with regional and multilateral partners, to promote safe financial integration in ASEAN, especially FDI inflows and banking integration. It also considers the present state and future prospects of regional surveillance and financial 6 As noted earlier, because of “home bias” ASEAN-based investors would tend to invest a relatively large share of their portfolio in their home region. Therefore, a relaxation of controls on outflows in ASEAN countries could be expected to lead to a disproportional increase in capital outflows to other ASEAN countries.
7 ADB (2013) proposes, as a safeguard measure, to retain the restrictions on cross-border trading of forwards and derivatives as well as on offshore currency use.

24
cooperation initiatives, including AMRO and CMIM. The section also briefly discusses the lessons for Asia from the failings of European integration efforts and risk mitigation within ASEAN, including in the context of the CMIM, and the role of the IMF. Policies to help enhance financial integration and mitigate risks
Over the medium and longer term, ASEAN banking links are likely to expand further as AEC financial integration goals are gradually realized. The difficult global economic and financial environment in the aftermath of the global financial crisis highlights the issue of the exposure of more open ASEAN financial systems to developments abroad. There are various aspects to this. Duval and others (2014) find that greater banking and portfolio integration between two economies reduces their output comovement in general. However, during a period of crisis (such as the GFC) banking integration does appear to increase the synchronization of cycles across countries. In such cases, global banks pull funds away from all countries, amplifying output comovement for those that are financially integrated and reliant on foreign capital flows (Kalemli-Ozcan and others, 2013)8. This points to the potential merits of regional banking integration: a greater role for regional banks could reduce the impact of financial shocks originating in advanced economies.
As noted earlier, international experience suggests that rapid bank expansion in new markets can pose challenges as bank risk management and supervisory monitoring may fail to keep pace. Uneven supervisory quality in host markets can also contribute to the masking of vulnerabilities. While an ASEAN-wide single supervisory mechanism would be the first best solution, this may not be technically and politically feasible in the near term. In fact, at the current juncture, ASEAN has not indicated plans to consider a single supervisory mechanism or to form a perfectly integrated banking sector. Instead, ASEAN countries have shown a trend towards harmonizing regulations (including in securities markets). While this harmonization takes shape, one option to mitigate risks may be greater host control over foreign branches as is being implemented in Singapore (see next paragraph). Alternatively, risks can also be mitigated by reciprocity arrangements. The principle of reciprocity has governed banks from non-EU member states that open branches in the EU. The reciprocity principle is also a cornerstone of the Basel Committee on Banking Supervision (BCBS) framework for countercyclical capital buffers (CCB). A certain degree of harmonization—for example with regard to the definition of capital—is necessary for mutual recognition. Malaysia’s Financial Sector Blueprint highlights the need to further deepen home-host cooperation in supervision and crisis prevention. In the case of Singapore, the important role played by foreign branches creates exposure to their parent banks. The 2013 FSAP for Singapore notes that Singaporean banks have large capital and other cushions and appear able to withstand major shocks. It also observes that the Monetary Authority of Singapore (MAS) has adopted measures to mitigate the risks 8 The impact of the ongoing deleveraging by European banks appears manageable. In fact, European bank retrenchment has represented an opportunity for ASEAN banks (and those from elsewhere in Asia). The pullout of U.S. banks from emerging markets following the Latin American debt crisis and the deleveraging by Japanese banks in Southeast Asia after Japan’s financial crisis in the 1990s are cautionary tales.

25
posed by the presence of the large number of foreign branches. Accordingly, the MAS has (i) set high standards for approving foreign entrants, applying the same prudential qualifications as to its own locally incorporated banks; (ii) limited the number of foreign branches that are permitted to accept retail deposits; and (iii) recently adopted a program that requires so-called qualified full banks (QFBs) with large retail presence to locally incorporate their retail operations. The MAS has also established good working relationships with the home supervisors of the foreign branches and proactively engages with the management of the parent banks to ensure that they take responsibility for any risks or shortcomings identified in the branches’ operations. As discussed in this paper, with greater financial integration come risks from credit booms and volatile and unpredictable capital flows, underscoring the importance of sound macroeconomic management in a world of high capital mobility. If the risks have their origins in the banking system, then it makes sense for countries to adopt macroprudential tools—such as tightening conditions for housing loans or having banks hold more capital. In other circumstances, if the risks are associated with capital flow surges, then implementation of temporary capital flow management measures might prove useful. At the same time, one ought to not lose sight of the benefits of deeper financial market development. As Bank Negara Malaysia (BNM) Governor Zeti Akthar Aziz has pointed out, mature financial systems can handle capital flows without being overwhelmed. The experience with the retrenchment of euro area banks from Asia following the global financial crisis underscores the importance of well-developed, well-regulated, and deep financial markets in Asia as a means of absorbing external shocks. Going forward, the development of the domestic banking sector and increased banking sector integration can proceed in tandem. A key challenge for policymakers and supervisors in Asia is to design and implement policies that support an integrated banking system that is both efficient and resilient. Harmonization of the regulatory and supervisory frameworks can accelerate the pace of financial integration. As banking sectors develop and integrate, supervisory capacity needs to keep pace with increasingly complex banking institutions with cross-border operations. Making the most of financial integration also means better global rules, such as the reforms envisaged in Basel III. Perhaps paradoxically, the various ongoing efforts aimed at enhancing regional integration could lead to greater regulatory fragmentation. That is, if inadequate coordination between ASEAN and other regional integration initiatives gives rise to conflicting regulation. Policy reform initiatives related to the creation of the AEC can have far-reaching effects on other policy fields, such as domestic monetary and fiscal policy. And capital account liberalization can lead to a loss of policy independence and a resulting need to strengthen fiscal policy and structural reforms. The experience of Malaysia and Indonesia in 2013 provides strong support for the assertion made in ADB (2013, p.16) that “the best strategy for living with an open capital account is to pursue sound macroeconomic policies.” In the first half of 2013, when once large surpluses on the current account of the balance of payments narrowed significantly (Malaysia), or turned into deficits (Indonesia), international investors blamed overly loose macroeconomic policies and started to sell their asset holdings in these countries. A decided reversal of capital flows ensued in both countries later in 2013, and in

26
early 2014 in the case of Indonesia, after the adoption of strong packages of macroeconomic policies. Europe’s experience with financial and monetary integration of highly heterogeneous economies is relevant in thinking about the path to ASEAN (and greater Asian) financial integration. An important lesson that has emerged from Europe is that monetary and financial integration without fiscal or political integration is fraught with danger, especially when member countries are highly heterogeneous in terms of fiscal discipline, export competitiveness, institutional advancement, and other macrocritical dimensions. Unlike the euro area, ASEAN countries do not share a common currency and monetary and exchange rate policy. Therefore, exchange rate movements can help absorb shocks. Nevertheless, as Asia’s financial integration continues, it will be well served by adopting a measured, gradual, and evolutionary approach. Risk mitigation within ASEAN and in collaboration with the IMF The growing interconnectedness between economies and financial systems, globally as well as in the Asia region, is increasing the risk of national and international financial markets being subject to protracted bouts of instability. Efforts are ongoing to strengthen the region’s safety net to address ASEAN+3 countries’ potential need for short-term liquidity in case of balance of payments difficulties. In this context, the May 2012 meeting of the ASEAN+3 Finance Ministers and Central Bank Governors adopted proposals to double the CMIM’s size to US$240 billion and to introduce a crisis prevention facility. The amended CMIM came into being in July 2014, following the required ratifications. As is the case with other regional organizations and financing arrangements (see IMF 2013a, 2013b), the IMF has long been engaged in fruitful dialogue and cooperation with ASEAN and ASEAN+3 institutions. Building on this working relationship, collaboration is being strengthened in the areas of surveillance, liquidity support arrangements, and capacity development. For example, the May 2014 meeting of ASEAN+3 Finance Ministers and Central Bank Governors endorsed the “Guidelines for the further cooperation with the International Monetary Fund.” Collaboration between the IMF and regional organizations focuses on the Fund’s macrofinancial areas of expertise. The IMF regularly presents its research and analysis of global and regional macroeconomic developments and outlook and other issues, including capital market development and capital account liberalization, at various regional forums. Similarly, joint seminars and conferences are organized (for example, in January 2014 in Tokyo, jointly with AMRO), in which issues such as macroprudential policies in ASEAN are discussed. In addition to research and analysis, the IMF helps regional institution building in ASEAN by sharing its expertise gained from cross-country analysis with AMRO in relevant areas.
V. CONCLUSIONS
This paper highlights that further ASEAN intraregional integration (through increased trade, FDI, portfolio investment, and cross-border banking) could be an important source of

27
growth, employment, and more inclusive development as well as a source of resilience to shocks for ASEAN countries. Trade and financial integration within ASEAN has increased considerably in recent years. Nevertheless, there is important scope for further financial sector liberalization and capital account liberalization. In particular, it is well known that financial integration in Asia, and particularly in ASEAN, lags behind the rest of the world. While this is changing (e.g., Singaporean and Malaysian banks’ activities in the region are expanding), more needs to be done to address the continued fragmentation of financial systems in Asia and in ASEAN. In fact, financial integration is an important component of ongoing initiatives to create a single ASEAN market for goods and services. The Blueprint for the ASEAN Economic Community calls for regulatory harmonization and the strengthening of policy coordination among member states. While this is appropriate, the recent experience in the European Union underscores that it is equally important to take a regional approach to financial stability. In particular, a supranational oversight framework may be necessary for the planned single AEC market for financial services. Europe’s experience also suggests the need to reinforce regional macrofinancial surveillance mechanisms (e.g., the ASEAN+3 Macroeconomic Research Office) and regional financial safety nets (e.g. the CMIM). These regional efforts are ongoing and actively supported by IMF staff, where possible. While the ongoing strengthening of regional macroeconomic surveillance and financial safety nets is welcome, it is also important to monitor financial systems to ensure early detection of the emergence of possible vulnerabilities. In particular, ASEAN countries are at different stages of economic development and ongoing financial integration means that countries with relatively low credit-to-GDP ratios are catching up with the front-runners. Such financial deepening is welcome but, as is well known from economic history, the resulting strong growth of credit could give rise to financial sector vulnerabilities and risks. The challenges faced by some of the ASEAN countries in the context of their domestic financial sector development need to be taken into account when deciding on the pace of ASEAN financial sector liberalization. In light of this, the diligent and careful approach taken by ASEAN countries in moving forward is appropriate. On the other hand, the ASEAN/AEC framework leaves open the possibility that more advanced economies move faster with financial integration. Once adequate safeguards are in place it would be in the interest of these countries to remove protectionist barriers to regional banking integration.

28
Appendix 1. Potential Capital Flows to ASEAN: The Sky is the Limit?
Increased ASEAN integration and openness could unleash large capital flows in the region. This Appendix illustrates that strong pull forces could trigger capital flows into relatively capital-scarce ASEAN countries as these countries liberalize their capital accounts further. Capital could flow in from capital-abundant countries including the “plus three” (China, Japan and Korea) and from elsewhere within ASEAN (e.g. Malaysia and Singapore). Two benchmark open economy models of capital flows into ASEAN from capital abundant “plus-three” countries are presented. Since most countries in ASEAN have relatively low capital intensities, the models underscore the potential for large capital inflows to ASEAN as individual countries’ policy and institutional frameworks strengthen further and restrictions on capital flows are removed. The point applies with greatest force to ASEAN’s “frontier economies” (e.g. Cambodia, Lao P.D.R., Myanmar, and Vietnam). But it has more general validity in the capital-scarce ASEAN region: even in such ASEAN-5 countries as Indonesia capital inflows could play an important role in raising capital-labor ratios and raising productivity and living standards. To the extent that such flows are not materializing, the framework points to the need for improvements in hard and soft infrastructure. The benchmark models highlight the potential benefits of financial liberalization and integration for ASEAN countries’ growth and development. At the same time, the barriers that typically inhibit cross-border flows are also discussed.
A. Capital Flows to ASEAN in a Neoclassical Growth Model Without Adjustment Costs
A simple benchmark neoclassical growth model can be used to illustrate the potential capital flows to ASEAN countries under the assumption that notional rates of return to capital would be equalized across ASEAN and the advanced countries after financial liberalization in a frictionless setting. The framework follows Lucas (1990), Fernandez de Cordoba and Kehoe (2000) and Lipschitz, Lane, and Mourmouras (2006). Suppose that output in ASEAN and the “plus three”-countries (China, Japan, and Korea) is produced by a single sector, with a Cobb-Douglas production function in each country i,
. In intensive form, output per worker ( ) is a function of capital per worker
( ), namely, . The marginal product of capital is or, in terms of output per worker,
. (A1)
If Japan (denoted by ) is taken to represent the advanced creditor country and i denotes a representative ASEAN country, then the relative return to capital in country i in ASEAN and Japan is given by

29
. (A2)
Equation (A2) together with an assumption about the capital intensity of production 1/3 can be used to derive a range for the relative return to capital in ASEAN countries. If relative TFP levels were not too different, the marginal product of capital in the ASEAN countries could be an order of magnitude higher than in Japan. In the case of completely liberalized capital mobility, such outsized rate of return differentials would induce large investment flows from capital-abundant countries such as Japan to capital-scarce ASEAN economies. Indeed, as observed by Lucas (1990), no investment would occur in the advanced countries in the face of rate of return differentials of this magnitude. In reality of course, relative TFP levels in developing countries may be much lower, reflecting differences in hard and soft infrastructure and other factors. What would be the size of capital flows that would result from a “big bang” overnight liberalization of the capital account in the simple growth model? To get a sense of that, assume that ASEAN economies are small relative to the global economy and global capital markets and capital flows are such that rates of return to capital are equalized in a single period. The potential capital flow (in relation to pre-flow GDP per worker) can be written in terms of Japan’s capital-output ratio / , the per worker output ratio / , and the per worker capital ratio before and after a “big bang” financial liberalization, / and / , respectively:
. (A3)
The per worker capital ratio before the financial liberalization / can be written as
/ /
//
//
. (A4)
After the financial liberalization, the ratio of the rental rates of capital between ASEAN country and Japan must be equalized:
1̅
, (A5)

30
where ̅ and stand for the rental rate of capital and the output per worker of ASEAN country after the “big bang” financial liberalization, respectively. The relative rental rates of capital / are derived in Equation (A2). This implies that the per worker output ratio after the “big bang” financial liberalization / satisfies
. (A6)
Hence, the per worker capital ratio after the “big bang” financial liberalization / can be written in terms of the TFP ratio as
/ /
// . (A7)
Now, substituting the above expressions (A4) and (A7) into (A3), the potential capital flow (in relation to pre-flow GDP) can be written as
//
. (A8)
The simple frictionless model predicts that each ASEAN country could, in theory, catch up with advanced economies through capital accumulation. The potential growth rate of output per worker can be written as
1 1. (A9)
In order to estimate the size of potential capital flows to each ASEAN country predicted by Equation (A8), we use the Penn World Table (Feenstra, Inklaar, and Timmer, 2013) to calibrate the TFP term for nine ASEAN countries (data for Myanmar was not available) and Japan. We use output-side real GDP in 2011 (on a purchasing power parity (PPP) basis, in millions of 2005 U.S. dollars) for the aggregate output , the capital stock in 2011 (on a PPP basis, in millions of 2005 U.S. dollars) for , and the number of persons engaged in economic activity in 2011 (in millions) for . Assuming that aggregate output is determined by the Cobb-Douglass production function with 1/3 for each ASEAN country and Japan, the TFP term can be calibrated by / .

31
The second and fourth columns of Table A1 illustrate the relative per worker output ratio / and the relative TFP ratio / for nine ASEAN countries in 2011. In combination
with Japan’s 2011 capital-output ratio ( / of 4.75, this is used to estimate the potential capital inflows into ASEAN countries and potential per worker output growth rate in the table.
Table A1. Potential Capital Inflows to ASEAN Countries (in percent) 1/
1/ Japanese capital-output ratio / is set to 4.75.
Table A2 and Figure A1 illustrate the sensitivity of capital flows to different assumptions about the recipient country’s TFP and output per worker relative to advanced countries. Indeed, the lower-right-hand portion of the table illustrates that where per capita output differences are attributable to a more challenging technological and institutional environment (relatively adverse TFP terms), capital inflows will be smaller or may indeed be negative. Table A3 and Figure A1 show the potential per worker output growth for different combinations of the recipient country’s TFP and output per worker relative to advanced countries, implied by Equation (A9). To put the calculations in Table A1 in perspective, in a similar exercise for Spain’s experience with capital flows following financial liberalization in 1986, Fernandez de Cordoba and Kehoe (2000) found that the capital flow required to equalize German and Spanish notional interest rates would be of the order of 86 percent of GDP. The size of flows and the rapidity of capital-labor ratio convergence are reduced in a more generalized model with adjustment costs. This is illustrated in the next section.
Potential Inflows/ PotentialPre-flow GDP Output Growth
Brunei 191.1 114.0 182.9 167.6 247.4 331.8 29.5Indonesia 15.1 10.3 32.3 147.3 18.4 254.1 21.4Cambodia 7.2 3.3 22.4 218.3 10.6 484.3 47.7Laos 8.8 7.5 20.8 117.5 9.5 110.8 8.4Malaysia 44.0 36.9 61.3 119.1 48.0 119.5 9.1Philippines 15.2 11.7 31.1 130.0 17.4 176.5 14.0Singapore 121.9 103.9 120.3 117.3 132.0 109.6 8.3Thailand 22.3 19.5 38.5 114.2 23.9 91.7 6.9Vietnam 10.6 8.3 24.4 128.2 12.1 167.2 13.2
/ / / / /

32
Table A2. Potential Capital Inflows (in Percent of Recipients’ Pre-inflow GDP) 1/ 2/ 3/
1/ Calculations are based on a Cobb-Douglas production function , with 1/3. 2/ Inflows for different assumptions about the recipients’ TFP in relation to advanced countries. 3/ Japanese capital-output ratio / is set to 4.75.
Table A3. Potential Output Growth (in Percent of Recipients’ Pre-inflow GDP) 1/ 2/
1/ Calculations are based on a Cobb-Douglas production function , with 1/3. 2/ The effect of different assumptions about the recipient country’s TFP in relation to advanced countries.
Figure A1. Potential Capital Inflows and Potential per Worker Output Growth
1.80 1.20 1.00 0.80 0.60 0.40 0.35 0.30 0.25 0.200.10 11475 6244 4747 3391 2186 1128 873 605 290 -1690.15 7649 4158 3157 2246 1423 634 407 125 -288 -10530.20 5735 3112 2357 1663 1016 304 49 -314 -919 -21630.30 3818 2057 1541 1050 538 -268 -670 -1324 -2539 -52040.40 2856 1518 1112 702 200 -887 -1527 -2621 -4717 -93980.50 2275 1181 832 448 -108 -1616 -2574 -4244 -7484 -147650.60 1883 942 621 233 -424 -2473 -3826 -6206 -10849 -213130.70 1599 758 446 31 -762 -3466 -5290 -8512 -14817 -290450.80 1382 605 290 -169 -1132 -4602 -6970 -11166 -19389 -379620.90 1209 471 143 -374 -1537 -5881 -8868 -14169 -24568 -480661.00 1066 350 0 -588 -1979 -7305 -10985 -17522 -30353 -593561.20 839 125 -288 -1053 -2984 -10592 -15878 -25278 -43744 -854991.90 310 -664 -1465 -3171 -7826 -26740 -39958 -63493 -109756 -214407
Out
put p
er W
orke
r R
atio
TFP Ratio
1.80 1.20 1.00 0.80 0.60 0.40 0.35 0.30 0.25 0.200.10 2315 1215 900 616 365 153 107 64 25 -110.15 1510 776 567 377 210 69 38 10 -17 -400.20 1107 557 400 258 132 26 4 -18 -38 -550.30 705 338 233 139 55 -16 -31 -45 -58 -700.40 504 229 150 79 16 -37 -48 -59 -69 -780.50 383 163 100 43 -7 -49 -59 -67 -75 -820.60 302 119 67 19 -23 -58 -65 -73 -79 -850.70 245 88 43 2 -34 -64 -70 -77 -82 -870.80 202 64 25 -11 -42 -68 -74 -79 -84 -890.90 168 46 11 -20 -48 -72 -77 -82 -86 -901.00 141 31 0 -28 -54 -75 -79 -84 -88 -911.20 101 10 -17 -40 -61 -79 -83 -86 -90 -931.90 27 -31 -47 -62 -76 -87 -89 -91 -93 -95
TFP Ratio
Out
put p
er W
orke
r R
atio
0 0.2 0.4 0.6 0.8 1 1.2-60
-40
-20
0
20
40
60
80
100
Output per Worker Ratio (yi/y
J)
Pot
entia
l Out
put
Gro
wth
Rat
e in
Per
cent
of
Pre
-flo
w G
DP
Potential per Worker Output Growth Rate
A
i/A
J=1.2
Ai/A
J=1.1
Ai/A
J=1.0
Ai/A
J=0.9
Ai/A
J=0.8
Ai/A
J=0.7
Ai/A
J=0.6
Ai/A
J=0.5
Ai/A
J=0.4
Ai/A
J=0.3
Ai/A
J=0.2
Ai/A
J=0.1
0 0.2 0.4 0.6 0.8 1 1.2-20
-10
0
10
20
30
40
Output per Worker Ratio (yi/y
J)
Pot
entia
l Cap
ital F
low
in R
elat
ion
to P
re-f
low
GD
P (
1=10
0%)
Potential Capital Flow
A
i/A
J=1.2
Ai/A
J=1.1
Ai/A
J=1.0
Ai/A
J=0.9
Ai/A
J=0.8
Ai/A
J=0.7
Ai/A
J=0.6
Ai/A
J=0.5
Ai/A
J=0.4
Ai/A
J=0.3
Ai/A
J=0.2
Ai/A
J=0.1
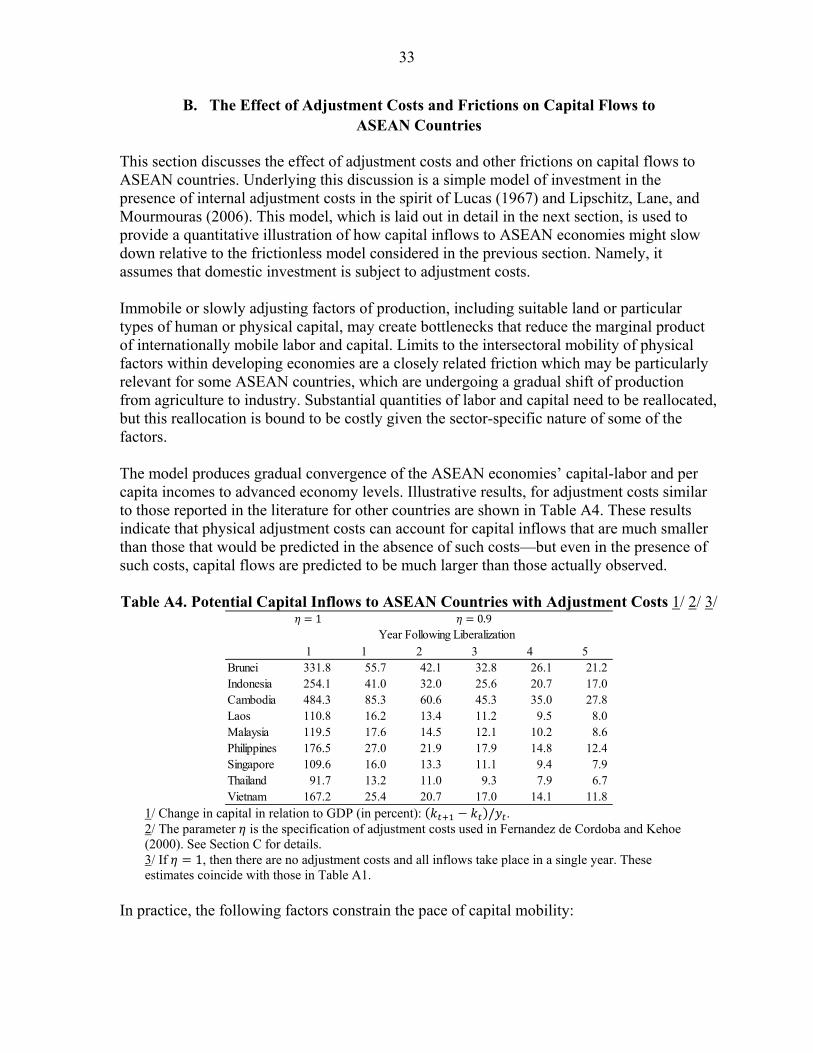
33
B. The Effect of Adjustment Costs and Frictions on Capital Flows to ASEAN Countries
This section discusses the effect of adjustment costs and other frictions on capital flows to ASEAN countries. Underlying this discussion is a simple model of investment in the presence of internal adjustment costs in the spirit of Lucas (1967) and Lipschitz, Lane, and Mourmouras (2006). This model, which is laid out in detail in the next section, is used to provide a quantitative illustration of how capital inflows to ASEAN economies might slow down relative to the frictionless model considered in the previous section. Namely, it assumes that domestic investment is subject to adjustment costs. Immobile or slowly adjusting factors of production, including suitable land or particular types of human or physical capital, may create bottlenecks that reduce the marginal product of internationally mobile labor and capital. Limits to the intersectoral mobility of physical factors within developing economies are a closely related friction which may be particularly relevant for some ASEAN countries, which are undergoing a gradual shift of production from agriculture to industry. Substantial quantities of labor and capital need to be reallocated, but this reallocation is bound to be costly given the sector-specific nature of some of the factors. The model produces gradual convergence of the ASEAN economies’ capital-labor and per capita incomes to advanced economy levels. Illustrative results, for adjustment costs similar to those reported in the literature for other countries are shown in Table A4. These results indicate that physical adjustment costs can account for capital inflows that are much smaller than those that would be predicted in the absence of such costs—but even in the presence of such costs, capital flows are predicted to be much larger than those actually observed. Table A4. Potential Capital Inflows to ASEAN Countries with Adjustment Costs 1/ 2/ 3/
1/ Change in capital in relation to GDP (in percent): / . 2/ The parameter is the specification of adjustment costs used in Fernandez de Cordoba and Kehoe (2000). See Section C for details. 3/ If 1, then there are no adjustment costs and all inflows take place in a single year. These estimates coincide with those in Table A1.
In practice, the following factors constrain the pace of capital mobility:
1 1 2 3 4 5Brunei 331.8 55.7 42.1 32.8 26.1 21.2Indonesia 254.1 41.0 32.0 25.6 20.7 17.0Cambodia 484.3 85.3 60.6 45.3 35.0 27.8Laos 110.8 16.2 13.4 11.2 9.5 8.0Malaysia 119.5 17.6 14.5 12.1 10.2 8.6Philippines 176.5 27.0 21.9 17.9 14.8 12.4Singapore 109.6 16.0 13.3 11.1 9.4 7.9Thailand 91.7 13.2 11.0 9.3 7.9 6.7Vietnam 167.2 25.4 20.7 17.0 14.1 11.8
Year Following Liberalization1 0.9

34
Structural factors. Viewed from a saving-investment balance perspective, structural obstacles to investment continue to be present, limiting the size of current account deficits and of capital flows. Although such obstacles are gradually easing up in ASEAN and private investment rates have increased in the last few years, reform agendas are incomplete and there is scope for private investment to rise further. Infrastructure upgrading is still needed in Indonesia, the Philippines, and Thailand to boost potential growth rates.
Technological factors may result in differences in the productivity of capital across countries, in contrast to the predictions of the model, in which capital scarcity is the key factor. Differences in technology could reflect not just the state of knowledge but also aspects of the way production processes are organized. They also include externalities, such as those associated with human capital accumulation through “learning by doing”, which may give rise to persistent cross-country differences in per capita incomes (Lucas, 1988, 1990).
Insufficient financial infrastructure in recipient countries, defined as limited capacity of a financial system to channel capital flows efficiently, is a related factor limiting capital flows. Underdeveloped or thin capital markets, such as small local currency bond markets, limited private pension funds, and rudimentary local currency settlement arrangements would be a case in point. For ASEAN-5 countries, despite considerable effort to develop domestic bond markets, these markets are not much larger now, relative to GDP, than they were a decade ago. ASEAN financial systems are bank dominated, and plans for regional banking integration still have considerable way to go. Moreover, new bank capital rules could limit their growth and bank financing alone may not be sufficient to fund ASEAN investment needs, especially for infrastructure. This raises the question of whether bond markets are sufficiently developed to do this and if not, what reforms are needed. A related issue is the development of private pension funds. Pension systems in ASEAN countries provide relatively limited coverage, although private pension schemes (third pillars) are being developed in some countries, which should help local bond markets grow. As a related point, there may be credit market constraints as access to credit may be limited by the availability of suitable domestic assets to serve as collateral.9
Policy weaknesses (actual or perceived), including uncertain or turbulent macroeconomic prospects, which tend to limit capital inflows and in some cases lead to capital flight. The perceived risk of confiscatory taxation or imposition and/or intensification of exchange controls, as well as unclear property rights and uneven
9 A model featuring traded and non-traded goods, limited intersectoral factor mobility, and liquidity constraints could further reduce the pace and amount of capital flows. While Fernandez de Cordoba and Kehoe (2000) incorporate traded and non-traded goods for the case of Spain, they do not allow for liquidity constraints. Combining their specification with a model with credit constraint, such as Barro, Mankiw, and Sala-i-Martin (1995) and Barro and Sala-i-Martin (2004, p. 165), could shed light into the relative importance of consumer and corporate foreign borrowing in driving capital flows.

35
application of laws and contracts are additional concerns and may be related to the considerable degree of dollarization in some ASEAN frontier economies.
Concerns about repayment arising from the combination of large sustained current account deficits and domestic macro-fiscal vulnerabilities and financial stability concerns. According to the early warning literature, excessive current account deficits are an important leading indicator of a crisis. In the eight years in the run up to the Asian financial crisis, most ASEAN countries were running significant current account deficits, which in Lao P.D.R., Malaysia, Thailand and Vietnam averaged about 6 percent of GDP per annum. Underlying market concerns over current account deficits—even if they, in fact, reflect real factors such as capital scarcity and productivity growth—are institutional and macro-financial considerations, together with the difficulty market participants face in ascertaining the underlying causes of capital flows. For these reasons, larger current accounts deficits tend to be associated with higher required risk premia and serve to limit the capital flows in response to any given differential in returns.
Rising risk premia. Market participants often have difficulties ascertaining whether capital inflows are in fact based on real fundamental factors or on irrational exuberance or other factors, including fads and self-fulfilling expectations. For these reasons, larger current account deficits tend to be associated with higher required risk premia which help limit the flows in response to any given differential in returns.
Capital account restrictions. Capital account restrictions in ASEAN countries are discussed in the main text of the paper (Section III.D).
C. Capital Flows to ASEAN in a Model with Adjustment Costs
This section discusses in more detail the model of capital flows with adjustment costs. The model closely follows that of Lipschitz, Lane, and Mourmouras (2006). Consumers Consider a representative ASEAN economy. Suppose that the ASEAN economy is a small open economy inhabited by a large number of identical, infinitely lived households, each of whom maximizes the discounted utility
, (A10)
where ∈ 0,1 is the discount factor. For simplicity, let the period-by-period utility
function be a constant relative risk aversion (CRRA) utility function 1 .
The representative household owns a unit of labor each period which it supplies inelastically to domestic firms and for which it receives the wage in each period. The representative

36
household’s assets at the beginning of period are denoted , and is given. They consist of the initial domestic stock of physical capital, 0, and initial foreign assets (which may be positive, zero, or negative). In the simulation, we set 0. The market price of a unit of installed capital at date is denoted . We assume that the economy is open to asset trades with foreign residents. Domestic households’ portfolios then consist of claims on domestic capital, , and bonds purchased (or issued) in the international capital market, . Thus, the representative household’s assets at the beginning of period 1 follows:
. (A11)
These internationally traded bonds are one-period, risk-free securities issued at and maturing at 1. They are denominated in terms of the aggregative consumption good and bear the world rate of interest ∗ , which residents of our small open economy take as exogenous. In the absence of uncertainty and country risk premia, claims on domestic capital and international bonds are perfect substitutes in domestic residents’ portfolios. The period-by-period budget constraint of the representative household is, for each time 0,1, …,
1 ∗ . (A12)
The first-order conditions for the consumer’s utility maximization problem yield the standard Euler equation:
1 ∗ ′′
. (A13)
For the representative consumer, at an optimum, the marginal rate of substitution between present and the next period consumption must equal the real interest the consumer faces in the world capital market. The shape of the time path of consumption depends on the relative sizes of the subjective rate of time preferences and the real interest rate. If 1 ∗ 1, consumption is constant between periods and 1 (i.e. ); if 1 ∗ 1, then consumption is rising (i.e. ); otherwise it is falling (i.e. ). In addition, the equilibrium consumption path must satisfy a transversality condition ensuring that its present value equals the present value of the household’s wealth (no Ponzi schemes are possible). In the following, we assume that the world interest rate satisfies ∗ ∗ for each period
0,1, …, where 1 ∗ 1. Hence, at an optimum, the representative consumer has a constant consumption ∗ ∗ in each period 0,1, …. Then, it follows from the present value budget constraints that the consumer’s rate of per capita consumption is given by

37
∗∗
1 ∗ , (A14)
where is the present value of the consumer’s wealth:
1 ∗ 11 ∗ . (A15)
Firms There is any number of perfectly competitive domestic firms, each of whom operates a Cobb-Douglas constant-returns-to-scale technology with capital share of income 1/3. For simplicity, we assume that the TFP term is constant over time. The representative firm produces output using hired labor and the capital stock it owns. Capital depreciates at rate per period. Following Lucas (1967), the installation of new capital goods is subject to adjustment costs. Denoting (gross) real domestic investment by , the representative firm’s capital stock evolves according to
1 , (A16)
where the function satisfies 0, 0, , and 1. The advantage of this specification relative to, say, a quadratic adjustment cost function is that adjustment costs are independent of the scale of the firm. For the sake of simplicity, we adopt the parameterization used by Fernandez de Cordoba and Kehoe (2000):
1
1 , (A17)
for ∈ 0,1 . Observe that the standard model corresponds with the case where 1. In that case, there are no adjustment costs, that is, / / and the capital transition equation reduces to the standard one: 1 . It can be seen that /
/ . In the simulation, we set 0.9 as in Fernandez de Cordoba and Kehoe (2000). Given that the world rate of interest is constant and equal to ∗, the representative firm’s problem at date 0 is to select a sequence of labor hires, investment plans, and capital that maximize its discounted sum of profits

38
1
1 ∗ (A18)
subject to (A16). Since labor utilization can be adjusted costlessly, firms’ labor demand schedules are derived from the first-order conditions 1 . However, firms’ investment plans no longer correspond to the desired capital stock level satisfying the standard condition ∗ . The adjustment cost slows down the pace of firms’ capital accumulation, as demonstrated by the first-order condition for investment. Letting denote the Lagrange multiplier (the “shadow price” of installed capital) corresponding to (A16), the Lagrangian is
1
1 ∗ 1 . (A19)
Now, the firm’s first-order condition with respect to investment is
1. (A20)
Investment is positive only if the shadow price of installed capital ( ) exceeds unity, the market price of new capital goods.10 With ∈ 0,1 , the firm’s investment demand schedule, which is an increasing function of , reduces to
. (A21)
Next, the first-order condition for yields the investment Euler equation:
11 ∗ 1 ′
11 ∗ 1 ∙ ,
(A22)
where the second equality follows from Equation (A20) with period 1. Along the optimum path of capital accumulation, the first equality of (A22) implies that the shadow price of an extra unit of capital, , is the discounted sum of three components: (1) the
10 For a related analysis of Tobin’s , see Obstfeld and Rogoff (1996, p. 107).

39
marginal product of capital next period; (2) the shadow price of the undepreciated portion of the unit of capital next period; and (3) the capital unit’s marginal contribution to lower adjustment costs next period. Equilibrium The feasibility constraint for the economy expressed in per worker terms is
1 ∗ . (A23)
The trade balance in each period is defined by 1 ∗ . Given the economy’s initial capital stock and ownership of foreign assets, denoted 0 and , respectively, a perfect foresight equilibrium is a set of sequences for the shadow value of capital and quantities, , , , , , with , , and positive, that are consistent with utility and profit maximization and clear the goods market. An equilibrium reaches a steady state when and . In a steady state, we have / , / 1, and hence 1. The steady state capital- and output-labor ratios are pinned down by the world interest rate
*r and the marginal productivity condition: ∗ and . That is, the
steady state capital is given by ∗ . We assume that Japan is in a steady state
at period 0. By using our estimation of capital per worker and the TFP term, we obtain ∗ 0.07. We set ∗ 0.02 and 0.05.
We solve an equilibrium path such that the economy reaches a steady state in a sufficiently large number of periods . In the simulation, we set 40 (years). Simulations
As Figure A2 shows, before the ASEAN economies liberalize their capital accounts, the shadow value of installed capital is high initially, reflecting economy-wide relative scarcity of capital. Capital accumulation is correspondingly high but, unlike in the frictionless model, capital inflows are gradual as in Figure A2. Over time, the shadow price of capital falls and the economy approaches the steady state in which investment merely replaces units of capital depreciated. Investment and consumer demand both drive early capital inflows. Increased openness to capital flows leads to consumption and investment booms as domestic households and firms take advantage of new opportunities to smooth consumption and augment plant and equipment. While firms respond to adjustment costs by reducing investment relative to the frictionless model, capital inflows are quite high. Correctly anticipating higher future incomes, households finance the shortfall between permanent and disposable incomes through foreign borrowing, intermediated by domestic banks. In the absence of liquidity constraints, consumers maintain a constant optimal rate of consumption as in Equation (A14).
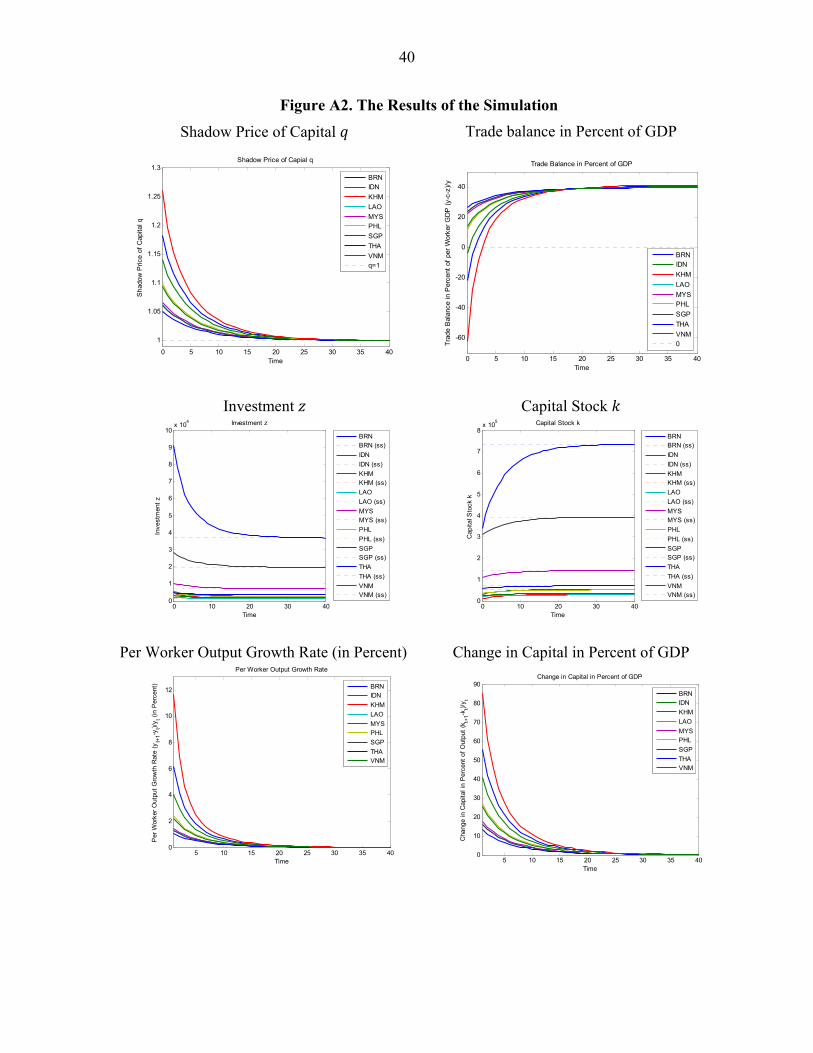
40
Figure A2. The Results of the Simulation
Shadow Price of Capital Trade balance in Percent of GDP
Investment Capital Stock
Per Worker Output Growth Rate (in Percent) Change in Capital in Percent of GDP
0 5 10 15 20 25 30 35 40
1
1.05
1.1
1.15
1.2
1.25
1.3
Time
Sha
dow
Pric
e of
Cap
ital q
Shadow Price of Capial q
BRNIDN
KHM
LAO
MYSPHL
SGP
THA
VNMq=1
0 5 10 15 20 25 30 35 40
-60
-40
-20
0
20
40
Time
Tra
de B
alan
ce in
Per
cent
of
per
Wor
ker
GD
P (
y-c-
z)/y
Trade Balance in Percent of GDP
BRNIDN
KHM
LAO
MYSPHL
SGP
THA
VNM0
0 10 20 30 400
1
2
3
4
5
6
7
8
9
10x 10
4
Time
Inve
stm
ent
z
Investment z
BRNBRN (ss)
IDN
IDN (ss)
KHMKHM (ss)
LAO
LAO (ss)
MYSMYS (ss)
PHL
PHL (ss)
SGPSGP (ss)
THA
THA (ss)
VNMVNM (ss)
0 10 20 30 400
1
2
3
4
5
6
7
8x 10
5
Time
Cap
ital S
tock
k
Capital Stock k
BRNBRN (ss)
IDN
IDN (ss)
KHMKHM (ss)
LAO
LAO (ss)
MYSMYS (ss)
PHL
PHL (ss)
SGPSGP (ss)
THA
THA (ss)
VNMVNM (ss)
5 10 15 20 25 30 35 400
2
4
6
8
10
12
Time
Per
Wor
ker
Out
put
Gro
wth
Rat
e (y
t+1-y
t)/y t (
in P
erce
nt)
Per Worker Output Growth Rate
BRNIDN
KHM
LAO
MYSPHL
SGP
THAVNM
5 10 15 20 25 30 35 400
10
20
30
40
50
60
70
80
90
Time
Cha
nge
in C
apita
l in
Per
cent
of
Out
put
(kt+
1-kt)/
y t
Change in Capital in Percent of GDP
BRNIDN
KHM
LAO
MYSPHL
SGP
THAVNM

41
References Aizenman, Joshua, 2009, Hoarding International Reserves versus a Pigovian Tax-Cum-
Subsidy Scheme: Reflections on the Deleveraging Crisis of 2008–9, and a Cost Benefit Analysis. NBER Working Paper 15484 (Cambridge, Massachusetts: National Bureau of Economic Research).
Asian Development Bank (ADB), 2012, “Facts and Data about Southeast Asian Infrastructure.” Available at http://www.adb.org/features/fast-facts-asean-infrastructure-fund
—, 2013, The Road to ASEAN Financial Integration: A Combined Study on Assessing the Financial Landscape and Formulating Milestones for Monetary and Financial Integration in ASEAN (Manila; Asian Development Bank). Available at http://www.adb.org/sites/default/files/pub/2013/road-to-asean-financial-integration.pdf
Association of Southeast Asian Nations (ASEAN), 2008, ASEAN Economic Community Blueprint, January. Available at http://www.asean.org/news/item/declaration-on-the-asean-economic-community-blueprint
Barro, Robert J. and Xavier Sala-i-Martin, 2004, Economic Growth. (Cambridge, Massachusetts: MIT Press).
Barro, Robert J., N. Gregory Mankiw, and Xavier Sala-i-Martin, 1995, “Capital Mobility in Neoclassical Models of Growth,” American Economic Review, 85: 103–115.
Basu Das, Sanchita, Jayant Menon, Rodolfo Severino and Omkar Lal Shrestha, (Editors), 2013, The ASEAN Economic Community: A Work in Progress, (Singapore: Asian Development Bank and Institute of Southeast Asian Studies), Available at http://www.adb.org/sites/default/files/pub/2013/aec-work-progress.pdf
Claessens, Stijn, and Neeltje Van Horen, 2014, “Foreign Banks: Trends and Impact,” Journal of Money, Credit and Banking, Vol. 46, Issue s1, pp. 295–326. http://onlinelibrary.wiley.com/doi/10.1111/jmcb.2014.46.issue-s1/issuetoc
Cubero, Rodrigo, Shanaka J. Peiris, Purichai Rungcharoenkitkul, and Dulani Seneviratne, 2014, “Growing Strong Together: An Analysis of Trade Linkages in ASEAN” (unpublished; Washington: International Monetary Fund).
Duval, Romain, Kevin Cheng, Kum Hwa Oh, Richa Saraf, and Dulani Seneviratne, 2014, “Trade Integration and Business Cycle Synchronization: A Reappraisal with Focus on Asia,” IMF Working Paper 14/52 (Washington: International Monetary Fund).
Feenstra, Robert C., Robert Inklaar and Marcel P. Timmer, 2013, “The Next Generation of the Penn World Table” available for download at www.ggdc.net/pwt.

42
Fernandez de Cordoba, Gonzalo, and Timothy J. Kehoe, 2000 “Capital Flows and Real Exchange Rate Fluctuations Following Spain’s Entry into the European Community,” Journal of International Economics, 51: 49–78.
Fiechter, Jonathan, Inci Otker-Robe, Anna Ilyina, Michael Hsu, Andre Santos, and Jay Surti, 2011, “Subsidiaries or Branches: Does One Size Fit All?” IMF Staff Discussion Note, SDN/11/04 (Washington: International Monetary Fund).
International Monetary Fund (IMF), 2010, “Does Asia Need Rebalancing,” Regional Economic Outlook for Asia and the Pacific. Available at http://www.imf.org/external/pubs/ft/reo/2010/apd/eng/areo0410.pdf
—, 2012, “The Liberalization and Management of Capital Flows: An Institutional View,” IMF Policy Paper, November 14, 2012. (Washington). Available at http://www.imf.org/external/np/pp/eng/2012/111412.pdf
—, 2013a, “Stocktaking the Fund’s Engagement with Regional Financing Arrangements,” IMF Policy Paper, April 2013. (Washington). Available at
http://www.imf.org/external/np/pp/eng/2013/041113b.pdf
—, 2013b, “IMF Explores Ways to Enhance Cooperation with Regional Groups” IMF Survey, July 2, 2013. Available at http://www.imf.org/external/pubs/ft/survey/so/2013/POL070213A.htm
—, 2013c, “Guidance Note for the Liberalization and Management of Capital Flows.” Available at http://www.imf.org/external/np/pp/eng/2013/042513.pdf
Ishii, Shogo, Karl Habermeier, Jorge Ivan Canales-Kriljenko, Bernard Laurens, John Leimone, and Judit Vadasz, 2002, Capital Account Liberalization and Financial Sector Stability, IMF Occasional Paper No. 211 (Washington: International Monetary Fund).
Jeanne, Olivier, and Anton Korinek, 2010, “Managing Credit Booms and Busts: A Pigouvian Taxation Approach,” NBER Working Paper 16377 (Cambridge, Massachusetts: National Bureau of Economic Research).
Kalemli-Ozcan, Sebnem, Elias Papaioannou, and Fabrizio Perri, 2013, “Global Banks and Crisis Transmission,” Journal of International Economics, Vol. 89, No. 2, pp. 495–510.
Lipschitz, Leslie, Timothy Lane, and Alex Mourmouras, 2006, “Capital Flows to Transition Economies: Master or Servant?” Czech Journal of Economics and Finance, 56: 202–222.
Lucas, Robert E. Jr., 1967, “Adjustment Costs and the Theory of Supply,” Journal of Political Economy, 75: 321–334.

43
—, 1988, “On the Mechanics of Economic Development,” Journal of Monetary Economics, 22: 3–32.
—, 1990, “Why Doesn’t Capital Flow from Rich to Poor Countries?” American Economic Review, Papers and Proceedings 80: 92–96.
Mourmouras, Alexandros and Steven Russell, 2013, “Financial Crises, Capital Liquidation, and International Reserves,” (unpublished; Washington: International Monetary Fund).
Obstfeld, Maurice and Kenneth Rogoff, 1996, Foundations of International Macroeconomics (Cambridge, Massachusetts: MIT Press).
Park, Yung Chul and Shinji Takagi, 2012, “Managing Capital Flows in an Economic Community: The Case of ASEAN Capital Account Liberalization,” ADBI Working Paper 378. (Tokyo: Asian Development Bank Institute). Available at http://www.adbi.org/working-paper/2012/08/30/5223.managing.capital.flows.asean.account.liberalization
Pongsaparn, Runchana and Olaf Unteroberdoerster, 2011, “Financial Integration and Rebalancing in Asia”, IMF Working Paper 11/243 (Washington: International Monetary Fund).
Schipke, Alfred (Editor), 2015, Frontier Asia: The Next Generation of Emerging Markets, (Washington: International Monetary Fund).
Vargas, M., 2014, “Quinn-Toyoda and Other De Jure Indices of Capital Account Openness,” (Unpublished; Washington: International Monetary Fund).
World Bank, 2014, East Asia and Pacific Economic Update April 2014: Preserving Stability and Promoting Growth. Available at http://documents.worldbank.org/curated/en/2014/04/19543743/preserving-stability-promoting-growth