Embed Size (px)
Citation preview

1
Article type: Full Length Article
High fidelity simulation of ultrafine PM filtration by multiscale fibrous media
characterized by a combination of X-ray CT and FIB-SEM
Zhengyuan Pan,†, ‡, § Xiaole Zhang,‡, § Zhaoxia Sun,† Fuze Jiang,‡, § Luchan Lin,‡, § Yun Liang, † Min Tang,†,* Jing Wang ‡, §, *
†State Key laboratory of Pulp and Paper Engineering, South China University of Technology,
Guangzhou 510640, China ‡Institute of Environmental Engineering, ETH Zurich, 8093 Zurich, Switzerland §Advanced Analytical Technologies, Empa, Ueberlandstrasse 129, 8600 Dübendorf,
Switzerland
* Corresponding authors: Prof. Jing Wang ([email protected])
Prof. Min Tang ([email protected])
Keywords: nanofiber, multiscale, X-ray tomography, composite filter media, numerical
simulation
(Abstract) Air filtration mechanisms in the composite filter media used in practical
applications are important and challenging to understand because the component fibers could
have various size scales and morphologies. In this work, a three-dimensional digital model of
nanofiber-based filter media was reconstructed for the first time based on the X-ray tomography
data for the cellulose substrate and the Focused Ion Beam-Scanning Electron Microscope (FIB-
SEM) image analysis for the several microns thick (3.82-7.90 μm) electrospun polyvinylidene
fluoride (PVDF) nanofiber membrane. Besides the high-resolution model where the details of
the fibrous structures were fully resolved, another low-resolution model with approximated
unresolved structures was also established. Filtration simulations utilizing these models were
conducted considering the drag force, Brownian diffusion and aerodynamic slip. The simulated
filtration efficiencies agreed well with the experiments for particles of 70-400 nm, including
Preprints (www.preprints.org) | NOT PEER-REVIEWED | Posted: 20 July 2020
© 2020 by the author(s). Distributed under a Creative Commons CC BY license.

2
the most penetrating particle size (MPPS, 100-200 nm). Moreover, the structure-resolved
models had higher accuracy but higher computational costs, while the unresolved simulations
saved much running time but over-predicted the filtration efficiency, especially for smaller
particles (<100 nm). Our study presents a comprehensive strategy for investigating the
composite filter media with multiscale complex structures using a combination of advanced
characterization technologies and modular simulation models.
Preprints (www.preprints.org) | NOT PEER-REVIEWED | Posted: 20 July 2020
3
1. Introduction
The safety and environmental issues have recently attracted broad attention due to the
continuously deteriorating environment, air pollution and outbreaks of the respiratory infectious
diseases,[1] which drives the investigation of air filtration technology and application.[2] As a
recognized cost-effective material to capture the suspended particles in air, fibrous filter media
with extensively fiber networks and tortuous interconnected pores have been widely used in air
filtration,[3] especially for PM2.5 particles which may contain various viruses and bacteria,
threatening human health.[4] Fibrous filter media utilize different types of fibers, which can be
classified by sources, e.g. natural fibers, synthetic polymer fibers, inorganic/mineral fibers and
biofibers. As one of the most rapidly growing technology over the last 20 years, nanofibers have
been widely adopted in various air filtration applications due to the superb performance in the
interception and inertial impaction regime, and their flexibility to be fabricated from different
types of materials.[5-9] However, the thin nanofiber membrane (NFM) often has limited
mechanical properties. To achieve balance between the high filtration efficiency and the
structural integrity during applications, a nanofiber membrane is usually fabricated as a layer
or coating to a micro-scale fiber based substrate e.g. cellulose and spunbond substrate,[10]
whereby the nanofiber improves the filtration efficiency and the substrate as the support
structure enhances the mechanical properties and enlarges the dust storage space. Therefore, it
is important to investigate the structure and filtration mechanisms of these composite filter
media which were close to the filters used in practical applications.
The detailed analysis for the structures of multiscale composite filter media is the indispensable
Preprints (www.preprints.org) | NOT PEER-REVIEWED | Posted: 20 July 2020
4
information to better understand their filtration mechanisms. However, the accurate structures
are difficult to obtain due to the numerous fibers with various size scales and morphologies.
The filter media composed of micro-scale fibers can be measured using the standard techniques
e.g. digital volume imaging,[11] magnetic resonance imaging,[12] lab or X-ray tomography.[13-16]
A typical lab X-ray computed tomography instrument (CT) has a resolution of 5 μm, and the
submicron CT or nano CT could measure down to 0.5 μm.[17] Some synchrotron radiation
tomographic microscopy performed at high energy beamline could reach an effective pixel size
of about 0.15 μm,[18] but the typical minimum object size should be at least 3 voxel size wide
for a quality scan.[19] The above examples indicate that it is hard to completely reconstruct
membranes containing fibers below 300 nm by using these standard techniques. Thus, the
scanning electron microscope (SEM) is commonly utilized to obtain the key features, including
diameter, length, curvature of actual fibers of the nanofiber membranes.[20-24] For composite
filter media, Zhang et al. reported a single layer PEO@PAN/PSU composite membrane
structure model, reconstructed by using SEM images to obtain the pore structure parameters
and the average diameters of PAN and PSU fibers, which were about 270 nm and 1.3 μm,
respectively.[25] Zhang et al. studied the particle capture performance of a gradient-structure
filter media composed of PSU fiber layer (diameter around 1 μm), PAN fiber layer (diameter
around 200 nm) and PA-6 fiber layer (diameter around 20 nm), and a 3D digital structure model
was generated with the parameters measured by experiments and SEM images.[26] Dusan et al.
built up idealized 3D models for filter media with PVDF nanofibers (dimeter around 100nm)
layered on melt blown substrate (diameter around 1μm) based on the fiber features obtained
Preprints (www.preprints.org) | NOT PEER-REVIEWED | Posted: 20 July 2020
5
from SEM images.[27] However, the slip effect around the nanofibers was neglected in the flow
simulations of these studies, which played an important role in reducing the drag force due to
nanofibers on the air flow.[28] Wang et al. used a 2-D structure model representing filter media
with a nanofiber layer on a substrate, where the nanofiber layer was assumed as a layer with
single-fiber thickness consisting of uniformly distributed circular fibers, and the substrate was
simplified as a porous jump boundary ignoring the micro-structure inside it.[29] All of these
structure models relied on substantial assumptions. The thickness of the nanofiber membranes
was often ignored or derived from empirical equations since the cross-section of the nanofiber
membranes could be heavily deformed during the cutting process for SEM images.[30] These
idealized models used for nanofiber membranes were insufficient to represent the actual
structure of the fibers in substrates, especially the cellulose fibers with hollow structure, where
the inner diameter could be different due to the difference in sources and treatment,[31] and thus
could compromise the quality of numerical calculations for the filter performance. It is difficult
to reconstruct the composite filter media with single characterization method. Moreover, the
flow regimes in the substrate and nanofiber membrane were different due to the various fiber
scales.[32] It remains unclear whether the slip model used at the surface of the nanofiber in
numerical simulations could be suitable for composite filter media.
This work studied the particulate filtration process of nanofiber-based composite media with
experimental and simulation methods. The filter media composite #1, #2 and #3 were prepared
by electrospinning PVDF nanofibers on the cellulose fiber-based substrate with different
fabrication durations, which were 1.0, 1.5 and 2.0h, respectively. The average diameter of
Preprints (www.preprints.org) | NOT PEER-REVIEWED | Posted: 20 July 2020
6
PVDF nanofibers was around 309 nm, and the diameter of the fibers in the substrate was around
tens of microns.
The 3D digital structure models of the three nanofiber-based composite filter media were first
developed by a new method which combined X-ray tomography and FIB-SEM. The 3D voxel-
based virtual substrate and NFMs were respectively created based on the X-ray tomography
(CT) slices and the FIB-SEM images analytic data. Then the voxel sizes of the substrate and
NFM were unified to be assembled together to obtain the complete composite structures. In
addition to the high-resolution model in which the details of the fibrous structures were fully
resolved, another low-resolution model with approximated unresolved structures was also
established. Particulate filtration simulations based on the resolved and unresolved models were
carried out considering the air drag force, Brownian diffusion and slip effect around the surface
of fibers. The obtained results from numerical simulations such as pressure drop and filtration
efficiency were analyzed and compared with the corresponding experimental data. The strategy
forms the basis of a powerful tool for innovative multi-layer composite media design and
optimization. The various composite filter media models proposed here can provide reference
for further investigation of the dynamic evolution of the microstructure and the macroscopic
filtration characteristics of composite filter media in the long-term particle loading process.
2. Experiment
2.1 Material and samples preparation
The substrate composed of micro-scale cellulose and polyester (PET) fibers was prepared with
Preprints (www.preprints.org) | NOT PEER-REVIEWED | Posted: 20 July 2020
7
the wet-laid method, provided by Fibrway (Guangzhou, China). Then a PVDF nanofiber
membrane was fabricated on the substrate by electrospinning. For the fabrication of NFM,
polyvinylidene fluoride (Mw = 15000, Sigma-Aldrich Co. Ltd) powders were dissolved in N,
N-dimethylformamide (DMF)-Acetone (Sigma-Aldrich Co. Ltd) (1:1 wt.%), and the solution was
stirred for over 12 hours at room temperature. A multi-jet electrospinning machine (NaBond
Technologies Co. Ltd.) equipped with three spinnerets and a rotating drum substrate was used
to produce the double layer composite filter media. The detailed parameters for the
electrospinning process were summarized in Table 1.
2.2 Filter media characterization
2.2.1 Fiber size distribution and thickness
The fiber diameter distribution was determined by measuring over 50 fibers in the SEM images
using an image analyser (Image J, NIH).[33] Different methods were utilized to characterize the
thickness in this study due to the dual-layer structure of the filter media containing fibers with
different scales. The thickness of the substrate was directly determined by SEM visualization
with normal sampling method. Since the NFM was too weak and thin to keep the cross-section
from deforming during the normal cutting process, a combined FIB-SEM (Helios NanoLab
DualBeam, USA) was used to measure its thickness. The cross section was exposed by a FIB
milling and imaged in SEM secondary electron (SE) mode at a sample tilt of 52 degree. After
tilt correction, the thickness of NFM was determined.
2.2.2 Air permeability and solidity
Preprints (www.preprints.org) | NOT PEER-REVIEWED | Posted: 20 July 2020
8
The air pressure drops of the medium were measured at different face velocities from 16.67 to
100 mm/s. Specially, the pressure drop ( np ) of the NFM was estimated by subtracting the
pressure drop of substrate sp from the overall pressure drop of composite filter media. A gas
pycnometer (Accuoyc II 1340, Micromeritics) based on the gas displacement method was
applied to determine the skeleton density of the substrate and the analysis gas was helium. Then
the solidity can be derived by Equation 1.
t
s
= (1)
where s was the skeleton density; t was the macro density of material defined as the ratio
between the mass and the total volume of the substrate. Since the solidity of NFMs could not
be determined with the gas pycnometer directly, a method by fitting simulated results with
measured values was used.[34] Air flow simulations were conducted on the generated 3D virtual
nanofiber structures with predefined solidities (the generation and modeling process to be
discussed).
2.2.3 Particle collection performance characterization
The experimental setup for filtration efficiency test was shown in Figure S1. The monodisperse
sodium chloride nanoparticles were utilized in the tests. The dry and clean compressed air was
delivered to a lab-made aerosol generator to generate polydisperse sodium chloride particles by
atomizing 1 wt.% NaCl solution. The generated aerosol went through a diffusion dryer for
evaporating the water, and then neutralized by a Kr-85 bi-polar charger to reach the Boltzmann
Preprints (www.preprints.org) | NOT PEER-REVIEWED | Posted: 20 July 2020
9
equilibrium charge distribution. The monodisperse particles with mobility diameters of 50, 70,
90, 100, 200, 300, 400, 500 nm were respectively selected by a differential mobility analyser
(DMA, model 3081, TSI). A laminar flow meter was set before DMA to ensure the ratio
between the sheath flow and the aerosol flow entering the DMA was around ten. [35] Two
condensation particle counters were installed upstream and downstream of the filter holder to
measure the particle concentrations. Two mass flow controllers (MFC) were used to keep the
aerosol and makeup air flow rates in agreement with the experimental requirement. More details
of the setup can be found in the previous work.[36] The filtration efficiency was defined by the
percentage of the particle collection as in Equation 2.
1 downtotal
up
CE
C= − (2)
where Cdown and Cup were respectively the up- and down-stream particle number concentrations.
3. Numerical simulation
3.1 Reconstruction of filter media
3.1.1 substrate model
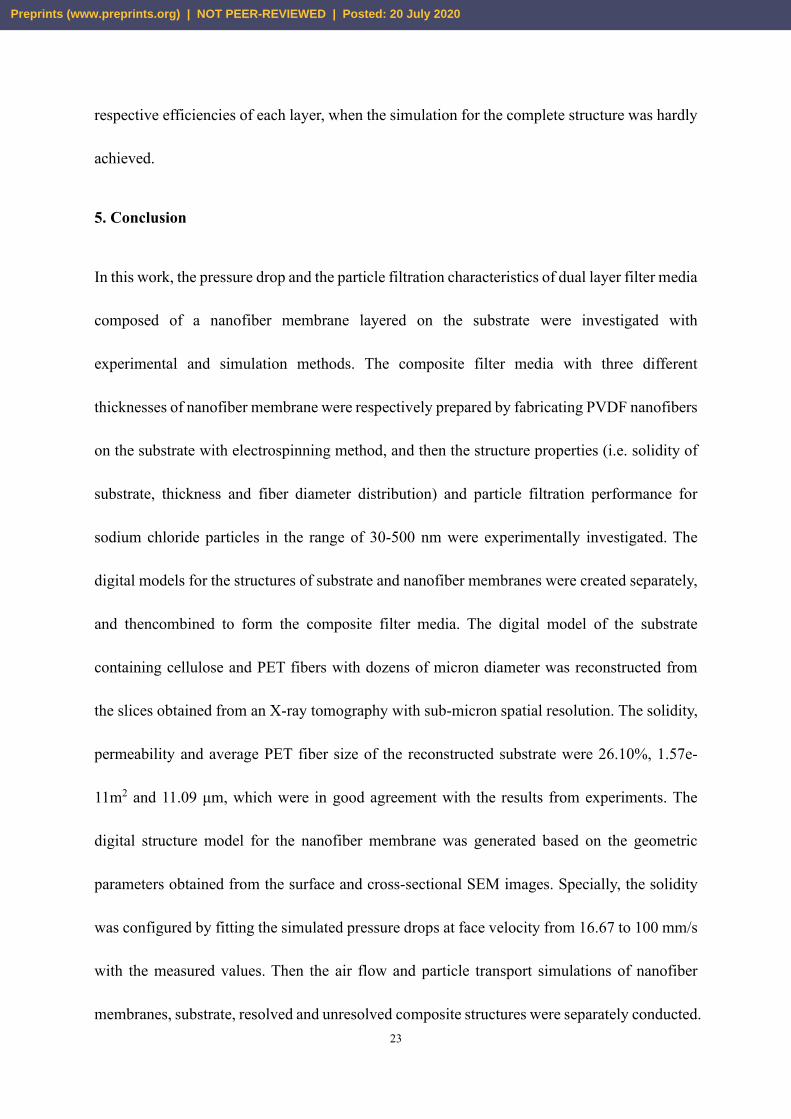
The top-view and cross-sectional SEM images of substrate was showed in Figure 1. The
cellulose fibers in the substrate had irregular shapes and hollow structure, often twisted and
entangled with each other, which made it difficult to reconstruct the internal micro-structure by
using the method to randomly generate fiber structures with only parametric constraints such
as mean fiber size and porosity. An X-ray tomography-based method was used to build the
Preprints (www.preprints.org) | NOT PEER-REVIEWED | Posted: 20 July 2020

10
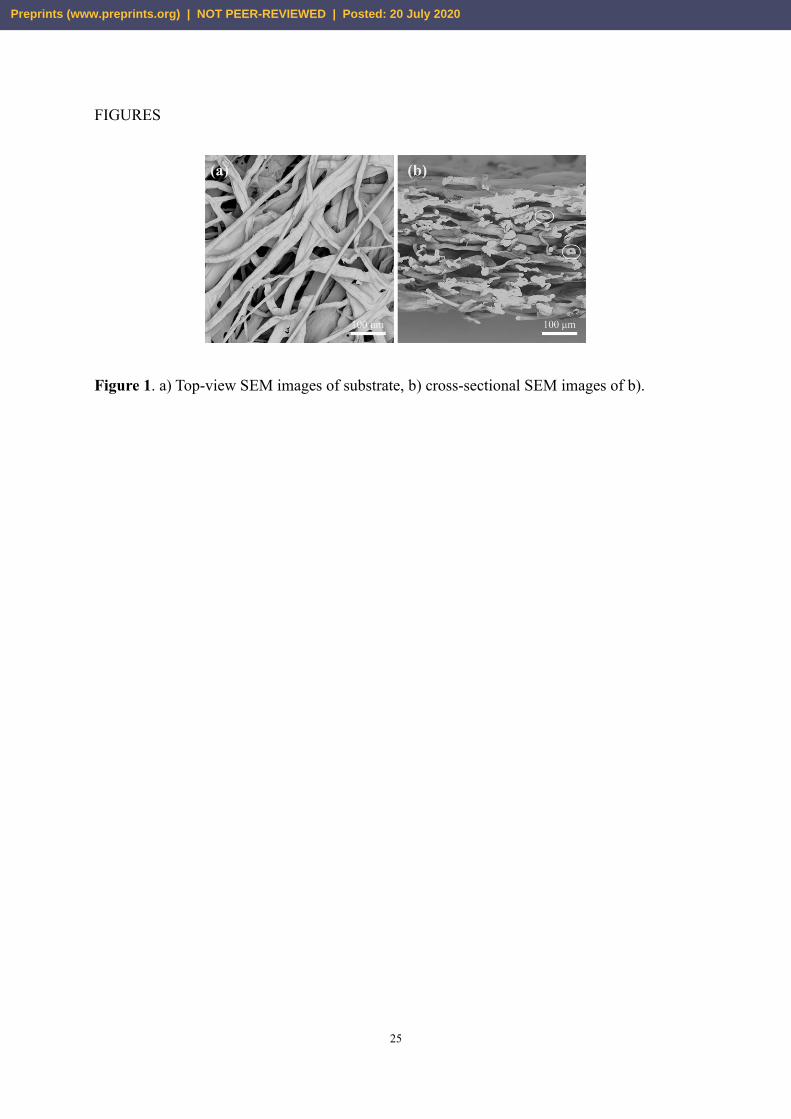
digital structure of the cellulose substrate. Figure 2 showed the reconstruction processes,
including slices acquisition, image processing. Here, the air flow direction was aligned with the
z-axis, while the surface of membrane was defined parallel to the x-y plane. The slices
acquisition was conducted by using a tomography instrument (RX Solution Easy Tom XL)
equipped with 160 kV and 230 kV X-ray sources. The tube with 40 kV was used for electrons
striking to produce the X-ray cone beam in this study, and the tube current was 160 μA. Raw
X-ray digital images were captured by a high resolution and high-speed CCD detector. The
distance between the X-ray source and specimen was 7.10876 mm, and the X-ray source to
detector distance was 610.649 mm. The frame rate of the imager was 1 fps. After being filtered
by a Tukey window, 1352 slices taken in the vertical (x-z) plane with 1845×1845 voxels were
obtained as shown in Figure 2a, and the effective voxel size was 1.4785 μm. Then the slices
were imported to the processGeo module in the GeoDict software package for 3D processing
(Figure 2b). The following procedures were utilized to build the 3D digital structure model: 1)
permute the axis and rotate the images to align the cross-sections and surface of substrate to the
x-z and x-y plane, respectively (Figure 2c); 2) crop the slices to 700×700 voxels to avoid the
edge effects and cut the domain to 225 voxels with 333 μm thickness according to the measured
values (Figure 2d); 3) de-noise the images by using the non-local means filter (Figure 2e-f);
4) segment the images to separate the pore space from solid (Figure 2g). The segmentation was
performed by using the single threshold filter. The threshold value was set according to the peak
position in the gray value map and the measured solidity. The resulting substrate medium was
shown in Figure 2h, PET fibers with smooth surface can be distinguished easily from the
Preprints (www.preprints.org) | NOT PEER-REVIEWED | Posted: 20 July 2020
11
cellulose fibers. The domain size was 700 × 700 ×225 voxels, and the voxel length was 1.4785
μm. In contrast to the digital model from CT slices, a random parametric model based on the
component information provided by the producer and fiber orientation from the analysis of
above structure was created, and the other geometric parameters were the same as those of
reconstructed model from CT data. Specially, the hollow structure of the cellulose fibers (see
Figure 1b) was considered by introducing a parameter called the inner diameter fraction,
defined as the ratio of inner diameter to outer diameter of hollow structural section. The inner
diameter fraction was also used as the fitting parameter to match the pressure drop measured in
experiment. The creation process was similar to our previous work (see supporting Text S1).[37]
3.1.2 NFM model
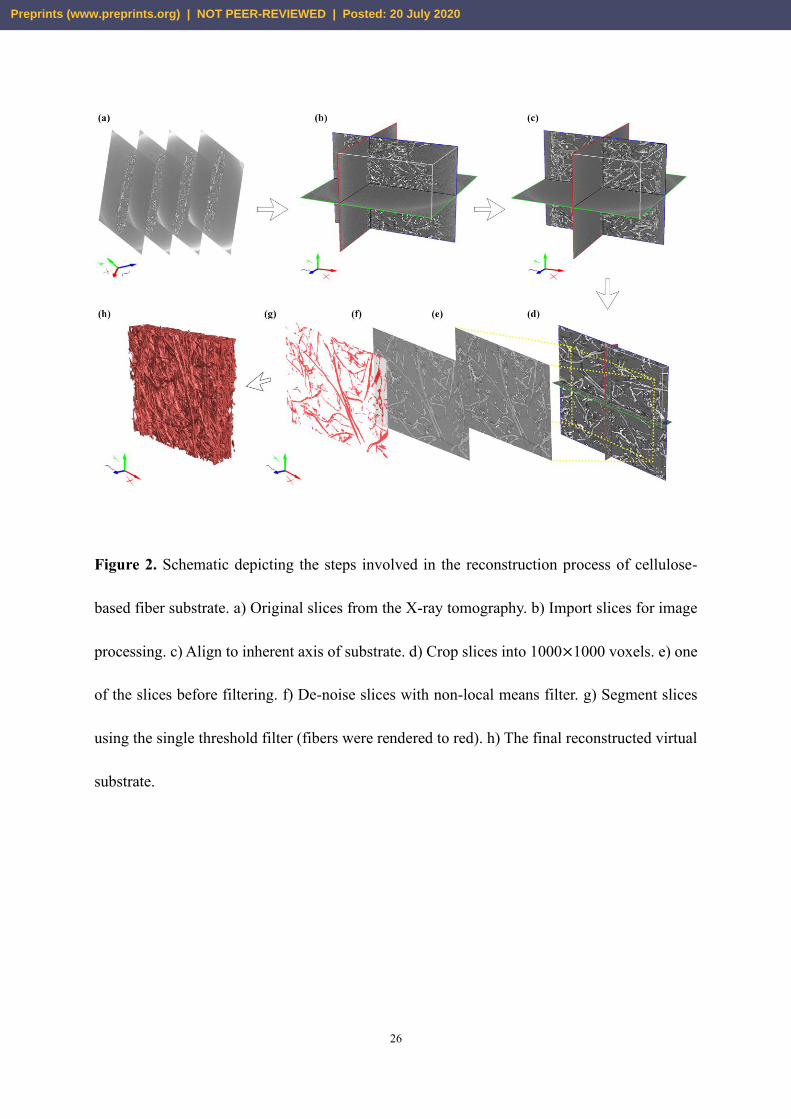
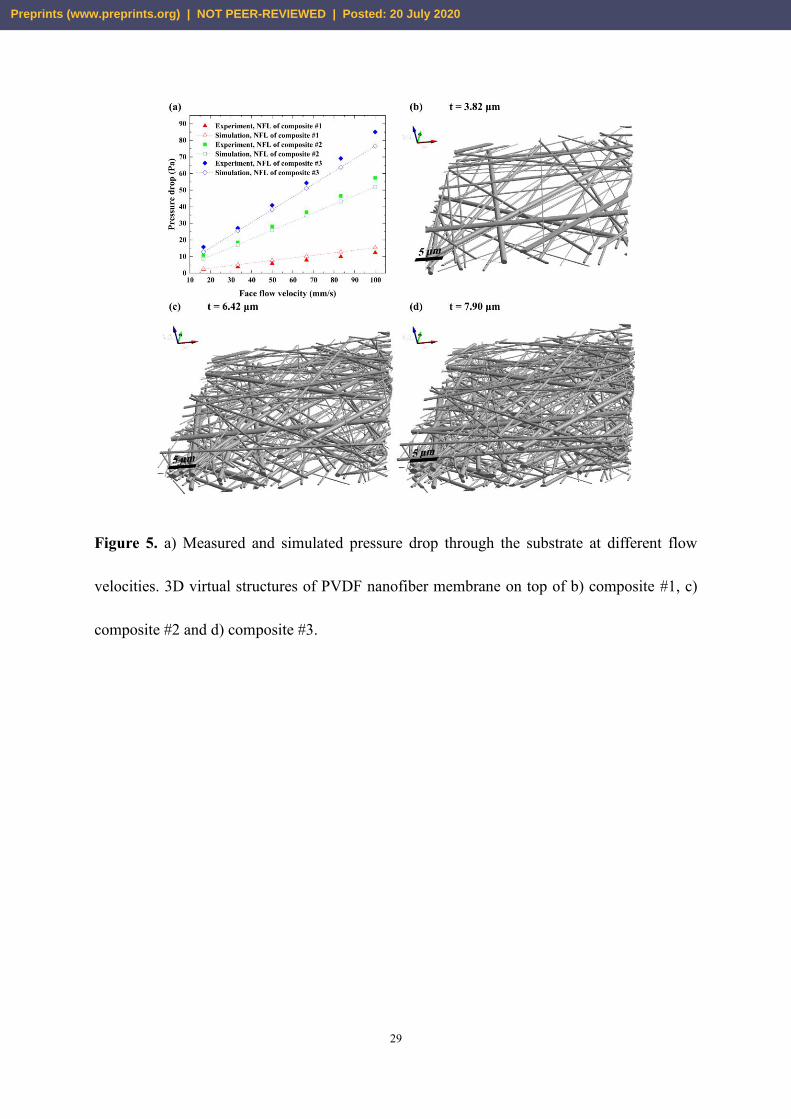
Figure 3a-c showed the surfaces of the NFM on top of the composite #1 to #3. The measured
diameters of the PVDF nanofibers were from 0.130 to 0.891 μm. Since the minimum size of
detectable object in the specimen should be 3 times larger than the resolution of CT instrument,
fibers with diameters around 0.1 μm were too small for imaging.[17] Moreover, the PVDF
nanofibers were almost straight and much more regular than cellulose fibers in morphology.
Therefore, a random structure based on the parameters, i.e. fiber size distribution, thickness,
and solidity, was generated to represent the NFM. The log-normal distribution was applied to
simulate the size distribution of nanofibers in the membranes according to the measurements,
and the count median diameter (CMD) and geometric standard deviation (GSD) were 270.65
nm and 1.64, respectively. The cross-sectional SEM images were shown in Figure 3d-f, and
the determined thicknesses of the NFM of composite #1 to #3 were 3.82, 6.42 and 7.90 μm,
Preprints (www.preprints.org) | NOT PEER-REVIEWED | Posted: 20 July 2020
12
respectively. It should be noted that the nanofiber model was created based on the assumptions:
(a) nanofibers were assumed as straight cylinders; (b) fibers were distributed isotropically in
the x-y plane and stacked uniformly in the through-plane direction; (c) fibers were allowed to
intersect with each other. The sizes of the NFMs of composite #1 to #3 were 700×700×77,
700×700×129 and 700×700×158 voxels, respectively. The voxel size was 50nm. Three repeat
structure models were created for each case by changing the random seed to adjust the inner
structure.
3.1.3 Composite model
Since the created digital structures, both for substrate and NFM, were voxel-based models, the
voxel size of them need to be unified for assembling. To balance the computation cost and
simulation accuracy (see Figure S2), four substructures with a domain size of 100×100×225
voxels were cut from the reconstructed substrate from CT slices. Then the voxel length of each
substructure was refined from 1.4785 μm to 105.607 nm, i.e., each original voxel was divided
into 14×14×14 grids. The domain of each substructure was turned into 1400×1400×3150 voxels.
The composite filter media were generated by putting the NFM with the same surface area and
voxel size on the rescaled substrate. Note that, up to this step, the voxels constituting the virtual
fiber structures were considered as solid, and the other voxels were treated as empty, and these
digital composite media were noted as resolved models. In contrast, the unresolved composite
models were created, where the detailed structure of NFM was ignored and replaced by a porous
jump plane composed of porous voxels, which were simplified computational grids
representing the average properties of the NFM. The virtual substrates were still from the CT
Preprints (www.preprints.org) | NOT PEER-REVIEWED | Posted: 20 July 2020
13
slices. The porous jump plane was modelled as a homogeneous material with given thickness
and permeability from experiments, and the pass-through model (the details to be discussed)
was used for describing the probability that a particle passed through the filter media. The
domain size of the unresolved model for the entire composite was 700×700×226 voxels, and
the voxel size was the same with the reconstructed substrate, which was 1.4785μm.
3.2 Numerical simulation
3.2.1 Air flow
A well-known integrated software package GeoDict (Math2Market, Germany) was used in this
study for the air flow and particle filtration process simulations. The fluid inside the virtual
structures was assumed viscous, incompressible and steady. Conservation equations of mass
(continuity equation) and momentum (Navier-Stokes equation) governing fluid flow in
differential form can be given as follows:
0v = (3)
2( )v v p v f = − + + (4)
where is the fluid density, v was the flow velocity, p is the pressure, was the fluid
density, and f was a force density. In the case of fibrous filter media considered here, the
Reynold number was sufficient small (Re << 1), the conservation momenta can be simplified
into Stokes equation as Equation 5:
u p f− + = (5)
Preprints (www.preprints.org) | NOT PEER-REVIEWED | Posted: 20 July 2020
14
The slip effect around the nanofibers was also considered. In this work, the Knudsen number
(Kn) was 0.21, indicating that the air flow around the nanofibers was mainly in the slip or early
transition flow regime ( 0.1 0.4Kn ). Kirsch et al. stated the slip model may be applied up
to Kn ~1. [38] Thus, the rarefaction effect along the nanofibers could be described as a finite
partial slip using Maxwell’s velocity slip as Equation 6.[39]
2 vw
v
vv
n
− =
(6)
where wv was the tangential velocity of the flow at the wall, v was the tangential
momentum accommodation coefficient, which was taken as unity here,[24] was the mean
free path of air molecules and it was 66 nm, and v
n
was the strain rate in the normal direction.
The standard LIR (left-identity-right) solver of Geodict, using a very memory efficient adaptive
grid structure, was employed to solve the partial differential equations describing the fluid
dynamics.[40] The error bound stopping criterion was set to 0.01. The configurations of
boundary conditions were shown in Figure S3. Periodic boundary conditions were applied for
the inlet, outlet and boundaries parallel to the flow directions. An implicit in-flow and an out-
flow region were added, which were both 200 voxels thick, to avoid the flow channel closure.
3.2.2 Particle transport
The movement of the particle during the filtration process was simulated by using Lagrangian
Particle Tracking method. The dispersed two-phase flow was assumed to be dilute, i.e. the
distance between the particles in the air was large enough to ignore the particle-particle
Preprints (www.preprints.org) | NOT PEER-REVIEWED | Posted: 20 July 2020
15
collisions, and the flowing particles have no effect on the flow. The sodium chloride particles
were simplified into spherical particles, and the motion of each particle was influenced by the
combination of the fluid drag force and Brownian motion. Then the trajectory of each particle
can be obtained by solving the equations as follows:
B2k T ( )3 ( )
p
a p
du D dW tm u u
Cc dtdt
= − + (7)
p
p
dxu
dt= (8)
where m was the particle mass (kg), au was the air flow velocity (m/s), pu was the particle
velocity (m/s), D was the particle diameter (m), Bk was the Boltzmann constant (J/K), T was
the temperature (K), was the friction coefficient, dW was 3D Wiener measure (√s),
responsible for the continuous-time stochastic process. As the diameters of NaCl particles we
investigated were down to nanoscale, the slip condition was needed. Cc was the Cunningham
slip corrections factor which can be given as Equation 9.[41]
0.39
1 (2.34 1.05 )D
Cc eD
−
= + + (9)
The computation domain and boundary condition configurations for particle transport were the
same as those in the air flow simulation. the particle initial position was located in the added
inflow region, which was 1 micron downstream from the inlet, to avoid escaping particles
across the inlet due to Brownian motion. The diameters of the simulated particle were in the
range of 10-1000 nm, and 1000 particles of each diameter were tracked during the filtration
Preprints (www.preprints.org) | NOT PEER-REVIEWED | Posted: 20 July 2020
16
process. For the simulation of resolved models, particles were assumed captured after first
touching the fibers both in the NFM and substrate, while for the unresolved composite models,
the pass-through model was used for the porous jump NFM and the ‘Caught on first touch’
collision model was used for solid phases in the substrate. In terms of the pass-through model,
whether a particle was captured relied on the pass-through probability of the passed voxel, and
the distance covered in these voxels.[42] Thus, the probability p(l) for a particle to travel a
distance without getting captured can be written as
( ) = (1- ) NL
l
t
NLp l E (10)
where l was the displacement of the particle, tNL was the thickness of the NFM. The details of
configured parameters in the particle filtration simulation were listed in Table 2.
4. Results and discussions
4.1 Structure and air flow characteristics
After 3D image data from X-ray CT were converted into the digital structure, the validation of
these material models was conducted. The substrate model was characterised and compared to
the actual material. Figure 4a(i) was the surface SEM image, and the surface morphology of
the reconstructed substrate was shown as Figure 4a(ii). Fibers consisting the virtual structure
were rendered black and the depth of field was expanded to make more fibers visible. Since the
cylindrical PET fibers were easily identified from the cellulose fibers, the diameters of them
were determined, and then compared with the measurements from SEM images. The mean
diameters of PET fibers in physical and digital structures were respectively 11.05 and 11.09 μm.
Preprints (www.preprints.org) | NOT PEER-REVIEWED | Posted: 20 July 2020
17
The excellent agreement revealed that there was no significant geometric distortion during the
reconstruction process. Also, the solidity distributions in the reconstructed substrate were
analysed. The solidity of a structure model was defined as the number of voxels counted inside
the solid structure to the total voxels in the domain. The solidities on the slices normal to the y
direction was shown in Figure 4b. The black curve showed the solidity oscillation, while the
red part was one of the slices parallel to the y direction. The solidity values fluctuated in the
range of 21.5% to 31.20%, and the average value was 26.10%, which agreed well with the
measured results (26.63%). The oscillation in solidity could be attributed to the structural
heterogeneity of the substrate.[43] Figure 4c showed the random parametric substrate model.
The red cylinders represented PET fibers, while the curved green and yellow objects with
hollow structure represented two types of cellulose fibers in the actual substrate.
Figure 4d compared the measured and simulated pressure drops across the substrate at different
face velocities from 16.67 to 100 mm/s. As in the air flow simulation process, the Stokes
equation was used to simulate the flow filed, leading to the linear relation between the pressure
drop and the surface velocity. The pressure drop from experiments was in agreement with the
simulated results. Then the inherent permeability k was derived by applying Darcy’s law
expressed as Equation 11.
sPkv
t
−= (11)
where v was the face velocity; sP was the pressure drop; t was the thickness of the media.
The permeabilities of the actual filter media, digital model from the CT slices and geometric
Preprints (www.preprints.org) | NOT PEER-REVIEWED | Posted: 20 July 2020

18
parameters were respectively 1.47×10⁻¹¹, 1.57×10⁻¹¹ and 1.50×10⁻¹¹ m2. It revealed that the
porous structures of digital models were nearly the same with the actual media. Figure 4e
presented the velocity magnitude inside the digital substrate from CT slices at the flow velocity
of 5.35 cm/s. The porous structure inside the substrate formed the flow channels for the air
passing through the substrate, and the uneven pore sizes led to the inhomogeneously distributed
flow velocities.
Before the simulation of air flow inside the NFMs, the first order Maxwell model used at the
surface of fibers were evaluated (see supporting Text S2 for detailed discussions). The
simulated pressure drops with no slip and slip boundary conditions were also compared and
showed in Figure S4c. As expected, the simulated pressure drops of substrate with slip and no-
slip boundary conditions were in good agreement because the Kn was close to 0, while the
pressure drops across the NFMs using slip boundary condition were much lower than using no-
slip boundary condition.
The comparisons of pressure drop vs. face velocity curves of the NFMs from experiments and
simulations were shown in Figure 5a. Since the input solidity was tuned to fit the pressure drop
measurement results, the pressure drops from simulations agreed well with the experimental
results. The derived solidity values of the NFMs corresponding to composite #1 to #3 were
respectively 4.1 %, 6.25% and 7%. Figure 5b-d showed the final 3D digital structures of the
NFMs, the thickness of the virtual NFM increased with the electrospinning duration.
4.2 Particle filtration efficiency
Preprints (www.preprints.org) | NOT PEER-REVIEWED | Posted: 20 July 2020
19
The initial filtration efficiencies of the filter media for the sodium chloride particles from 10 to
1000 nm with a face velocity of 5.35 cm/s were simulated using the reconstructed digital
structure models (modelling process to be discussed in the experimental section and numerical
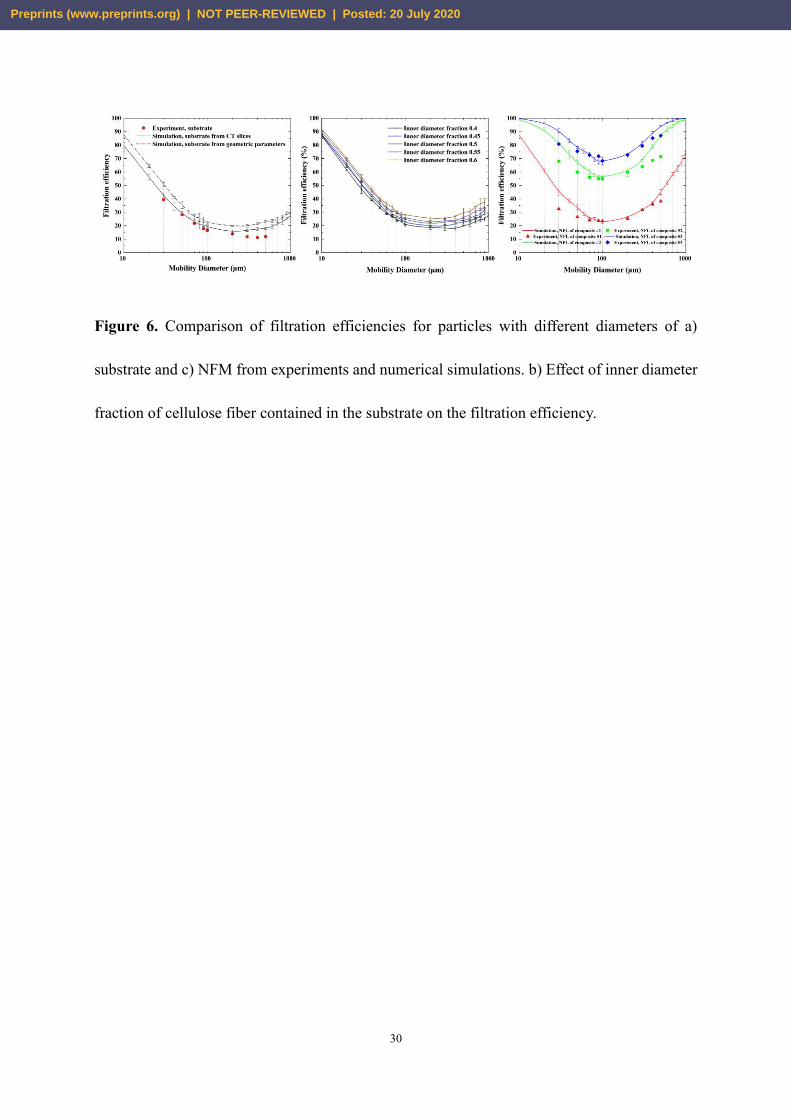
models), with the same conditions of the experimental tests. Figure 6a compared the simulated
filtration efficiencies of the substrate models from CT slices and geometric parameters with the
experimental results. The trends of the simulated results agreed well with the experimental
values. Good agreement was observed for particles smaller than 300 nm, while for particles
larger than 300 nm, simulated efficiencies were slightly higher than the experimental values.
This discrepancy can be related to ignoring the re-entrainment influence for larger particles in
the numerical simulation.[44] The predicted values from parametric substrate models were
higher than those from CT slices-based substrate, which may be caused by the insufficient
ability of the idealized parametric models to consider the heterogeneity in the actual material.[43]
But the parametric models were convenient for the design of the filter media by adjusting the
input parameters such as diameter and length of fibers. As shown in Figure 6b, the effect of
hollow cellulose fibers on the filtration efficiency of substrate was studied. The increase in the
inner diameter fraction of cellulose fibers led to the improvement of filtration efficiency. For a
fixed solidity, the amount of fibers contained in the structures increased with the increase of
inner diameter fraction of fibers, resulting in the increased effective filtration area.
The simulated filtration efficiencies of the NFMs were shown in Figure 6c and compared with
the corresponding experimental results. The filtration efficiencies of the NFMs from
experiments were estimated based on the determined filtration efficiencies of the whole
Preprints (www.preprints.org) | NOT PEER-REVIEWED | Posted: 20 July 2020
20
composite filter media (Etotal) and the substrate (Es) using the relation shown as Equation 12 [29]
11
1
totalNL
s
EE
E
−= −
− (12)
The simulated results showed that the filtration efficiencies increased with the electrospinning
durations from 1.0 to 2.0 h, which were consistent with the experimental values. As shown in
Figure 6c, the MMPS of the three NFMs were all in the range of 100-200 nm at face velocity
of 5.35 cm/s. For particle sizes in the range of 70-400 nm including the MPPS, the simulated
efficiencies agreed well with the measured values. It is also noted that the simulated efficiency
curves started to deviate from the measured values when the particle sizes were smaller than 70
nm or lager than 400 nm. The slight over-predictions for the large particle sizes may be related
to omission of effects from particle re-entrainment and particle rebound.[45,46] The minor over-
predictions at small particle size range could be caused by the assumption of Equation 12 that
the NFM and the substrate act independently during the filtration process. Due to the large
diffusion coefficients of small particles (<70 nm) and the wide effective range of the diffusion
mechanism, the filtration of small particles by the NFM and substrate may not be considered as
independent.[29]
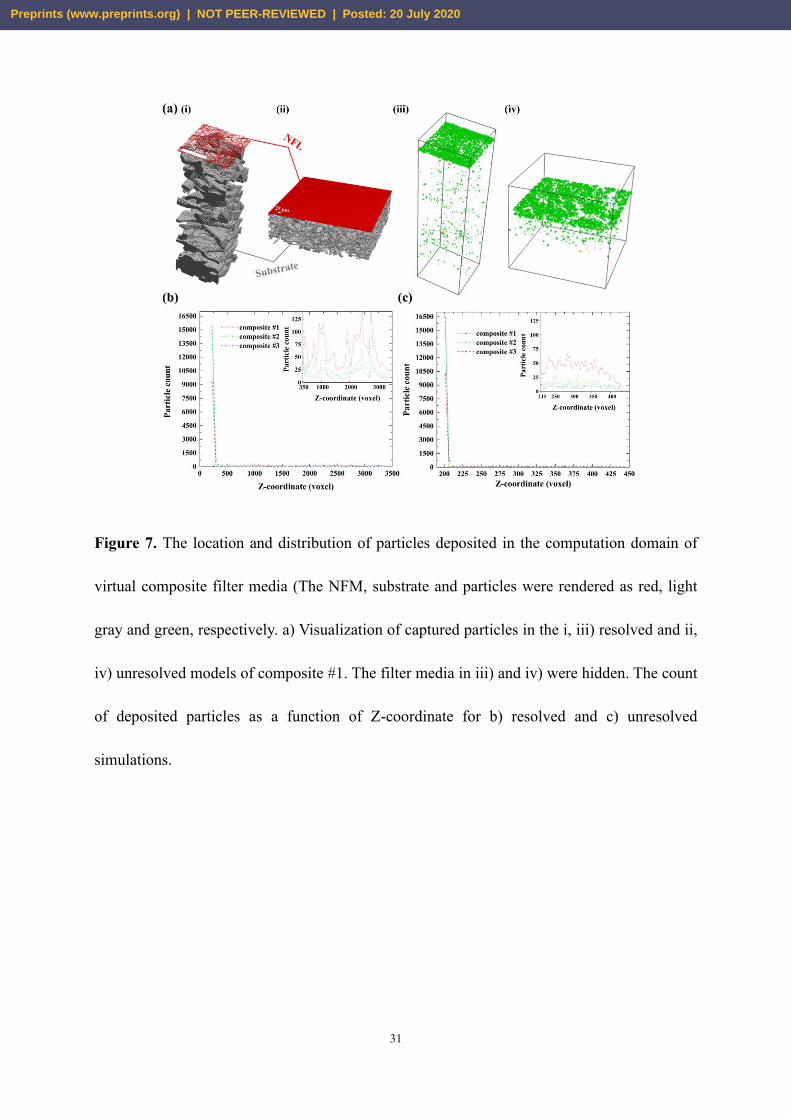
The resolved model and unresolved model corresponding to composite #1 were shown in
Figure 7a(i, ii), respectively. The NFMs were rendered as red and located on the substrates,
which were comprised of gray cellulose fibers. In the resolved composite model, the PVDF
nanofiber and pore structure can be clearly observed, while there was no detailed structure
inside the NFM for the unresolved cases. The filtration efficiencies of these structures were
Preprints (www.preprints.org) | NOT PEER-REVIEWED | Posted: 20 July 2020
21
simulated separately. The particle movements during the filtration process were tracked and
visualization of the captured particles was displayed in Figure 7a(iii) and a(iv). It should be
noted that the input filtration efficiencies for particles with different diameters used in the
porous jump NFMs were from simulated results shown in Figure 6c. The sizes of the deposited
particles shown in the figures were enlarged for easy visualization. For the composite filter
media, most of the sodium chloride particles were captured by the NFM. As the filtration
process progressed, part of the particles passing through the NFM deposited continuously on
the fibers of substrate. The digital structures and deposited particles distribution of composite
#2 and composite #3 can be seen in Figure S5. Furthermore, Figure 7b, c showed the statistical
summary of the number of deposited particles in the three composite filter media as a function
of Z-coordinate for resolved and unresolved models, respectively. With longer electrospinning
duration, more PVDF nanofibers were stacked on the substrate, leading to the increase in
number of particles filtered by the NFM, which meant the improved total filtration efficiency
of composite filter media. Then the number of particles passing through the NFM and deposited
on the macro-scale fibers decreased (subplots on the right corner). The red curve representing
the number of deposited particles in the substrate of composite #1 was higher than the other
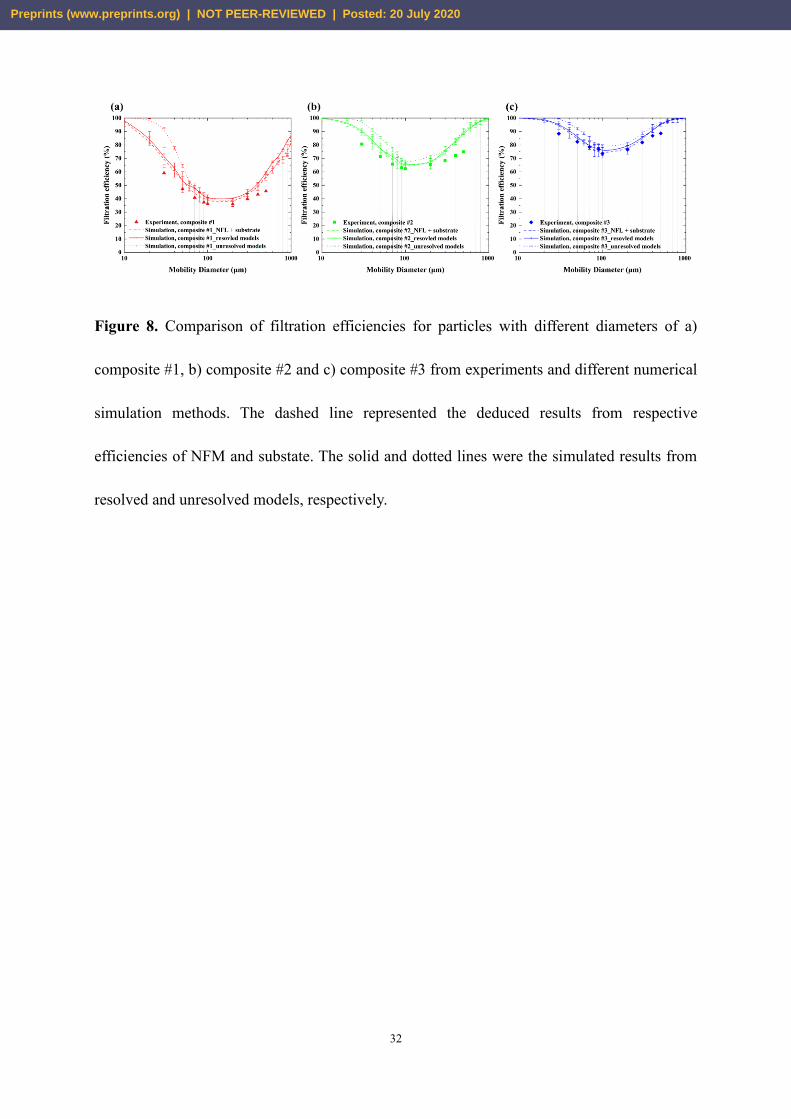
two cases. The comparison among the filtration efficiencies of the three composite media
obtained from experiments and numerical simulation was presented in Figure 8a-c, respectively.
Consistent with the statistical summary of the total captured particles, the filtration efficiencies
of composite #3 were higher than those of composite #2 and composite #1 due to the thicker
PVDF nanofiber membrane. The trends of simulated results from both resolved models or
Preprints (www.preprints.org) | NOT PEER-REVIEWED | Posted: 20 July 2020

22
unresolved models were in good agreement with the tested values. In terms of resolved
composite models, the simulated filtration efficiency vs. particle diameter curves agreed well
with the experimental results for 70-400 nm particles. For large particle size (500 nm) or small
particle sizes (<70 nm), the discrepancy appeared. One of the reasons was the accumulation of
over-predictions from the NFM and substrate as we mentioned before. Another possible reason
can be related to the inhomogeneity at the interface of NFM and substrate. In the early stage of
the electrospinning process, the solidities or fiber sizes of the NFM in the gaps and on the
surface of macro-scale fibers contained in the substrate could be inhomogeneous. This could
cause the over-prediction of simulation results. On the other hand, the simulated efficiencies of
the unresolved cases were higher than resolved models, especially for particles with small sizes.
That was because in the pass-through model used in the porous jump NFMs, the probability
that a particle traveled in the membrane without getting captured was assumed as the set
penetration as long as the displacement of this particle equaled the thickness of membrane.
However, since the effect of Brownian motion on small particles was strong, the path lengths
of these particles would be larger than the thickness, which could lead to the discrepancy. But
for unresolved simulations, the computation time were much shorter than resolved simulations
(see Table 3), which meant it could be an excellent choice for some time-consuming simulation
e.g. particle loading process. In addition, the calculated filtration efficiencies by using Equation
12 with the simulated values of NFMs and substrate were compared with the above results from
complete composite filter media. The good agreement between them depicted that the total
filtration efficiency of the multi-layer filter media could also be evaluated based on the
Preprints (www.preprints.org) | NOT PEER-REVIEWED | Posted: 20 July 2020
23
respective efficiencies of each layer, when the simulation for the complete structure was hardly
achieved.
5. Conclusion
In this work, the pressure drop and the particle filtration characteristics of dual layer filter media
composed of a nanofiber membrane layered on the substrate were investigated with
experimental and simulation methods. The composite filter media with three different
thicknesses of nanofiber membrane were respectively prepared by fabricating PVDF nanofibers
on the substrate with electrospinning method, and then the structure properties (i.e. solidity of
substrate, thickness and fiber diameter distribution) and particle filtration performance for
sodium chloride particles in the range of 30-500 nm were experimentally investigated. The
digital models for the structures of substrate and nanofiber membranes were created separately,
and thencombined to form the composite filter media. The digital model of the substrate
containing cellulose and PET fibers with dozens of micron diameter was reconstructed from
the slices obtained from an X-ray tomography with sub-micron spatial resolution. The solidity,
permeability and average PET fiber size of the reconstructed substrate were 26.10%, 1.57e-
11m2 and 11.09 μm, which were in good agreement with the results from experiments. The
digital structure model for the nanofiber membrane was generated based on the geometric
parameters obtained from the surface and cross-sectional SEM images. Specially, the solidity
was configured by fitting the simulated pressure drops at face velocity from 16.67 to 100 mm/s
with the measured values. Then the air flow and particle transport simulations of nanofiber
membranes, substrate, resolved and unresolved composite structures were separately conducted.
Preprints (www.preprints.org) | NOT PEER-REVIEWED | Posted: 20 July 2020

24
The filtration efficiencies of composite filter media were improved by increasing the
electrospinning duration. The simulated filtration efficiency vs. particle diameter curves of the
composite filter media agreed well with the experimental results for particle diameter in the
range from to 70 to 400 nm. For particles with diameters smaller than 70 nm or larger than 400
nm, the simulated efficiencies were slightly higher than measured results. Results from the
resolved models showed higher accuracy than the unresolved models. At the same time, the
computational times of the resolved cases were much longer than the unresolved cases.
This work explored the feasibility of creating composite filter media containing multi-scale
fibers. Based on these generated structures, more studies such as dynamic evolution of the
microstructure and the macroscopic filtration characteristics in the long-time particle loading
process, the effect of nonuniform charge distribution will be carried out in the future.
Preprints (www.preprints.org) | NOT PEER-REVIEWED | Posted: 20 July 2020
25
FIGURES
Figure 1. a) Top-view SEM images of substrate, b) cross-sectional SEM images of b).
Preprints (www.preprints.org) | NOT PEER-REVIEWED | Posted: 20 July 2020
26
Figure 2. Schematic depicting the steps involved in the reconstruction process of cellulose-
based fiber substrate. a) Original slices from the X-ray tomography. b) Import slices for image
processing. c) Align to inherent axis of substrate. d) Crop slices into 1000×1000 voxels. e) one
of the slices before filtering. f) De-noise slices with non-local means filter. g) Segment slices
using the single threshold filter (fibers were rendered to red). h) The final reconstructed virtual
substrate.
Preprints (www.preprints.org) | NOT PEER-REVIEWED | Posted: 20 July 2020
27
Figure 3. Top-view SEM images of a) the NFM of Composite #1 (1.0h), b) Composite #2 (1.5h),
c) Composite #3 (2.0h); cross-sectional SEM images of d) the NFM of Composite #1, e)
Composite #2, f) Composite #3.
Preprints (www.preprints.org) | NOT PEER-REVIEWED | Posted: 20 July 2020

28
Figure 4. Verification of virtual cellulose fiber-based substrate. Top–view SEM image of a(i)
the substrate medium and a(ii) reconstructed substrate from CT slices. b) SVF distribution of
reconstructed substrate from CT slices. c) Virtual substrate generated based on the geometric
parameters. d) Measured and simulated pressure drop through the substrate at different flow
velocities. e) Velocity field for air flow through the reconstructed substrate from CT slices at a
given flow velocity of 5.35 cm/s.
Preprints (www.preprints.org) | NOT PEER-REVIEWED | Posted: 20 July 2020
29
Figure 5. a) Measured and simulated pressure drop through the substrate at different flow
velocities. 3D virtual structures of PVDF nanofiber membrane on top of b) composite #1, c)
composite #2 and d) composite #3.
Preprints (www.preprints.org) | NOT PEER-REVIEWED | Posted: 20 July 2020
30
Figure 6. Comparison of filtration efficiencies for particles with different diameters of a)
substrate and c) NFM from experiments and numerical simulations. b) Effect of inner diameter
fraction of cellulose fiber contained in the substrate on the filtration efficiency.
Preprints (www.preprints.org) | NOT PEER-REVIEWED | Posted: 20 July 2020
31
Figure 7. The location and distribution of particles deposited in the computation domain of
virtual composite filter media (The NFM, substrate and particles were rendered as red, light
gray and green, respectively. a) Visualization of captured particles in the i, iii) resolved and ii,
iv) unresolved models of composite #1. The filter media in iii) and iv) were hidden. The count
of deposited particles as a function of Z-coordinate for b) resolved and c) unresolved
simulations.
Preprints (www.preprints.org) | NOT PEER-REVIEWED | Posted: 20 July 2020
32
Figure 8. Comparison of filtration efficiencies for particles with different diameters of a)
composite #1, b) composite #2 and c) composite #3 from experiments and different numerical
simulation methods. The dashed line represented the deduced results from respective
efficiencies of NFM and substate. The solid and dotted lines were the simulated results from
resolved and unresolved models, respectively.
Preprints (www.preprints.org) | NOT PEER-REVIEWED | Posted: 20 July 2020
33
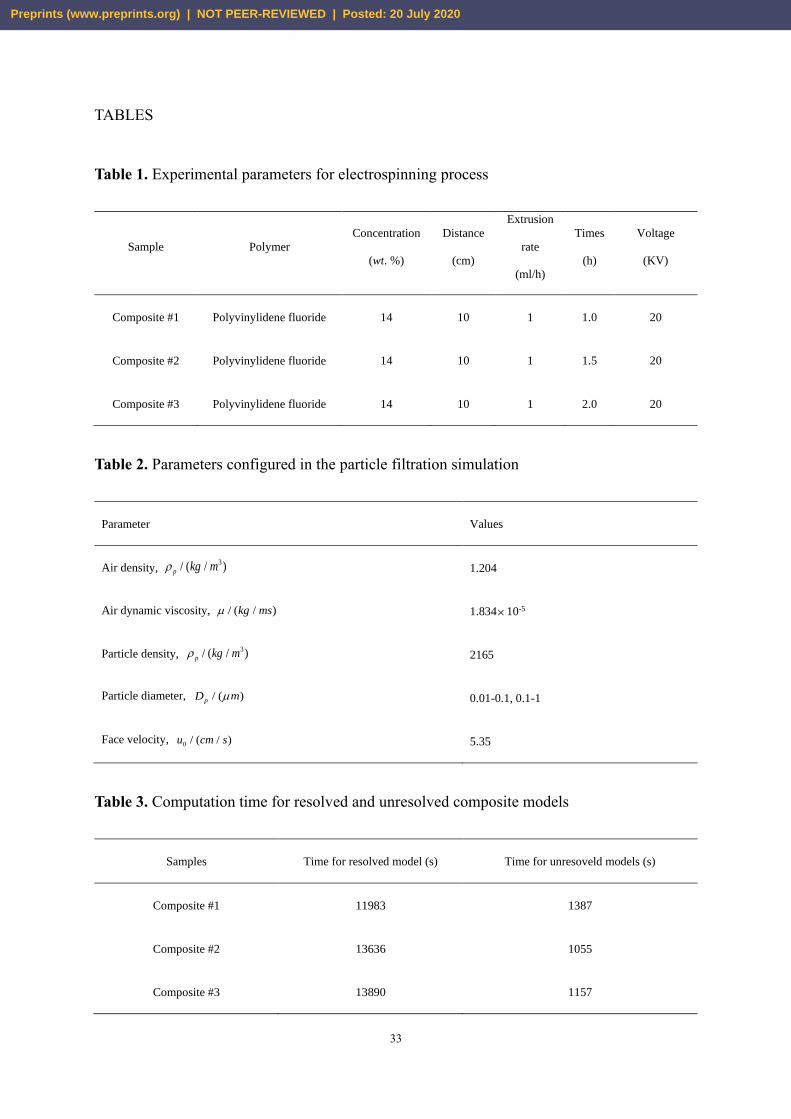
TABLES
Table 1. Experimental parameters for electrospinning process
Sample Polymer
Concentration
(wt. %)
Distance
(cm)
Extrusion
rate
(ml/h)
Times
(h)
Voltage
(KV)
Composite #1 Polyvinylidene fluoride 14 10 1 1.0 20
Composite #2 Polyvinylidene fluoride 14 10 1 1.5 20
Composite #3 Polyvinylidene fluoride 14 10 1 2.0 20
Table 2. Parameters configured in the particle filtration simulation
Parameter Values
Air density, 3/ ( / )p kg m 1.204
Air dynamic viscosity, / ( / )kg ms 1.83410-5
Particle density, 3/ ( / )p kg m 2165
Particle diameter, / ( )pD m 0.01-0.1, 0.1-1
Face velocity, 0 / ( / )u cm s 5.35
Table 3. Computation time for resolved and unresolved composite models
Samples Time for resolved model (s) Time for unresoveld models (s)
Composite #1 11983 1387
Composite #2 13636 1055
Composite #3 13890 1157
Preprints (www.preprints.org) | NOT PEER-REVIEWED | Posted: 20 July 2020

34
Supporting Information
Supporting Information is available from the Wiley Online Library or from the author.
Acknowledgements
This work was supported by the National Key R&D Program of China (2017YFB0308000).
The authors gratefully acknowledge these supports. Z, P thanks Dr. Zboray Robert (Center for
X-ray Analytics, Empa) for the X-ray tomography measurements. The work was partially
supported by Innosuisse project 46668.1 IP-ENG “ReMask: Strategies for innovations for
Swiss masks needed in pandemic situations” and Center for Filtration Research at University
of Minnesota.
References
[1] Munster, V. J., Koopmans, M., van Doremalen, N., van Riel, D., & de Wit, E. (2020). A
novel coronavirus emerging in China—key questions for impact assessment. New England
Journal of Medicine, 382(8), 692-694.
[2] Bennett, A. (2010). Air filtration: Innovations in industrial air filtration. Filtration &
Separation, 47(4), 20-23.
[3] Liu, C., Hsu, P. C., Lee, H. W., Ye, M., Zheng, G., Liu, N., ... & Cui, Y. (2015). Transparent
air filter for high-efficiency PM 2.5 capture. Nature communications, 6(1), 1-9.
[4] Pope Iii, C. A., Burnett, R. T., Thun, M. J., Calle, E. E., Krewski, D., Ito, K., & Thurston,
G. D. (2002). Lung cancer, cardiopulmonary mortality, and long-term exposure to fine
particulate air pollution. Jama, 287(9), 1132-1141.
[5] Barhate, R. S., & Ramakrishna, S. (2007). Nanofibrous filtering media: filtration problems
and solutions from tiny materials. Journal of membrane science, 296(1-2), 1-8.
[6] Hassan, M. A., Yeom, B. Y., Wilkie, A., Pourdeyhimi, B., & Khan, S. A. (2013). Fabrication
of nanofiber meltblown membranes and their filtration properties. Journal of membrane science,
Preprints (www.preprints.org) | NOT PEER-REVIEWED | Posted: 20 July 2020

35
427, 336-344.
[7] Li, J., Zhang, D., Yang, T., Yang, S., Yang, X., & Zhu, H. (2018). Nanofibrous membrane
of graphene oxide-in-polyacrylonitrile composite with low filtration resistance for the effective
capture of PM2. 5. Journal of Membrane Science, 551, 85-92.
[8] Gao, H., He, W., Zhao, Y. B., Opris, D. M., Xu, G., & Wang, J. (2020). Electret mechanisms
and kinetics of electrospun nanofiber membranes and lifetime in filtration applications in
comparison with corona-charged membranes. Journal of Membrane Science, 600, 117879.
[9] Song, J., Zhang, B., Lu, Z., Xin, Z., Liu, T., Wei, W., ... & Li, Y. (2019). Hierarchical Porous
Poly (l-lactic acid) Nanofibrous Membrane for Ultrafine Particulate Aerosol Filtration. ACS
applied materials & interfaces, 11(49), 46261-46268.
[10] Hutten I M (2007) Handbook of nonwoven filter media. In: Composite structure. Elsevire:
pp324-325.
[11] Jaganathan, S., Tafreshi, H. V., & Pourdeyhimi, B. (2008). A realistic approach for
modeling permeability of fibrous media: 3-D imaging coupled with CFD simulation. Chemical
Engineering Science, 63(1), 244-252.
[12] Lehmann, M. J., Hardy, E. H., Meyer, J., & Kasper, G. (2005). MRI as a key tool for
understanding and modeling the filtration kinetics of fibrous media. Magnetic resonance
imaging, 23(2), 341-342.
[13] du Roscoat, S. R., Bloch, J. F., & Caulet, P. (2012). A method to quantify the 3D
microstructure of fibrous materials containing mineral fillers using X-ray microtomography:
application to paper materials. Journal of Materials Science, 47(18), 6517-6521.
Preprints (www.preprints.org) | NOT PEER-REVIEWED | Posted: 20 July 2020

36
[14] Lux, J., Ahmadi, A., Gobbé, C., & Delisée, C. (2006). Macroscopic thermal properties of
real fibrous materials: Volume averaging method and 3D image analysis. International Journal
of Heat and Mass Transfer, 49(11-12), 1958-1973.
[15] Schneider, M., Kabel, M., Andrä, H., Lenske, A., Hauptmann, M., Majschak, J. P., ... &
Glatt, E. (2016). Thermal fiber orientation tensors for digital paper physics. International
Journal of Solids and Structures, 100, 234-244.
[16] Viguié, J., Dumont, P. J., Mauret, E., Du Roscoat, S. R., Vacher, P., Desloges, I., & Bloch,
J. F. (2011). Analysis of the hygroexpansion of a lignocellulosic fibrous material by digital
correlation of images obtained by X-ray synchrotron microtomography: application to a folding
box board. Journal of materials science, 46(14), 4756-4769.
[17] du Plessis, A., le Roux, S. G., & Guelpa, A. (2016). The CT Scanner Facility at
Stellenbosch University: an open access X-ray computed tomography laboratory. Nuclear
Instruments and Methods in Physics Research Section B: Beam Interactions with Materials and
Atoms, 384, 42-49.
[18] Douissard, P. A., Cecilia, A., Rochet, X., Chapel, X., Martin, T., van de Kamp, T., ... &
Meinhardt, J. (2012). A versatile indirect detector design for hard X-ray microimaging. Journal
of Instrumentation, 7(09), P09016.
[19] Du Plessis, A., Yadroitsev, I., Yadroitsava, I., & Le Roux, S. G. (2018). X-ray
microcomputed tomography in additive manufacturing: a review of the current technology and
applications. 3D Printing and Additive Manufacturing, 5(3), 227-247.
[20] Cai, R. R., Zhang, L. Z., & Bao, A. B. (2018). PM collection performance of electret filters
Preprints (www.preprints.org) | NOT PEER-REVIEWED | Posted: 20 July 2020
37
electrospun with different dielectric materials-a numerical modeling and experimental study.
Building and Environment, 131, 210-219.
[21] Zhao, X., Li, Y., Hua, T., Jiang, P., Yin, X., Yu, J., & Ding, B. (2017). Low-resistance dual-
purpose air filter releasing negative ions and effectively capturing PM2.5. ACS applied
materials & interfaces, 9(13), 12054-12063.
[22] Sambaer, W., Zatloukal, M., & Kimmer, D. (2011). 3D modeling of filtration process via
polyurethane nanofiber based nonwoven filters prepared by electrospinning process. Chemical
Engineering Science, 66(4), 613-623.
[23] Rebaï, M., Drolet, F., Vidal, D., Vadeiko, I., & Bertrand, F. (2011). A Lattice Boltzmann
approach for predicting the capture efficiency of random fibrous media. Asia‐Pacific Journal
of Chemical Engineering, 6(1), 29-37.
[24] Hosseini, S. A., & Tafreshi, H. V. (2010). Modeling permeability of 3-D nanofiber media
in slip flow regime. Chemical Engineering Science, 65(6), 2249-2254.
[25] Zhang, S., Liu, H., Yin, X., Yu, J., & Ding, B. (2016). Anti-deformed
polyacrylonitrile/polysulfone composite membrane with binary structures for effective air
filtration. ACS applied materials & interfaces, 8(12), 8086-8095.
[26] Zhang, S., Tang, N., Cao, L., Yin, X., Yu, J., & Ding, B. (2016). Highly integrated
polysulfone/polyacrylonitrile/polyamide-6 air filter for multilevel physical sieving airborne
particles. ACS applied materials & interfaces, 8(42), 29062-29072.
[27] Kimmer, D., Vincent, I., Sambaer, W., Zatloukal, M., & Ondracek, J. (2015, April). The
effect of combination electrospun and meltblown filtration materials on their filtration
Preprints (www.preprints.org) | NOT PEER-REVIEWED | Posted: 20 July 2020
38
efficiency. In AIP Conference Proceedings (Vol. 1662, No. 1, p. 050001). AIP Publishing LLC.
[28] Li, P., Wang, C., Zhang, Y., & Wei, F. (2014). Air filtration in the free molecular flow
regime: a review of high‐efficiency particulate air filters based on carbon nanotubes. Small,
10(22), 4543-4561.
[29] Wang, J., Kim, S. C., & Pui, D. Y. (2008). Investigation of the figure of merit for filters
with a single nanofiber layer on a substrate. Journal of Aerosol Science, 39(4), 323-334.
[30] Leung, W. W. F., Hung, C. H., & Yuen, P. T. (2010). Effect of face velocity, nanofiber
packing density and thickness on filtration performance of filters with nanofibers coated on a
substrate. Separation and purification technology, 71(1), 30-37.
[31] Stana‐Kleinschek, K., Strnad, S., & Ribitsch, V. (1999). Surface characterization and
adsorption abilities of cellulose fibers. Polymer Engineering & Science, 39(8), 1412-1424.
[32] Karniadakis, G., Beskok, A., & Aluru, N. (2006). Microflows and nanoflows:
fundamentals and simulation (Vol. 29). Springer Science & Business Media: pp16.
[33] Rueden, C. T., Schindelin, J., Hiner, M. C., DeZonia, B. E., Walter, A. E., Arena, E. T., &
Eliceiri, K. W. (2017). ImageJ2: ImageJ for the next generation of scientific image data. BMC
bioinformatics, 18(1), 529.
[34] Ju, W., Jiang, F., Ma, H., Pan, Z., Zhao, Y. B., Pagani, F., ... & Battaglia, C. (2019).
Electrocatalytic Reduction of Gaseous CO2 to CO on Sn/Cu‐Nanofiber‐Based Gas Diffusion
Electrodes. Advanced Energy Materials, 9(32), 1901514.
[35] Sachinidou, P., Bahk, Y. K., & Wang, J. (2017). An integrative model for the filtration
efficiencies in realistic tests with consideration of the filtration velocity profile and challenging
Preprints (www.preprints.org) | NOT PEER-REVIEWED | Posted: 20 July 2020
39
particle size distribution. Aerosol Science and Technology, 51(2), 178-187.
[36] Wang, J., & Tronville, P. (2014). Toward standardized test methods to determine the
effectiveness of filtration media against airborne nanoparticles. Journal of nanoparticle
research, 16(6), 2417.
[37] Pan, Z., Liang, Y., Tang, M., Sun, Z., Hu, J., & Wang, J. (2019). Simulation of performance
of fibrous filter media composed of cellulose and synthetic fibers. Cellulose, 26(12), 7051-7065.
[38] Kirsch, A. A. (1978). The theory of aerosol filtration with fibrous filters. Fundamentals of
aerosol science.
[39] McNenly, M. J., Gallis, M. A., & Boyd, I. D. (2005). Empirical slip and viscosity model
performance for microscale gas flow. International journal for numerical methods in fluids,
49(11), 1169-1191.
[40] Linden, S., Wiegmann, A., & Hagen, H. (2015). The LIR space partitioning system applied
to the Stokes equations. Graphical Models, 82, 58-66.
[41] Allen, M. D., & Raabe, O. G. (1985). Slip correction measurements of spherical solid
aerosol particles in an improved Millikan apparatus. Aerosol Science and Technology, 4(3),
269-286.
[42] Wiegmann A, Cheng L, Rief S, Latz A, Wagner C, Wersterteiger R (2017). GeoDict user
guide. In: FilterDict, pp 8–9. www.geodict.com.
[43] Gong, J., Stewart, M. L., Zelenyuk, A., Strzelec, A., Viswanathan, S., Rothamer, D. A., ...
& Rutland, C. J. (2018). Importance of filter’s microstructure in dynamic filtration modeling of
gasoline particulate filters (GPFs): Inhomogeneous porosity and pore size distribution.
Preprints (www.preprints.org) | NOT PEER-REVIEWED | Posted: 20 July 2020
40
Chemical Engineering Journal, 338, 15-26.
[44] Cleaver, J. W., & Yates, B. (1976). The effect of re-entrainment on particle deposition.
Chemical Engineering Science, 31(2), 147-151.
[45] Wang, J., Cahyadi, A., Wu, B., Pee, W., Fane, A. G., & Chew, J. W. (2020). The roles of
particles in enhancing membrane filtration: A review. Journal of Membrane Science, 595,
117570.
[46] Xie, J., Dong, M., & Li, S. (2016). Dynamic impact model of plastic deformation between
micro-particles and flat surfaces without adhesion. Aerosol Science and Technology, 50(4), 321-
330.
Preprints (www.preprints.org) | NOT PEER-REVIEWED | Posted: 20 July 2020