Embed Size (px)
Citation preview

Arterial Stiffness: pathophysiology
and clinical impact
Gérard M. LONDON
Manhès Hospital
Fleury-Mérogis/Paris, France
Determinants of vascular overload (afterload) on the heart
Wave
reflection
PeripheralResistance
Inertance
Arterial
Stiffness
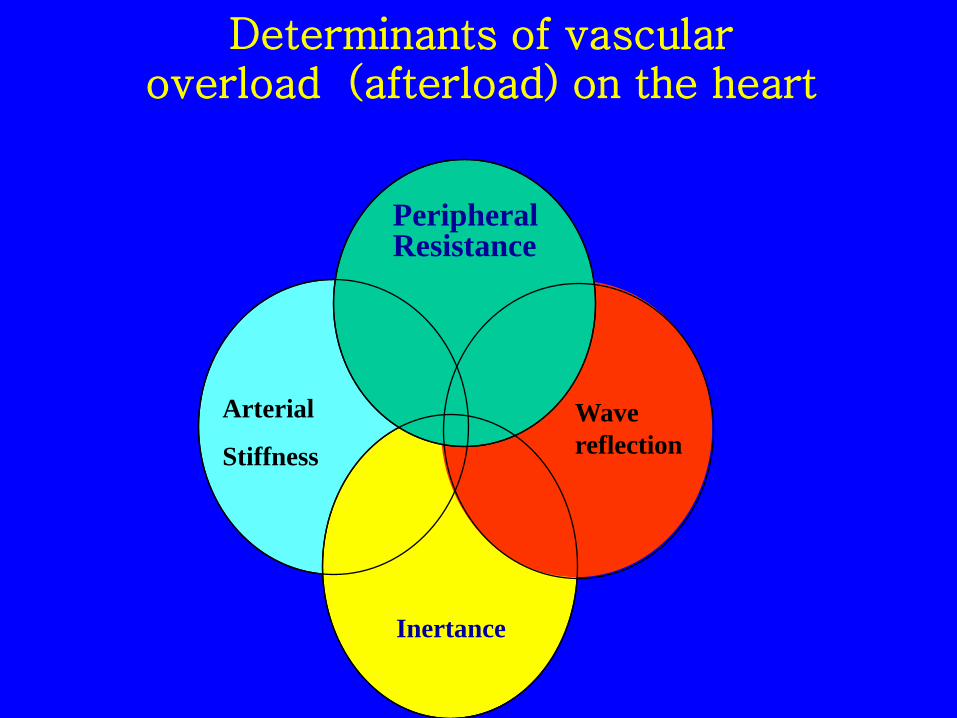
Arterial Impedance as a determinant of afterloadGradients
Aorta
Resistance vessels
Pf
Pb
Pt
Zr - Zc
-Zr -Zc
+
=Reflection
Coefficient
Zc ZR
PWV= Zc
Zc-characteristic impedance
Zr-peripheral resistanceREFLECTION
STIFFNESS
RESISTANCE
ZR
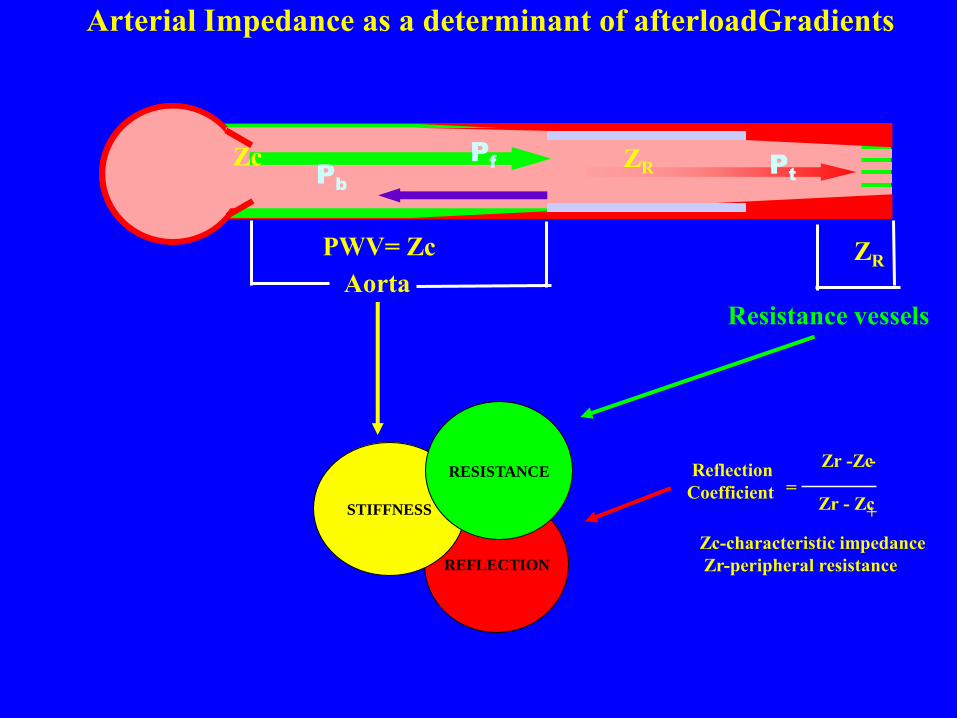
80
140
Mean BP
Pulse pressure
Mean BP: Cardiac output
peripheral resistance
mm
Hg
Pulse pressure: ventricular ejection
arterial stiffness
wave reflection
Systolic pressure
Diastolic pressure
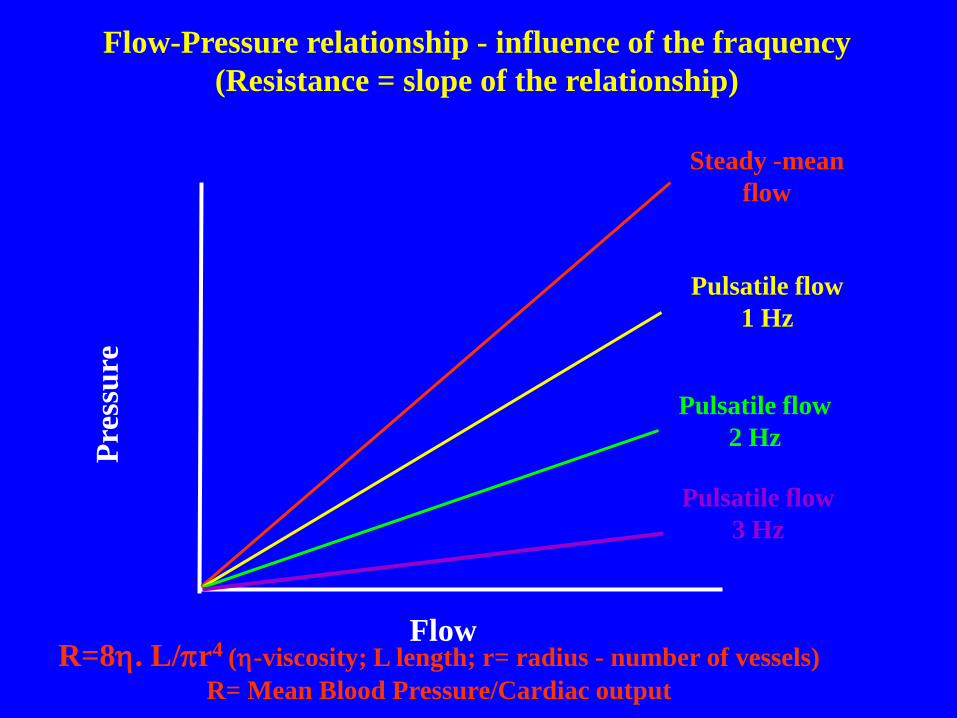
Flow
Pre
ssu
re
Steady -mean
flow
Pulsatile flow
1 Hz
Pulsatile flow
2 Hz
Pulsatile flow
3 Hz
Flow-Pressure relationship - influence of the fraquency
(Resistance = slope of the relationship)
R=8. L/r4 (-viscosity; L length; r= radius - number of vessels)
R= Mean Blood Pressure/Cardiac output
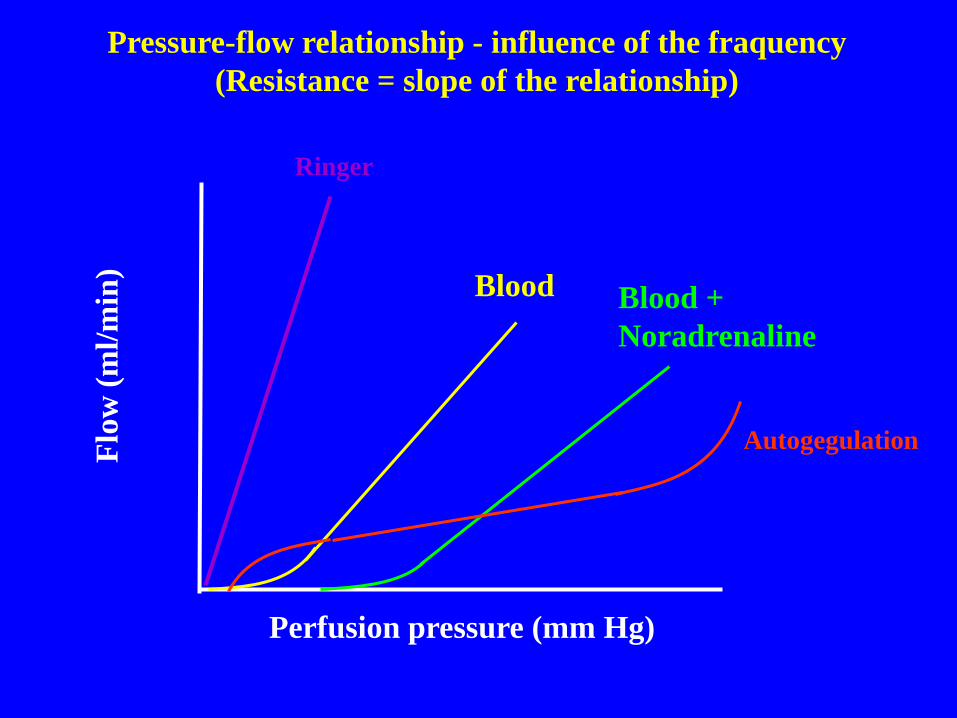
Perfusion pressure (mm Hg)
Flo
w (
ml/
min
)
Pressure-flow relationship - influence of the fraquency
(Resistance = slope of the relationship)
Ringer
Blood Blood +
Noradrenaline
Autogegulation
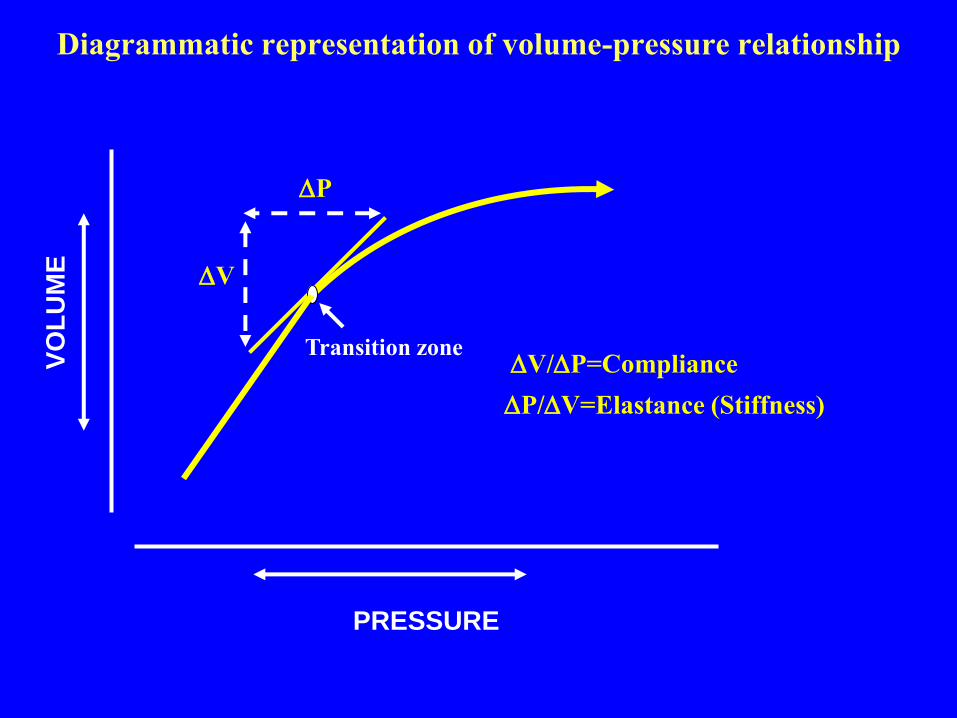
Diagrammatic representation of volume-pressure relationship
PRESSURE
VO
LU
ME
P
V
V/P=Compliance
P/V=Elastance (Stiffness)
Transition zone
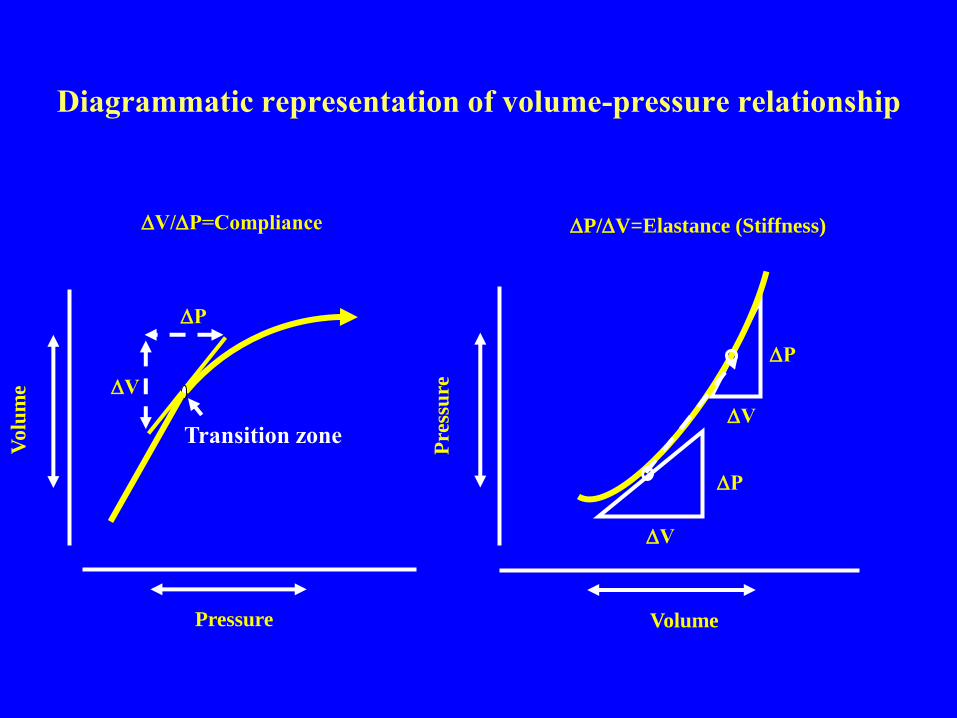
Diagrammatic representation of volume-pressure relationship
Vo
lum
e
Pressure
P
V
V/P=Compliance P/V=Elastance (Stiffness)
Transition zoneP
ress
ure
P
P
V
V
Volume
A.Tedgui and B. Levy , 1994
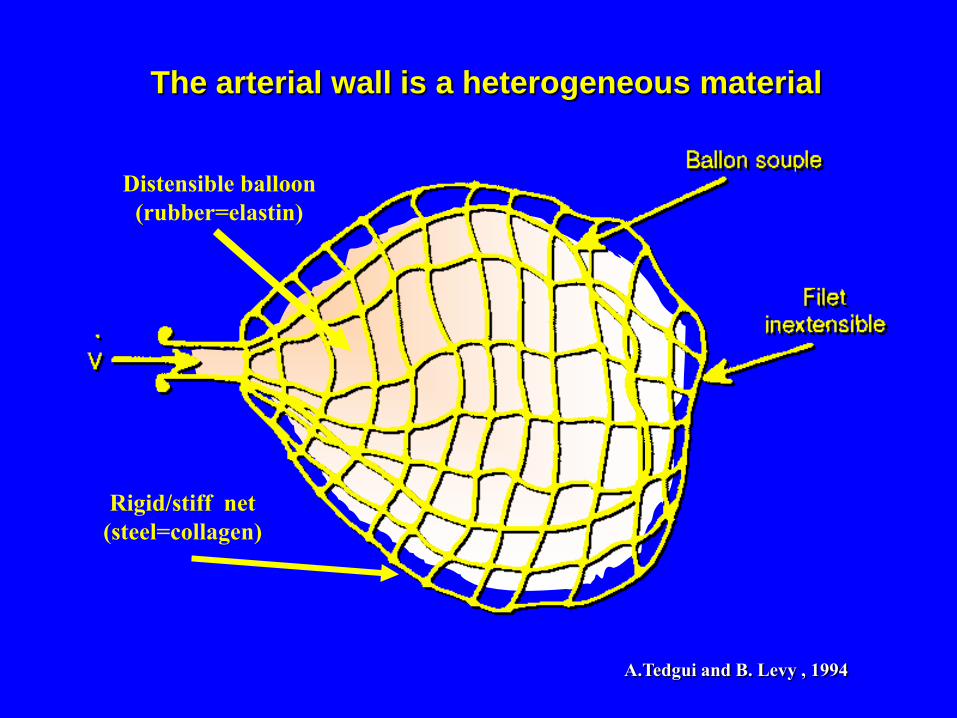
The arterial wall is a heterogeneous material
Distensible balloon
(rubber=elastin)
Rigid/stiff net
(steel=collagen)
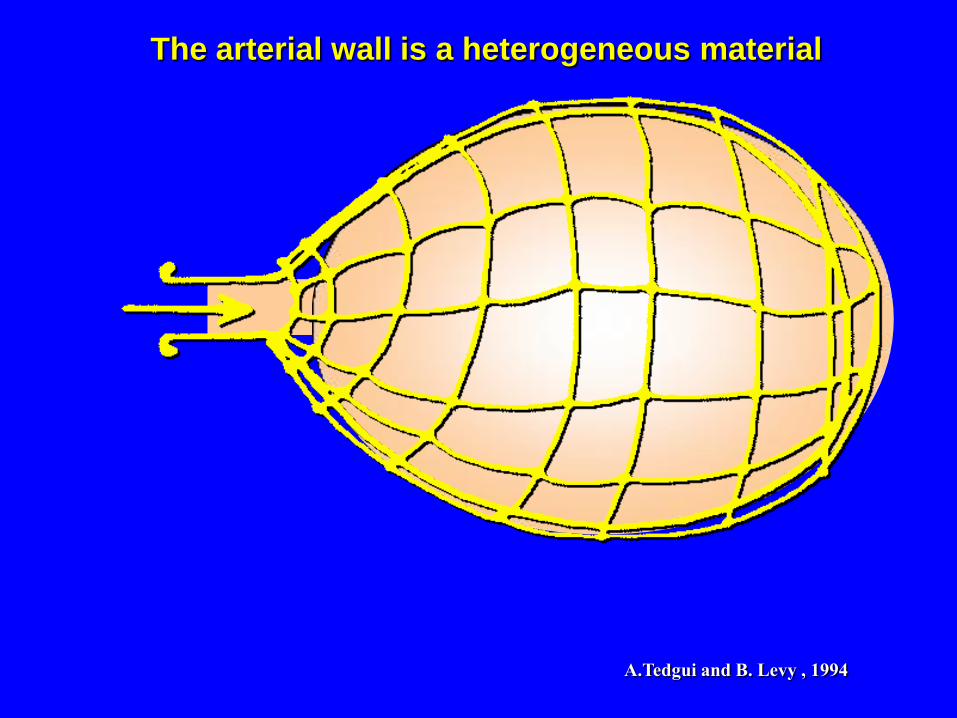
A.Tedgui and B. Levy , 1994
The arterial wall is a heterogeneous material
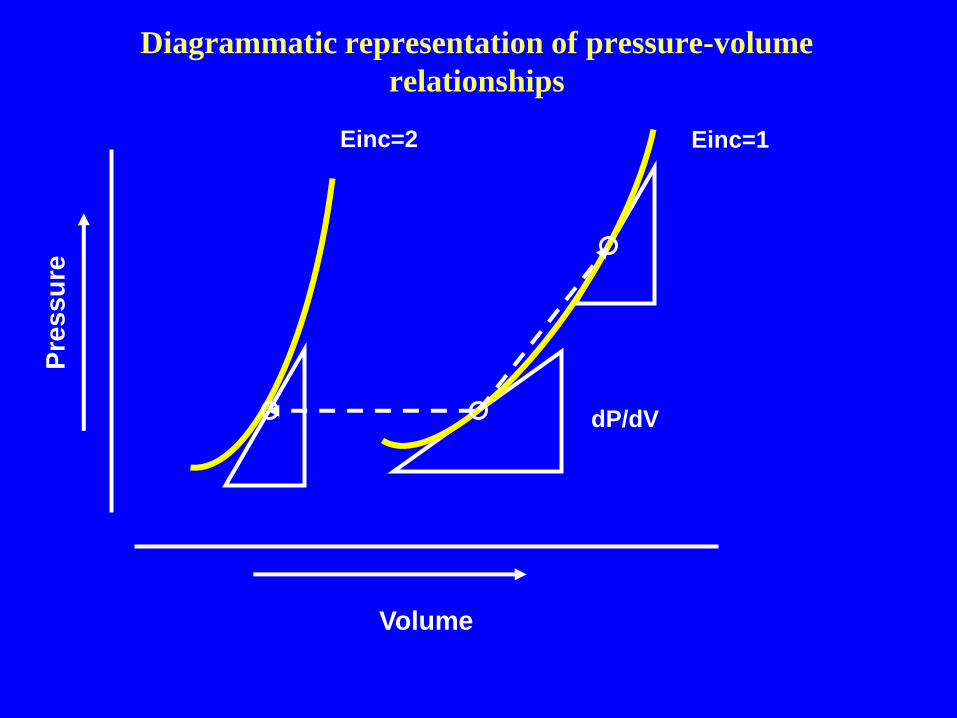
Diagrammatic representation of pressure-volume
relationships
Volume
Pre
ss
ure
dP/dV
Einc=1Einc=2
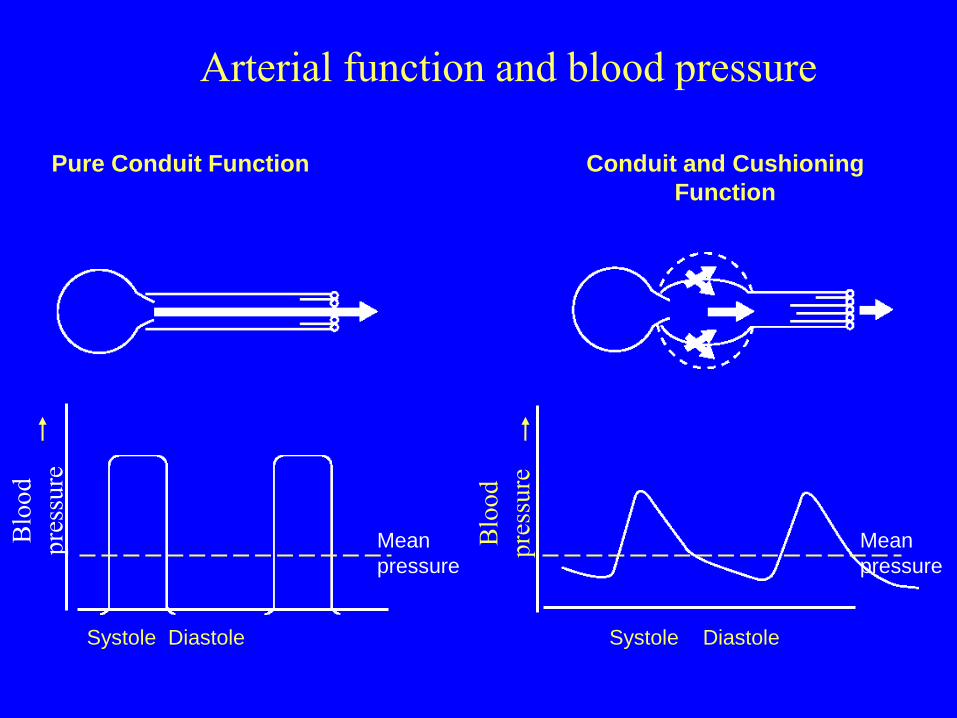
Arterial function and blood pressure
Pure Conduit Function Conduit and Cushioning
Function
Blo
od
pre
ssu
re
Systole Diastole
Mean
pressure
Blo
od
pre
ssu
re
Systole Diastole
Mean
pressure
.... .. ... .. . .
Time (sec)
80
140
4.6
4.38
. . . . . . . .
....
Blo
od
pre
ssu
re
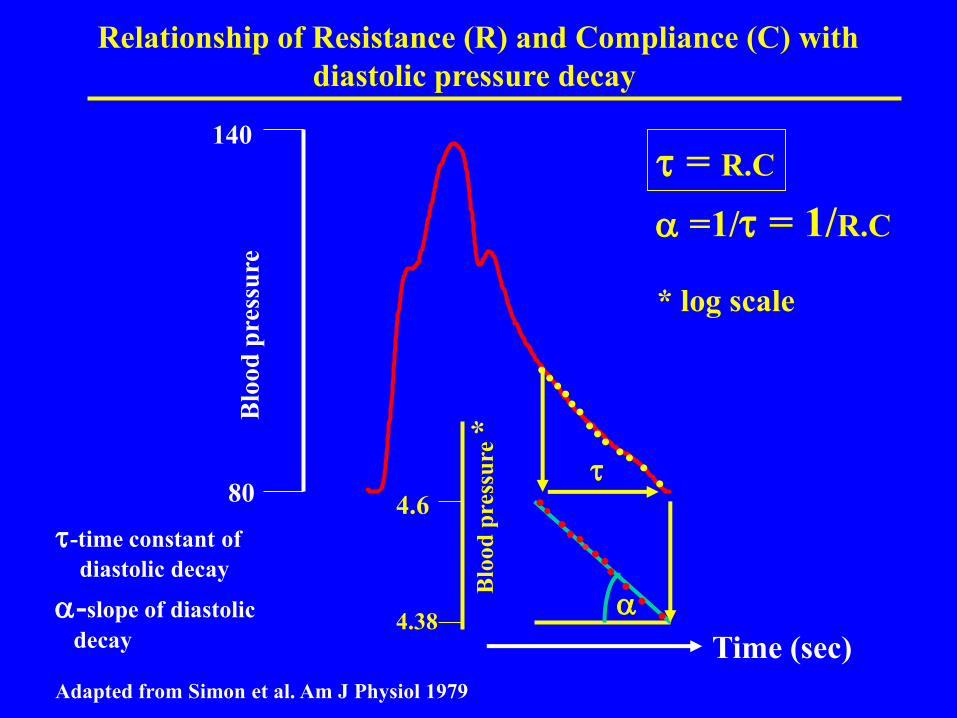
= R.C
=1/ = 1/R.C
Blo
od
pre
ssu
re *
* log scale
-time constant of
diastolic decay
-slope of diastolic
decay
Relationship of Resistance (R) and Compliance (C) with
diastolic pressure decay
Adapted from Simon et al. Am J Physiol 1979
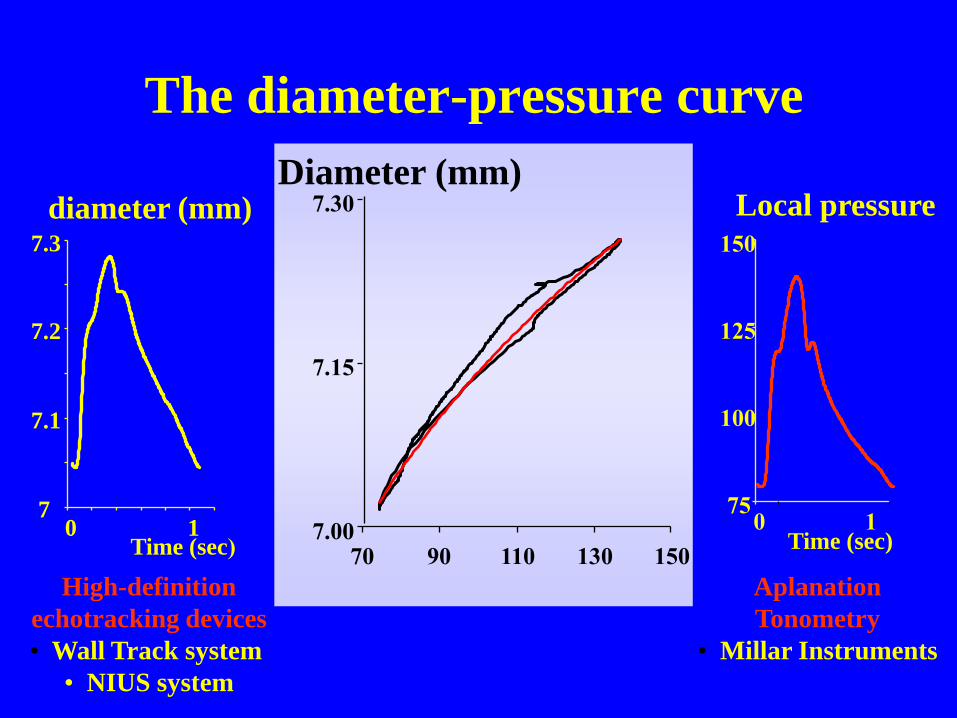
The diameter-pressure curve
Local pressure
Time (sec)
75
100
125
150
0 17
7.1
7.2
7.3
0 1Time (sec)
diameter (mm)
7.00
7.15
7.30
70 90 110 130 150
Diameter (mm)
High-definition
echotracking devices
• Wall Track system
• NIUS system
Aplanation
Tonometry
• Millar Instruments
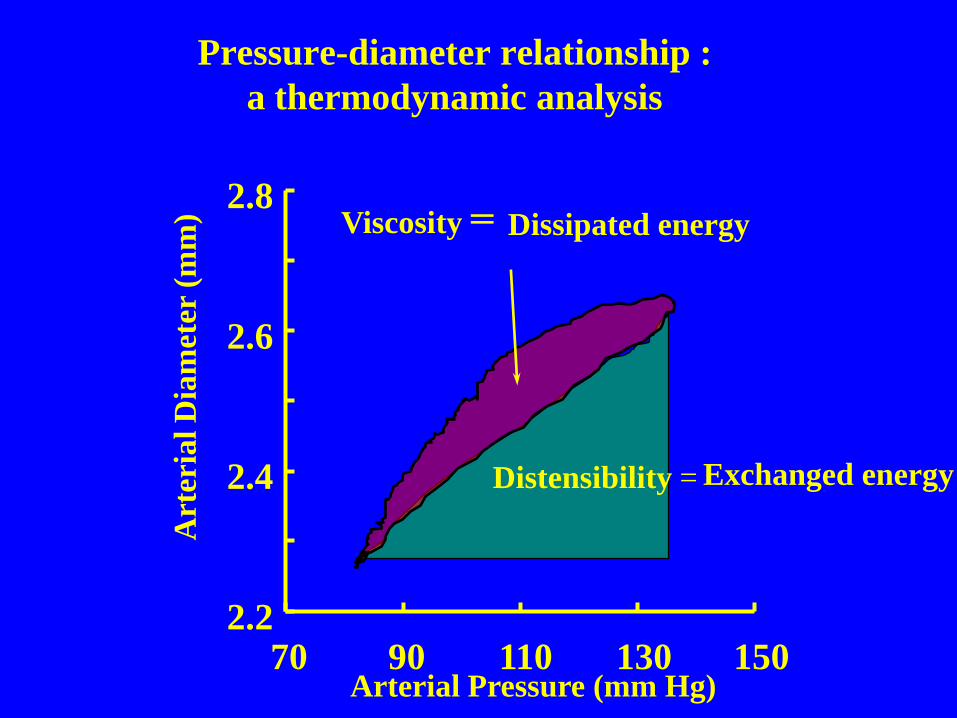
Pressure-diameter relationship :
a thermodynamic analysis
2.2
2.4
2.6
2.8
70 90 110 130 150
Art
eria
l D
iam
eter
(m
m) Dissipated energy
Exchanged energy
Viscosity =
Distensibility =
Arterial Pressure (mm Hg)
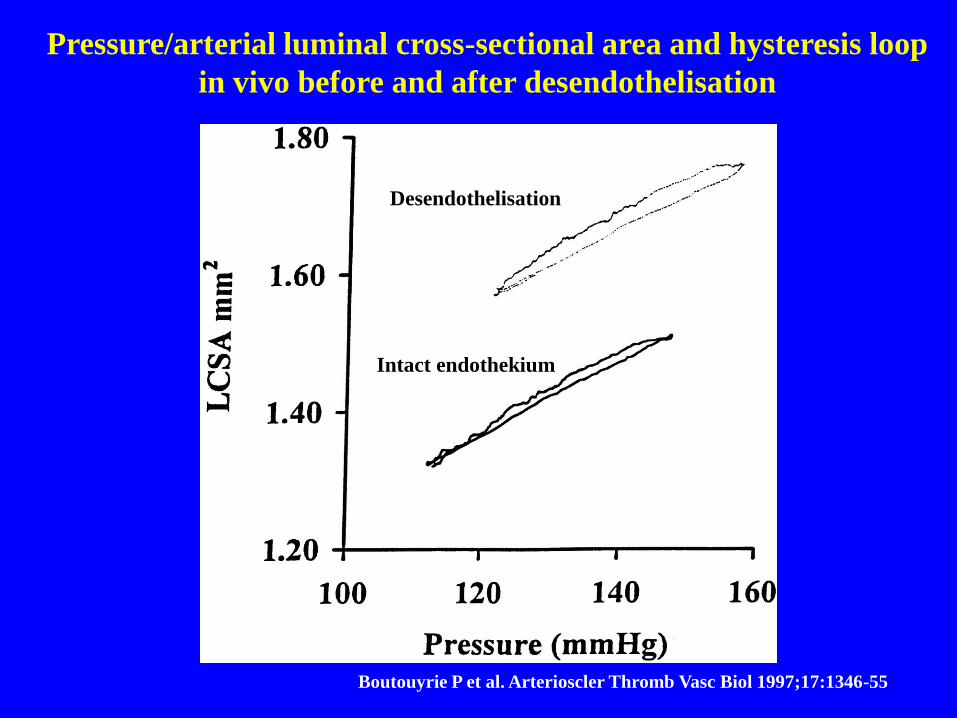
Pressure/arterial luminal cross-sectional area and hysteresis loop
in vivo before and after desendothelisation
Intact endothekium
Desendothelisation
Boutouyrie P et al. Arterioscler Thromb Vasc Biol 1997;17:1346-55
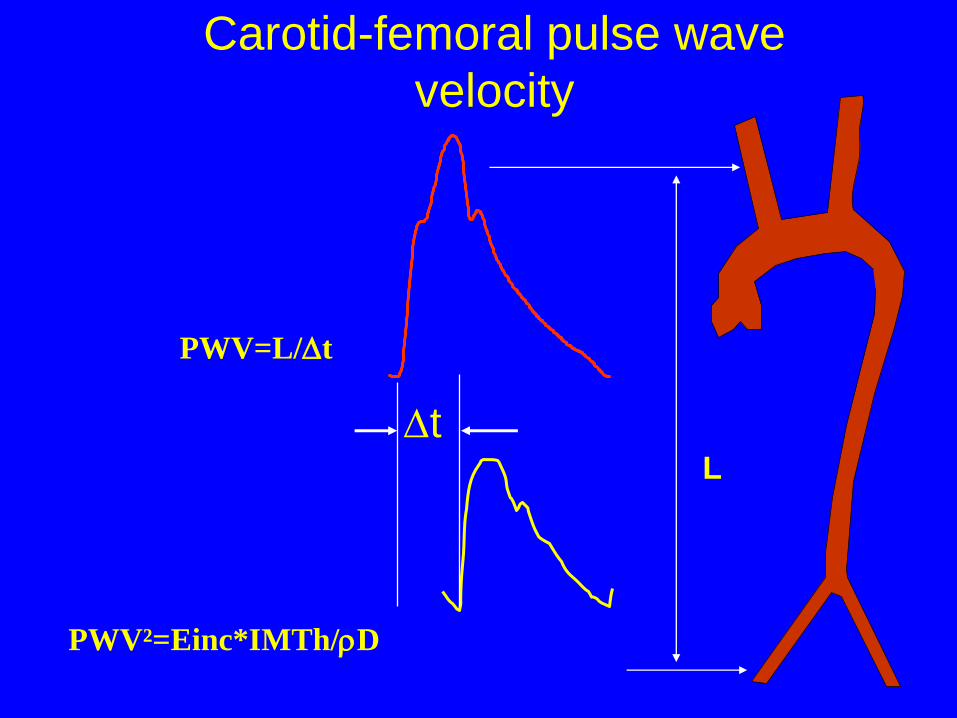
Carotid-femoral pulse wave
velocity
tL
PWV²=Einc*IMTh/D
PWV=L/t
450
860
1270
1680
2090
2500
0 20 40 60
CCA distensibility (kPa 10-1.10-3)
Ao
rtic
PW
V (
cm/s
)
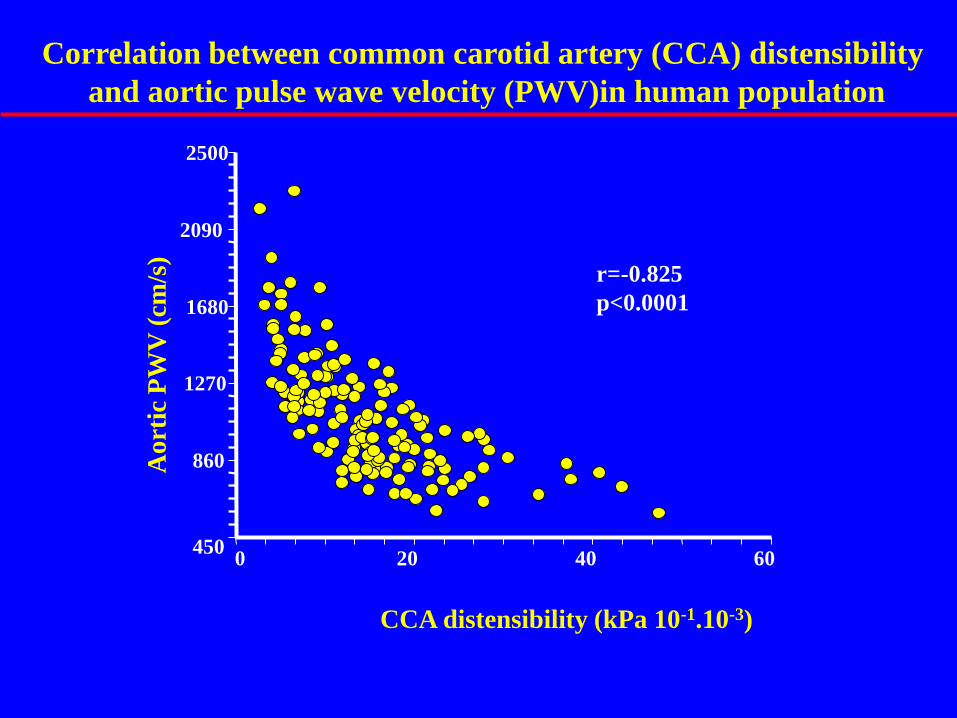
Correlation between common carotid artery (CCA) distensibility
and aortic pulse wave velocity (PWV)in human population
r=-0.825
p<0.0001
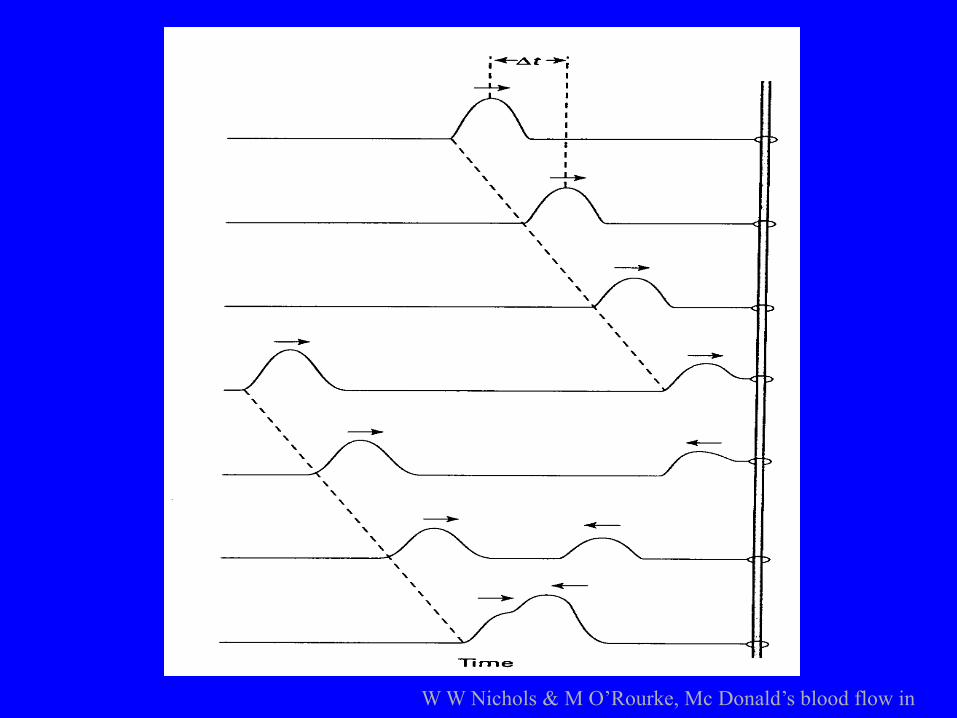
W W Nichols & M O’Rourke, Mc Donald’s blood flow in
arteries, Arnold ed,1998
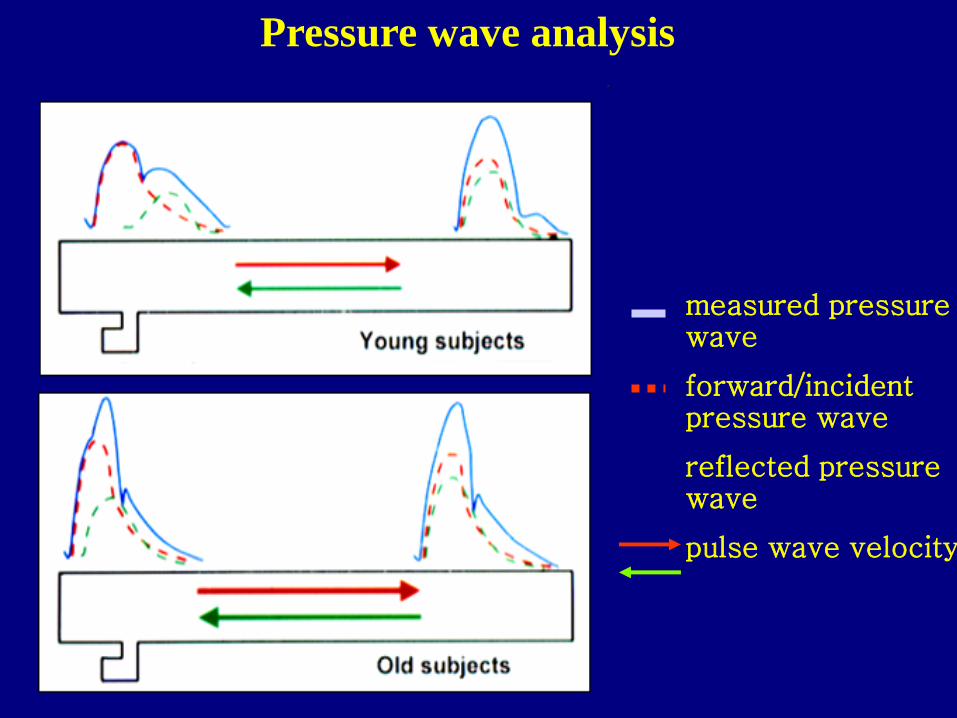
measured pressure wave
forward/incident pressure wave
reflected pressure wave
pulse wave velocity
Pressure wave analysis
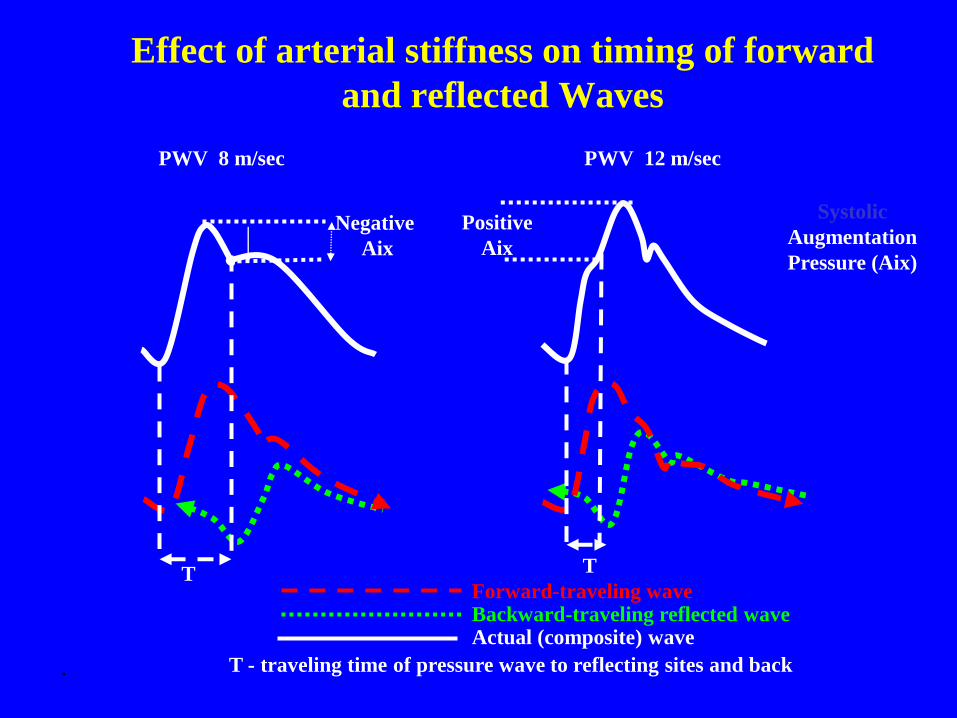
Effect of arterial stiffness on timing of forward
and reflected Waves
Systolic
Augmentation
Pressure (Aix)
PWV 8 m/sec PWV 12 m/sec
.
Forward-traveling waveBackward-traveling reflected waveActual (composite) wave
T T
T - traveling time of pressure wave to reflecting sites and back
Negative
Aix
Positive
Aix
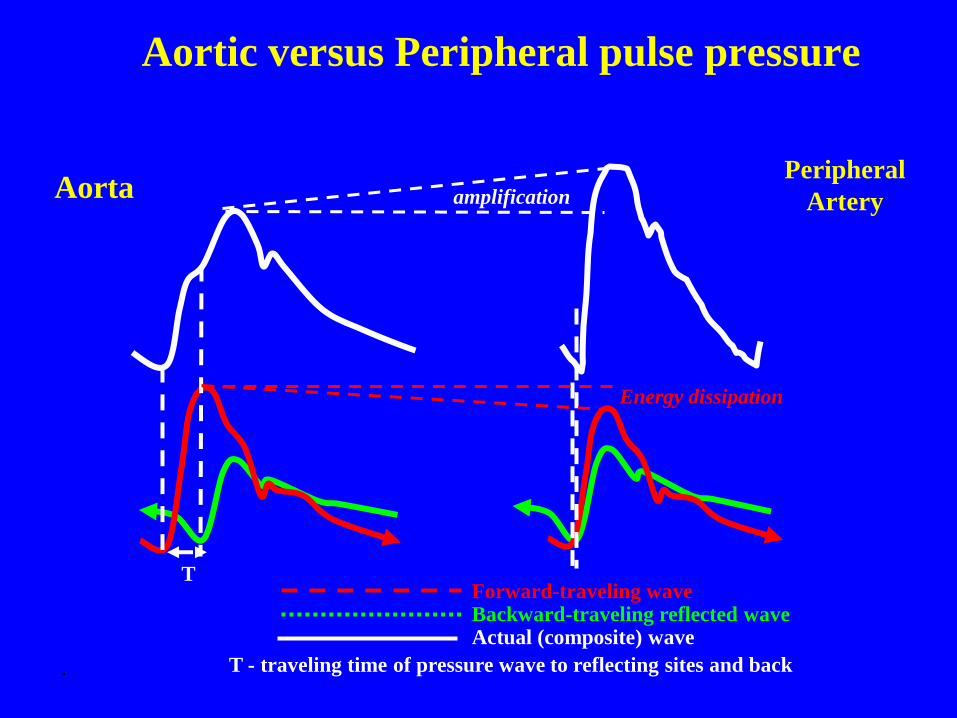
Aortic versus Peripheral pulse pressure
Peripheral
Artery
.
Forward-traveling waveBackward-traveling reflected waveActual (composite) wave
T
T - traveling time of pressure wave to reflecting sites and back
Aorta amplification
Energy dissipation
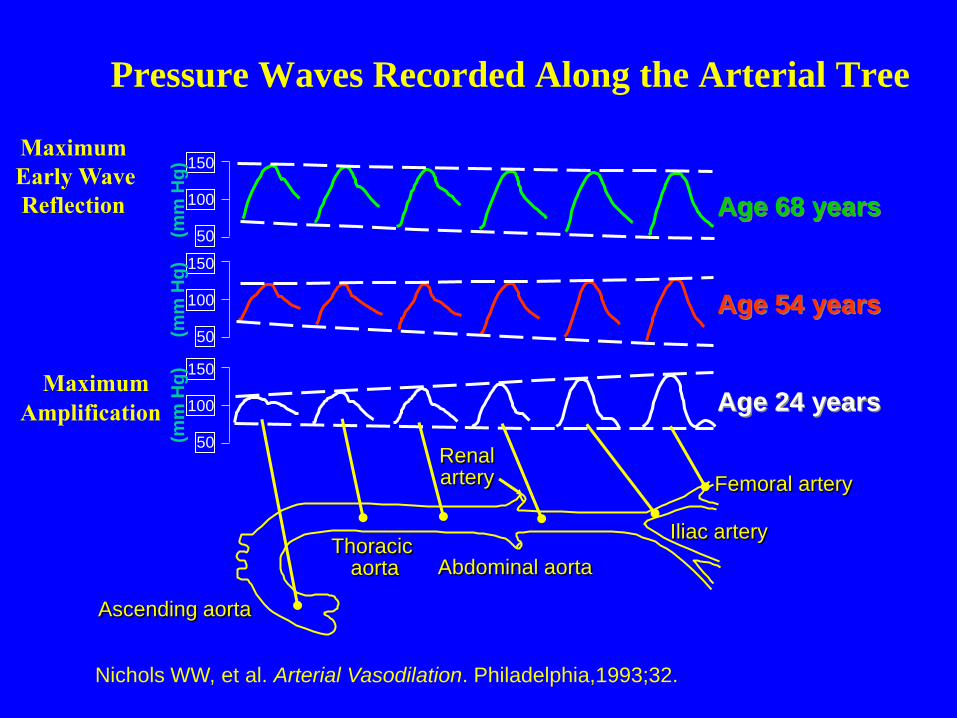
Pressure Waves Recorded Along the Arterial Tree
Femoral artery
Iliac artery
Abdominal aorta
Ascending aorta
Renalartery
Thoracic aorta
50
100
150
50
100
150
50
100
150
Nichols WW, et al. Arterial Vasodilation. Philadelphia,1993;32.
(mm
Hg
)(m
m H
g)
(mm
Hg
)
Age 68 years
Age 54 years
Age 24 yearsMaximum
Amplification
Maximum
Early Wave
Reflection
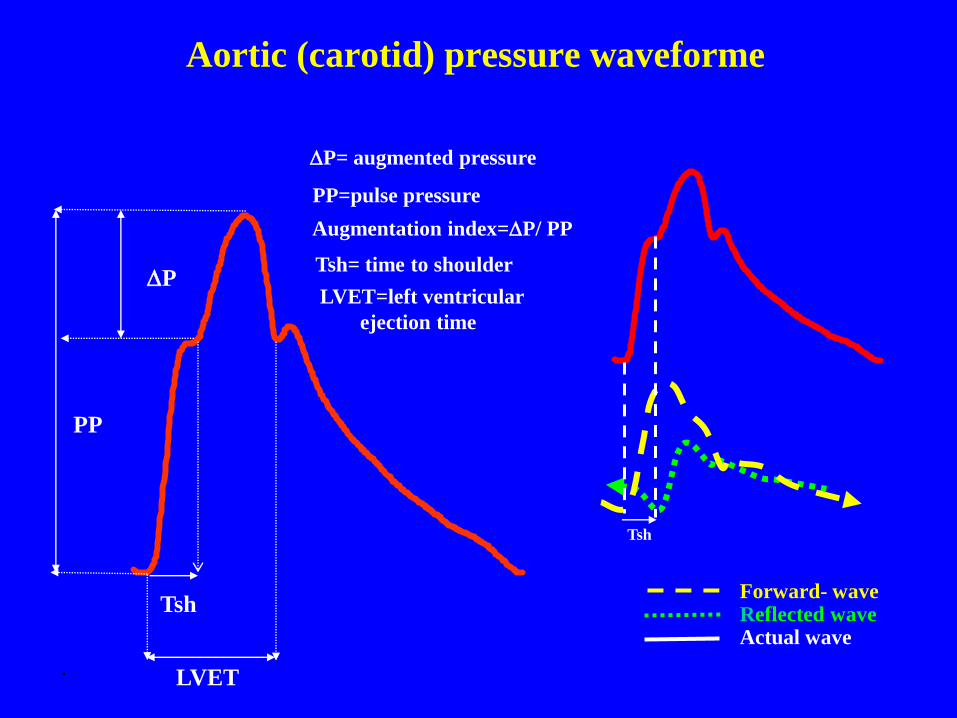
Aortic (carotid) pressure waveforme
.
Forward- waveReflected waveActual wave
Tsh
LVET
P
PP
Augmentation index=P/ PP
P= augmented pressure
PP=pulse pressure
Tsh= time to shoulder
LVET=left ventricular
ejection time
Tsh
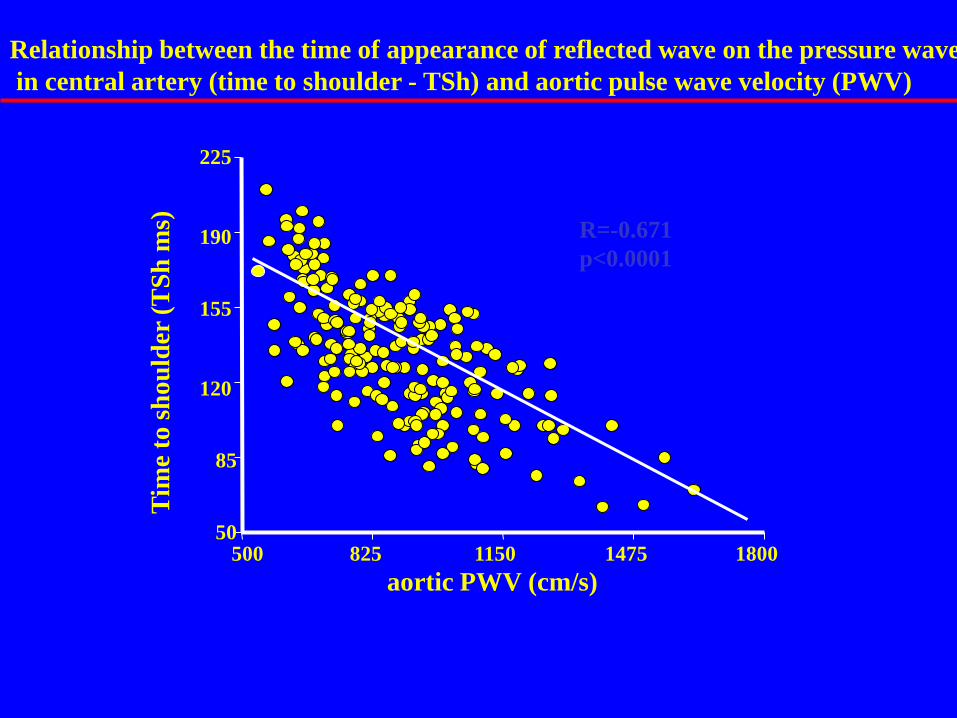
50
85
120
155
190
225
500 825 1150 1475 1800
aortic PWV (cm/s)
Tim
e to
sh
ou
lder
(T
Sh
ms) R=-0.671
p<0.0001
Relationship between the time of appearance of reflected wave on the pressure wave
in central artery (time to shoulder - TSh) and aortic pulse wave velocity (PWV)
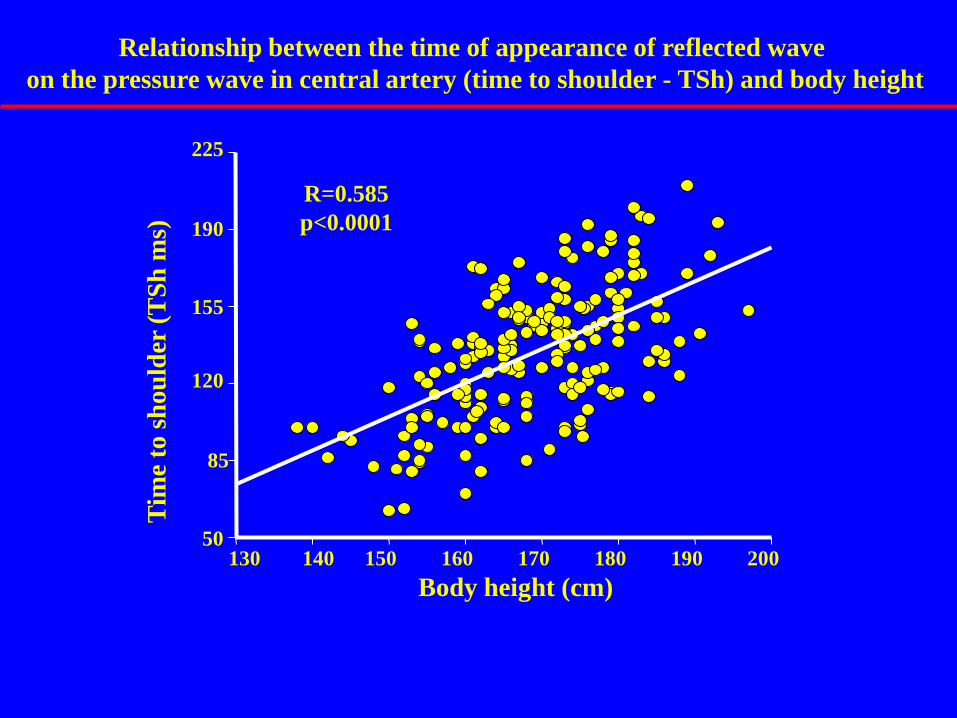
50
85
120
155
190
225
130 140 150 160 170 180 190 200
Body height (cm)
Tim
e to
sh
ou
lder
(T
Sh
ms)
R=0.585
p<0.0001
Relationship between the time of appearance of reflected wave
on the pressure wave in central artery (time to shoulder - TSh) and body height
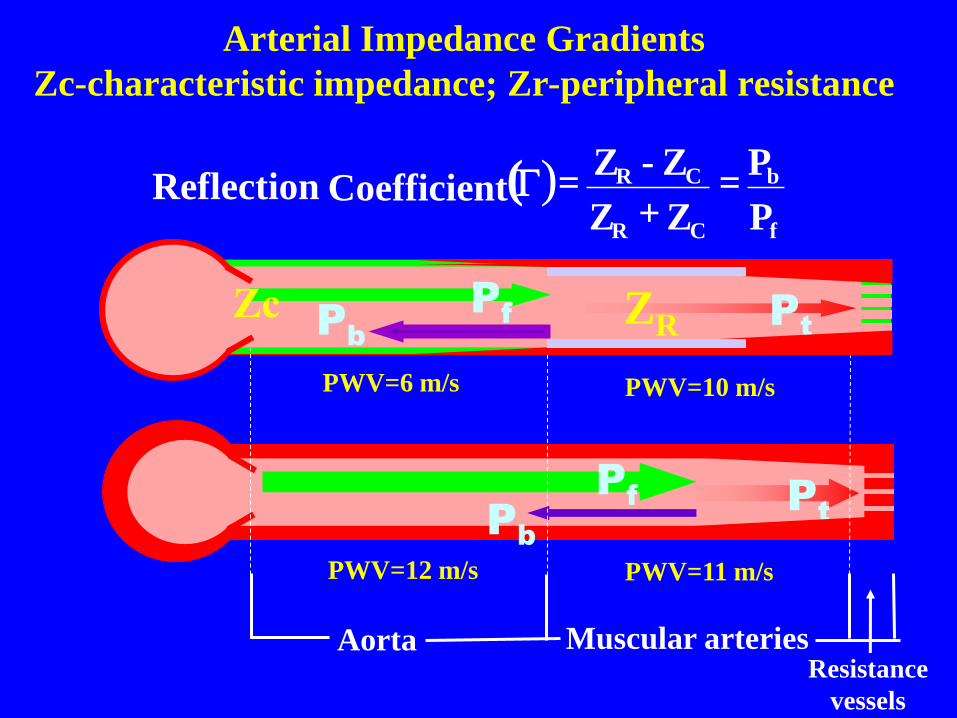
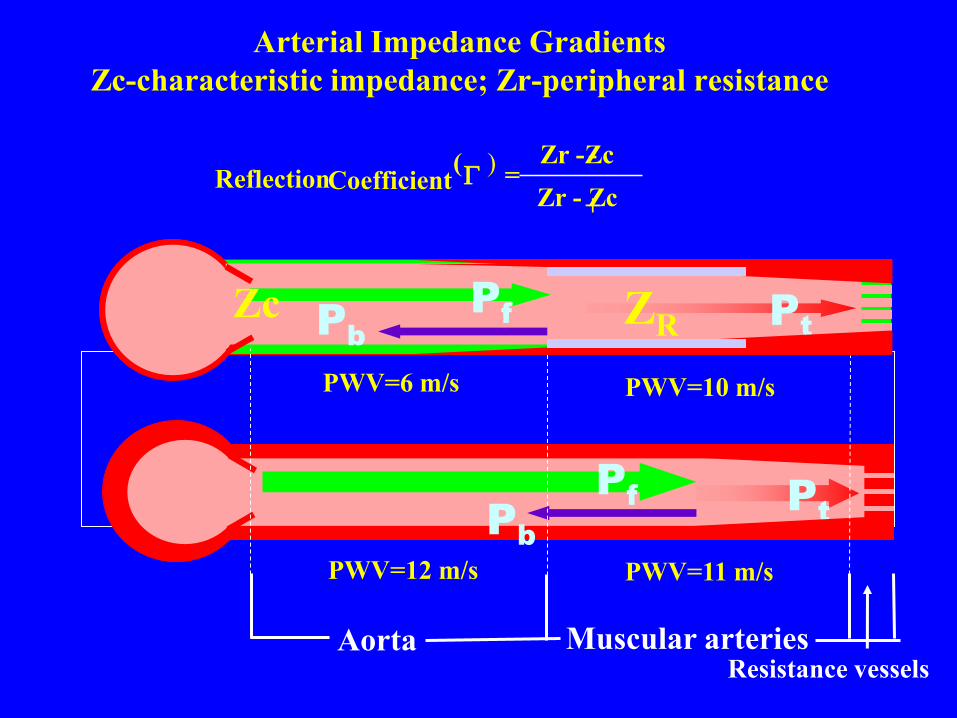
Arterial Impedance Gradients
Zc-characteristic impedance; Zr-peripheral resistance
Aorta Muscular arteriesResistance
vessels
Pf P
tPb
Pf
Pb
Pt
( )f
b
CR
CR
P
P
ZZ
Z-Z=
+=CoefficientReflection
Zc ZR
PWV=6 m/s PWV=10 m/s
PWV=12 m/s PWV=11 m/s
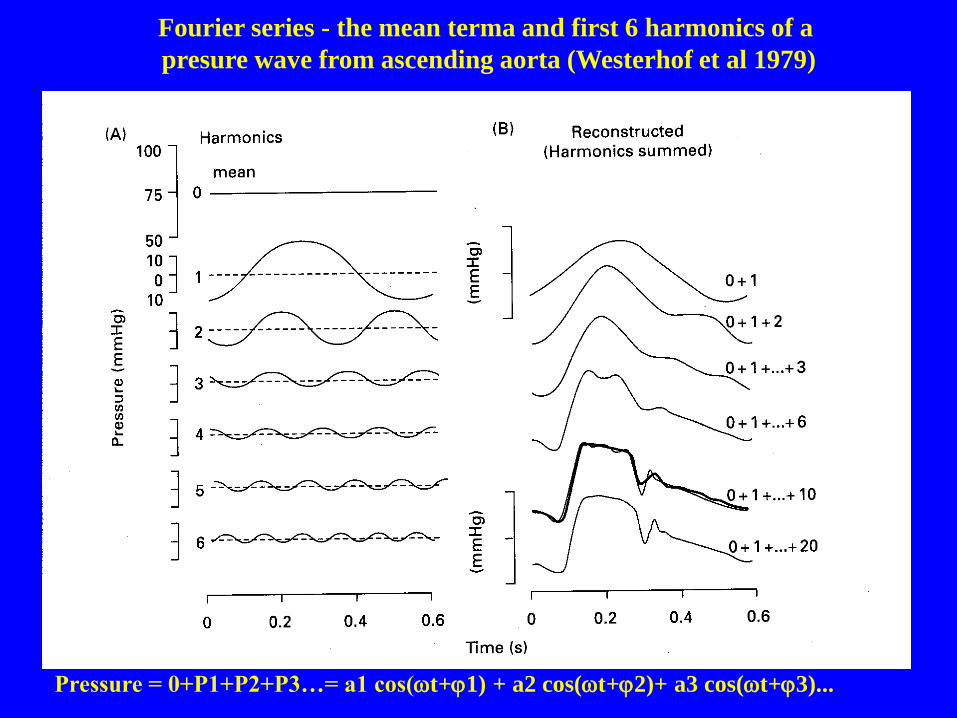
Pressure = 0+P1+P2+P3…= a1 cos(t+1) + a2 cos(t+2)+ a3 cos(t+3)...
Fourier series - the mean terma and first 6 harmonics of a
presure wave from ascending aorta (Westerhof et al 1979)
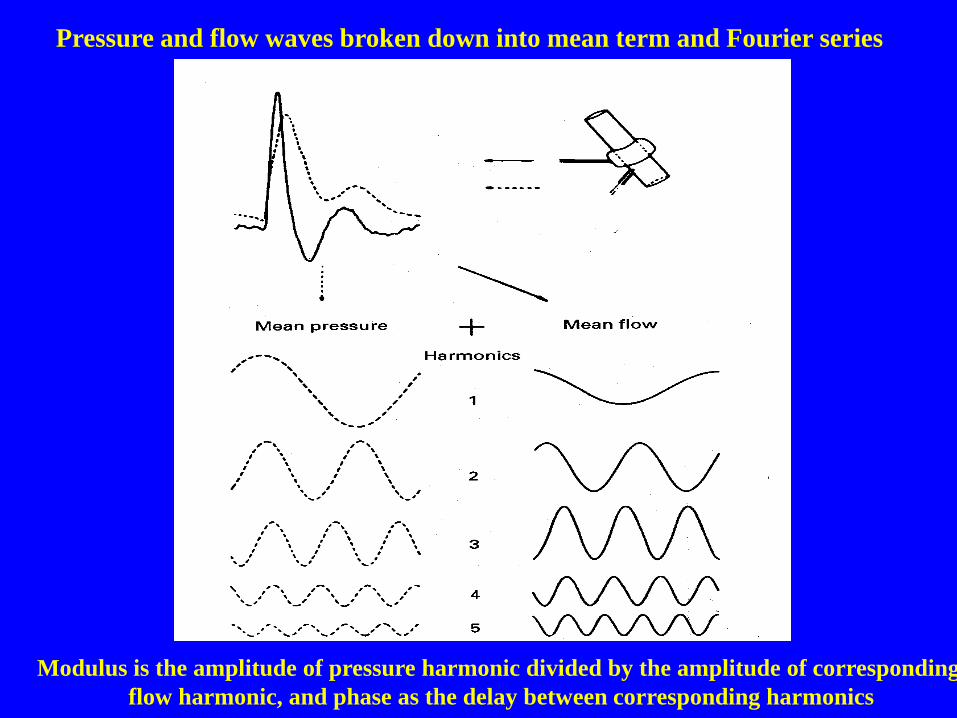
Pressure and flow waves broken down into mean term and Fourier series
Modulus is the amplitude of pressure harmonic divided by the amplitude of corresponding
flow harmonic, and phase as the delay between corresponding harmonics

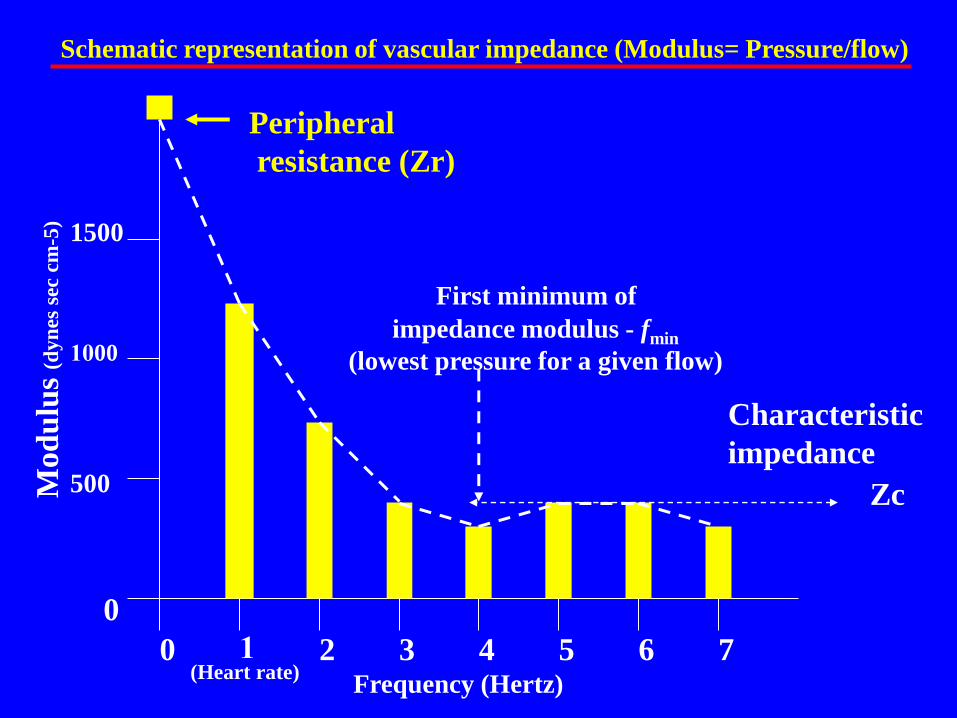
Modulus and phase of impedance in the ascending aorta
McDonald blood flow in the arteries 1994
Mod
ulu
s (d
yn
es s
ec c
m-5
)
Frequency (Hertz)
0 1 2 3 4 5 6 7
0
500
1000
1500
Peripheral
resistance (Zr)
(Heart rate)
First minimum of
impedance modulus - fmin
(lowest pressure for a given flow)
Zc
Characteristic
impedance
Schematic representation of vascular impedance (Modulus= Pressure/flow)
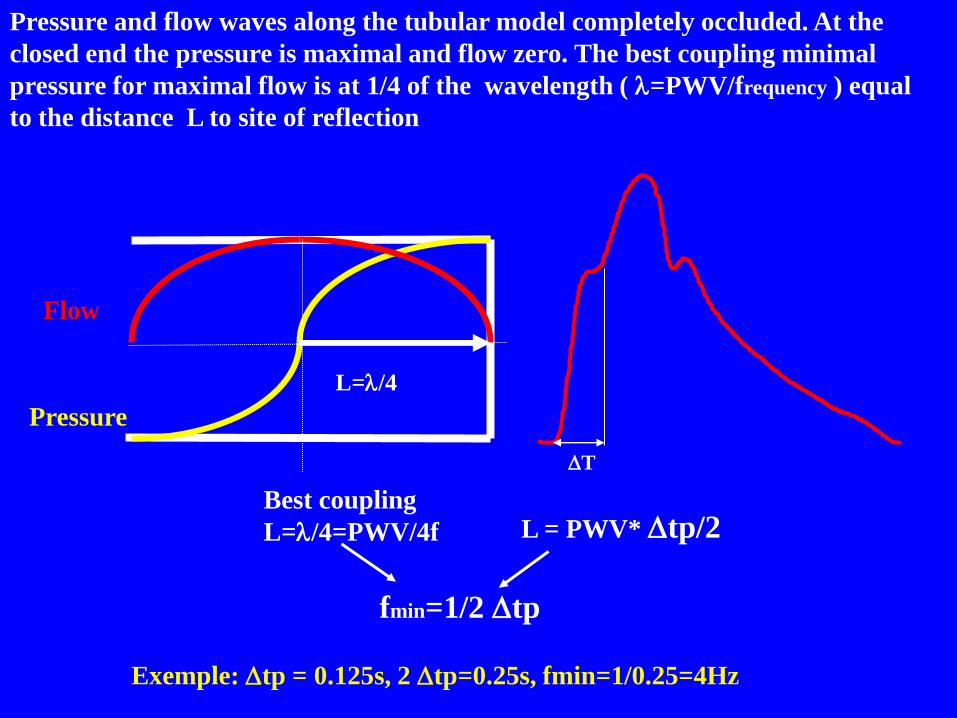
Best coupling
L=/4=PWV/4f
L=/4
Pressure and flow waves along the tubular model completely occluded. At the
closed end the pressure is maximal and flow zero. The best coupling minimal
pressure for maximal flow is at 1/4 of the wavelength ( =PWV/frequency ) equal
to the distance L to site of reflection
Pressure
Flow
T
L = PWV* tp/2
fmin=1/2 tp
Exemple: tp = 0.125s, 2 tp=0.25s, fmin=1/0.25=4Hz
2.0
3.0
4.0
5.0
6.0
7.0
8.0
9.0
130.0 145.0 160.0 175.0 190.0
Body height (cm)
Fir
st m
inim
um
of
imp
eda
nce
(H
z)
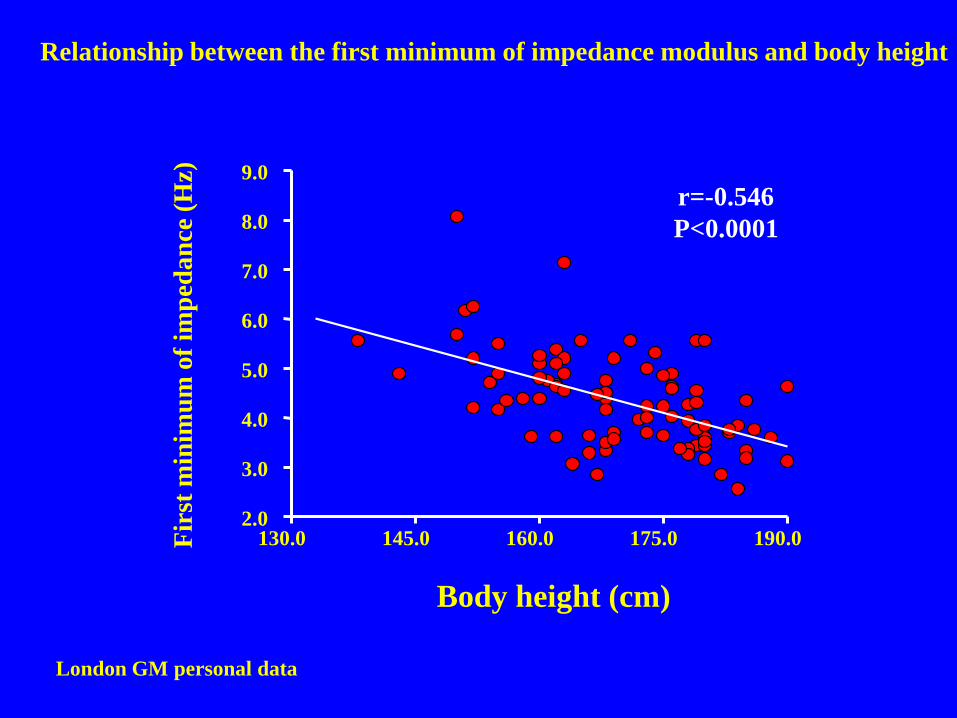
Relationship between the first minimum of impedance modulus and body height
London GM personal data
r=-0.546
P<0.0001
2.0
3.0
4.0
5.0
6.0
7.0
8.0
9.0
600.0 900.0 1200.0 1500.0 1800.0
Aortic PWV (cm/s)
Fir
st m
inim
um
of
imp
eda
nce
(H
z)
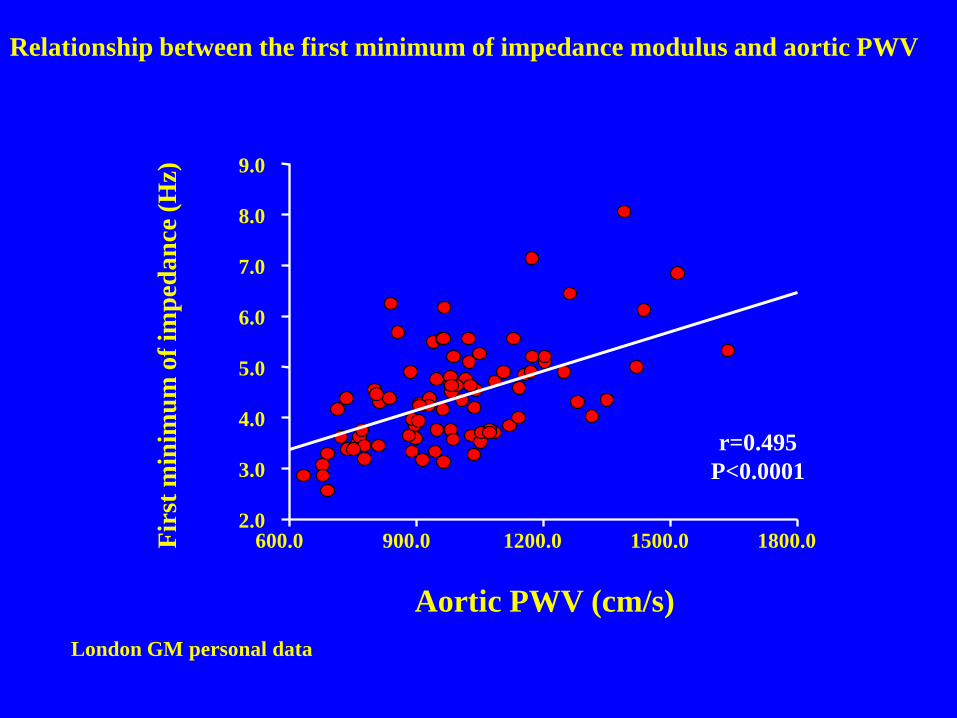
Relationship between the first minimum of impedance modulus and aortic PWV
r=0.495
P<0.0001
London GM personal data
Mod
ulu
s (d
yn
es s
ec c
m-5
)
Frequency (Hertz)
0 1 2 3 4 5 6 7
0
500
1000
1500
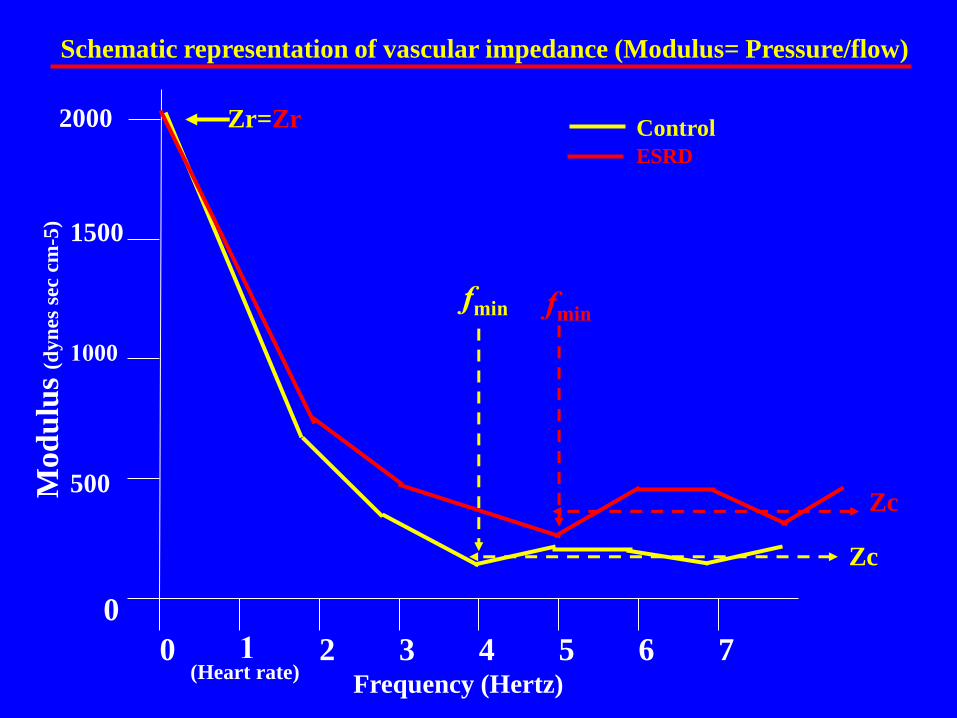
Zr=Zr
(Heart rate)
fmin
Zc
Schematic representation of vascular impedance (Modulus= Pressure/flow)
2000
fmin
Zc
Control
ESRD
Mod
ulu
s (d
yn
es s
ec c
m-5
)
Cycles (multiples of 1st in Hertz)
0 1 2 3 4 5 6 7
0
500
1000
1500
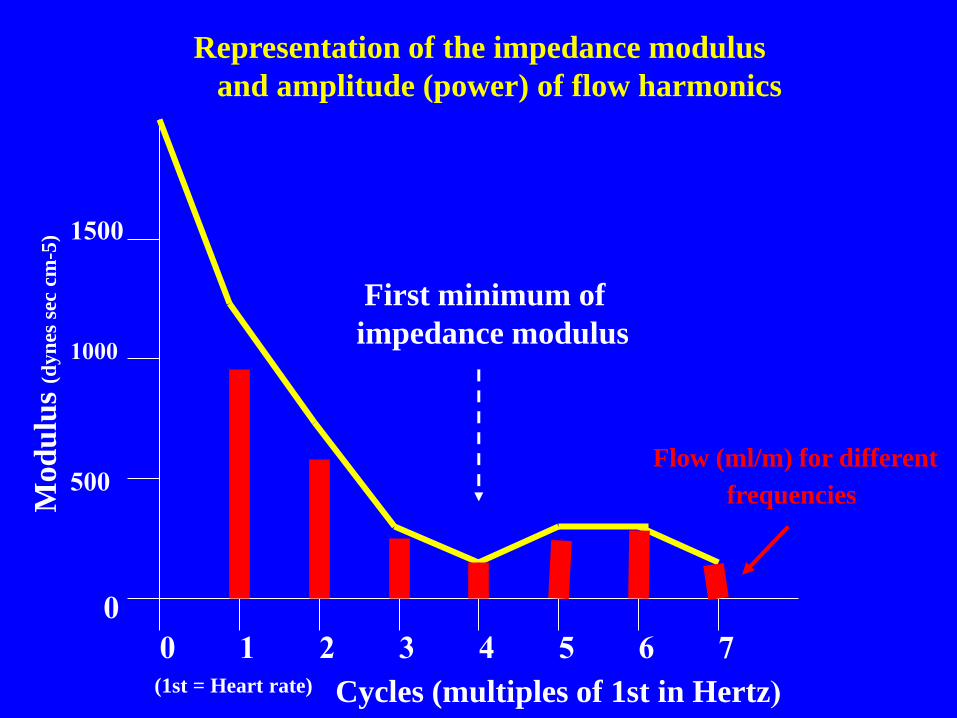
(1st = Heart rate)
First minimum of
impedance modulus
Representation of the impedance modulus
and amplitude (power) of flow harmonics
Flow (ml/m) for different
frequencies
Mod
ulu
s (d
yn
es s
ec c
m-5
)
Cycles (Hertz)
0 1 2 3 4 5 6 7
0
500
1000
1500
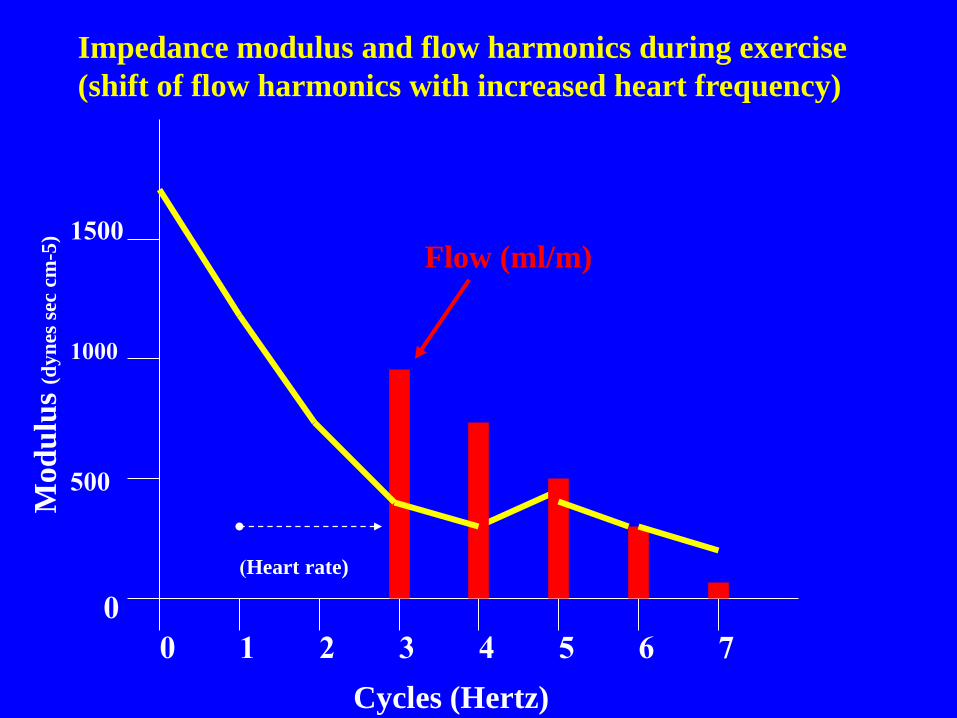
(Heart rate)
Impedance modulus and flow harmonics during exercise
(shift of flow harmonics with increased heart frequency)
Flow (ml/m)
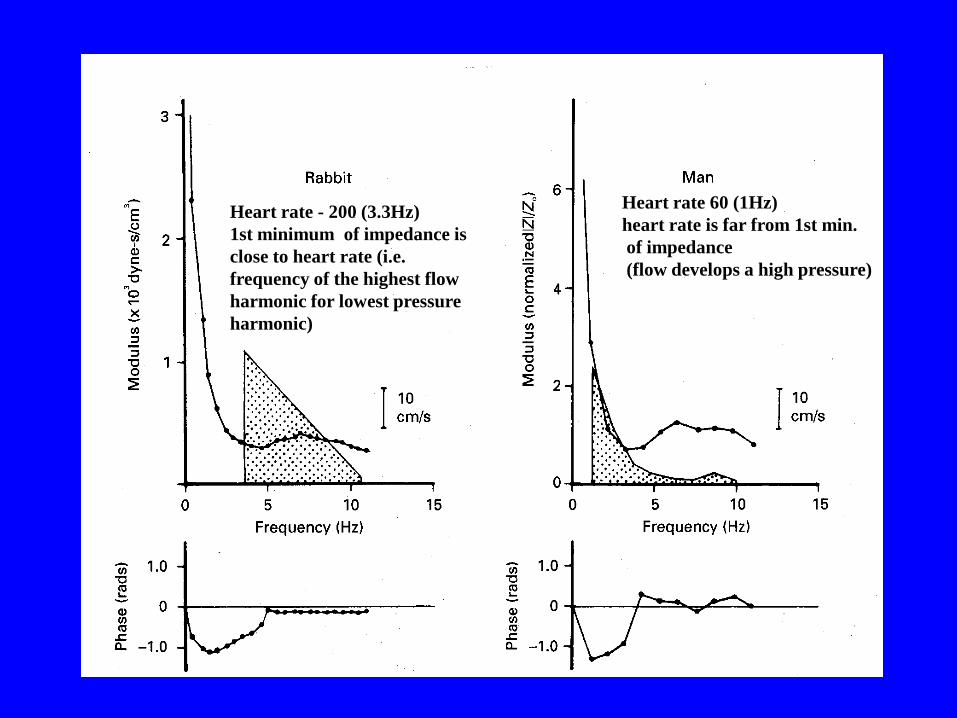
Heart rate - 200 (3.3Hz)
1st minimum of impedance is
close to heart rate (i.e.
frequency of the highest flow
harmonic for lowest pressure
harmonic)
Heart rate 60 (1Hz)
heart rate is far from 1st min.
of impedance
(flow develops a high pressure)
2.0
3.0
4.0
5.0
6.0
7.0
600
1.66 Hz
800
1.25 Hz
1000
1 Hz
1200
0.83 Hz
1400
0.71 Hz
Heart Period (ms)
Fir
st m
inim
um
of
imp
edan
ce (
Hz)
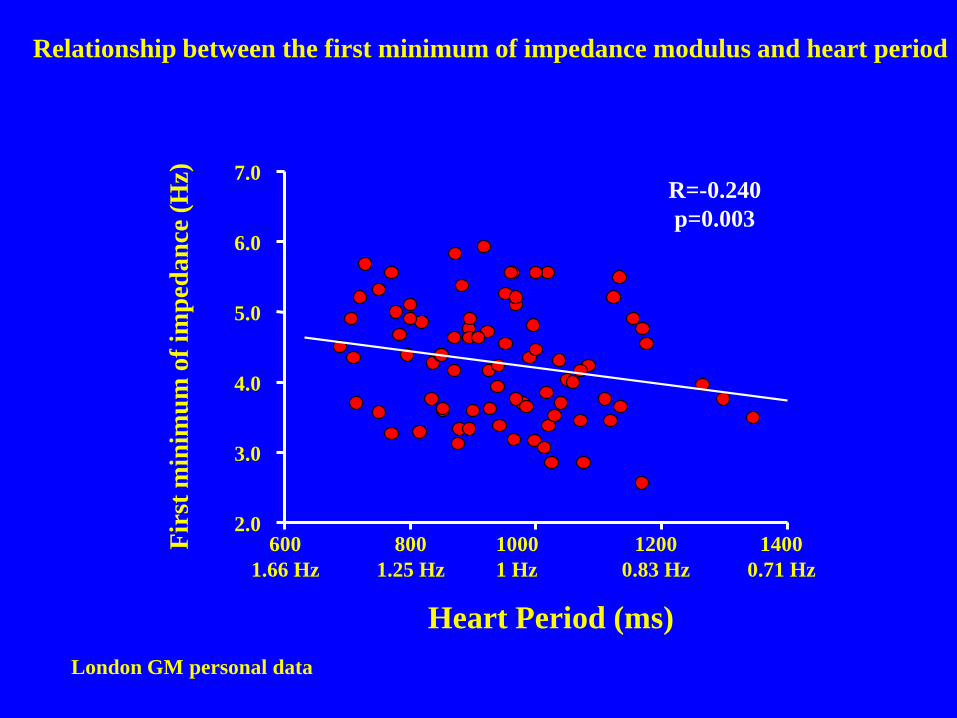
R=-0.240
p=0.003
Relationship between the first minimum of impedance modulus and heart period
London GM personal data
2.0
3.0
4.0
5.0
6.0
7.0
130.0 145.0 160.0 175.0 190.0
Body Height (cm)
Fm
in/H
eart
fre
qu
ency
(ra
tio)
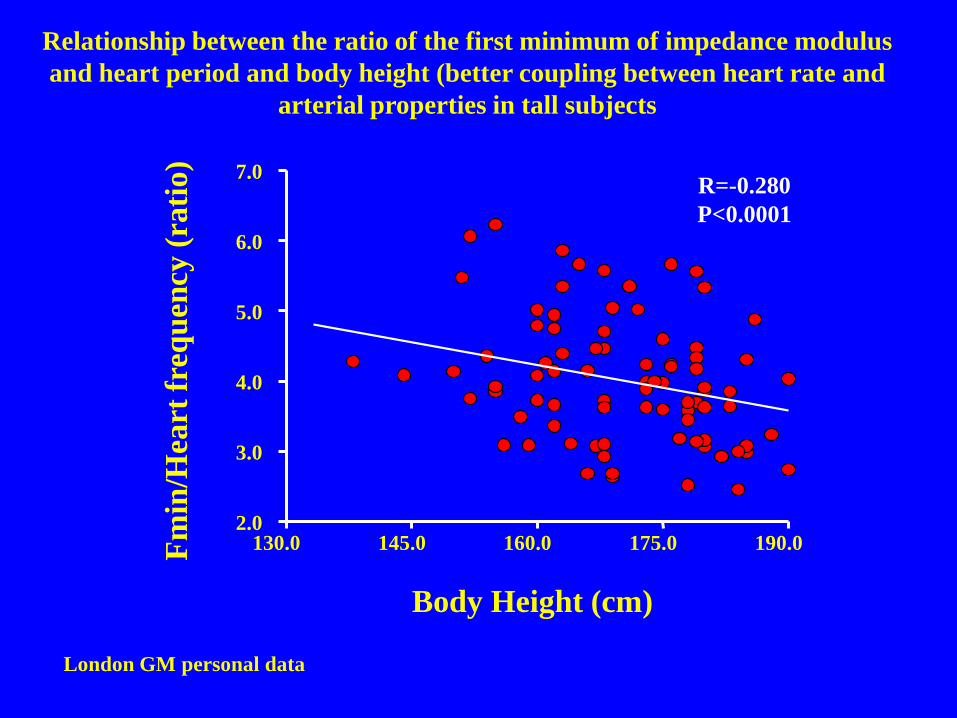
R=-0.280
P<0.0001
Relationship between the ratio of the first minimum of impedance modulus
and heart period and body height (better coupling between heart rate and
arterial properties in tall subjects
London GM personal data
0.6
0.9
1.2
1.4
1.7
2.0
2.0 4.0 6.0 8.0 10.0
Fmin/heart frequency (ratio)
LV
vel
oci
ty o
f fi
ber
sh
ort
enin
g (
c/s)
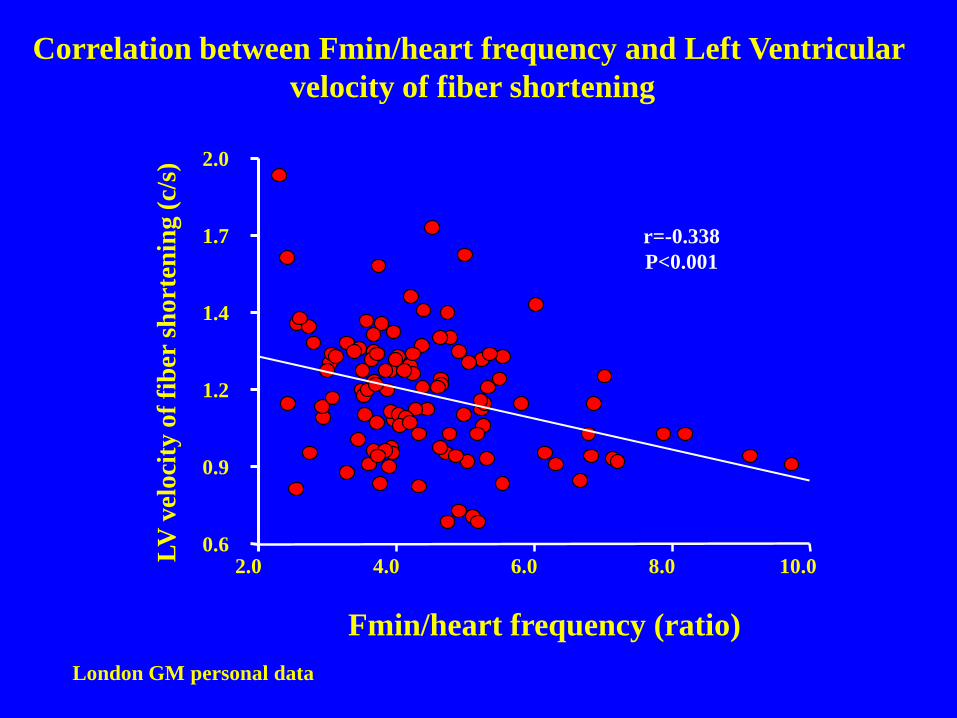
Correlation between Fmin/heart frequency and Left Ventricular
velocity of fiber shortening
r=-0.338
P<0.001
London GM personal data
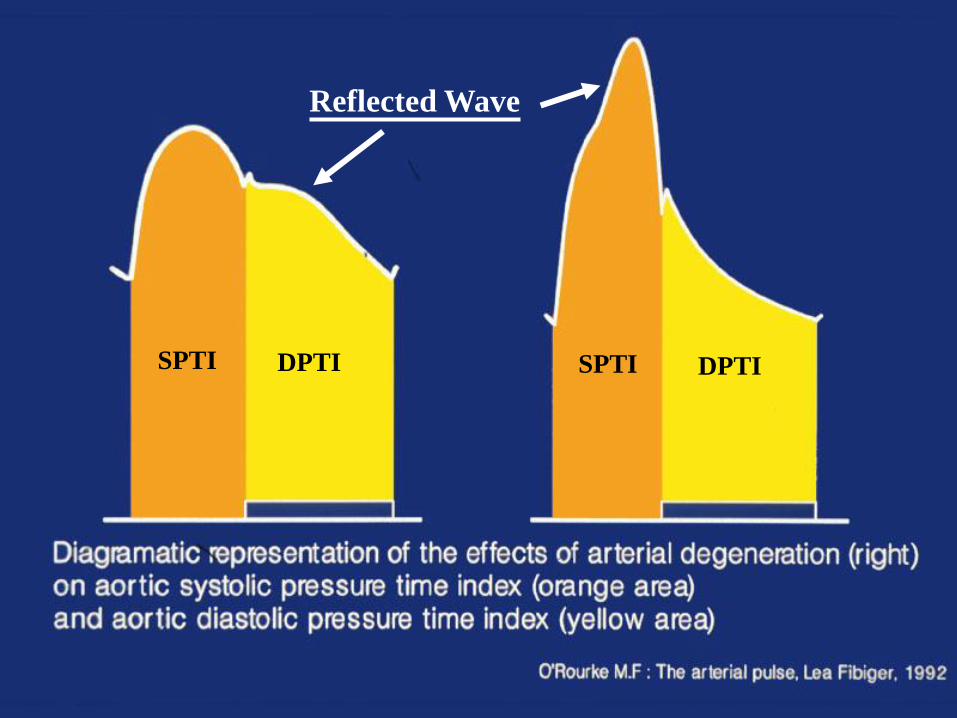
Reflected Wave
SPTI DPTI SPTI DPTI
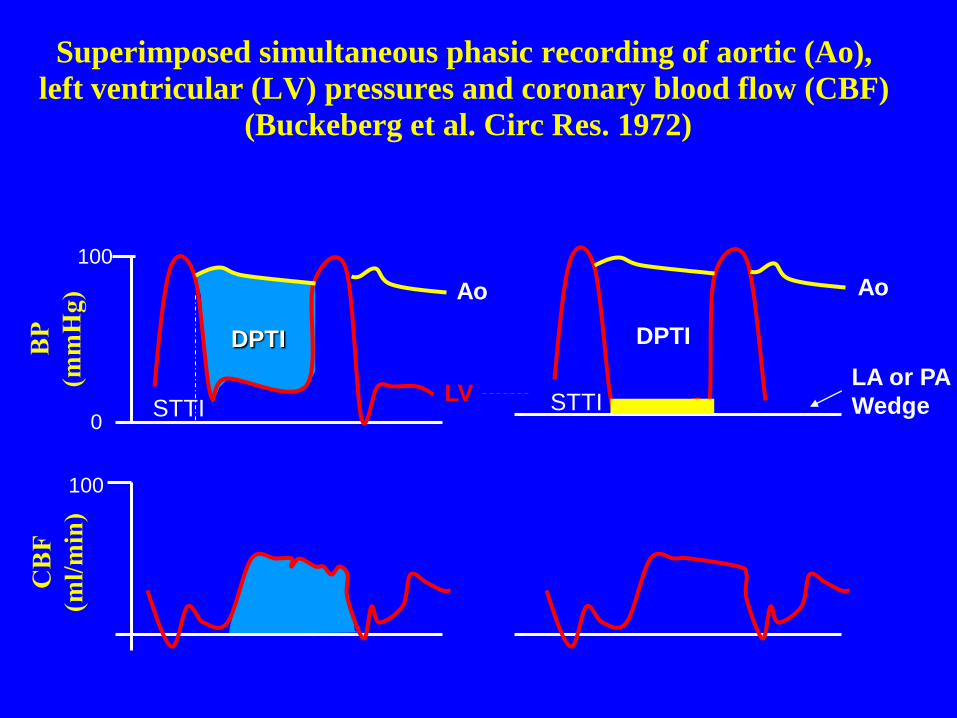
Superimposed simultaneous phasic recording of aortic (Ao),
left ventricular (LV) pressures and coronary blood flow (CBF)
(Buckeberg et al. Circ Res. 1972)
100
0
LV
Ao
STTI
DPTI
100
LA or PA
Wedge
Ao
STTI
DPTIBP
(mm
Hg
)
CB
F
(ml/
min
)
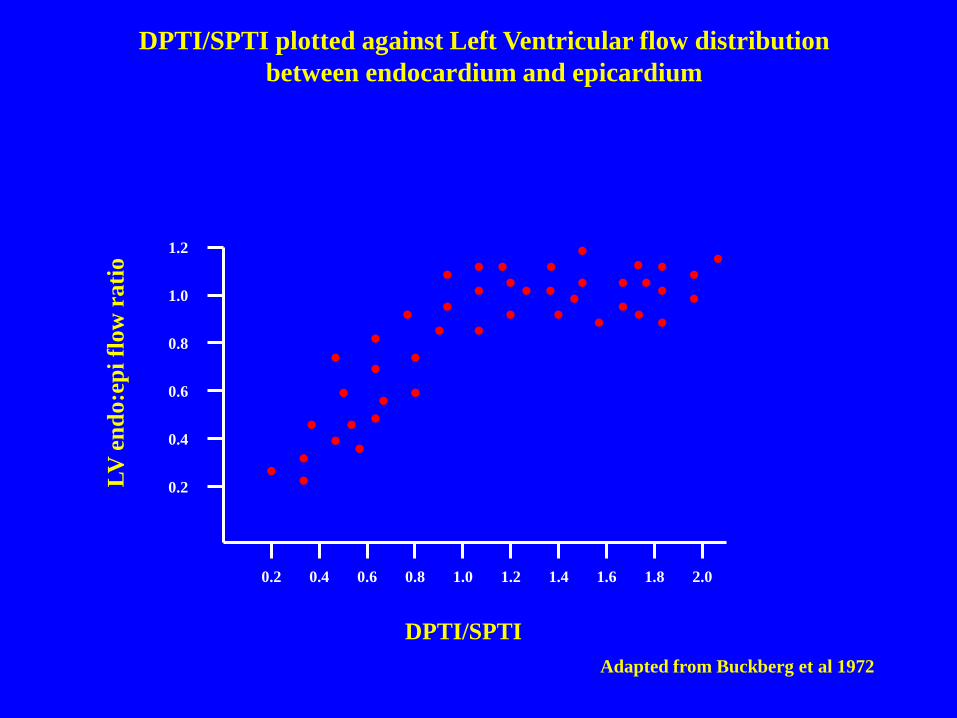
0.2
0.4
0.6
0.8
1.0
1.2
0.2 0.4 0.6 0.8 1.0 1.2 1.4 1.6 1.8 2.0
DPTI/SPTI
LV
en
do:e
pi
flow
rati
o
Adapted from Buckberg et al 1972
DPTI/SPTI plotted against Left Ventricular flow distribution
between endocardium and epicardium
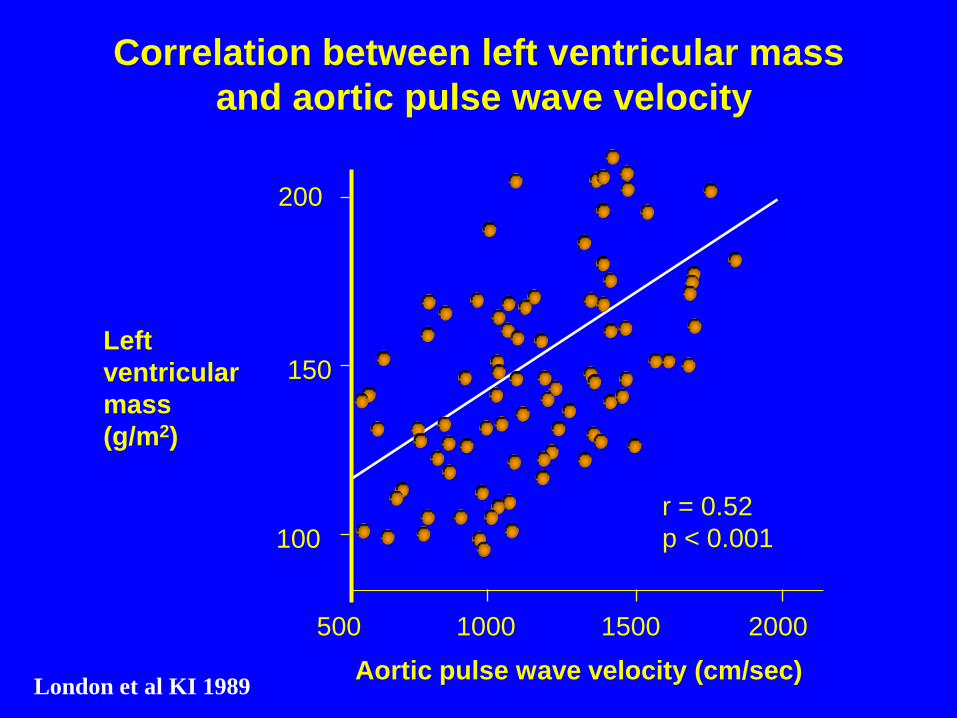
200
100
Aortic pulse wave velocity (cm/sec)
Left
ventricular
mass
(g/m2)
500 1000 1500 2000
r = 0.52
p < 0.001
Correlation between left ventricular mass
and aortic pulse wave velocity
150
London et al KI 1989
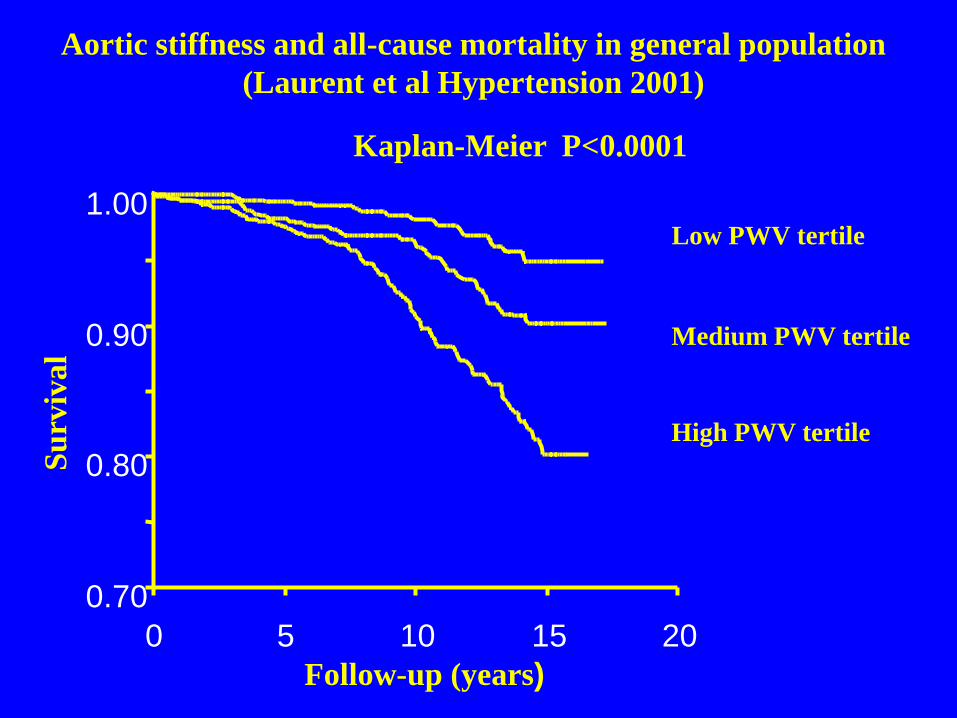
Aortic stiffness and all-cause mortality in general population
(Laurent et al Hypertension 2001)
0.70
0.80
0.90
1.00
0 5 10 15 20
Follow-up (years)
Su
rviv
al
Low PWV tertile
Medium PWV tertile
High PWV tertile
Kaplan-Meier P<0.0001
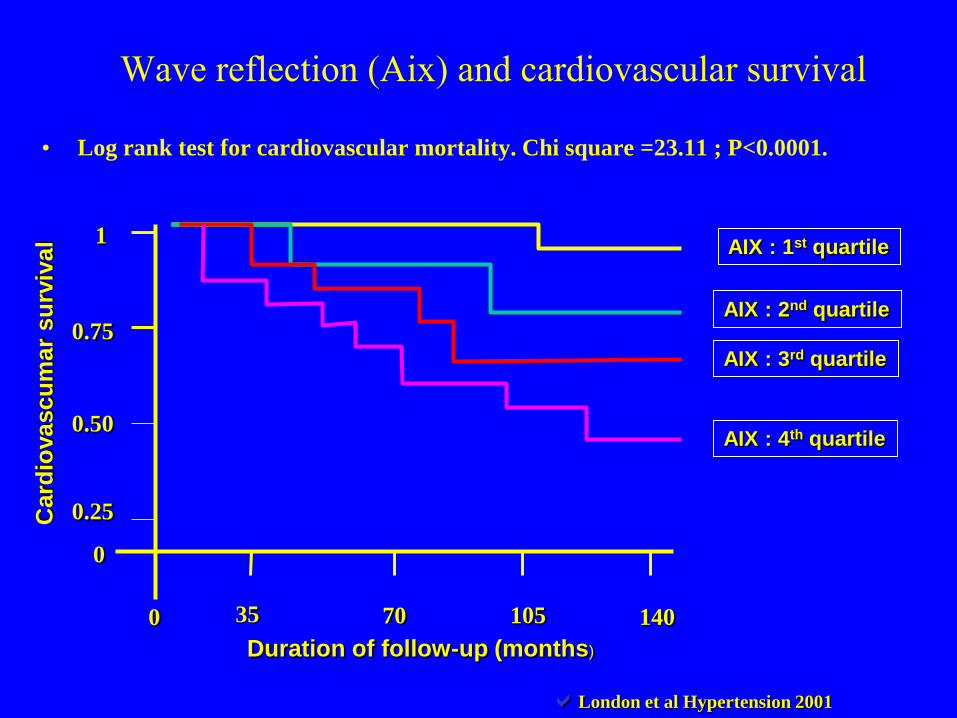
Wave reflection (Aix) and cardiovascular survival
• Log rank test for cardiovascular mortality. Chi square =23.11 ; P<0.0001.
AIX : 1st quartile
0.25
0.50
0.75
1
0
0 35 70 105 140
AIX : 2nd quartile
AIX : 3rd quartile
AIX : 4th quartile
Duration of follow-up (months)
Card
iovascu
mar
su
rviv
al
London et al Hypertension 2001
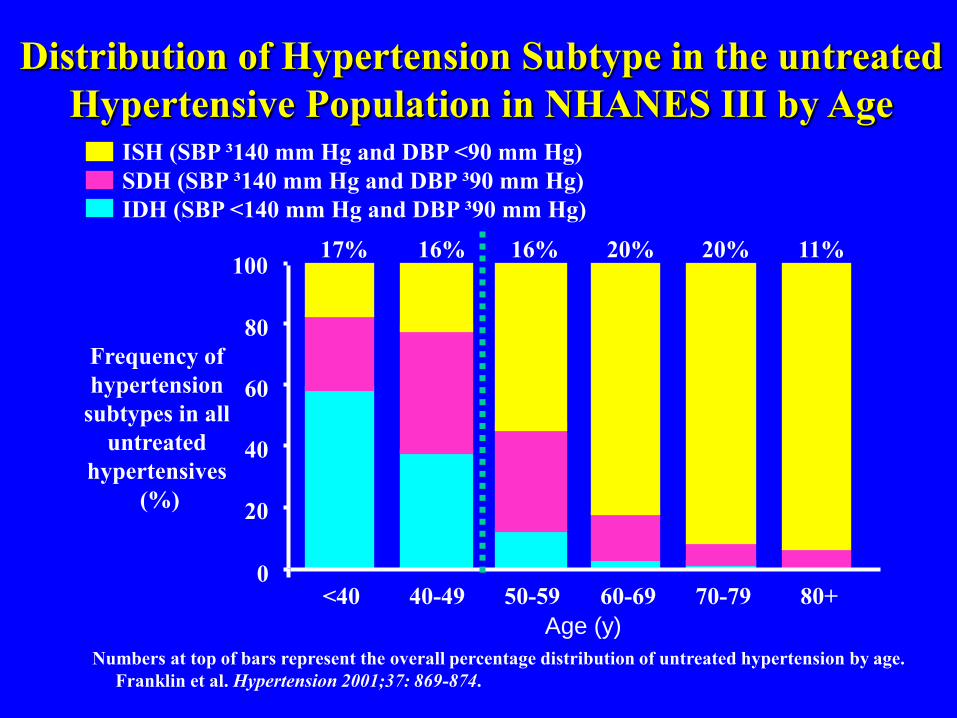
<40 40-49 50-59 60-69 70-79 80+
Age (y)
17% 16% 16% 20% 20% 11%
Distribution of Hypertension Subtype in the untreated
Hypertensive Population in NHANES III by AgeISH (SBP ³140 mm Hg and DBP <90 mm Hg)
SDH (SBP ³140 mm Hg and DBP ³90 mm Hg)
IDH (SBP <140 mm Hg and DBP ³90 mm Hg)
0
20
40
60
80
100
Numbers at top of bars represent the overall percentage distribution of untreated hypertension by age.
Franklin et al. Hypertension 2001;37: 869-874.
Frequency of
hypertension
subtypes in all
untreated
hypertensives
(%)
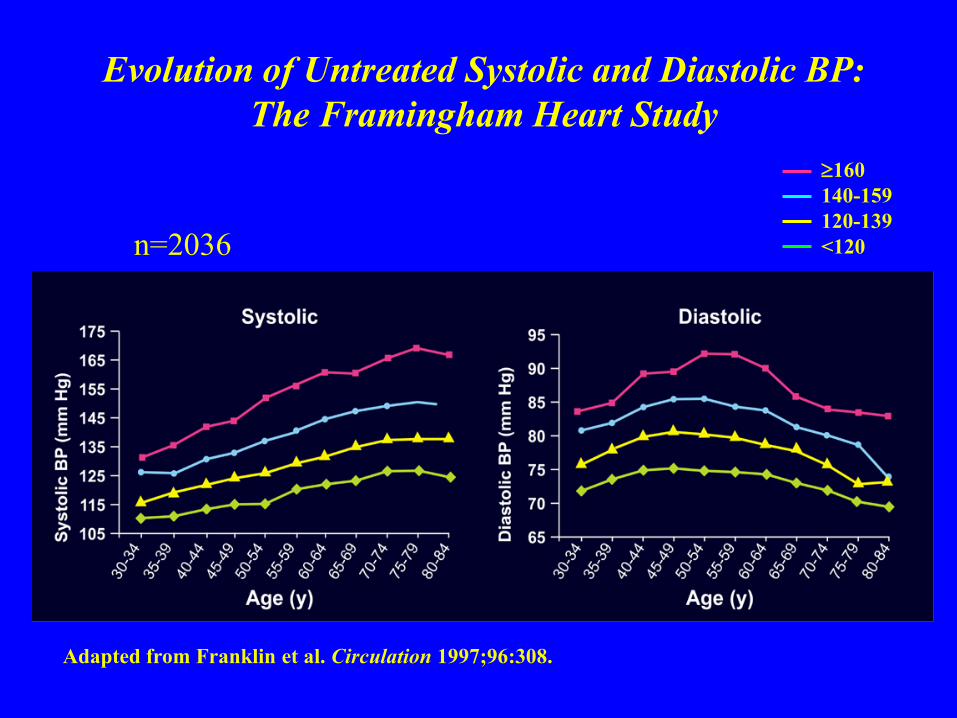
Evolution of Untreated Systolic and Diastolic BP:
The Framingham Heart Study
Adapted from Franklin et al. Circulation 1997;96:308.
n=2036
160
140-159
120-139
<120
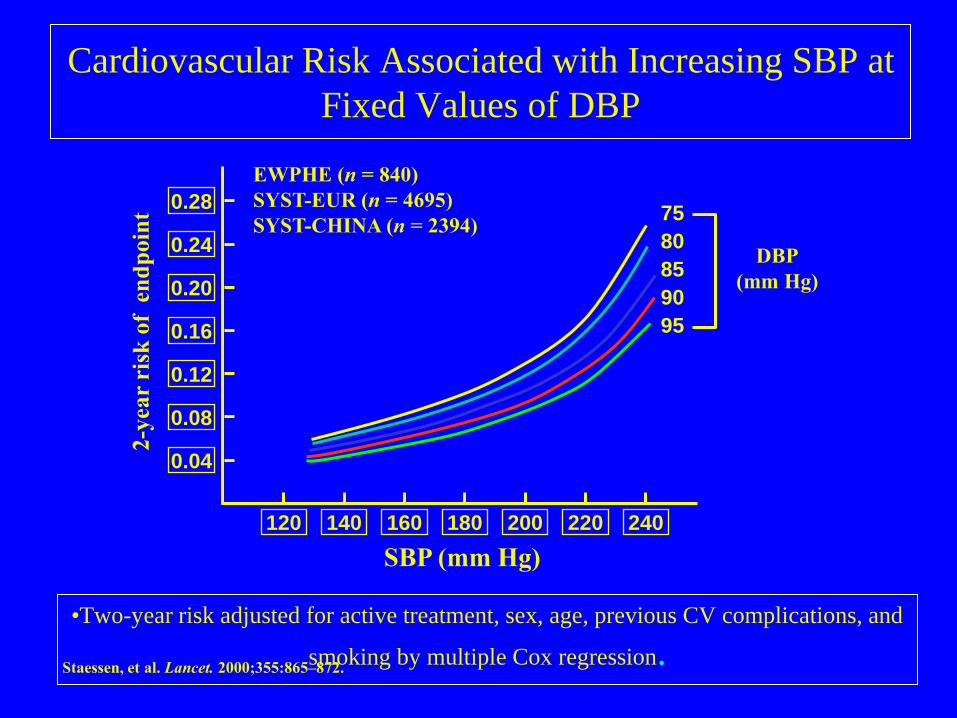
Cardiovascular Risk Associated with Increasing SBP at
Fixed Values of DBP
•Two-year risk adjusted for active treatment, sex, age, previous CV complications, and
smoking by multiple Cox regression.Staessen, et al. Lancet. 2000;355:865–872.
EWPHE (n = 840)
SYST-EUR (n = 4695)
SYST-CHINA (n = 2394)
SBP (mm Hg)
2-y
ear
risk
of
en
dp
oin
t
240220200180160140120
0.04
0.08
0.12
0.16
0.20
0.24
0.2875
80
85
90
95
DBP
(mm Hg)
Augmentation Index (%)
20
48
76
104
132
160
500 1000 1500 2000 2500
Aortic pulse wave velocity (cm/s)
Pu
lse
Pre
ssu
re (
mm
Hg
)
20
48
76
104
132
160
20 55 90 125 160
stroke volume (ml)
Pu
lse
Pre
ssu
re (
mm
Hg
)
20
48
76
104
132
160
-40 -15 10 35 60
Pu
lse
Pre
ssu
re (
mm
Hg
) R=0.47
p<0.0001
R=0.60
p<0.0001
R=0.15
p=0.035
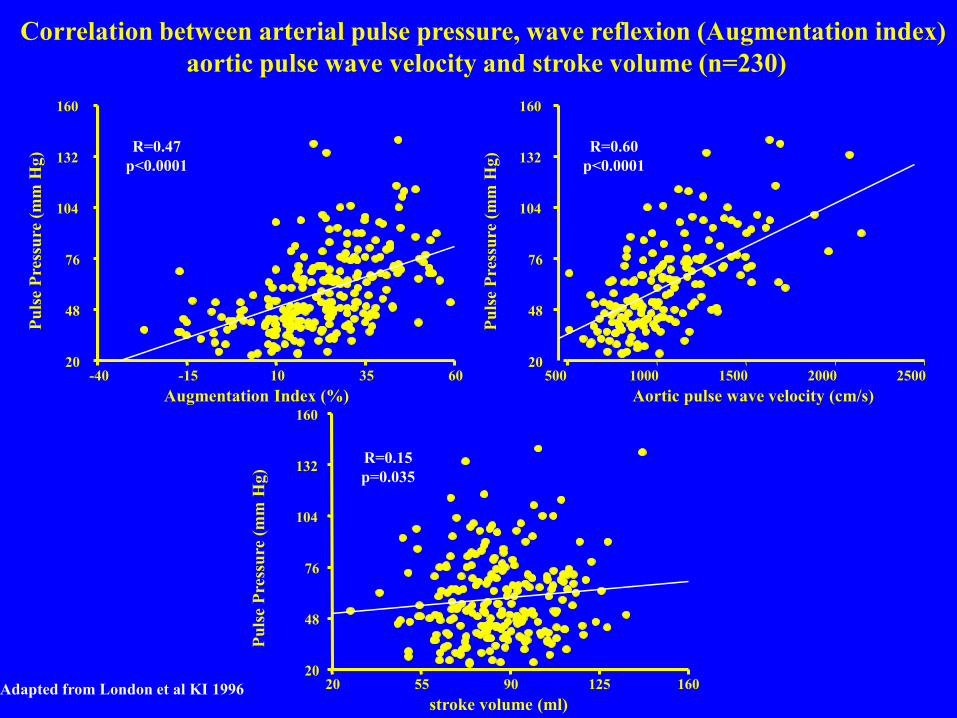
Correlation between arterial pulse pressure, wave reflexion (Augmentation index)
aortic pulse wave velocity and stroke volume (n=230)
Adapted from London et al KI 1996
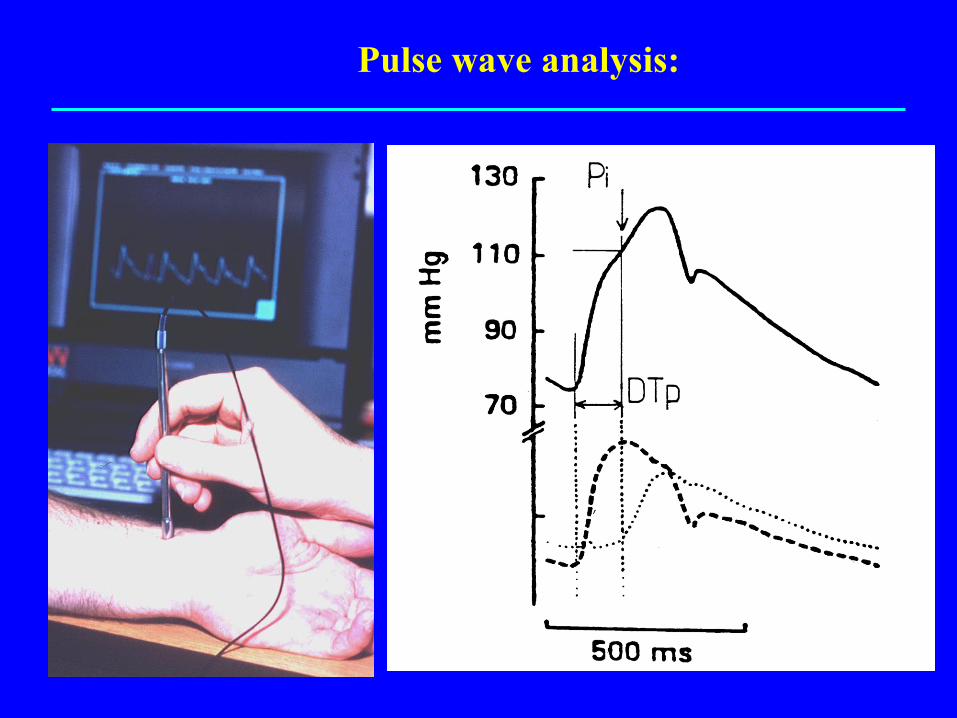
Pulse wave analysis:
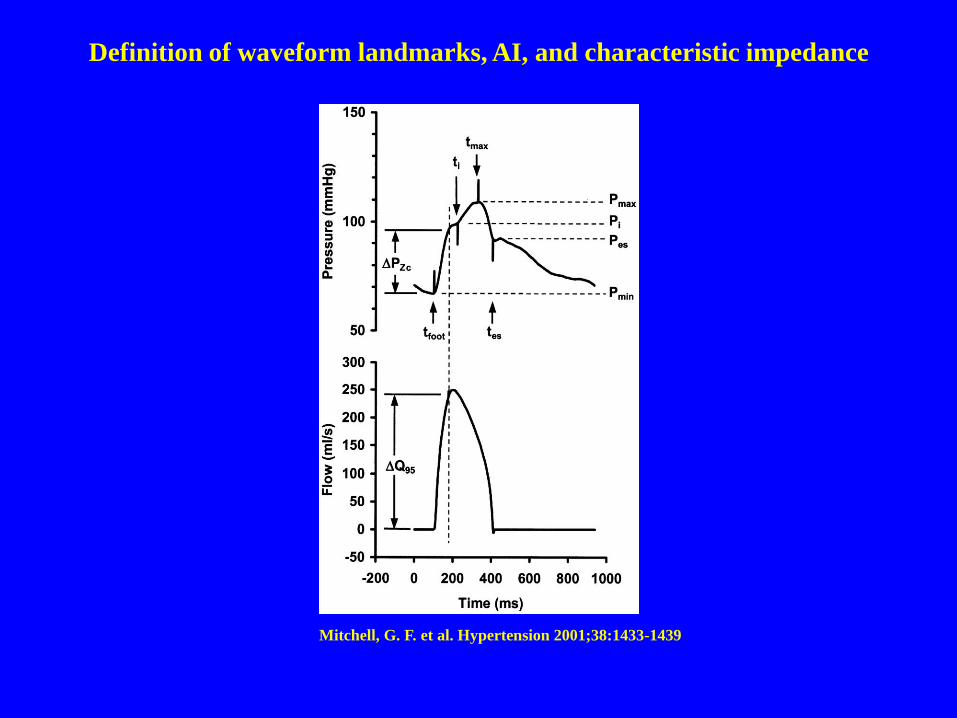
Mitchell, G. F. et al. Hypertension 2001;38:1433-1439
Definition of waveform landmarks, AI, and characteristic impedance
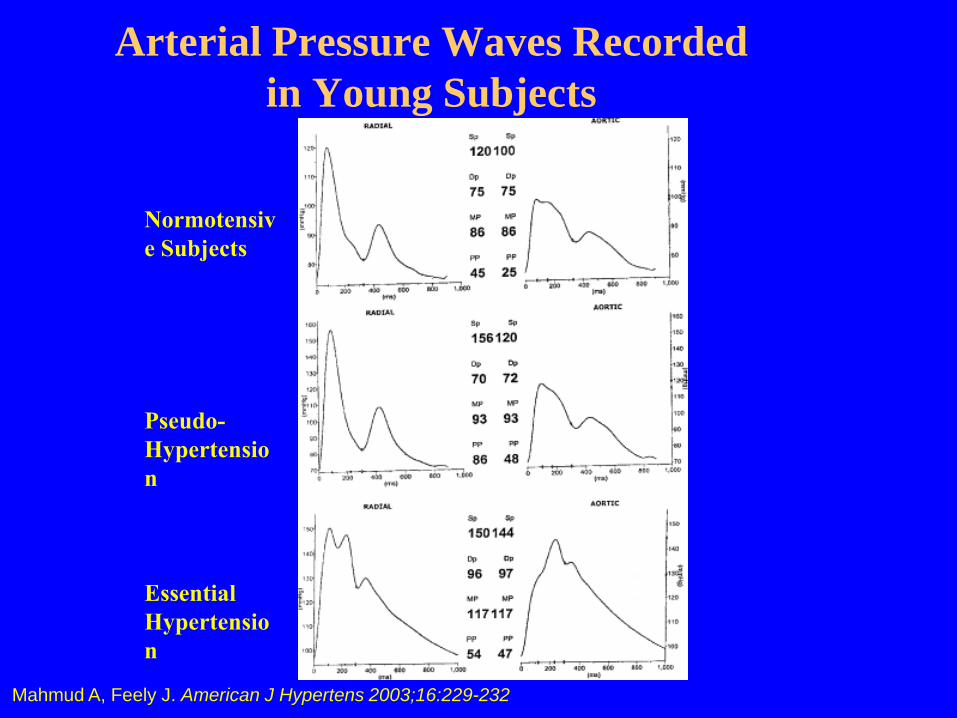
Arterial Pressure Waves Recorded
in Young Subjects
Normotensiv
e Subjects
Pseudo-
Hypertensio
n
Essential
Hypertensio
n
Mahmud A, Feely J. American J Hypertens 2003;16:229-232
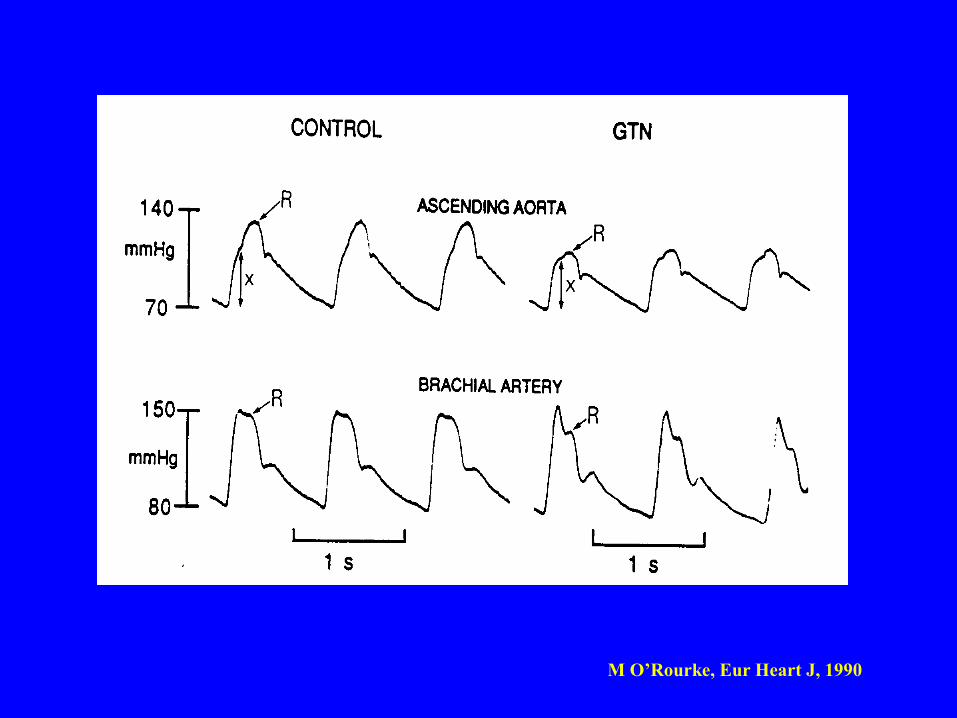
M O’Rourke, Eur Heart J, 1990
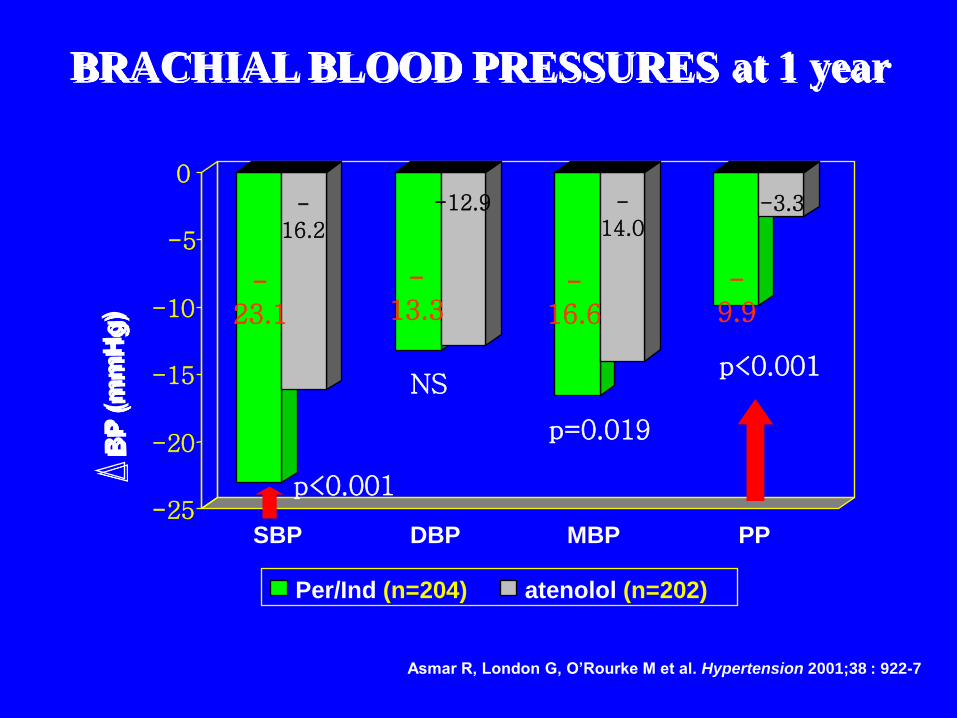
-25
-20
-15
-10
-5
0
SBP DBP MBP PP
Per/Ind (n=204) atenolol (n=202)
BRACHIAL BLOOD PRESSURES at 1 year
NSp<0.001
-23.1
-16.2
-13.3
-12.9
-16.6
-14.0
-9.9
-3.3
p=0.019
p<0.001
Asmar R, London G, O’Rourke M et al. Hypertension 2001;38 : 922-7
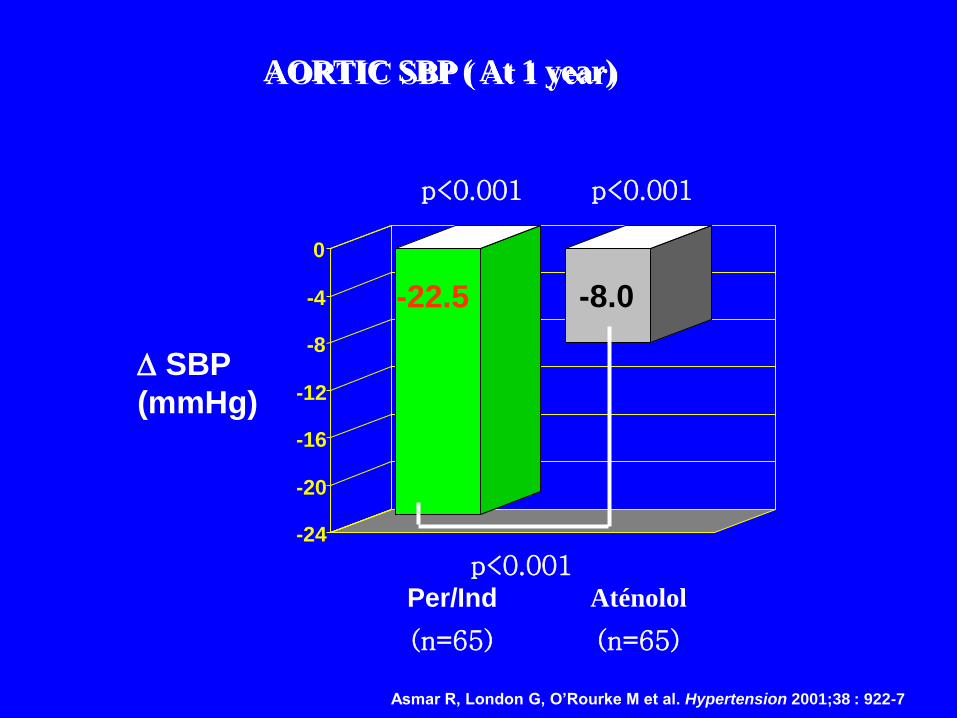
-24
-20
-16
-12
-8
-4
0
-22.5
SBP
(mmHg)
-8.0
Per/Ind
(n=65)
Aténolol
(n=65)
p<0.001 p<0.001
p<0.001
AORTIC SBP ( At 1 year)
Asmar R, London G, O’Rourke M et al. Hypertension 2001;38 : 922-7
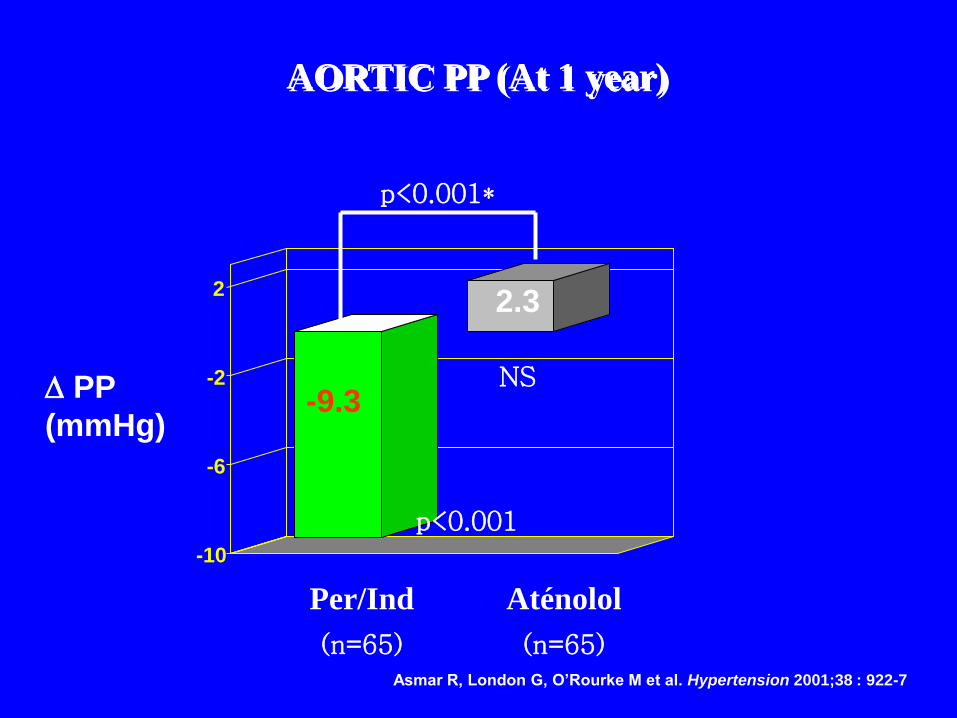
-10
-6
-2
2
-9.3 PP
(mmHg)
2.3
Per/Ind
(n=65)
Aténolol
(n=65)
p<0.001
NS
p<0.001*
AORTIC PP (At 1 year)
Asmar R, London G, O’Rourke M et al. Hypertension 2001;38 : 922-7
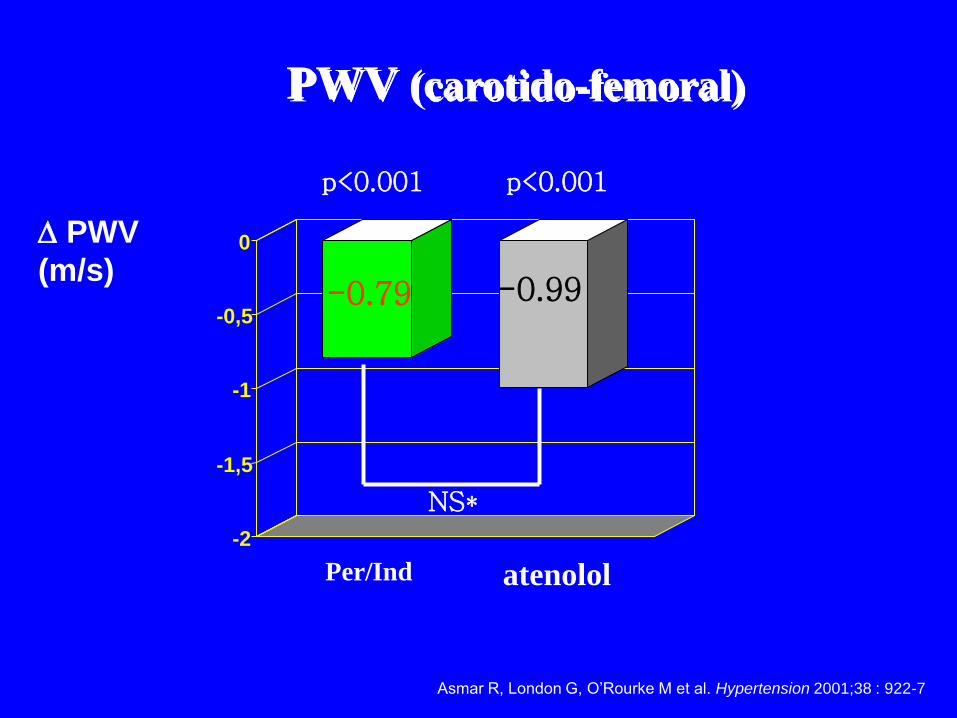
-2
-1,5
-1
-0,5
0
-0.79 -0.99
PWV
(m/s)
Per/Ind atenolol
p<0.001 p<0.001
NS*
PWV (carotido-femoral)
Asmar R, London G, O’Rourke M et al. Hypertension 2001;38 : 922-7
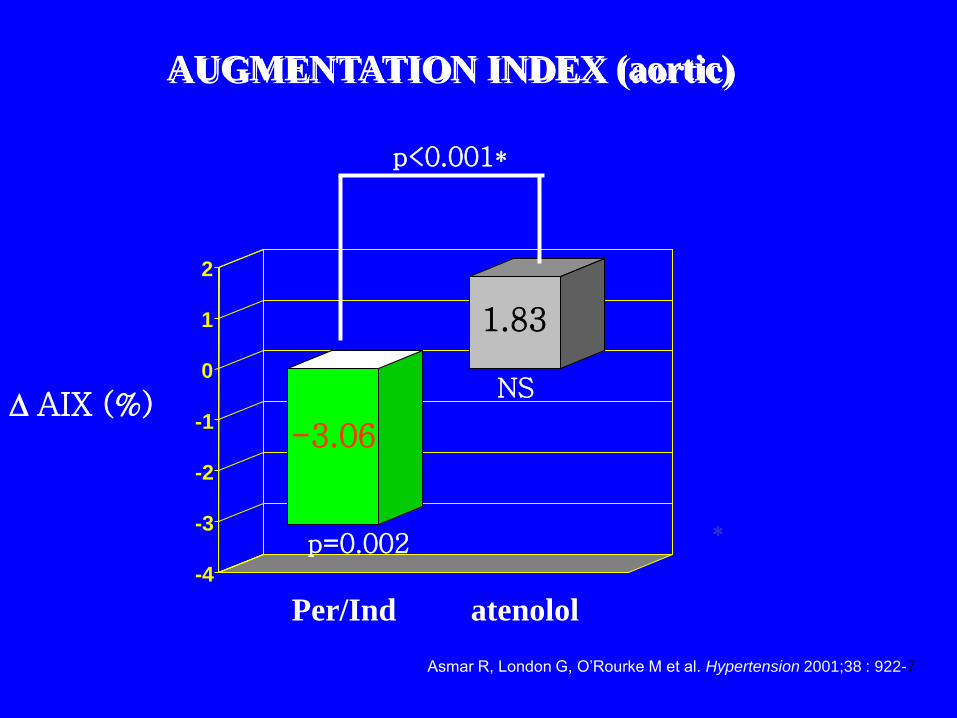
-4
-3
-2
-1
0
1
2
-3.06 AIX (%)
1.83
Per/Ind atenolol
p=0.002
NS
p<0.001*
*
AUGMENTATION INDEX (aortic)
Asmar R, London G, O’Rourke M et al. Hypertension 2001;38 : 922-7
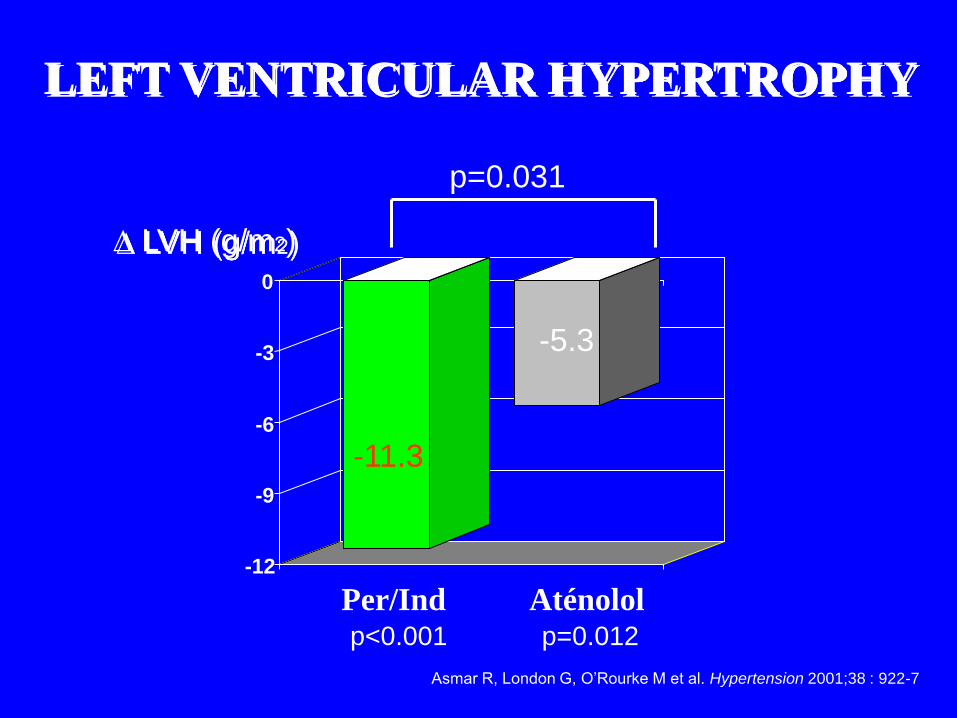
-12
-9
-6
-3
0
-11.3
LVH (g/m2)
-5.3
Per/Ind Aténololp<0.001 p=0.012
p=0.031
LEFT VENTRICULAR HYPERTROPHY
Asmar R, London G, O’Rourke M et al. Hypertension 2001;38 : 922-7
Arterial Impedance Gradients
Zc-characteristic impedance; Zr-peripheral resistance
Aorta Muscular arteriesResistance vessels
Pf P
tPb
Pf
Pb
Pt
( )
Zr - Zc
-Zr -Zc
+
=CoefficientReflection
Zc ZR
PWV=6 m/s PWV=10 m/s
PWV=12 m/s PWV=11 m/s