Embed Size (px)
Citation preview
Structure-activity relationship (SAR) in monosaccharide-based Toll-like receptor 4
(TLR4) antagonists
Fabio A. Facchini,a Lenny Zaffaroni,a Alberto Minotti,a Silvia Rapisarda,a Valentina
Calabrese,a Matilde Forcella,a Paola Fusi,a Cristina Airoldi,a Carlotta Ciaramelli,a Jean-
Marc Billod,b Andra Schromm,c Harald Braun,d Charys Palmer,e Rudi Beyaert,d Roman
Jerala,f Grisha Pirianov,e Sonsoles Martin-Santamaria,b Francesco Peria*
aDepartment of Biotechnology and Biosciences, University of Milano-Bicocca, Piazza della
Scienza, 2; 20126 Milano (Italy).
bDepartment of Structural & Chemical Biology, Centro de Investigaciones Biologicas, CIB-
CSIC. C/ Ramiro de Maeztu, 9. 28040-Madrid (Spain).
cDivision of Immunobiophysics, Research Center Borstel, Parkallee 1-40, 23845 Borstel
(Germany).
dVIB-UGent Center for Inflammation Research; UGent Department for Biomedical Molecular
Biology, Unit of Molecular Signal Transduction in Inflammation; Technologiepark 927 / 9052
Ghent / Belgium.
eAnglia Ruskin Cambridge University, UK.
fDepartment of Synthetic biology and Immunology Kemijski institute; National Institute of
Chemistry; Hajdrihova 19 SI-1000 Ljubljana; Slovenija / Slovenia.
1
Abstract
The structure-activity relationship was investigated in a series of synthetic TLR4 antagonists
formed by a glucosamine core linked to two phosphate esters and two linear carbon chains.
Molecular modeling showed that the compounds with 10, 12 and 14 carbons chains are
associated to higher stabilization of the MD-2/TLR4 antagonist conformation than in the case of
the C16 variant. Binding experiments with human MD-2 showed that the C12 and C14 variants
have higher affinity than C10, while the C16 variant did not interact with the protein.
The molecules, with the exception of the C16 variant, inhibited the LPS-stimulated TLR4 signal
in human and murine cells and the antagonist potency mirrored the MD-2 affinity calculated
from in vitro binding experiments. FT-IR, NMR, and SAXS measurements suggested that the
aggregation state in aqueous solution depends on fatty acid chains lengths and that this property
can influence TLR4 activity in this series of compounds.
2
Introduction
TLRs are pattern recognition receptors (PRR) that recognize pathogen-associated molecular
patterns (PAMPs). TLR4 is mainly expressed on haematopoietic cells including monocytes,
dendritic cells and macrophages.1 Lipopolysaccharide (LPS), lipooligosaccharide (LOS) and
lipid A from Gram-negative bacteria are generally called endotoxin and are powerful TLR4
agonists.2 TLR4 responds rapidly to minute amounts of circulating LPS through and multistep
molecular recognition process, initiated by transfer of LPS monomers from aggregates in
solution to LPS-binding protein (LBP), and subsequently to cluster of differentiation 14 (CD14),
and to myeloid differentiation factor 2 (MD-2). MD-2 is associated with TLR4 in MD-2/TLR4
complexes on cell membrane. In the absence of agonist, the complex TLR4/MD-2 is in
equilibrium between monomeric and dimeric species. Recent quantitative single-molecule
localization microscopy (SMLM) studies3 have shown that LPS binding to MD-24 displaces the
equilibrium towards homodimeric complexes (TLR4/MD-2/LPS)2.3,5 The homodimer transmits
the signal downstream through two distinct pathways. One pathway starts by recruitment of
myeloid differentiation primary response gene 88 (MyD88) and adapter myelin and lymphocyte
protein (MAL) (MyD88-dependent pathways and production of a number of pro-inflammatory
proteins), the other by the activation of TIR-domain-containing adapter-inducing interferon-γ
(TRIF) (MyD88-independent pathways and production of interferons).6
In addition to bacterial PAMPs, TLR4 can be also activated by damage-associated molecular
patterns (DAMPs), endogenous agonists responsible for sterile inflammation, such as
fibronectins7, saturated palmitic acid,8 oxidized phospholipids9 or high-mobility group box 1
3
(HMGB1) protein10 have also been shown to activate TLR4. While different LPS chemotypes
share a conserved lipid A moiety with chemical determinants that ensure optimal interaction with
CD14 and MD-2 (5 or 6 lipophilic fatty acid chains attached to a disaccharide backbone, and one
or two phosphate groups) DAMPs are chemically diverse molecules and the molecular
mechanism of TLR4 activation including the role of CD14 and MD-2 in the sensing of these
molecules are not entirely understood. DAMPs have been implicated in many pathologies caused
by TLR4 activation including atherosclerosis11, rheumatoid arthritis,12 neuroinflammation13,
trauma14 and hemorrhage.15
These findings strongly support the idea that regulation of TLR4 activity appears as a potential
target for therapeutic control of a variety of inflammatory-based diseases. Manipulation of
TLR4-mediated immune responses as a potential approach for pharmacological intervention has
been reported in the literature.16 For the last few years several TLR4 antagonists have been
evaluated in preclinical studies but only two drugs, E556417 (Eritoran, Eisai Inc.) and TAK-24218
(Takeda Biological) progressed to clinical trials for treatment of sepsis, which have been
discontinued in different phases.19, 20
Efficient and selective TLR4 antagonists with a chemical structure simpler than lipid A are the
basis for development of novel TLR4 modulators. Lipid A consists of a 1,4-diphosphorylated di-
glucosamine backbone to which variable lengths and numbers of fatty acid (FA) acyl chains are
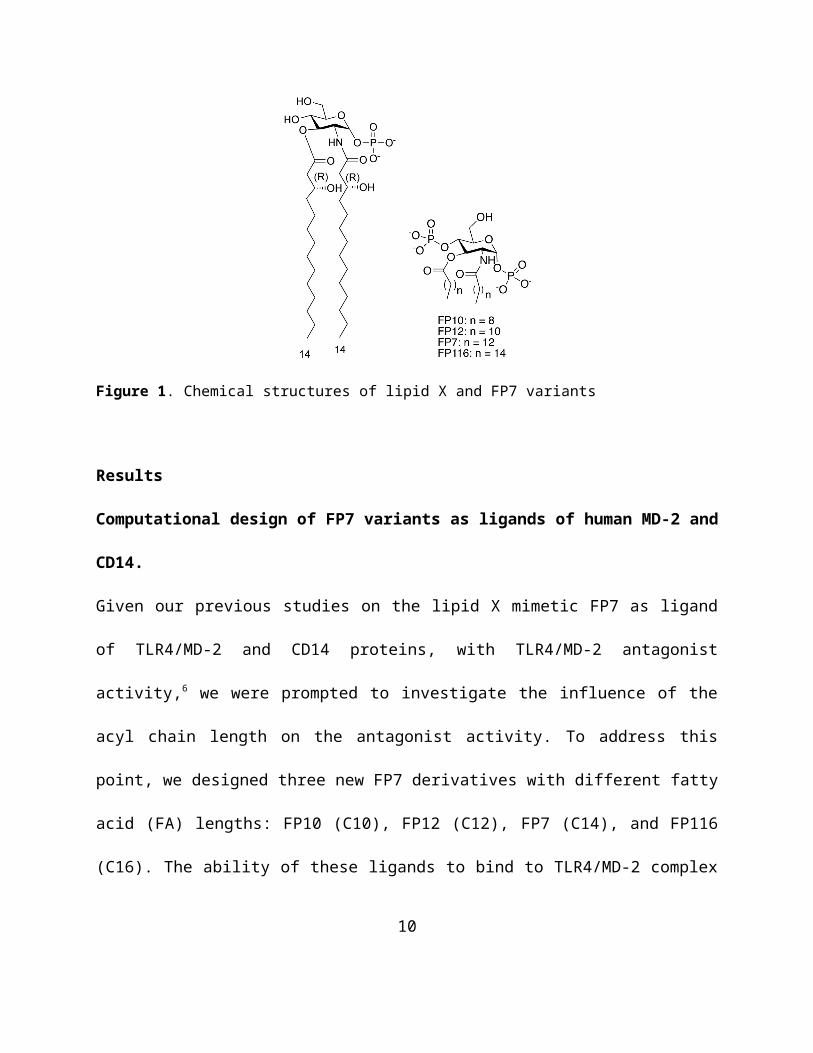
covalently linked.2 Lipid X (Figure 1)21, a biosynthetic precursor of lipid A with TLR4 antagonist
activity, has been considered a simplified monosaccharide scaffold for the development of novel
TLR4 modulators.
Our group developed the lipid X mimetic FP76, a glucosamine derivative with two phosphate
4
groups and two myristic (C14) fatty acid (FA) chains, whose design was inspired by other
glucosamine-based TLR4 modulators.22-24 FP7 is active in inhibiting in a dose-dependent way
human6 and murine25 TLR4 activation by LPS. Some preliminary observations from NMR
experiments suggest that FP7 interact with MD-2, probably inserting FA chains into hydrophobic
binding cavity.6 This direct competition with LPS for MD-2 binding is probably reinforced by
the capacity of FP7 to induce endocytosis of CD14 thus causing the absence of this receptor on
the plasma membrane.6 FP7 is active in blocking PR8 virus lethality that is mainly due to TLR4
over-stimulation by endogenous DAMPs (mainly oxidized phospholipids and HMGB-1 protein)
derived from viral damage to lung tissue.25 In a proof-of-concept experiments in support of this
in vivo mechanism, FP7 inhibited HMGB-1 activation of dendritic cells.25 Other
monosaccharide-based TLR4 modulators were developed and structure-activity relationship
(SAR) studies showed that the length of FA chain is a critical factor determining the potency of
TLR4 antagonism or agonism.22, 26 The biological activity and the agonist/antagonist behavior on
TLR4 of lipid A variants and other amphiphilic glycolipids including FP7 is not only determined
by the interaction with MD-2 but also by the aggregation state in solution. As LPS and lipid A,
FP7 is an anionic amphiphile with a low value of CMC (9 μM)6. Even though the CMC value of
FP7 is higher than its IC50 (about 2 μM in HEK cells assays), equilibrium between aggregates
and single molecules in solution is present in the concentration range in which FP7 is active.
It has been proposed for lipid A derivatives that the size and the 3D shape of aggregates
influences the TLR4 activity, lamellar aggregates being associated to antagonism and aggregates
with non-lamellar cubic symmetry to agonism.27,28 While the last step of ligand presentation to
5
TLR4 and formation of the activated heterodimer (TLR4/MD-2/ligand)2 are dominated by single
molecule interactions between the ligand and CD14 and MD-2 receptors29, the early phases of
endotoxin (ligand) recognition by LBP are very likely influenced by the aggregation state of the
ligand.
We present here a structure-activity relationship (SAR) study on synthetic FP7 variants differing
only for FA chains lengths (10, 12, 14 and 16 carbon atoms, Figure 1). In this study we will take
into account both the interaction with MD-2 and the aggregation properties of the molecules.
Additionally, we show the relationship between the chemical structure of FP7 variants with
different fatty acid chains lengths and their effect on functional activity of TLR4 in different in
vitro cell models.
Figure 1. Chemical structures of lipid X and FP7 variants
Results
Computational design of FP7 variants as ligands of human MD-2 and CD14.
Given our previous studies on the lipid X mimetic FP7 as ligand of TLR4/MD-2 and CD14
6
proteins, with TLR4/MD-2 antagonist activity,6 we were prompted to investigate the influence of
the acyl chain length on the antagonist activity. To address this point, we designed three new FP7
derivatives with different fatty acid (FA) lengths: FP10 (C10), FP12 (C12), FP7 (C14), and
FP116 (C16). The ability of these ligands to bind to TLR4/MD-2 complex and to CD14,
compared with FP7, was initially assessed through various computational techniques.
We firstly docked the ligands in the binding site of CD14 using AutoDock Vina. For all the four
ligands, docked poses inside the hydrophobic pocket were found. The obtained binding poses
were very similar for all the ligands (Figure S1A) with also very close favorable predicted
binding energies for the top poses (range from -6.5 kcal mol-1 to -5.9 kcal mol-1). Therefore, the
docking calculation showed that all four ligands are theoretically able to interact with CD14
inside its hydrophobic pocket and to engage in favorable interactions. In the most populated and
most favorable docked poses, one phosphate group is interacting with the NH groups of Arg72
and Val73, and with the OH group of Tyr82 (Figure S1B), while the other phosphate group is
exposed to the solvent. The FA chains are accommodated inside the hydrophobic pocket of
CD14 interacting with aliphatic residues, mainly Ala, Val, Leu, and Ile residues, and aromatic
Phe49 (details are depicted in Figure S1C). The results were in agreement with previous docking
studies of FP7 reported by us.30
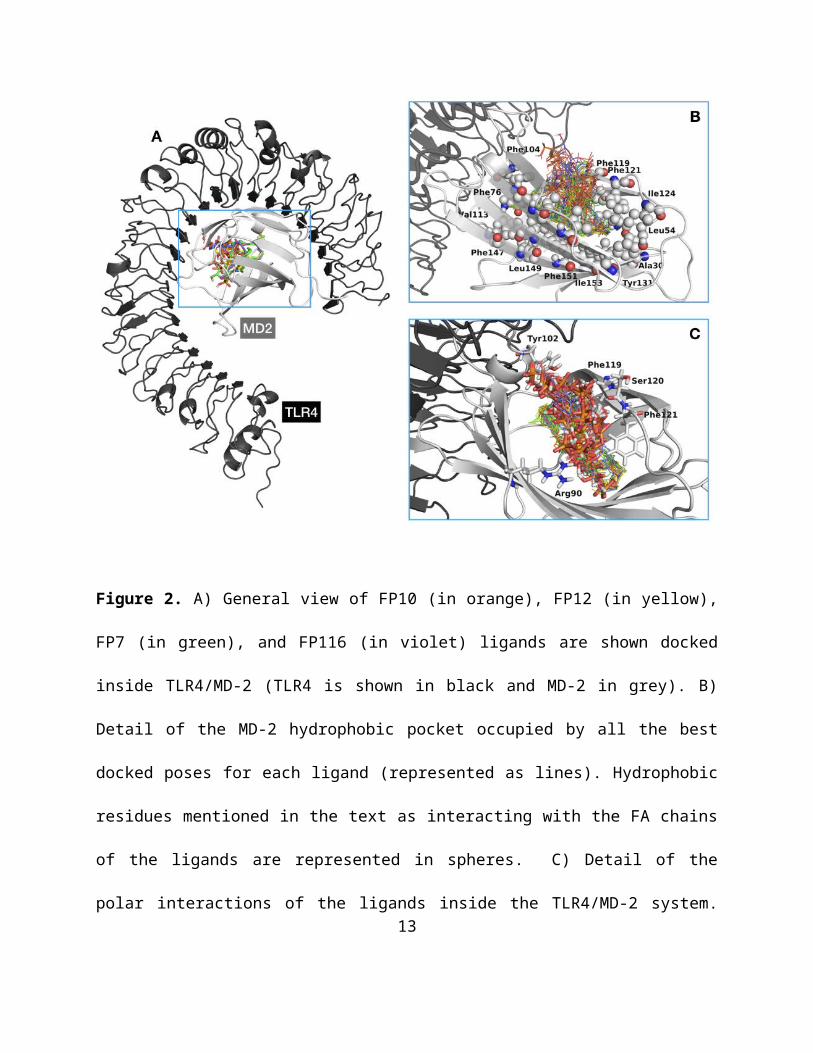
We performed the docking calculations of ligands FP7, FP10, FP12 and FP116 inside the
TLR4/MD-2 complex in the antagonist conformation (Figure 2). For all the compounds,
favorable docked poses were found, with predicted binding energies, for the best ones, ranging
from -7.8 to -6.5 kcal mol-1. The polar head groups are placed at the rim of MD-2 and the FA
chains go deep inside the hydrophobic pocket interacting with many hydrophobic residues,
7
namely Val24, Ala30, Ile32, Ile44, Ile46, Val48, Ile52, Leu54, Leu61, Ile63, Tyr65, Phe76,
Leu78, Ile80, Phe104, Val113, Ile117, Phe119, Phe121, Ile124, Tyr131, Val135, Phe147,
Leu149, Phe151, and Ile153 (Figure 2B).
Figure 2. A) General view of FP10 (in orange), FP12 (in yellow), FP7 (in green), and FP116 (in
violet) ligands are shown docked inside TLR4/MD-2 (TLR4 is shown in black and MD-2 in
grey). B) Detail of the MD-2 hydrophobic pocket occupied by all the best docked poses for each
ligand (represented as lines). Hydrophobic residues mentioned in the text as interacting with the
8
FA chains of the ligands are represented in spheres. C) Detail of the polar interactions of the
ligands inside the TLR4/MD-2 system. Phosphate groups of the best docked poses of each ligand
and the MD-2 residues with which they interact are represented in sticks.
Additionally, it was possible to observe more diversity in the predicted binding poses in
TLR4/MD-2 than in the case of CD14. Results for FP7 were in agreement with those previously
reported in MD-2 protein.6 In many poses, one of the phosphate groups was close to the hydroxyl
group of MD-2 Tyr102 where it establishes hydrogen bonds, and the other one was often close to
MD-2 Arg90 establishing hydrogen bonds and electrostatic interactions (Figure 2C). In some
docked poses, the phosphate groups were observed to interact with the backbone of residues
Phe119, Ser120, and Phe121. Both phosphate groups were often placed at the rim of MD-2
where they are exposed to the solvent, in agreement with the reported X-ray crystallographic
complexes of TLR4/MD-2 with glycolipids (for example, complex with Eritoran, PDB-ID 2Z65,
or with lipid IVa, PDB-ID 2E59). Two different orientations were also found: type A
(antagonist-like binding mode), similar to that found for lipid IVa in PDB-ID 2E59; and type B
(agonist-like binding mode), similar to that found for E. coli lipid A in PDB-ID 3FXI (Figure
S2). It is well known that these two ligands, lipid IVa and E. coli lipid A, bind to TLR4/MD-2 in
a different manner, one being rotated 180° compared to the other one, leading to opposed
biological activities.
Selected binding poses were used as starting structures for re-docking with AutoDock4 resulting
in predicted binding energies ranging from -4.6 kcal mol-1 to +4.3 kcal mol-1. Among the docked
solutions, the best poses (from -4.6 kcal mol-1 to -2.5 kcal mol-1) corresponded to binding poses
9
very similar to those obtained with AutoDock Vina (data not shown). The narrow binding energy
range did not permit to rank the ligands by predicted affinity, showing that the four ligands are
putative binders of the TLR4/MD-2 system. Given that the main interactions (the polar ones) are
common to the four ligands, and that the MD-2 pocket is big enough to host two longer FA
chains, from the docking calculations it was not possible to clearly correlate the subtle
differences in FA chain length with preferred ligand binding.
Stability of the predicted TLR4/MD-2/ligand complexes was further studied by molecular
dynamics (MD) simulations. We selected two of the best binding poses for each ligand (Figure
S3): one type A (antagonist-like binding pose), and one type B (agonist-like binding pose), plus
two additional poses for compounds FP10 and FP7. Therefore, a total of eight 50 ns MD
simulation were run. We monitored the motion of MD-2 over time and examined the RMSD and
RMS fluctuation per residues, as well as the motion of Phe126 side chain over time (Figure S4).
All the complexes showed stable ligand-receptor interactions along the MD simulation time as
predicted by the docking calculations. In particular, in the MD simulation of the
TLR4/MD-2/FP7 complex in the type A (antagonist-like) binding pose, the Phe126 side chain
moves around its initial position staying largely exposed to the solvent in a conformation in
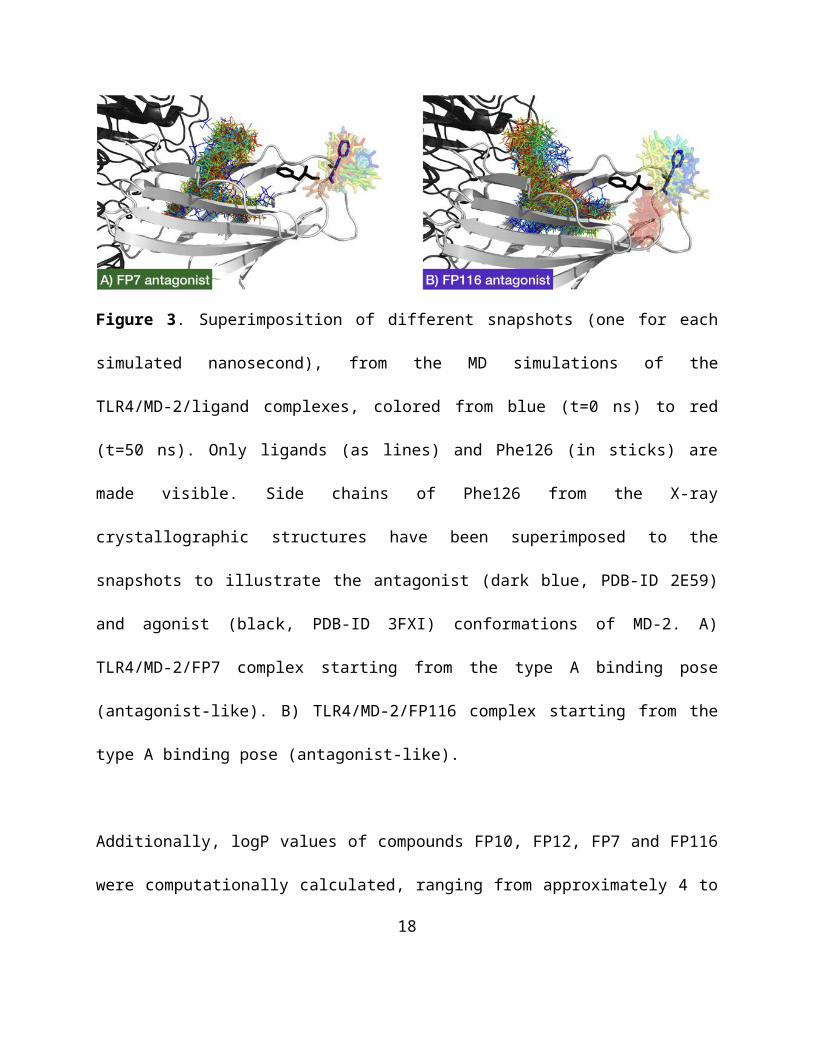
agreement with the X-ray crystallographic antagonist conformation of MD-2 (Figure 3A).
To evaluate the relative orientation between the ligands and MD-2, we arbitrarily defined two
vectors, one from the amide -carbon atom to the ester -carbon atom of the ligand, and another
one from the -carbon of residues Pro78 to Thr105 of MD-2 (Figure S5A). The angle between
these two vectors was plotted both over time and as a percentage of frames per 0.1 degree angle
range (Figure S6). It was observed that none of the ligands undergoes orientation flip during the
10
50ns simulations, all remaining in the orientation from the docking process. Interestingly, only in
the case of the TLR4/MD-2/FP116 complex with FP116 in the type A (antagonist-like) binding
pose, the orientation of Phe126 side chain flips over (Figure 3B). We monitored this flipping
behavior along the MD simulations, for all the ligands, by arbitrary choosing two vectors, within
MD-2, both starting from the -carbon of residue Phe126 to, respectively, the phenyl C-4 atom of
the same residue and the -carbon of residue Ser21 (data shown in SI figure S5B and S7). This
observation could suggest that FP116 is not able to efficiently retain an antagonist conformation
of MD-2, thus pointing to a poor antagonist capacity.
Figure 3. Superimposition of different snapshots (one for each simulated nanosecond), from the
MD simulations of the TLR4/MD-2/ligand complexes, colored from blue (t=0 ns) to red (t=50
ns). Only ligands (as lines) and Phe126 (in sticks) are made visible. Side chains of Phe126 from
the X-ray crystallographic structures have been superimposed to the snapshots to illustrate the
antagonist (dark blue, PDB-ID 2E59) and agonist (black, PDB-ID 3FXI) conformations of MD-
2. A) TLR4/MD-2/FP7 complex starting from the type A binding pose (antagonist-like). B)
TLR4/MD-2/FP116 complex starting from the type A binding pose (antagonist-like).
Additionally, logP values of compounds FP10, FP12, FP7 and FP116 were computationally
11
calculated, ranging from approximately 4 to 10 with a linear distribution (Figure S8). The highest
logP value was obtained for FP116 indicating a high lipophilicity that might result in low water
solubility. This was in agreement with the lower acyl chain mobility as analysed by FT-IR
spectroscopy (see below). In any case, this did not interfere with the performance of the cell
assays. Summarizing, the computational studies assessed the ability of ligands FP7, FP10, FP12,
and FP116 to bind both CD14 and TLR4/MD-2, pointing to the long FP116 acyl chain (C16) as
the maximum length bordering good (predicted) binding properties. The compounds were
therefore synthesized and tested.
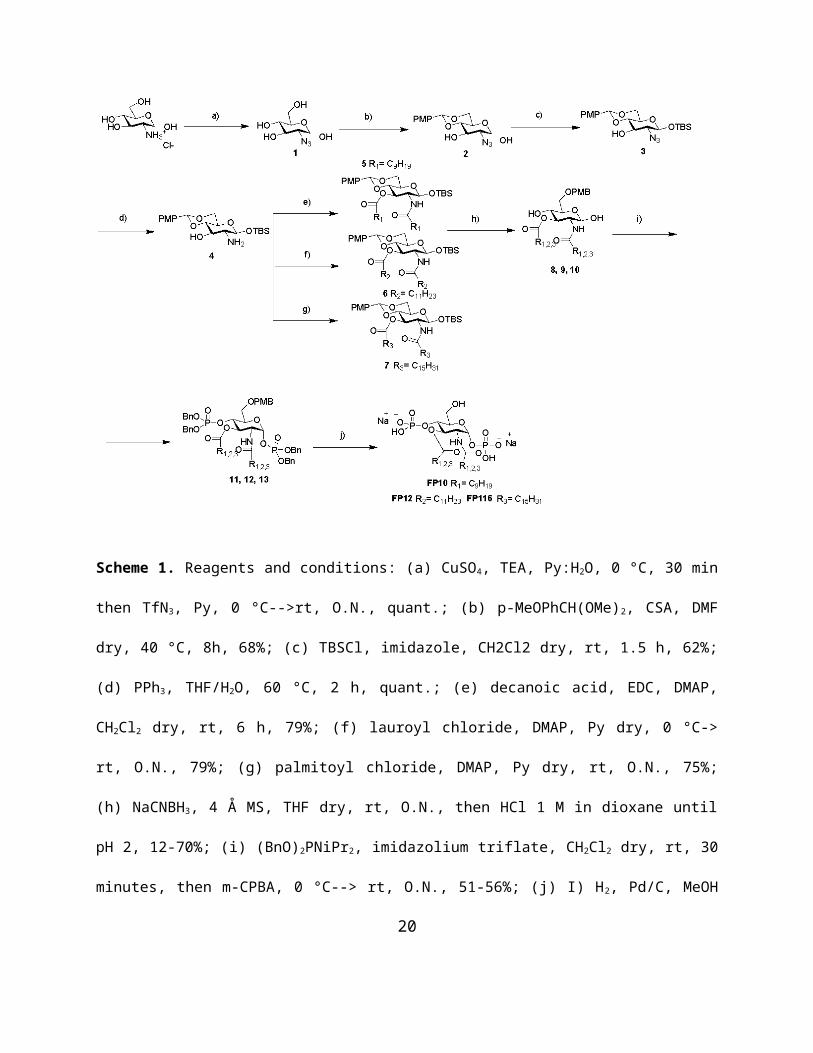
Synthesis of FP variants
Compounds FP7, FP10, FP12, and FP116 were synthesized according to a divergent synthetic
strategy starting from the common precursor 4 (Scheme 1).
12
Scheme 1. Reagents and conditions: (a) CuSO4, TEA, Py:H2O, 0 °C, 30 min then TfN3, Py, 0 °C-->rt,
O.N., quant.; (b) p-MeOPhCH(OMe)2, CSA, DMF dry, 40 °C, 8h, 68%; (c) TBSCl, imidazole, CH2Cl2
dry, rt, 1.5 h, 62%; (d) PPh3, THF/H2O, 60 °C, 2 h, quant.; (e) decanoic acid, EDC, DMAP, CH2Cl2 dry,
rt, 6 h, 79%; (f) lauroyl chloride, DMAP, Py dry, 0 °C-> rt, O.N., 79%; (g) palmitoyl chloride, DMAP, Py
dry, rt, O.N., 75%; (h) NaCNBH3, 4 Å MS, THF dry, rt, O.N., then HCl 1 M in dioxane until pH 2, 12-
70%; (i) (BnO)2PNiPr2, imidazolium triflate, CH2Cl2 dry, rt, 30 minutes, then m-CPBA, 0 °C--> rt, O.N.,
51-56%; (j) I) H2, Pd/C, MeOH dry/CH2Cl2 dry, rt, O.N., II) Et3N, III) IRA 120 H+ resin, IV) IR 120 Na+,
84%-quant.
Commercially available D-glucosamine hydrochloride was converted into the intermediate 4 by
subsequent protection of C-4 and C-6 positions as p-methoybenzylidene and the anomeric (C-1)
position as tert-butyldimethylsislyl (TBDMS) ether.6 Intermediate 4 was then acylated in
positions C2 and C3 according to three different procedures, obtaining monosaccharides 8, 9,
and 10 with, respectively, C10, C12 and C16 carbon FA chains. Compound FP7, with C14
chains, was obtained similarly following a published procedure.6 Regioselective p-
methoxybenzylidene ring opening as p-methoxybenzyl (PMB) ether in C-6, followed by
phosphorylation of free hydroxyls in positions C1 and C4, and final deprotection of PMB ethers
gave final compounds as triethylammonium ions. Exchange of triethylamonium with sodium
(IR120 Na+ ion exchange resin) followed by reverse-phase purification gave final compounds
FP10, FP12 and FP116 with a purity ≥ 95%.
Aggregation properties of FP compounds
FT-IR studies
13
The mobility of the acyl chains is an important biophysical parameter of aggregated lipids.
Biological lipids typically show a temperature-dependent phase transition from a highly ordered
gel (Lβ) phase of the hydrocarbon chains at low temperatures (indicated by an absorption peak
around 2850 cm-1) to a liquid-cystalline (Lα) phase at higher temperatures (indicated by a
absorption peak around 2852 cm-1). The phase transition temperature (Tc) is characteristic of the
chemical structure of the lipids. The FP compounds were analyzed by FT-IR spectroscopy to
determine the lipid phase in dependence of temperature. FP compounds with shorter acyl chains
(FP10, C10 and FP12, C12) were found to be in a fluid Lα phase with high mobility of their acyl
chains at all temperatures. FP compounds with a longer acyl chains (FP7, C14 and FP116, C16)
showed a biphasic behavior with a clear Lβ to Lα phase transition with Tc around 28.5 °C for
FP7 and around 40.2 °C for FP116 (Figure 4). Notably, the main phase transition of FP116 at
40.2 °C occurs along a broad temperature range and a second phase transition is observed around
65 °C. Thus, at a biological relevant temperature of 37 °C, FP10, FP12, and FP7 exhibit a fluid
membrane phase, whereas FP116 is still in a rigid membrane phase and requires much higher
temperatures for acyl chain melting to occur.
14
Figure 4. Acyl chain mobility of the aggregated FP compounds in dependence on temperature.
The infrared absorption around wavenumbers 2850 - 2852 cm−1 corresponds to the symmetric
stretching vibrations νs of the CH2 groups of the acyl chains. The wavenumbers indicated were
derived from the peak absorption of νs(CH2) determined upon constant heating of the samples.
Data are representative of two independent measurements.
NMR studies
The comparison of the 1H NMR spectra recorded after compound dissolution in phosphate
buffer, pH 7.4, 25 °C (Figure S9) suggested a different aggregation state of the bioactive
compounds in solution in the µM concentration range. The 1H NMR spectrum acquired on a 100
µM FP7 sample (Figure S9A) clearly showed the presence of two set of signals, as can be
deduced by observing the spectral region between 5.5 and 5.2 ppm. In addition to a doublet of
15
doublet and a triplet, corresponding to H1 and H3 protons (*), also two broad resonances (§) are
present that can be assigned to aggregated species. This hypothesis was supported by the
comparison of spectrum S9A with FP7 spectra recorded at higher concentrations, in particular
125 µM (Figure S9B) and 250 µM (Figure S9C), where the gradual decrease in sharp signal (*)
intensity is associated with the increase of the broad resonance (§) ones, as expected as a
consequence of FP7 aggregation. A further confirmation was achieved through the acquisition of
relaxation-edited (Figure S9D) and diffusion-edited (Figure S9E) spectra, employed to partially
filter out resonances from high molecular weight and low molecular weight species
respectively.31, 32 Indeed, the spectrum acquired with the CPMG sequence (Figure S9D), edited
on the basis of relaxation times and thus highlighting the signals from low molecular weight
species, showed a decrease of broad signal (§) intensities compared to spectrum S9C; on the
contrary, in the diffusion-edited spectrum (Figure S9E), whose parameters were set up to erase
resonances from low molecular weight compounds, sharp resonances (*) disappeared. We can
conclude that, under our experimental condition, FP7 was present in solution as a mixture of
monomer/small aggregates and higher aggregated species (micelles), whose equilibrium changes
coherently to the variation of the nominal concentration of the molecule.
Instead, only one set of sharp signals was observed in the 1H NMR spectra recorded on FP10 and
FP12 solutions containing the compounds in the concentration range 100 µM - 1 mM.
Representative spectra acquired on 500 µM samples are depicted in Figure S9F-H for FP10 and
S9I-M for FP12. Furthermore, FP10 and FP12 resonances appear considerably narrower
compared to FP7 signals (Figure S9A). Collectively, these findings suggest an appreciably
higher solubility of FP10 and FP12 in aqueous buffer solution and thus a lower propensity to
16
form micelles.
A different behaviour can be described for FP116. All the 1H-NMR spectra acquired on this
compound present broad resonances and no sharp signals, expected for the free monomer. Thus,
in the range of tested concentrations (125 - 500 µM), FP116 is always present in an aggregated
form. Representative spectra acquired on a 250 µM FP116 sample are reported in Figure S9N-P.
SAXS studies
SAXS profiles were measured in dependence of temperature to obtain information on the
supramolecular organization of the molecules. The data are given in the range of the scattering
vectors relevant for structure assignment. All FP compounds showed isotropic scattering,
indicating no preference for a predominant orientation of the aggregates. FP10 and FP12 showed
diffuse symmetric scattering curves dominated by the form factor, which is characteristic for
unilamellar aggregates with large interbilayer distance and probably owing to the negative
surface charge of the two adjacent phosphate groups that leads to a net electrostatic repulsion of
the bilayers (Figure 5). The scattering of FP10 shows two maxima at 5.58 nm and at 3.38 nm, the
latter could indicate the formation of interdigitated bilayers (3.38 nm). For FP12, a single peak is
observed at 20 °C (up to 35 °C, data not shown) indicating the formation of correlated
multilayers with a d-spacing of 4.14 nm, which is also consistent with the formation of an
interdigitated bilayer structure. In contrast, FP7 does show a different and more complex
scattering pattern, which indicates the occurrence of a non-lamellar structure. The spacing
relationship exhibits clear similarity with cubic structures with a space group relationship of aQ
12.7 nm (not visible), aQ/3 (7.29 nm), aQ/5 (5.68 nm), aQ/8 (4.53 nm), and aQ/11 (3.86 nm),
agreeing most likely with space group Q212. The tendency to a non-lamellar structure of FP7
17
however could explain the slightly lower antagonistic activity of FP7 compared to FP12. In
contrast to the above FP compounds, FP116 showed very weak scattering intensities hardly
displaying a form factor which can be explained by a much lower solubility observed for the
FP116 preparation and supports the results obtained by NMR.
Figure 5. Small angle X-ray diffraction of aggregates in solution for FP10 (A), FP12 (B), FP7
(C), and FP116 (D). Scattering vectors are indicated for temperatures between 20 °C and 80 °C.
Grey squares show enlargements of the relevant scattering vectors. The spacing of the diffraction
maxima is indicted as d = 1/s (nm).
Binding to MD-2
Expression, purification and activity of hMD-2
Recombinant human MD-2 (hMD-2) was used in in vitro binding experiments. The functionality
of this protein is a crucial prerequisite to obtain reliable results representative of specific, high-
affinity molecular recognition of ligands.33 Recombinant hMD-2 was expressed in E. coli, Pichia
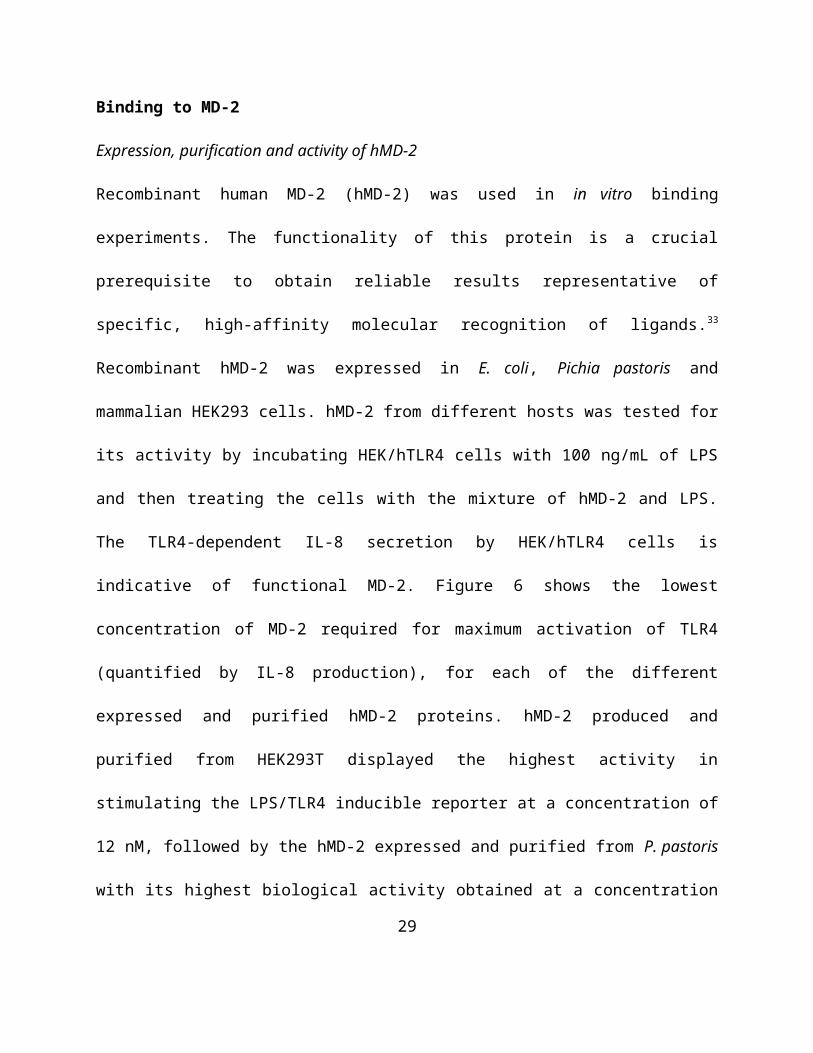
pastoris and mammalian HEK293 cells. hMD-2 from different hosts was tested for its activity by 18
incubating HEK/hTLR4 cells with 100 ng/mL of LPS and then treating the cells with the mixture
of hMD-2 and LPS. The TLR4-dependent IL-8 secretion by HEK/hTLR4 cells is indicative of
functional MD-2. Figure 6 shows the lowest concentration of MD-2 required for maximum
activation of TLR4 (quantified by IL-8 production), for each of the different expressed and
purified hMD-2 proteins. hMD-2 produced and purified from HEK293T displayed the highest
activity in stimulating the LPS/TLR4 inducible reporter at a concentration of 12 nM, followed by
the hMD-2 expressed and purified from P. pastoris with its highest biological activity obtained
at a concentration of 15 nM. Finally, hMD-2 purified from E. coli gave the lowest IL-8
production at the concentration of 245 nM (Figure 6).
The difference in activity of hMD-2 expressed in different hosts most likely reflects minor
differences in protein folding and/or glycosylation.34, 35 The higher expression yield and the good
activity prompted us to use hMD-2 from P. pastoris in in vitro binding experiments with
synthetic compounds.
Figure 6. Activity of hMD-2 expressed in different hosts. The figure shows the maximum
activation of TLR4 (quantified by IL-8 production) at the lowest concentration of hMD-2 under
19
the different expressed conditions (bacteria 245 nM, yeast 15 nM, and mammalian 12 nM).
Results are mean ± SEM from three parallels representative of at least three independent
experiments.
Binding studies were carried out by means of fours different techniques: two ELISA-type plate-
based assays with immobilized protein, a fluorescence displacement assay and Surface Plasmon
Resonance (SPR).
ELISA competition experiments with anti-hMD-2 antibody
Direct binding of LPS, FP7, FP10 and FP12 to MD-2 was determined using a monoclonal
antibody that binds to free hMD-2 but not to hMD-2 bound to LPS.36 Monoclonal mouse anti-
hMD-2 (9B4) antibody specifically binds to an epitope close to the rim of the LPS-binding
pocket of hMD-2, available for recognition by the antibody only when the hMD-2 pocket is
empty.
This assay detected a decrease in binding to MD-2 in the presence of LPS (Figure 7A), similar to
what previously reported.37 A dose-dependent inhibition of antibody/MD-2 interaction was
observed when adding FP7 and FP12, with a 90-95% decrease in binding obtained at
concentrations of FP7 and FP12 of 20 μM (Figure 7A). 70% decrease in binding to hMD-2 was
obtained with 20 μM of FP10 (Figure 7A), and 20% decrease was obtained with 20 μM of
FP116 (Figure 7A). These data showed that while FP7 and FP12 bind hMD-2 with high affinity,
FP10 and FP116 are less potent ligands.
ELISA displacement experiment with immobilized hMD-2 and biotinylated LPS
20
The ability of FP compounds to displace LPS from the pocket of hMD-2 was assessed by an
ELISA plate-based assay. The synthetic molecules were added at increasing concentration to
hMD-2 that was already incubated with biotinylated LPS. FP7 and FP12 were able to displace
biotin-LPS from hMD-2 in a dose-dependent manner, with the highest displacement of 60-65%
obtained at a concentration of 160 μM (Figure 7B). FP10 and FP116, at a concentration of 160
μM, gave a displacement of biotin-LPS of 20-30% (Figure 7B). As a control, LPS at a
concentration of 40 μM gave the highest displacement of biotin-LPS of 70% (Figure 7B).
Fluorescence displacement assay
It has been previously shown that the fluorescent probe 1,1’-Bis(anilino)-4,4’-bis (naphthalene)
−8,8’ disulfonate (bis-ANS) binds to MD-2 and is displaced by LPS.38 bis-ANS presumably
binds the same MD-2 binding site as lipid A and of other lipid A-like ligands. TLR4 ligands
interacting with MD-2 in a lipid A-like manner, are supposed to compete with bis-ANS and
displace it from MD-2. LPS, FP7, FP10 and FP12 caused a concentration-dependent decrease of
bis-ANS fluorescence, indicating competitive binding of FP7, FP10 and FP12 to hMD-2 (Figure
7C). FP116 induces only a modest decrease of bis-ANS fluorescence at the tested concentrations
(Figure 7C), thus confirming that the lack of activity on cells could be related to low affinity
binding of this molecule to hMD-2.
Surface Plasmon Resonance (SPR) analysis
SPR data with immobilized hMD-2, showed direct interaction of the receptor with LPS (control)
and with the tested synthetic compounds. KD values derived from sensorgrams analysis were 3
21
μM, 13.7 μM, 22 μM and 66.8 μM for FP12, FP7, FP10 and FP116, respectively (Figure 7E-H).
SPR experimental curves optimal fitting was obtained by assuming 1:1 ligand/MD-2 binding
stoichiometry.
Together, the results obtained from these in vitro cell-free studies clearly indicate that FP7,
FP10, FP12 and FP116 directly interacted with MD-2, with the same order of potency found in
human and murine cell experiments FP12(C12)>FP7(C14)>FP10(C10)>>FP116(C16).
22
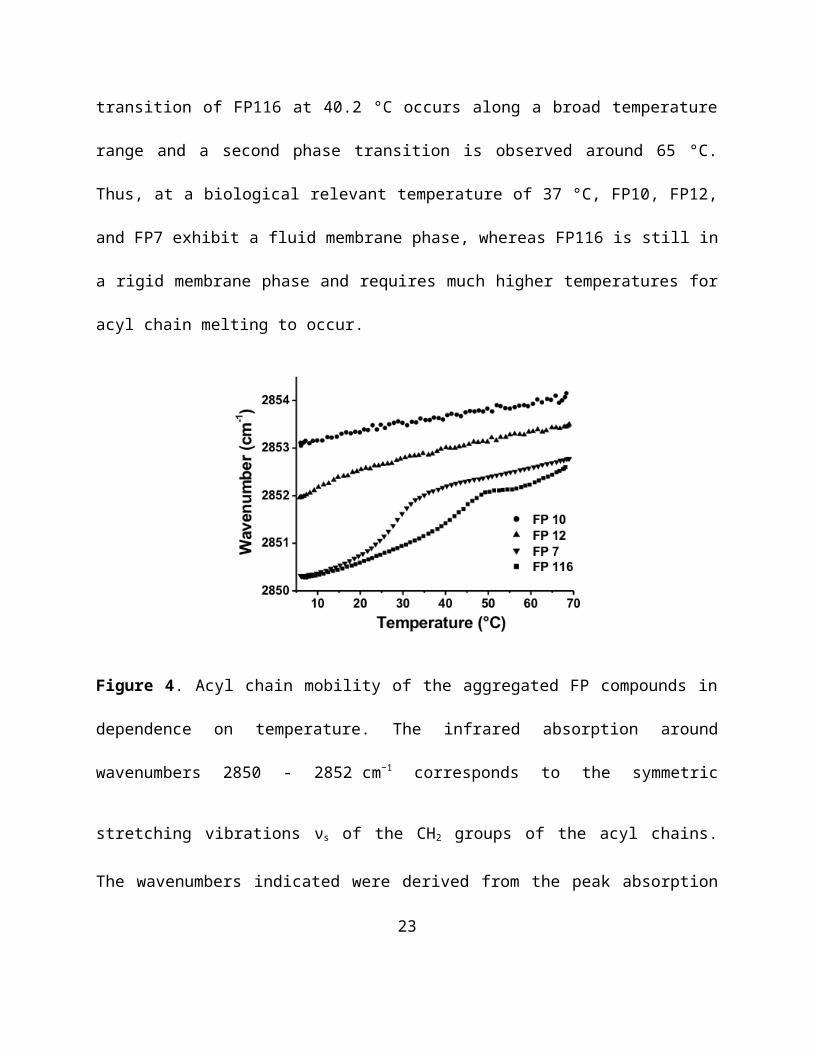
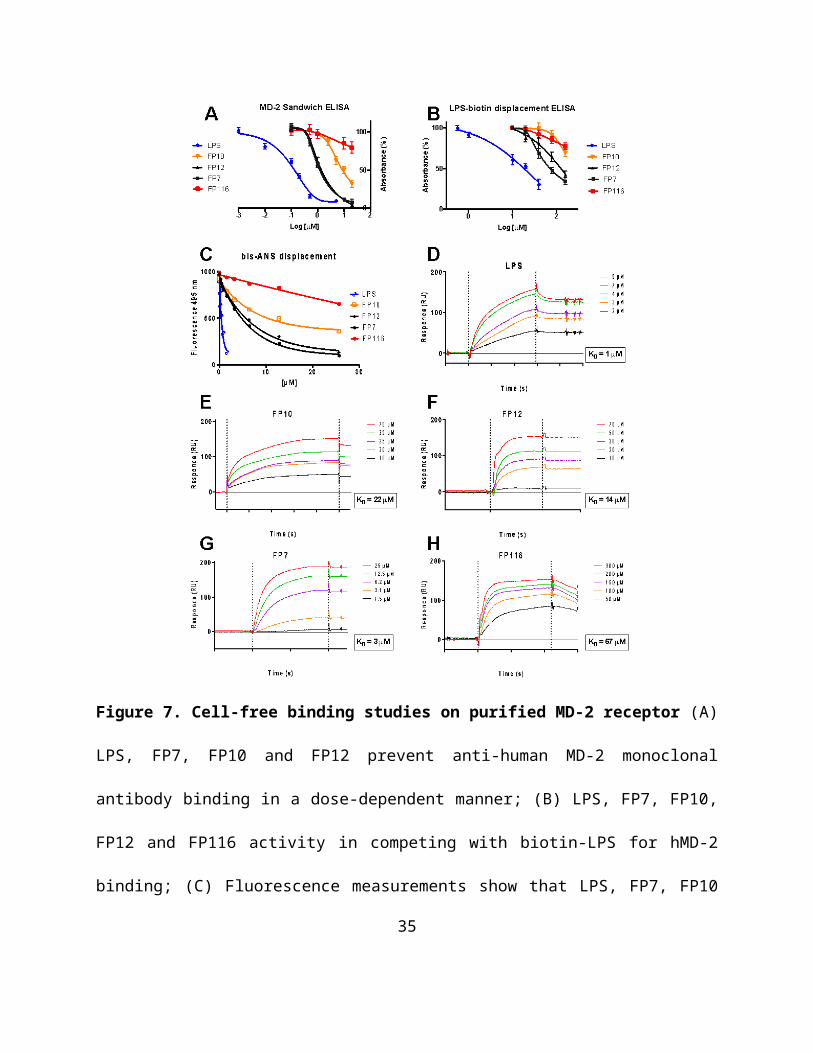
Figure 7. Cell-free binding studies on purified MD-2 receptor (A) LPS, FP7, FP10 and FP12
prevent anti-human MD-2 monoclonal antibody binding in a dose-dependent manner; (B) LPS,
FP7, FP10, FP12 and FP116 activity in competing with biotin-LPS for hMD-2 binding; (C)
Fluorescence measurements show that LPS, FP7, FP10 and FP12 dose-dependently inhibit the
binding of bis-ANS to MD-2; (D-H) SPR analysis show direct interaction between LPS, FP10,
FP12, FP7, and FP116 and MD-2; KD values are reported. Results are mean ± SEM from three
23
parallels representative of at least three independent experiments.
Cell experiments
Modulation of LPS-stimulated TLR4 signaling in HEK-Blue cells
In order to evaluate the influence the fatty acids length on the TLR4 antagonist activity,
molecules FP10, FP12, FP7, and FP116, constituting the homologous series with fatty acid chain
lengths C10, C12, C14, and C16, were first tested on HEK-Blue hTLR4 cells. These cells are
engineered to stably express the human receptors of the LPS recognition complex (hTLR4,
hMD-2 and hCD14) and a reporter gene (SEAP) placed under the control of two TLR4-
dependent transcription factors (NF-κB and AP-1). Results from MTT assay revealed that all
compounds did not have a negative effect on cell viability at the concentration of 10 μM used in
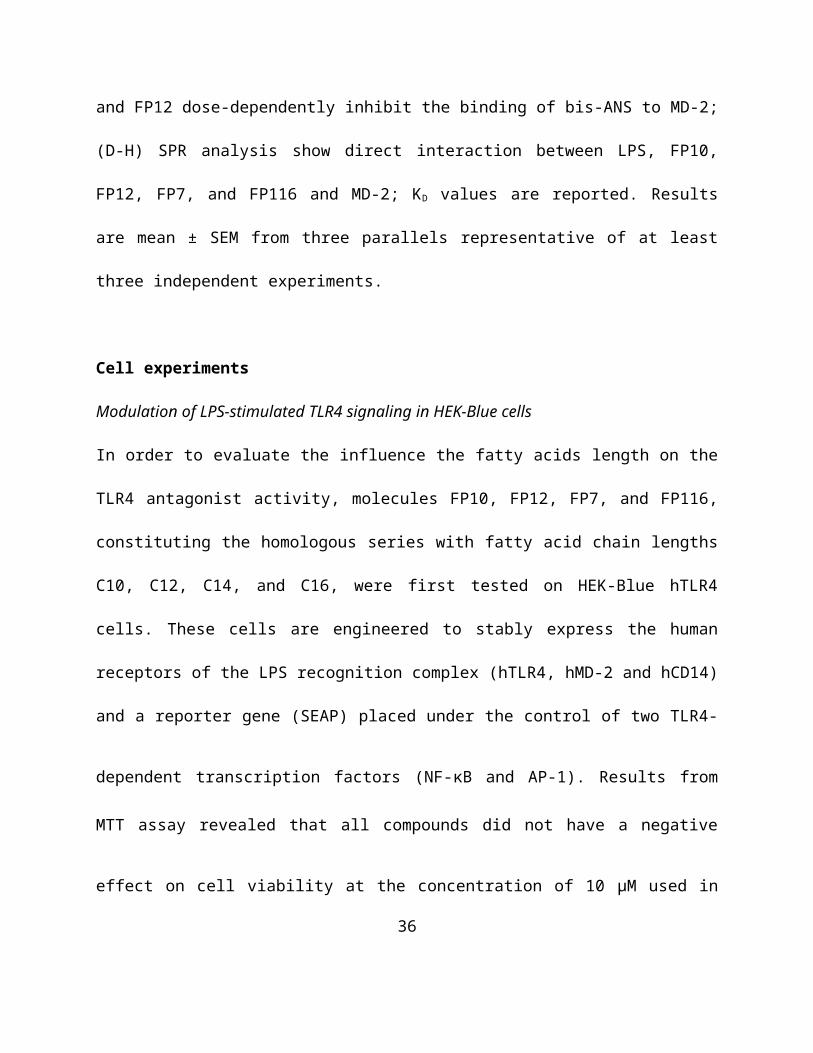
experiments (Figure S10, Supp. Info.). FP7, FP10 and FP12, but not FP116, inhibited in
concentration-dependent manner the TLR4 signaling in HEK-Blue cells (Figure 8). FP7
displayed the expected antagonistic activity.6 FP10 and FP12 showed IC50 respectively higher
(5.45 µM) and lower (0.63 µM) than FP7 (2.0 µM) (Figure 8B). These results demonstrated the
efficacy of fatty acid chains lengths (C8, C10 and C12) of FP7 variants to negatively modulate
TLR4 signaling in HEK-Blue cells, the order of activity being: FP12(C12)>FP7(C14)
>FP10(C10)>>FP116(C16).
24
Figure 8. Dose-dependent inhibition of LPS-triggered TLR4-dependent NF-kB activation in
HEK-Blue hTLR4 cells by compounds FP7, FP10, FP12 and FP116. (A) HEK-Blue hTLR4 cells
were pre-incubated with the indicated concentrations of compounds FP7, FP10, FP12 and FP116
and stimulated with LPS (100 ng/mL) after 30 minutes. Data were normalized to stimulation
with LPS alone and expressed as the mean percentage ± SEM of at least three independent
experiments. (B) Dose-response curves for compounds FP7, FP10 and FP12 in inducing the
TLR4-dependent NF-κB reporter activity. Concentration-effect data were fitted to a sigmoidal 4
parameter logistic equation to determine IC50 values. Data points represent the mean of
percentage ± SEM of at least 3 independent experiments.
Modulation of LPS-stimulated TLR4 signaling in murine macrophages
25
Several TLR4 modulators mimicking lipid A have different effect on human and murine TLR4.
In certain cases when passing from murine to human TLR4/MD-2/CD14 system the observed
agonistic effect switched to antagonistic effect of the compound of interest39. The species-
specificity is due to differences between hMD-2 and mMD-2 binding regions that induce
different positioning of the same ligand thus causing different activity and, in some cases, switch
from agonism to antagonism. In this experiment we aimed to investigate the effect of
glucosamine derivatives in murine RAW-Blue macrophages. These cells are derived from RAW
264.7 and possess the same reporter gene present in HEK-Blue hTLR4 cells (SEAP). We first
verified the capacity of FP compounds to stimulate the TLR4 response in RAW-Blue cells and
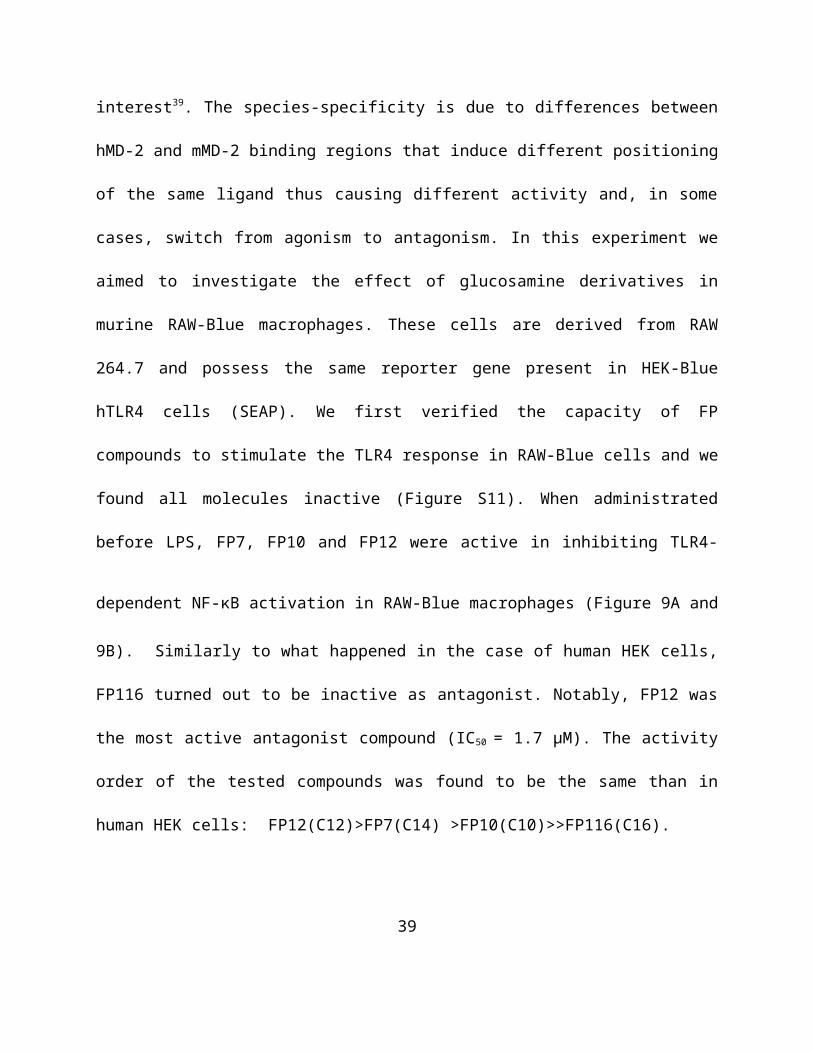
we found all molecules inactive (Figure S11). When administrated before LPS, FP7, FP10 and
FP12 were active in inhibiting TLR4-dependent NF-κB activation in RAW-Blue macrophages
(Figure 9A and 9B). Similarly to what happened in the case of human HEK cells, FP116 turned
out to be inactive as antagonist. Notably, FP12 was the most active antagonist compound (IC50 =
1.7 µM). The activity order of the tested compounds was found to be the same than in human
HEK cells: FP12(C12)>FP7(C14) >FP10(C10)>>FP116(C16).
26
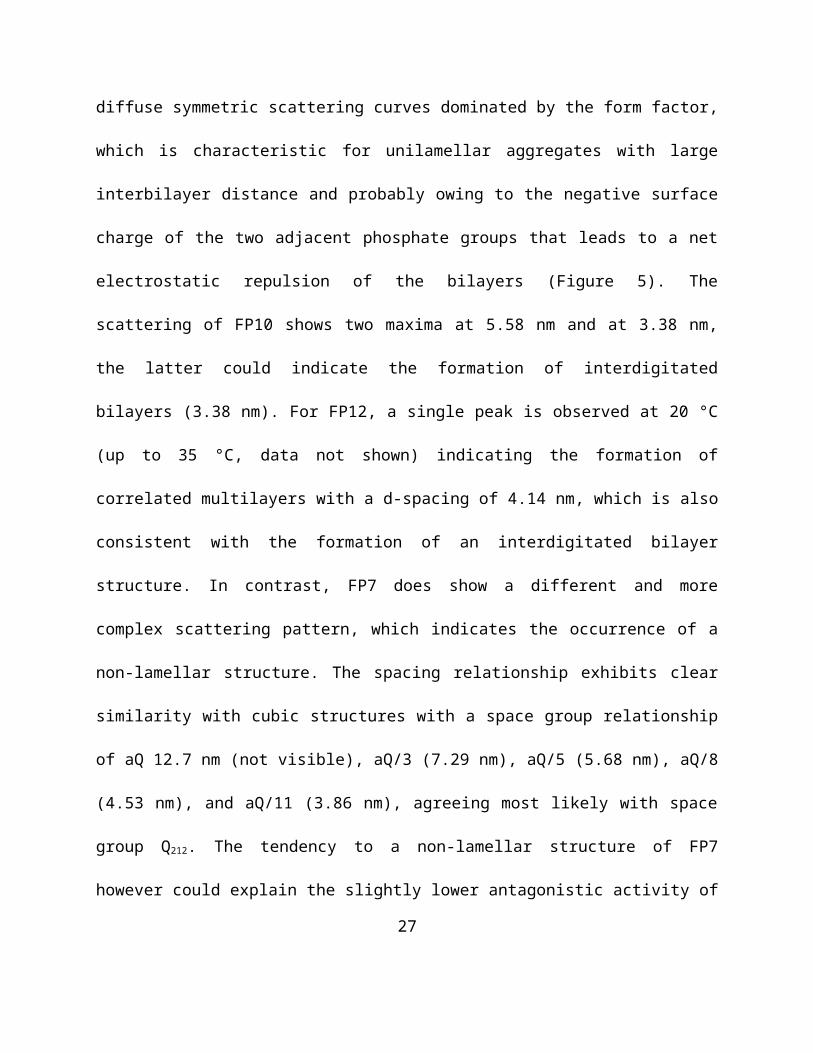
Figure 9. Activity of compounds FP10, FP12 and FP116 on RAW-Blue cells. (A) RAW-Blue
cells were pre-incubated with increasing concentrations of synthetic compounds and then
stimulated with LPS (10 ng/mL, after 30 minutes). Data were normalized to response to LPS and
expressed as the mean percentage ± SEM of at least three independent experiments. (B) Dose-
dependent inhibition curves of compounds FP7, FP10 and FP12. IC50 values in the table on the
bottom. Concentration-effect data were fitted to a sigmoidal 4-parameter logistic equation to
determine IC50 values. Data points represent the mean of percentage ± SEM of at least 3
independent experiments.
Effect of FP variants on LPS-induced TLR4 signaling in THP-1 cells.
Haematopoietic TLR4 has been shown to play a critical role in any stage of inflammatory
process. Furthermore, immune competent cells use TLR4 signaling to sense danger molecules
27
and produce proinflammatory proteins that initiate and amplify the inflammatory process. To test
the potential of FP variants to modulate TLR4 signaling pathways we utilised THP-1 cells as an
in vitro model. Initially, we evaluated the effect of FP variants on THP-1 cell viability. THP-1
cells were exposed to different concentrations of FP variants (0-10 μM) in the presence or
absence of LPS (100 ng/mL) for up to 24 h. Results from MTT assay demonstrated that FP
variants/LPS did not affect cell viability (Figure S12). To determine the effect of FP variants on
TLR4 signaling, next we analysed IL-8 expression, a well known TLR4-dependent
proinflammatory cytokine produced in THP-1 cells in response to LPS. ELISA results clearly
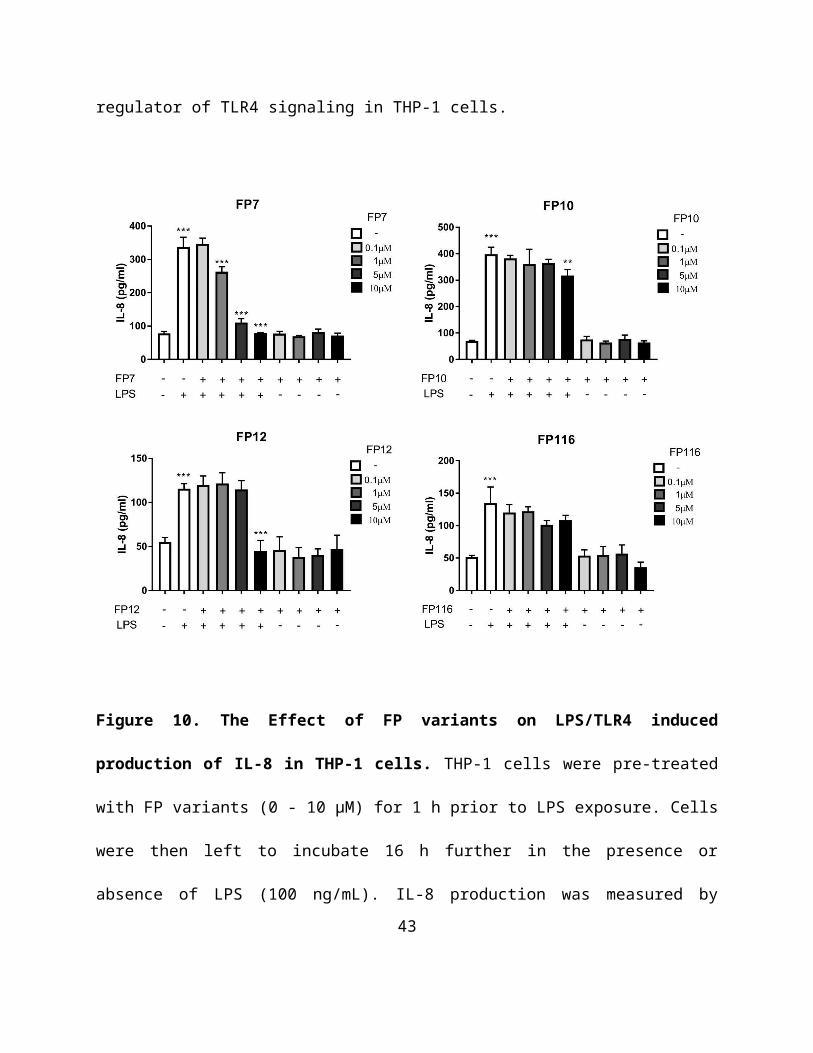
demonstrated the potential of FP7 and FP12 at 10 μM to inhibit LPS driven IL-8 production
(Figure 10). In contrast, FP10 and FP116 had a modest or non-significant impact on IL-8
expression respectively (Figure 10). We have demonstrated that FP7 exerted a negative effect on
TLR4 signaling in different cell types (unpublished data). Following on from comparative
analysis based on TLR4-dependent IL-8 expression and tendency on the binding affinity with
MD-2 of FP7 variants we found that the structural modification of FP12, but not FP10 and
FP116 is related to antagonistic activity of the compound. In support to this notion, we further
investigated the ability of FP12 to modulate second messengers in TLR4 signaling.
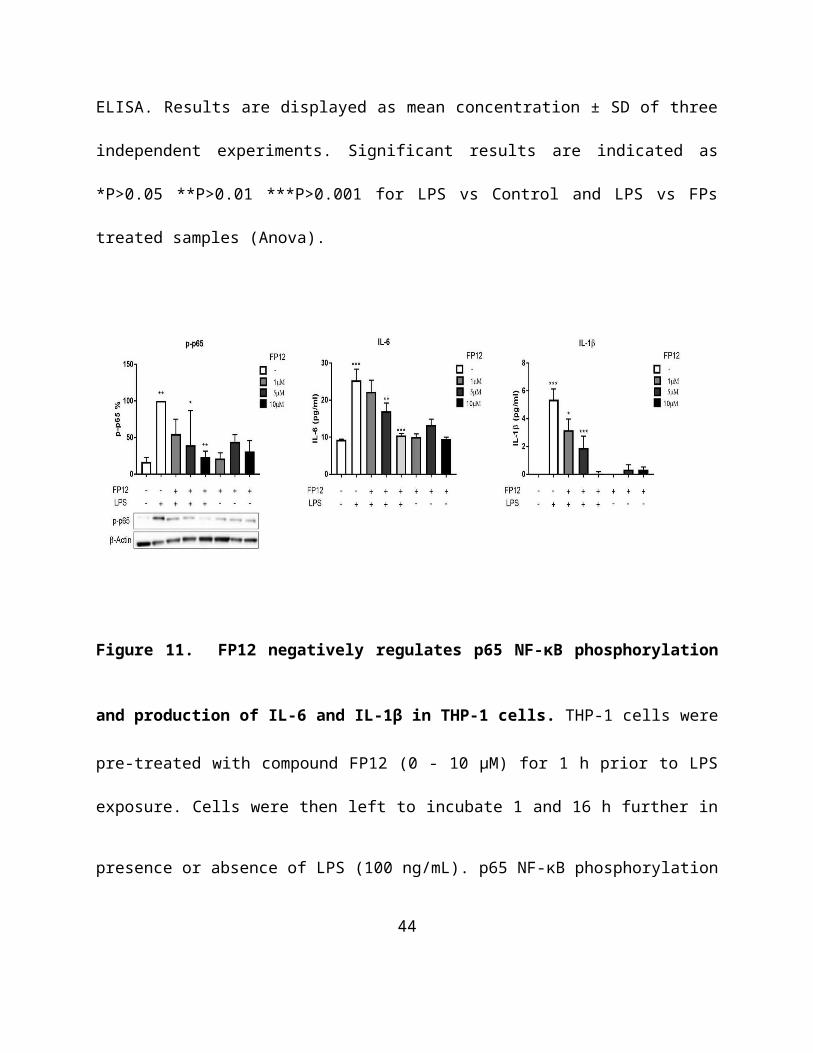
Immunoblotting data revealed that FP12 significantly downregulated p65 NF-κB
phosphorylation that was associated with a strong inhibition of the expression of additional
TLR4-dependent cytokines, such as IL-6 and IL-1β in a dose-dependent manner (Figure 11).
These data clearly demonstrate that FP12 is a potent negative regulator of TLR4 signaling in
28
THP-1 cells.
Figure 10. The Effect of FP variants on LPS/TLR4 induced production of IL-8 in THP-1
cells. THP-1 cells were pre-treated with FP variants (0 - 10 µM) for 1 h prior to LPS exposure.
Cells were then left to incubate 16 h further in the presence or absence of LPS (100 ng/mL). IL-8
production was measured by ELISA. Results are displayed as mean concentration ± SD of three
independent experiments. Significant results are indicated as *P>0.05 **P>0.01 ***P>0.001 for
LPS vs Control and LPS vs FPs treated samples (Anova).
29
Figure 11. FP12 negatively regulates p65 NF-κB phosphorylation and production of IL-6
and IL-1β in THP-1 cells. THP-1 cells were pre-treated with compound FP12 (0 - 10 µM) for 1
h prior to LPS exposure. Cells were then left to incubate 1 and 16 h further in presence or
absence of LPS (100 ng/mL). p65 NF-κB phosphorylation was determined in cell lysates using
Western Blot analysis and cytokine production was measured by ELISA after 16 h of LPS
exposure respectively. Results are displayed as mean concentration ± SD of three independent
experiments. Significant results are indicated as *P>0.05 **P>0.01 ***P>0.001 for LPS vs
Control and LPS vs FP12 treated samples (Anova).
Discussion and conclusions
The homologous series of FP glycolipids with fatty acid chain lengths varying from 10 to 16
30
carbon atoms were rationally designed as MD-2 ligands and synthesized.
In a first set of in vitro experiments we aimed at studying the SAR of these molecules in binding
experiments with functional hMD-2. For this purpose hMD-2 expressed in yeast (P. pastoris),
was used because it showed higher activity in responding to LPS stimulus than bacterial (E. coli)
MD-2 and was produced with higher yields than MD-2 from mammalian (HEK) cells. Four
different binding experiments between synthetic compounds and h-MD-2 were carried out.
These were competition (displacement) experiments in which the synthetic glycolipids compete
with biotin-LPS, with the fluorescent MD-2 ligand bis-ANS and with anti-MD-2 antibody for
MD-2 binding. SPR measurements allowed to analyze directly the binding between synthetic
glycolipids and MD-2. All binding experiments consistently provided the same order of affinity
among hMD-2 and synthetic molecules: FP12(C12)>FP7(C14) >FP10(C10)>FP116(C16).
The biological activity was then assessed on cells: when provided alone, the synthetic FP
compounds did not display any TLR4 agonist activity in human and murine cells. On the
contrary, when administrated with LPS, the molecules with 10, 12 and 14 carbon chains
(respectively, FP10, FP12 and FP7) were active in blocking LPS/TLR4 signal (antagonism) in
human and murine cells, while the molecule with 16 carbons (FP116) showed very weak, or no
activity. The order of activity of FP variants as TLR4 antagonists was confirmed in human
(HEK-TLR4 and THP-1) and murine (RAW macrophages) cells. The molecules with 10, 12 and
14 carbon chains seem to be non-species specific TLR4 antagonists, because these compounds
are active in both human (HEK and THP-1) and murine cells, with higher potency in human
ones. The compound with higher biological activity was FP12, with 12 carbons, followed by FP7
and FP10 with 14 and 10 carbons, while FP116 with 16 carbons showed very weak or no activity
31
in cell models.
The variation of compounds’ functional activity was related to the number of carbon atoms of
the aliphatic chains which could be described by a bell-shaped curve with a maximum at C12.
This is a common structure-activity trend that is found in a number of series of homologous
compounds in medicinal chemistry and can be explained in terms of docking within the binding
pocket of the pharmacological target (as it exists an optimal number of carbon atoms that can be
accommodated into the pocket) and also in terms of variation of solubility and bioavailability
(when the chain length is too long the solubility decreases and also the biological activity). Thus,
the difference of TLR4 functional activity of FP monosaccharides related to FA chains length
can be explained in terms of their interaction with MD-2(/TLR4) and/or by their aggregation
properties in a solution.
The docking and MD simulation studies have shown that FP10, FP7 and FP12 would accomplish
optimal binding properties while FP116 could be bordering the limits of the maximum length
compatible with a proper MD-2 binding. Although MD-2 pocket is able to host until five FA
chains, the highly long and flexible C16 acyl chains present in FP116 seem to point to less
efficient ability to interact with TLR4/MD-2 in an antagonistic binding mode, given that the
required exposed conformation of Phe126 side chain could be jeopardized.
Additionally, calculated logP values for the FP variants point to a very high lipophilicity for
FP116, maybe affecting the aggregation properties in solution.
Taken together, these data strongly suggest that the mechanism of TLR4 antagonism of that class
of compounds is mainly based on the competition with LPS (or other ligands, as bis-ANS) in the
binding to the MD-2/TLR4 complex.
32
Interestingly, an identical order of activity on TLR4 has been found in a series of
monosaccharide TLR4 agonists, the Gifu Lipid As (GLA), and the following order of potency in
inducing the production of TNF-α in murine cells was detected: C12>C14>C10>>C16.22 Also in
the case of GLA compounds, with three FA chains and one phosphate in C-4 position, the C12
and C14 variants were the most active ones, C10 less active and C16 were inactive. Similarly to
FP compounds, GLA are more active on murine than on human cells.22 However, the authors did
not provide any evidences or explanation about the link between TLR4 activity of
monosaccharide and FA chain length.
Regarding the aggregation properties some important differences among FP compounds were
detected by FT-IR analysis in solution. These measurements showed marked variations in acyl
chain fluidity of aggregated FP compounds depending on the chemical structure. The phase
transition temperature Tc exhibits a clear inverse correlation with the length of the acyl chains
with Tc C16 >> Tc C14 > Tc C12 > Tc C10. Of note, this behavior results in marked differences
at the biological relevant temperature of 37 °C, where FP10, FP12, and FP7 are in a fluid
membrane phase, whereas FP116 is still in a rigid membrane phase and requires much higher
temperatures for acyl chain melting to occur. The occurrence of a very broad phase transition at
temperatures above 37 °C and occurrence of a second phase transition at higher temperature as
observed for FP116 was also found for inactive glucosamine monosaccharide GLA
compounds.40 Differences in phase behavior have also been shown for the TLR4 ligands lipid A
and LPS. The antagonistic tetraacylated synthetic compound 406 is highly fluid at 37 °C,
whereas the biologically active hexaacylated compound 506 and LPS Re have phase transition
temperatures above 37 °C.41 The fluidity state of the acyl chains in aggregated glycolipids is thus
33
not an exclusive determinant of inflammatory or antagonistic activity of chemically different
compounds. It is rather a modifying parameter of biological activity by affecting aggregate
properties such as hydrophobic thickness, packing density, and aggregate stability. NMR and
SAXS analysis revealed striking differences in aggregate formation of FP compounds which are
likely to explain differences in their biological activity. Concentration-dependent NMR analysis
of the two most antagonistic compounds FP12 and FP7 revealed aggregation of FP7 (C14) at
much lower concentrations than FP12 (C12), reflecting further differences in the biophysical
state and bioavailability of these compounds. Aggregate structures resolved by SAXS analysis
provided evidence for lamellar bilayer structures for FP10 and FP12, which are associated with
antagonistic activity, for FP7 a tendency to for non-lamellar structures was determined.
Considering the crucial role of lipid supramolecular aggregate structure for the presentation to
LPS receptor molecules, the different aggregate structures observed by SAXS might explain the
slightly lower antagonistic activity of FP7 compared to FP12 in some biological systems.
The present study provides structural and functional biological data demonstrating the ability of
novel FP variants to negatively regulate TLR4 signaling in different cell model systems. Having
shown the strong potential of FP12 to modulate second messengers activation and various end
points of TLR4 signaling pathways including its lack of toxicity, this study supports the idea of
further drug development of FP12 as a lead compound in preclinical and clinical studies for
pharmacological intervention of inflammatory-based diseases.
Experimental section:
Computational studies.
34
Structure construction and refinement. The 3D structures of ligands FP10, FP12, FP7, and
FP116 were built with PyMOL42 using 6YA monosaccharide found in the GLYCAM database
(http://glycam.org) as a template. The 3D coordinates of human TLR4/MD-2 model in the
antagonist conformation is reported elsewhere.43
Parameters Derivation. The parameters needed for MD simulations were obtained using the
standard Antechamber procedure in Amber14.44 Briefly, ligand structures, already refined at the
AM1 level of theory, were optimized and their atomic partial charges were calculated with
Gaussian g09/e145 at the Hartree−Fock level (HF/6-31G* Pop=MK iop(6/33=2) iop(6/42=6)),
then the partial charges were derived and formatted for AmberTools15 and Amber14 with
Antechamber, assigning the general AMBER force field (GAFF) atom types. Later, the atom
types of the atom constituting the saccharide ring were changed to the GLYCAM force field
atom types.46 The GAFF parameters for the phosphate group were modified as shown in SI.
Docking calculations of ligands FP10, FP12, FP7, and FP116. The Gasteiger charges were
computed within the AutoDockTools 1.5.6 program,47 and the nonpolar hydrogens were merged
for all the ligands, the human TLR4/MD-2 antagonist model and human CD14 (PDB-ID 4GLP).
AutoDock VINA 1.1.2 was used for the docking of the ligands and AutoDock 4.2 was used to
redock the best-predicted binding poses. In AutoDock 4.2, the Lamarckian evolutionary
algorithm was chosen and all parameters were kept default except for the number of genetic
algorithm runs that was set to 200 to enhance the sampling. AutoDockTools 1.5.6 was used to
assign the Gasteiger−Marsili empirical atomic partial charges to the atoms of both the ligands
and the receptors. The structure of the receptors was always kept rigid, whereas the structure of
the ligand was set partially flexible by providing freedom to some appropriately selected dihedral
35
angles. Regarding the docking boxes, spacing was set to the default value of 1Å for VINA, and
0.375 Å for AutoDock. For human CD14 structure, the size of the box was set to 33.00 Å in the
x-axis, 33.75Å in the y-axis and 33.75 Å in the z-axis, and the center of the box was located
equidistant to the center of mass of residues Phe69, Tyr82 and Leu89. For the human TLR4/MD-
2 system, the size of the box was set to 33.00 Å in the x-axis, 40.50Å in the y-axis and 35.25 Å
in the z-axis, and the center of the box was located equidistant to the center of mass of residues
Arg90 (MD-2), Lys122 (MD-2) and Arg264 (TLR4).
Molecular dynamics (MD) simulations. Selected docked complexes were submitted to MD
simulations for 50 ns in Amber14 suite. All the complexes followed the same procedure. First,
the system is submitted to 1000 steps of steepest descent algorithm followed by 7000 steps of
conjugate gradient algorithm. A 100 kcal.mol-1.A-2 harmonic potential constraint is applied on
both the proteins and the ligand. In the subsequent steps, the harmonic potential is progressively
lowered (respectively to 10, 5 and 2.5 kcal.mol-1.A-) for 600 steps of conjugate gradient
algorithm each time, and then the whole system is minimized uniformly. Next, the system is
heated from 0 K to 100 K using the Langevin thermostat in the canonical ensemble (NVT) while
applying a 20 kcal.mol-1.A-2 harmonic potential restraint on the proteins and the ligand. Finally,
the system is heated up from 100 K to 300 K in the Isothermal–isobaric ensemble (NPT) under
the same restraint condition than the previous step, followed by a simulation for 100 ps with no
harmonic restraint applied. At this point the system is ready for the production run, which is
performed using the Langevin thermostat under NPT ensemble, at a 2 fs time step. All
production runs were performed for 50 ns.
LogP calculations. LogP value of FP10, FP12, FP7, and FP116 were calculated within the
36
Maestro package.48
Chemistry
General. The reactions were carried out under a nitrogen atmosphere. TLC were performed
using prepared plates of silica gel (Merck 60 F254 on aluminium) and revealed using UV light or
staining reagents (H2SO4 (5% in EtOH), ninhydrin (5% in EtOH), basic solution of KMnO4
(0.75% in H2O), molibdate solution (molybdatophosphorus acid and Ce(IV) sulphate in 4%
sulphuric acid). 1H NMR (400 MHz) and 13C NMR spectra (100 MHz) were recorded on a
Varian spectrometer using partially deuterated solvents as internal standards. Purity of final
compounds was ≥ 95% as assessed by quantitative NMR analysis. Reaction conditions and
compounds characterization are described in the Supp. Info.
HEK-Blue hTLR4 cells assay
HEK-Blue hTLR4 cells (InvivoGen) were cultured according to manufacturer’s instructions.
Briefly, cells were cultured in DMEM high glucose medium supplemented with 10% fetal
bovine serum (FBS), 2 mM glutamine, antibiotics and 1× HEK-Blue Selection (InvivoGen).
Cells were detached using a cell scraper, counted and seeded in a 96-well multiwell plate at a
density of 4 × 10⁴ cells per well. After overnight incubation (37 °C, 5% CO2, 95% humidity),
supernatants were replaced with new medium supplemented by the compound to be tested
dissolved in water or DMSO - H2O (1:1). After 30 minutes of pre-incubation, cells were
stimulated with 100 ng/mL LPS from E. coli O55:B5 (Sigma-Aldrich) and incubated overnight.
The SEAP-containing supernatants were collected and incubated with paranitrophenylphosphate
(pNPP) for 2−4 h in the dark at room temperature. The wells optical density was determined
using a microplate reader set to 405 nm. The results were normalized with positive control (LPS
37
alone) and expressed as the mean of percentage ± SEM of at least three independent
experiments.
RAW-Blue cells
Raw-Blue cells (InvivoGen) were cultured according to manufacturer’s instructions. Briefly,
cells were cultured in DMEM high glucose medium supplemented with 10% fetal bovine serum
(FBS), 2 mM glutamine, 100 µg/mL Normocin (InvivoGen), 200 µg/mL Zeocin (InvivoGen).
Cells were detached using a cell scraper and the cell concentration was estimated by using
Trypan Blue (Sigma-Aldrich). The cells were diluted in DMEM high glucose medium
supplemented as described before and seeded in 96-well multiwell plate at a density of 6 × 10⁴
cells per well in 200 μL. After overnight incubation (37 °C, 5% CO2, 95% humidity), supernatant
was removed, cell monolayers were washed with warm PBS and treated with increasing
concentrations of compounds dissolved in DMSO - H2O (1:1) and diluted in DMEM. After 30
minutes, cells were stimulated with 10 ng/mL of LPS from E. coli O55:B5 (Sigma- Aldrich) for
16 h. The supernatants were collected and incubated with paranitrophenylphosphate (pNPP) for
2−4 h in the dark at room temperature. The optical density of wells were determined using a
microplate reader set to 405 nm. The results were normalized with positive control (LPS alone)
and expressed as the mean of percentage ± SEM of at least three independent experiments.
THP-1 cells
THP-1 cells were cultured in RPMI (+10% heat inactivated fetal bovine serum (HiFPS), +1%
Glutamine, +1% Penacillin/Streptamycin). Cells were split 3 times weekly and maintained at a
density of 0.3 × 10⁶ cells/mL. For experimental procedure THP-1 were used at a density 0.5 x 10⁶
cells/mL, 100 L/well (96 wells) and 3 mL/well (6 wells) plates respectively. All cells were pre-
38
treated with FP7 variants (0-10 M) for 1 h, then exposed to LPS (100 ng/mL) for 1 or 16 h.
MTT Cell Viability Assay
HEK-Blue hTLR4 cells were grown in DMEM supplemented with 10% FBS, 2 mM glutamine
and antibiotics. Cells were seeded in 100 μL of DMEM without Phenol Red at a density of 4×10⁴
cells per well and incubated overnight (37 °C, 5% CO2, 95% humidity). Cells were treated with
the higher dose of compound used in the previous experiments and incubated overnight. MTT
solution (5 mg/mL in PBS) was added to each well and after 3 h incubation, HCl 0.1 N in 2-
propanol solution was used to dissolve formazan crystals. Formazan concentration was
determined by measuring the absorbance at 570 nm. The results were normalized with untreated
control (PBS) and expressed as the mean of percentage ± SEM of three independent
experiments.
Preparation of recombinant hMD-2 in Escherichia coli and purification
hMD-2 was produced in E. coli as described previously49, analysed by SDS–PAGE and its
biological activity tested on 293/hTLR4a cells.
Preparation of recombinant hMD-2 in Pichia pastoris and purification
hMD-2 was produced in Pichia pastoris, analysed by SDS–PAGE and its biological activity
tested on 293/hTLR4a cells.
The coding sequence of mature hMD-2 was amplified by PCR (primers F-hMD2-Q19
CAGAAGCAGTATTGGGTCTGC and R-Spe-hMD2
TTTACTAGTATTTGAATTAGGTTGGT GTAGG) from a plasmid template and ligated into
the SnaBI/SpeI opened pPpT4AlphaS-His expression vector (under the control of AOX1
promoter), in frame with the N-terminal S.cerevisiae α-MF pre-pro leader sequence and the C-
39
terminal 6xHis tag. The resulting recombinant plasmid pPpT4AlphaS-His was transformed into
E. coli DH5α competent cells, and the positive recombinant plasmid which was confirmed by
DNA sequencing, was linearized and transformed into Pichia pastoris GS115 by electroporation.
MD-2 expressing transformant was selected and cultured in a 250 mL shake flask containing 10
mL of YPD liquid media at 28 °C for 24 h. 2 L flasks containing 250 mL of BMGY (1%
glycerol) medium at 28 °C were inoculated with 1 mL of overnight inoculum. After being
cultured for 24 h, cells were aseptically collected by centrifugation at room temperature 10
minutes at 5,000 rpm. BMGY medium was replaced with 250 mL of methanol-complex medium
BMMY (1% methanol) to induce protein expression at 28 °C (250 rpm), adding 1% of methanol
every 12 h. After 2 days of fermentation in BMMY, cells were removed by centrifugation 10
minutes at 5,000 rpm. Supernatant was supplemented with 2 mM MgCl2 (Sigma), 100 mg/L of
reduced glutathione (Sigma), and pH was adjusted to 7.5 with NaOH (Sigma). Precipitate was
removed by centrifugation for 20 minutes at 1,900 g, followed by filtration using Stericup-GP
0.22 µm (Sigma). A 0.5 M solution of TRIS HCl pH 7.5, 1.5 M NaCl (Sigma) was added to the
medium to a final concentration of 50 mM TRIS HCl, 150 mM NaCl. High Density Nickel resin
(ABT) was added to the medium (30 mL every liter of medium) and incubated in batch at room
temperature for 4 h. High Density Nickel resin was washed several times with 50 mM TRIS HCl
pH 7.5, 150 mM NaCl solution. hMD-2 was eluted with 0.5 M imidazole (Sigma) in 2 mL
fractions, which were analysed for protein concentration and by SDS-PAGE. Pooled fractions
containing hMD-2 were extensively dialysed against 50 mM TRIS, 150 mM NaCl, 0.5% Tween
20, pH 7.5 at 4 °C and purified hMD-2 biological activity was tested on 293/hTLR4a cells.
Preparation of recombinant hMD-2 in mammalian cells and purification
40
hMD-2 was produced in HEK293T cells, analysed by SDS–PAGE and its biological activity
tested on 293/hTLR4a cells.
HEK293T cells were grown in high-glucose DMEM medium supplemented with 10% fetal calf
serum, 106 units per L penicillin G and 1 g L-L streptomycin in a 5% CO2 atmosphere at 37 °C.
Mammalian expression constructs for secreted proteins carrying a N-terminal FLAG-tag were
generated in the pEF vector (Thermo Fisher Scientific). pEF-Flag-DEVD-hMD2-myc/His
plasmid was transiently transfected to HEK293T cells, and the cells were harvested 48 h after
transfection and resuspended in lysis buffer containing 50 mM TRIS, 150 mM NaCl, 1 mM
EDTA, 1% TRITON X-100. The cell suspension was homogenized by Dounce homogenizer and
clarified by centrifugation at 10,000 g for 20 minutes. ANTI-FLAG M2 affinity gel beads
(SIGMA) was added to the lysate and then it was left shaking at 4 °C overnight. Solution was
spin down at 1,000 rpm for 2 minutes and eluted with TBS Flag peptide (100 μL/mL).
Recombinant protein hMD-2 was confirmed by western blot analysis using an HRP-coupled
antibody directed against the FLAG-tag at 1:5,000 dilution ratio (Invitrogen).
SDS-PAGE and Western blot
Purified recombinant hMD-2 was analysed on 15% SDS-PAGE under reducing conditions
followed by Coomassie Brilliant Blue staining. For Western blot analysis, proteins were
separated by SDS-PAGE under reducing conditions and then electrophoretically transferred onto
polyvinylidene difluoride membranes (Amersham Biosciences). After protein transfer, the
membranes were treated with blocking buffer followed by incubation with anti-His-HRP
antibodies (Sigma). Then, the bands were visualized by 3,3’-diaminobenzidine (Sigma) as a
peroxidase substrate.
41
Protein concentration determination
The total protein concentration was determined using ultraviolet absorption at 280 nm. The
theoretical extinction coefficient (19.285) was obtained using the protein sequence of hMD-2.
hMD-2 activity test using 293/hTLR4a cells
For measuring the activity of recombinant expressed hMD-2, HEK 293 cells stably transfected
with the human TLR4a gene (293/hTLR4a (Invivogen)) were used. Various dilutions of hMD-2
(stock concentration was 10 µM) were incubated with 100 ng/mL of LPS (Sigma) prior to
stimulation of 293/hTLR4a cells. Supernatants were analysed for IL-8 secretion by ELISA assay.
Determination of IL-8 secretion by sandwich enzyme-linked immunosorbent assay
IL-8 concentrations were assayed using the IL-8 Cytosets™ (Invitrogen) antibody pair kit
containing matched, pre-titrated and fully optimized capture and detection antibodies,
recombinant IL-8 standard and streptavidin-horseradish peroxidase (Sigma). The assay was
conducted according to the manufacturer's specifications.
Antibody-sandwich ELISA for the detection of binding of compounds to hMD-2
The method of antibody-sandwich ELISA for the detection of the binding of compounds to MD-
2 was modified from a previous study36. A microtiter plate was coated overnight at 4 °C with 100
μL/well of 5 μg/mL of chicken polyclonal anti-hMD-2 antibodies, diluted in 50 mM Na2CO3
buffer, pH 9.6 and blocked with 1% BSA in PBS. After washing, 1 μM hMD-2 with tested
compounds was added and incubated for 2 h. 0.1 μg/mL mouse anti-hMD-2 MAb (9B4) and 0.1
42
μg/mL goat anti-mouse IgG conjugated with HRP in PBS were added, followed by detection at
420 nm after the addition of 100 μL of ABTS (Sigma). Chicken anti-hMD-2 polyclonal
antibodies were prepared against recombinant hMD-2 by GenTel (Madison, WI, USA),
monoclonal mouse anti-hMD-2 9B4 antibodies were from eBioscience (San Diego, CA, USA),
and secondary goat anti-mouse IgG conjugated with horseradish peroxidase were from Santa
Cruz Biotechnology (Santa Cruz, CA, USA).
Fluorescence spectroscopy assay
Fluorescence was measured on Perkin Elmer fluorimeter LS 55 (Perkin Elmer, UK) as
previously described38. All measurements were done at 20 °C in a 5 x 5 mm quartz glass cuvette
(Hellma Suprasil, Müllheim, Germany). hMD-2 protein (200 nM) and 1,1’-Bis(anilino)-4,4’-bis
(naphthalene)−8,8’ disulfonate (bis-ANS, 200 nM) were mixed and incubated until reaching
stable relative fluorescence units (RFUs) emitted at 420–550 nm under excitation at 385 nm.
Compounds, at different concentrations, were then added, followed by relative fluorescence unit
(RFU) measurement at 420–550 nm.
LPS displacement assay
The ability of the compounds to displace LPS from hMD-2 hydrophobic pocket was determined
by ELISA. A microtiter plate was coated overnight at 4 °C with 100 μL/well of 5 μg/mL of
chicken polyclonal anti-hMD-2 antibodies, diluted in 50 mM Na2CO3 buffer, pH 9.6 and blocked
with 1% BSA in PBS. After washing, 1 μM of hMD-2 with biotin-labeled LPS was added and
incubated for 2 h. After washing, the compounds were added at different concentration and
incubated for 1.5 h. After washing, 0.5 μg/mL HRP-conjugated streptavidin (Sigma) in PBS was
43
added, followed by detection at 420 nm after the addition of 100 μL ABTS (Sigma). Chicken
anti-hMD-2 polyclonal antibodies were prepared against recombinant hMD-2 by GenTel
(Madison, WI, USA).
Surface plasmon resonance (SPR) analysis
The binding affinity of the compounds to recombinant hMD-2 was determined using a Biacore
X100 with an NTA sensor chip (Biacore, GE Healthcare, Uppsala, Sweden). Briefly, 0.5 μM
hMD-2 (in 50 mM TRIS, 150 mM NaCl, 0.5% Tween 20, pH 7.5) was immobilized onto the
sensor chip previously activated with 1-minute pulse of 10 mM NiSO4. First flow cell was used
as a reference surface to control non-specific binding. Both flow cells were injected with the
analyte (in PBS, 5% DMSO, 5% EtOH, pH 7.5) at a flow rate of 10 μL/min at 25 °C in
increasing concentrations. The data were analysed with Biacore Evaluation software. KD values
were calculated by global fitting of the equilibrium binding responses from various
concentrations of analytes using a 1:1 Langmuir binding model.
Acknowledgements
This study was financially supported by the H2020-MSC-ETN-642157 project TOLLerant. The
Italian Ministry for Foreign Affairs and International Cooperation (MAECI) and the Spanish
Ministry for Economy and Competitiveness (MINECO, grantsCTQ2014-57141-R and
CTQ2017-88353-R) are also acknowledged. SAXS measurements were performed at the EMBL
beamline P12 c/o DESY, Hamburg, Germany (beam time grant to A.B.S).
Abbreviations 44
TLR, Toll-like receptor; PRRs, pattern recognition receptors; PAMPs, pathogen-associated
molecular patterns; MD-2, myeloid differentiation 2; LOS, lipooligosaccharide; DAMPs,
damage-associated molecular patterns; LBP, lipid binding protein; CD14, cluster of
differentiation 14.
Supporting Information
Molecular Modeling, Docking Results; FT-IR spectroscopy, NMR spectroscopy; Small-angle X-
ray scattering (SAXS); Chemistry: Synthesis and compounds characterization, Molecular
formula strings; Biology.
Corresponding author information: E-mail: [email protected]; Phone: +39.0264483453.
References
1. Akira, S.; Takeda, K. Toll-like receptor signalling. Nat Rev Immunol 2004, 4, 499-511.
2. Molinaro, A.; Holst, O.; Di Lorenzo, F.; Callaghan, M.; Nurisso, A.; D'Errico, G.; Zamyatina, A.; Peri, F.;
Berisio, R.; Jerala, R.; Jiménez-Barbero, J.; Silipo, A.; Martín-Santamaría, S. Chemistry of lipid A: at the heart of
innate immunity. Chemistry 2015, 21, 500-519.
3. Krüger, C. L.; Zeuner, M. T.; Cottrell, G. S.; Widera, D.; Heilemann, M. Quantitative single-molecule
imaging of TLR4 reveals ligand-specific receptor dimerization. Sci Signal 2017, 10.
4. Gioannini, T.; Teghanemt, A.; Zhang, D.; Levis, E.; Weiss, J. Monomeric endotoxin: protein complexes are
essential for TLR4-dependent cell activation. J Endotoxin Res 2005, 11, 117-123.
5. Park, B.; Song, D.; Kim, H.; Choi, B.; Lee, H.; Lee, J. The structural basis of lipopolysaccharide
recognition by the TLR4-MD-2 complex. Nature 2009, 458, 1191-1195.
6. Cighetti, R.; Ciaramelli, C.; Sestito, S. E.; Zanoni, I.; Kubik, Ł.; Ardá-Freire, A.; Calabrese, V.; Granucci,
F.; Jerala, R.; Martín-Santamaría, S.; Jiménez-Barbero, J.; Peri, F. Modulation of CD14 and TLR4·MD-2 activities
by a synthetic lipid A mimetic. Chembiochem 2014, 15, 250-258.
7. Okamura, Y.; Watari, M.; Jerud, E.; Young, D.; Ishizaka, S.; Rose, J.; Chow, J.; Strauss, J. r. The extra
45
domain A of fibronectin activates toll-like receptor 4. J Biol Chem 2001, 276, 10229-10233.
8. Wang, Y.; Qian, Y.; Fang, Q.; Zhong, P.; Li, W.; Wang, L.; Fu, W.; Zhang, Y.; Xu, Z.; Li, X.; Liang, G.
Saturated palmitic acid induces myocardial inflammatory injuries through direct binding to TLR4 accessory protein
MD-2. Nat Commun 2017, 8, 13997.
9. Mancek-Keber, M.; Frank-Bertoncelj, M.; Hafner-Bratkovič, I.; Smole, A.; Zorko, M.; Pirher, N.; Hayer,
S.; Kralj-Iglic, V.; Rozman, B.; Ilc, N.; Horvat, S.; Jerala, R. Toll-like receptor 4 senses oxidative stress mediated by
the oxidation of phospholipids in extracellular vesicles. Sci Signal 2015, 8, ra60.
10. Goligorsky, M. S. TLR4 and HMGB1: partners in crime? Kidney Int 2011, 80, 450-452.
11. Erridge, C. The roles of toll-like receptors in atherosclerosis. J Innate Immun 2009, 1, 340-349.
12. Abdollahi-Roodsaz, S.; Joosten, L. A.; Roelofs, M. F.; Radstake, T. R.; Matera, G.; Popa, C.; van der Meer,
J. W.; Netea, M. G.; van den Berg, W. B. Inhibition of toll-like receptor 4 breaks the inflammatory loop in
autoimmune destructive arthritis. Arthritis Rheum 2007, 56, 2957-2967.
13. Cao, L.; Tanga, F.; Deleo, J. The contributing role of CD14 in toll-like receptor 4 dependent neuropathic
pain. Neuroscience 2009, 158, 896-903.
14. Casula, M.; Iyer, A. M.; Spliet, W. G.; Anink, J. J.; Steentjes, K.; Sta, M.; Troost, D.; Aronica, E. Toll-like
receptor signaling in amyotrophic lateral sclerosis spinal cord tissue. Neuroscience 2011, 179, 233-43.
15. Fan, J.; Li, Y.; Levy, R. M.; Fan, J. J.; Hackam, D. J.; Vodovotz, Y.; Yang, H.; Tracey, K. J.; Billiar, T. R.;
Wilson, M. A. Hemorrhagic shock induces NAD(P)H oxidase activation in neutrophils: role of HMGB1-TLR4
signaling. J Immunol 2007, 178, 6573-6580.
16. Kuzmich, N. N.; Sivak, K. V.; Chubarev, V. N.; Porozov, Y. B.; Savateeva-Lyubimova, T. N.; Peri, F.
TLR4 Signaling pathway modulators as potential therapeutics in inflammation and sepsis. Vaccines (Basel) 2017, 5.
17. Opal, S. M.; Laterre, P. F.; Francois, B.; LaRosa, S. P.; Angus, D. C.; Mira, J. P.; Wittebole, X.; Dugernier,
T.; Perrotin, D.; Tidswell, M.; Jauregui, L.; Krell, K.; Pachl, J.; Takahashi, T.; Peckelsen, C.; Cordasco, E.; Chang,
C. S.; Oeyen, S.; Aikawa, N.; Maruyama, T.; Schein, R.; Kalil, A. C.; Van Nuffelen, M.; Lynn, M.; Rossignol, D.
P.; Gogate, J.; Roberts, M. B.; Wheeler, J. L.; Vincent, J. L.; Group, A. S. Effect of eritoran, an antagonist of MD-
2/TLR4, on mortality in patients with severe sepsis: the ACCESS randomized trial. JAMA 2013, 309, 1154-1162.
18. Rice, T.; Wheeler, A.; Bernard, G.; Vincent, J.; Angus, D.; Aikawa, N.; Demeyer, I.; Sainati, S.; Amlot, N.;
46
Cao, C.; Ii, M.; Matsuda, H.; Mouri, K.; Cohen, J. A randomized, double-blind, placebo-controlled trial of TAK-242
for the treatment of severe sepsis. Crit Care Med 2010, 38(8), 1685-1694.
19. Salluh, J. I.; Póvoa, P. Biomarkers as end points in clinical trials of severe sepsis: a garden of forking paths.
Crit Care Med 2010, 38, 1749-1751.
20. Kalil, A. C.; LaRosa, S. P.; Gogate, J.; Lynn, M.; Opal, S. M.; Group, E. S. S. Influence of severity of
illness on the effects of eritoran tetrasodium (E5564) and on other therapies for severe sepsis. Shock 2011, 36, 327-
331.
21. Danner, R. L.; Van Dervort, A. L.; Doerfler, M. E.; Stuetz, P.; Parrillo, J. E. Antiendotoxin activity of lipid
A analogues: requirements of the chemical structure. Pharm Res 1990, 7, 260-263.
22. Matsuura, M.; Kiso, M.; Hasegawa, A. Activity of monosaccharide lipid A analogues in human monocytic
cells as agonists or antagonists of bacterial lipopolysaccharide. Infect Immun 1999, 67, 6286-6292.
23. Yang, D.; Satoh, M.; Ueda, H.; Tsukagoshi, S.; Yamazaki, M. Activation of tumor-infiltrating macrophages
by a synthetic lipid A analog (ONO-4007) and its implication in antitumor effects. Cancer Immunol Immunother
1994, 38, 287-293.
24. Tamai, R.; Asai, Y.; Hashimoto, M.; Fukase, K.; Kusumoto, S.; Ishida, H.; Kiso, M.; Ogawa, T. Cell
activation by monosaccharide lipid A analogues utilizing toll-like receptor 4. Immunology 2003, 110, 66-72.
25. Perrin-Cocon, L.; Aublin-Gex, A.; Sestito, S. E.; Shirey, K. A.; Patel, M. C.; Andre, P.; Blanco, J. C.;
Vogel, S. N.; Peri, F.; Lotteau, V. TLR4 antagonist FP7 inhibits LPS-induced cytokine production and glycolytic
reprogramming in dendritic cells, and protects mice from lethal influenza infection. Scientific reports 2017, 7,
40791.
26. Funatogawa, K.; Matsuura, M.; Nakano, M.; Kiso, M.; Hasegawa, A. Relationship of structure and
biological activity of monosaccharide lipid A analogues to induction of nitric oxide production by murine
macrophage RAW264.7 cells. Infect Immun 1998, 66, 5792-5798.
27. Mueller, M.; Lindner, B.; Kusumoto, S.; Fukase, K.; Schromm, A. B.; Seydel, U. Aggregates are the
biologically active units of endotoxin. J Biol Chem 2004, 279, 26307-26313.
28. Gutsmann, T.; Schromm, A.; Brandenburg, K. The physicochemistry of endotoxins in relation to
bioactivity. Int J Med Microbiol 2007, 297, 341-352.
47
29. Gioannini, T.; Teghanemt, A.; Zhang, D.; Coussens, N.; Dockstader, W.; Ramaswamy, S.; Weiss, J.
Isolation of an endotoxin-MD-2 complex that produces toll-like receptor 4-dependent cell activation at picomolar
concentrations. Proc Natl Acad Sci U S A 2004, 101, 4186-4191.
30. Ciaramelli, C.; Calabrese, V.; Sestito, S. E.; Pérez-Regidor, L.; Klett, J.; Oblak, A.; Jerala, R.; Piazza, M.;
Martín-Santamaría, S.; Peri, F. Glycolipid-based TLR4 modulators and fluorescent probes: rational design,
synthesis, and biological properties. Chem Biol Drug Des 2016, 88, 217-229.
31. Liu, M.; Nicholson, J. K.; Lindon, J. C. High-resolution diffusion and relaxation edited one- and two-
dimensional 1H NMR spectroscopy of biological fluids. Analytical Chemistry 1996, 68, 3370-3376.
32. Beckonert, O.; Keun, H. C.; Ebbels, T. M. D.; Bundy, J.; Holmes, E.; Lindon, J. C.; Nicholson, J. K.
Metabolic profiling, metabolomic and metabonomic procedures for NMR spectroscopy of urine, plasma, serum and
tissue extracts. Nature Protocols 2007, 2, 2692.
33. Manček-Keber, M.; Jerala, R. Postulates for validating TLR4 agonists. Eur J Immunol 2015, 45, 356-370.
34. Ohnishi, T.; Muroi, M.; Tanamoto, K.-i. N-Linked Glycosylations at Asn26 and Asn114 of Human MD-2
Are Required for toll-like receptor 4-mediated activation of NF-kB by lipopolysaccharide. The Journal of
Immunology 2001, 167, 3354-3359.
35. da Silva Correia, J.; Ulevitch, R. J. MD-2 and TLR4 N-linked glycosylations are important for a functional
lipopolysaccharide receptor. J Biol Chem 2002, 277, 1845-1854.
36. Viriyakosol, S.; McCray, P. B.; Ashbaugh, M. E.; Chu, J.; Jia, H. P.; Weiss, J.; Kirkland, T. N.
Characterization of monoclonal antibodies to human soluble MD-2 protein. Hybridoma (Larchmt) 2006, 25, 349-
357.
37. Resman, N.; Gradisar, H.; Vasl, J.; Keber, M.; Pristovsek, P.; Jerala, R. Taxanes inhibit human TLR4
signaling by binding to MD-2. FEBS Lett 2008, 582, 3929-3934.
38. Mancek-Keber, M.; Jerala, R. Structural similarity between the hydrophobic fluorescent probe and lipid A
as a ligand of MD-2. FASEB J 2006, 20, 1836-1842.
39. Ohto, U.; Fukase, K.; Miyake, K.; Shimizu, T. Structural basis of species-specific endotoxin sensing by
innate immune receptor TLR4/MD-2. Proc Natl Acad Sci U S A 2012, 109, 7421-7426.
40. Brandenburg, K.; Matsuura, M.; Heine, H.; Müller, M.; Kiso, M.; Ishida, H.; Koch, M. H. J.; Seydel, U.
48
Biophysical characterization of triacyl monosaccharide lipid a partial structures in relation to bioactivity.
Biophysical Journal 2002, 83, 322-333.
41. Seydel, U.; Schromm, A. B.; Brade, L.; Gronow, S.; Andrä, J.; Müller, M.; Koch, M. H. J.; Fukase, K.;
Kataoka, M.; Hashimoto, M.; Kusumoto, S.; Brandenburg, K. Physicochemical characterization of carboxymethyl
lipid A derivatives in relation to biological activity. FEBS Journal 2005, 272, 327-340.
42. Schrodinger, LLC. The PyMOL Molecular Graphics System, Version 1.8. In 2015.
43. Sestito, S. E.; Facchini, F. A.; Morbioli, I.; Billod, J.-M.; Martin-Santamaria, S.; Casnati, A.; Sansone, F.;
Peri, F. Amphiphilic guanidinocalixarenes inhibit lipopolysaccharide (LPS)- and lectin-stimulated toll-like receptor
4 (TLR4) Signaling. Journal of medicinal chemistry 2017, 60, 4882-4892.
44. A. Case, D.; Babin, V.; Berryman, J.; Betz, R.; Cai, Q.; S. Cerutti, D.; Cheatham, T.; Darden, T.; Duke, R.;
Gohlke, H.; Götz, A.; Gusarov, S.; Homeyer, N.; Janowski, P.; Kaus, J.; Kolossváry, I.; Kovalenko, A.; Lee, T.-S.;
Legrand, S.; A. Kollman, P. Amber 2014. 2014.
45. Frisch, M. J. T., G. W.; Schlegel, H. B.; Scuseria, G. E.; Robb, M. A.; Cheeseman, J. R.; Scalmani, G.;
Barone, V.; Mennucci, B.; Petersson, G. A.; Nakatsuji, H.; Caricato, M.; Li, X.; Hratchian, H. P.; Izmaylov, A. F.;
Bloino, J.; Zheng, G.; Sonnenberg, J. L.; Hada, M.; Ehara, M.; Toyota, K.; Fukuda, R.; Hasegawa, J.; Ishida, M.;
Nakajima, T.; Honda, Y.; Kitao, O.; Nakai, H.; Vreven, T.; Montgomery, J. A., Jr.; Peralta, J. E.; Ogliaro, F.;
Bearpark, M. J.; Heyd, J.; Brothers, E. N.; Kudin, K. N.; Staroverov, V. N.; Kobayashi, R.; Normand, J.;
Raghavachari, K.; Rendell, A. P.; Burant, J. C.; Iyengar, S. S.; Tomasi, J.; Cossi, M.; Rega, N.; Millam, N. J.; Klene,
M.; Knox, J. E.; Cross, J. B.; Bakken, V.; Adamo, C.; Jaramillo, J.; Gomperts, R.; Stratmann, R. E.; Yazyev, O.;
Austin, A. J.; Cammi, R.; Pomelli, C.; Ochterski, J. W.; Martin, R. L.; Morokuma, K.; Zakrzewski, V. G.; Voth, G.
A.; Salvador, P.; Dannenberg, J. J.; Dapprich, S.; Daniels, A. D.; Farkas, O.; Foresman, J. B.; Ortiz, J. V.;
Cioslowski, J.; Fox, D. J. Gaussian 09 Wallingford, CT, 2009.
46. Kirschner, K. N.; Yongye, A. B.; Tschampel, S. M.; GonzÁLez-OuteiriÑO, J.; Daniels, C. R.; Foley, B. L.;
Woods, R. J. GLYCAM06: a generalizable biomolecular force field. Carbohydrates. Journal of computational
chemistry 2008, 29, 622-655.
47. Morris, G. M.; Huey, R.; Lindstrom, W.; Sanner, M. F.; Belew, R. K.; Goodsell, D. S.; Olson, A. J.
Autodock4 and Autodocktools4: automated docking with selective receptor flexibility. Journal of computational
49
chemistry 2009, 30, 2785-2791.
48. Schrödinger Release 2017-4: Maestro, Schrödinger, LLC, New York, NY, 2017.
49. Gruber, A.; Mancek, M.; Wagner, H.; Kirschning, C. J.; Jerala, R. Structural model of MD-2 and functional
role of its basic amino acid clusters involved in cellular lipopolysaccharide recognition. J Biol Chem 2004, 279,
28475-28482.
50
Table of Contents graphic
51
Supplementary Information
Structure-activity relationship (SAR) in monosaccharide-based Toll-like receptor 4
(TLR4) antagonists
Fabio A. Facchini,a Lenny Zaffaroni,a Alberto Minotti,a Silvia Rapisarda,a Valentina
Calabrese,a Matilde Forcella,a Paola Fusi,a Cristina Airoldi,a Carlotta Ciaramelli,a Jean-
Marc Billod,b Andra B. Schromm,c Harald Braun,d Charys Palmer,e Rudi Beyaert,d
Roman Jerala,f Grisha Pirianov,e Sonsoles Martin-Santamaria,b Francesco Peria*
Index:
- Molecular Modeling
- NMR spectroscopy
- FT-IR spectroscopy
- Small angle X-ray scattering (SAXS)
- Chemistry, general
- Synthesis and characterization of new compounds
- Biology
52
Molecular Modeling
Figure S1. A) Full view of CD14 (in light blue). Superimposed best-score docked poses of FP10 (in orange), FP12 (in yellow), FP7 (in green), and FP116 (in violet) ligands are shown. B) Close-up of the binding pocket of CD14, showing the major interactions of the head groups of the ligands docked within the protein. C) Top view of the binding pocket of CD14. CD14 residues that form the hydrophobic pocket and whose side chains are close to the FA chains of the docked ligands are displayed in sticks and partially transparent spheres.
53
Figure S2. On the left: representation of type A (antagonist-like) binding mode as known from lipid IVa in PDB-ID 2E59. On the right: representation of type B (agonist-like) binding mode as for E. coli lipid A in PDB-ID 3FXI.
A) Type A binding (antagonist-like) B) Type B binding (agonist-like)
Figure S3. Selected docked poses of each ligand for MD simulations. A) Type A antagonist-like binding pose. B) Type B agonist-like binding pose. Ligands are depicted following the CPK coloring scheme, excepting the carbon atoms that are shown in orange for FP10, in yellow for FP12, in green for FP7, and in violet for FP116. TLR4 is colored dark, MD-2 is shown in light grey and Phe126 side chain is represented in sticks.
54
A) B)
Figure S4. Molecular dynamics simulations of the TLR4/MD-2 system in complex with ligands FP10, FP12, FP7, and FP116. A) RMSD of the MD-2 backbone over time. B) RMS fluctuations per residues of MD-2.
A) B)
Figure S5. A) Representation of the vector from the -carbon (CA) of Pro78 to the -carbon of Thr105, and the vector from amide -carbon atom (C11) and the ester -carbon atom (C21) of FP7, used to follow the orientation of the ligands along the MD simulations (cf. S4). FP7 is used as an example; the same applies for the other ligands. MD-2 is represented in grey an FP7 is depicted in CPK coloring at the exception of the carbon atoms that are in green. B) Representation of two vectors, within MD-2, starting both from the alpha-carbon (CA) of residue Phe126 to, respectively, the phenyl C-4 atom (CZ) of the same residue and the -carbon (CA) of residue Ser21. Agonist MD-2 from PDB-ID 2E59 and antagonist MD-2 from PDB-ID 3FXI are represented in semi-transparent blue and pink cartoons respectively.
55
A) B)
Figure S6. A) Angle between two vectors along the MD simulation projected over time. First vector was defined between the amide -Carbon atom and the ester -carbon atom of the ligand, and the second vector between the -Carbon atoms of residues Pro78 and Thr105 of MD-2 (cf. S5A). Angle between 0 and 90 degrees is characteristic of the type B binding (agonist-like) as observed in the PDB-ID 3FXI (TLR4/MD-2/lipid-A complex); angle between 90 and 180 degrees is characteristic of the type A binding mode (antagonist-like) as observed in the PDB-ID 2E59 (TLR4/MD-2/lipid-IVa complex). B) Percentage of time frames along the MD simulation projected over angle.
Figure S7. On the left: angle between two vectors defined in Figure S5B. The angle between
56
these two arbitrarily selected vectors plotted over time illustrates the flip that residue Phe126 undergoes during the MD simulation when MD-2 is engaged by FP116 in the type A binding mode. On the right: superimposition of different snapshots (one for each simulated nanosecond), from the MD simulations, colored from blue (t=0ns) to red (t=50ns). From these snapshots only ligands (as lines) and residue Phe126 (as sticks) are made visible.
Figure S8. Computed logP values for compounds FP10, FP12, FP7 and FP116, as calculated in Maestro (www.schroedinger.com ).
Modified GAFF parameters for the phosphate group in the FP ligands:FRCMOD
BONDOs-p5 230.0 1.610 #OR-P from phosaa10oh-p5 230.0 1.610 #OQ-P from phosaa10o -p5 525.0 1.480 #OP-P from phosaa10ho-oh 553.0 0.960 #HO-OQ from phosaa10
ANGLEo -p5-Os 100.0 108.23 #OP-P-OR from phosaa10oh-p5-Os 90.0 108.23 #OQ-P-OR from phosaa10Cg-Os-p5 100.0 120.50 #CT-OR-P from phosaa10o -p5-o 140.0 119.90 #OP-P -OP from phosaa10o -p5-oh 90.0 108.23 #OP-P -OQ from phosaa10ho-oh-p5 100.0 113.28 #HO-OQ-P from phosaa10
DIHEX -oh-p5-X 3 0.75 0.0 3. #X -OS-P -X from parm.99X -Os-p5-X 3 0.75 0.0 3. #X -OH-P -X from parm.99p5-Os-Cg-Cg 1 0.10 0.0 -3 #P -Os-Cp-Cg from GLYCAM_06j p5-Os-Cg-Cg 1 0.05 0.0 -2 #P -Os-Cp-Cg from GLYCAM_06jp5-Os-Cg-Cg 1 -1.20 0.0 1 #P -Os-Cp-Cg from GLYCAM_06j
57
H1-Cg-Os-p5 1 0.07 0.0 3. #H1-Cp-Os-P from GLYCAM_06jH2-Cg-Os-p5 1 0.07 0.0 3. #H1-Cp-Os-P from GLYCAM_06jOs-Cg-Os-p5 1 0.40 0.0 -3 #Os-Cp-Os-P from GLYCAM_06j Os-Cg-Os-p5 1 0.40 0.0 -2 #Os-Cp-Os-P from GLYCAM_06jOs-Cg-Os-p5 1 -0.50 0.0 1 #Os-Cp-Os-P from GLYCAM_06j
58
NMR spectroscopyFreeze-dried compounds were reconstituted in 10 mM deuterated phosphate buffer at different concentration, ranging from 100 µM to 1 mM. pH values were measured with a Microelectrode (Mettler-Toledo, Greifensee, Switzerland) for 5 mm NMR tubes and adjusted to 7.4 with small amounts (few μL) of NaOD or DCl. The pH* reading in D2O was corrected for the deuterium isotope effect at the glass electrode. The acquisition temperature was 25 °C. All spectra were acquired on a Bruker AVANCE III 600 MHz NMR spectrometer equipped with a QCI (1H, 13C, 15N/31P, and 2H lock) cryogenic probe. 1D 1H NMR spectra were recorded with water suppression (noesygppr1d pulse sequences in Bruker library), T2-editing (cpmgpr1d pulse sequences in Bruker library) or diffusion-editing (ledbpgppr2s1d pulse sequences in Bruker library), 256 scans, a spectral width of 20 ppm, and a relaxation delay of 5 s. They were processed with a line broadening of 0.3 Hz and automatically phased and baseline corrected. Chemical shift values were internally calibrated to the D2O peak at 4.79 ppm of a spectrum recorded without water saturation (zg pulse sequences in Bruker library.
Figure S9. Comparison between FP7 (spectra A, B, C, D and E), FP10 (spectra F, G and H),
59
FP12 (spectra I, L and M) and FP116 (spectra N, O and P) 1H NMR spectra after compound dissolution in deuterated phosphate buffer 10 mM, pH 7.4, 25 °C. A) FP7 100 µM, 1H NMR spectrum; B) FP7 125 µM, 1H NMR spectrum; C) FP7 250 µM, 1H NMR spectrum; D) FP7 250 µM, T2-edited 1H NMR spectrum; E) FP7 250 µM, diffusion-edited 1H NMR spectrum; F) FP10 500 µM, 1H NMR spectrum; G) FP10 500 µM, T2-edited 1H NMR spectrum; H) FP10 500 µM, diffusion-edited 1H NMR spectrum, I) FP12 500 µM, 1H NMR spectrum; L) FP12 500 µM, T2-edited 1H NMR spectrum; M) FP12 500 µM, diffusion-edited 1H NMR spectrum; N) FP116 250 µM, 1H NMR spectrum; O) FP116 250 µM, T2-edited 1H NMR spectrum; P) FP116 250 µM, diffusion-edited 1H NMR spectrum.
Fourier transform infrared (FT-IR) spectroscopy
For FT-IR measurements, lyophilized FP compounds were dissolved in chloroform:methanol 1:1 (v/v) and dried under a stream of nitrogen. The dried lipid film was solubilized in 20 mM HEPES, 150 mM NaCl, pH 7.4 to a final concentration of 10 mM and incubated in a ultrasound bath for 30 min at 60°C for aggregate formation. Aggregate preparations were temperature cycled three times between 4°C and 60°C (30 min each) and stored over night at 4°C before measurements. FT-IR measurements were performed on a IFS-55 spectrometer (Bruker, Billerica, MA, USA). Aggregate preparations were placed between CaF2 crystals and cooled to 4°C. Temperature scans were performed automatically between 5°C and 75°C with a heating rate of 0.6°C/min. For each measurement, 65 interferograms were accumulated, apodized, Fourier-transformed and converted to absorbance spectra. The main vibrational band used for the evaluation of the acyl chain mobility was the symmetrical stretching vibration ν s (CH2) located around 2852 cm− 1 as described in detail by Brandenburg et al.30 The temperature of phase transition (Tc) between the ordered -phase and the fluid -phase was determined as the temperature of the inflection point of the peak absorption wavenumber.
Small angle X-Ray scattering (SAXS)
SAXS scattering experiments of aggregates in solution were performed at the BioSAXS beamline P12 of the European Molecular Biology Laboratory (EMBL) at the highly brilliant synchrotron light source PETRA III at DESY (Hamburg, Germany). An automatically xy- adjustable capillary sample holder with temperature control was used to analyze the phase dependent structure of aggregates in solution. For SAXS measurements, lyophilized compounds were dissolved in chloroform:methanol 1:1 (v/v) and dried under a stream of nitrogen. The lipid film was solubilized in 20 mM HEPES, 150 mM NaCl, pH 7.4 to a final concentration of 80 mg/ml. Aggregate formation was induced by ultrasound bath for 30 min at 60°C. Preparations were then cycled three times for 30 min at 4°C and 60°C and stored over night at 4°C. Samples were placed in 80 mm long 1 mm thick glas capillaries (Hilgenberger GmbH, Malsfeld, Germany). Diffraction experiments were performed with 0.04 s exposure time. 20 frames per sample were averaged. Scattering patterns were investigated in the range of the scattering vector 0.1 < s < 1.0 nm-1 (s = 2 sin q/l, 2q scattering angle and l = 0.124 nm) and were recorded in dependence of temperature between 20°C and 80°C. Diffraction was detected on a 2D photon counting Pilatus 2M detector calibrated with silver behenate.
60
Chemistry
Synthesis and characterization of new compounds
1-O-tert-butyldimethylsilyl-2-deoxy-4,6-O-(4-methoxybenzylidene)-3-O-decanoyl-2-decanoylamino-β-D glucopyranoside (5)
Decanoic acid (1,13 mL, 5.83 mmol) was dissolved in dry CH2Cl2 (20 mL) under Ar atmosphere and EDC (1.67 g, 8.75 mmol) was added. After 30 min compound 4 (0.6 g, 1.46 mmol) and DMAP (178 mg, 1.46 mmol) dissolved in dry CH2Cl2 (10 mL) were added and the mixture was stirred at room temperature monitoring the disappearance of starting material by TLC (PE/EtOAc 9:1). The reaction mixture was diluted with CH2Cl2 and washed with saturated NaHCO3 solution and brine. The organic layer was dried over anhydrous Na2SO4, filtered and the solvents were evaporated in vacuo. The crude product was purified with flash chromatography (PE/EtOAc 9:1) to give compound 5 (830 mg, 79% yield)
1H-NMR: (400 MHz, CDCl3, 25 °C, TMS): δ 7.34 (d, 3JH,H = 8.5 Hz, 2H; 2x H-ortho) 6.82 (d, 3JH,H = 8.6 Hz, 2H; 2x H-meta) 6.38 (d, JH,H = 9.6 Hz, 1H; NH)5.55 (d, 3JH,H = 9.6 Hz, 1H; NH) 5.41 (s, 1H; CH-Ph) 5.22 (t, 3JH,H = 10.0 Hz, 1H, H-3) 4.57 (d, 3JH,H = 7.9 Hz, 1H, H-1) 4.18 – 4.03 (m, 2H; H-6a, H-2) 3.79 (s, 3H, OCH3) 3.79-3.67 (m, 2H, H-6b, H-4) 3.49 – 3.36 (m, 1H, H-5) 2.39 – 2.22 (m, 2H, CH2α-chain1) 2.18 – 1.96 (m, 2H, CH2α-chain2)1.60 – 1.50 (m, 4H; 2x CH2β-chains1,2) 1.23 (m, 24H, 12xCH2) 0.83 (m, 15H; 2xCH3-chains1,2, t-Bu-Si) -0.02 (s, 3H; CH3-Si), -0.06 (s, 3H; CH3-Si).
13C-NMR (101 MHz, CDCl3, 25 °C, TMS): δ 174.57, 172.89, 160.26, 129.76, 127.63, 113.74, 101.51, 97.60, 78.89, 71.93, 68.84, 66.83, 56.49, 55.48, 37.19, 34.51, 32.17, 29.93, 29.77, 29.72, 29.68, 29.66, 29.62, 29.57, 29.29,25.83, 25.76, 25.27, 22.94, 18.07, 14.38, -3.87, -5.09.
1-O-tert-butyldimethylsilyl-2-deoxy-4,6-O-(4-methoxybenzylidene)-3-O-dodecanoyl-2-dodecanoylamino-β-D glucopyranoside (6)
Compound 4 (100 mg, 0.243 mmol) was dissolved in dry Piridine (1 mL) under Ar atmosphere. At 0°C Lauroyl Chloride (135 µL, 0.583 mmol) and DMAP (20 mg, cat.) were sequentially added. The solution was then allowed to warm till rt and left stirring overnight. The day after TLC (PE/EA 9:1) shows the disappearance of starting material. The reaction mixture was then dried at the rotary evaporator and the crude was diluted with CH2Cl2 and washed with HCl 50% aq. solution and brine. The organic layer was dried over anhydrous Na2SO4, filtered and the solvents were evaporated in vacuo. The crude product was purified with flash chromatography (PE/EA 9:1) to give compound 6 (149 mg, 79% yield)
61
1H-NMR: (400 MHz, CDCl3, 25 °C, TMS): δ 7.35 (d, 3JH,H= 8.5 Hz, 2H; 2x H-ortho), 6.86 (d, 3JH,H= 8.5 Hz, 2H; 2x H-meta), 5.58 (d, 3JH,H = 9.9 Hz, 1H; NH) 5.42 (s, 1H; CH-Ph) 5.17 (t, 3JH,H
= 10.0 Hz, 1H; H-3) 4.70 (d, 3JH,H = 7.7 Hz, 1H, H-1) 4.24 (m, 1H, H-6a) 4.07 (m, 1H, H-2) 3.79 (m, 4H, OCH3, H6b) 3.69 (t, 3JH,H = 9.4 Hz, 1H; H-4) 3.47 (m, 1H; H-5) 2.38 – 2.24 (t, 3JH,H = 7.8 Hz, 2H; CH2α-chain1) 2.15 – 1.98 (m, 2H; CH2α-chain2) 1.64 – 1.44 (m, 4H; 2x CH2β-chains1,2) 1.19 (m, 32H; 16xCH2 chains) 0.96 – 0.70 (m, 15H, 2x CH3-chains1,2 , t-Bu-Si) 0.08 (s, 3H; CH3-Si), 0.05 (s, 3H; CH3-Si).
13C-NMR (101 MHz, CDCl3, 25 °C, TMS): δ 174.57, 172.89, 160.26, 129.76, 127.63, 113.74, 101.51, 97.60, 78.89, 71.93, 68.84, 66.83, 56.49, 55.48, 37.19, 34.51, 32.17, 29.93, 29.77, 29.72, 29.68, 29.66, 29.62, 29.57, 29.29, 25.83, 25.76, 25.27, 22.94, 18.07, 14.38, -3.87, -5.09.
1-O-tert-butyldimethylsilyl-2-deoxy-4,6-O-(4-methoxybenzylidene)-3-O-hexadecanoyl-2-hexadecanoylamino-β-D glucopyranoside (7)
Compound 4 (455 mg, 1.106 mmol) was dissolved in dry Piridine (4.6 mL) under Ar atmosphere. At 0°C Palmitoyl Chloride (805 µL, 2.653 mmol) and DMAP (50 mg, cat.) were sequentially added. The solution was then allowed to warm till rt and left stirring overnight. The day after TLC (PE/EA 9:1) shows the disappearance of starting material. The reaction mixture was then dried at the rotary evaporator and the crude was diluted with CH2Cl2 and washed with HCl 50% aq. solution and brine. The organic layer was dried over anhydrous Na2SO4, filtered and the solvents were evaporated in vacuo. The crude product was purified with flash chromatography (PE/EA 9:1) to give compound 7 (737 mg, 75% yield)
1H-NMR: (400 MHz, CDCl3, 25 °C, TMS): δ 7.35 (d, 3JH,H= 8.5 Hz, 2H; 2x H-ortho), 6.86 (d, 3JH,H= 8.5 Hz, 2H; 2x H-meta), 5.54 (d, 3JH,H = 9.9 Hz, 1H, NH) 5.46 (s, 1H; CH-Ph) 5.18 (t, 3JH,H
= 10.0 Hz, 1H; H-3) 4.71 (d, 3JH,H = 7.7 Hz, 1H; H-1) 4.26 (dd, 3JH,H= 10.3, 4.7 Hz, 1H; H-6a) 4.07 (m, 1H, H-2) 3.79 (m, 4H; OCH3, H6b) 3.69 (t, 3JH,H= 9.4 Hz, 1H, H-4) 3.47 (m, 1H, H-5) 2.38 – 2.24 (t, 3JH,H = 7.8 Hz, 2H, CH2α-chain1) 2.15 – 1.98 (m, 2H, CH2α-chain2) 1.64 – 1.44 (m, 4H; 2x CH2β-chains1,2) 1.19 (m, 48H, 24x CH2) 0.96 – 0.70 (m, 15H, 2x CH3-chains1,2 , tBu-Si) 0.08 (s, 3H; CH3-Si), 0.05 (s, 3H; CH3-Si).
13C NMR (101 MHz, CDCl3, 25 °C, TMS): δ 174.57, 172.89, 160.26, 129.76, 127.63, 113.74, 101.51, 97.60, 78.89, 71.93, 68.84, 66.83, 56.49, 55.48, 37.19, 34.51, 32.17, 29.93, 29.77, 29.72, 29.68, 29.66, 29.62, 29.57, 29.29, 25.83, 25.76, 25.27, 22.94, 18.07, 14.38, -3.87, -5.09.
1-O-tert-butyldimethylsilyl-2-deoxy-6-O-(4-methoxybenzyl)-3-O-decanoyl-2-decanoylamino- β -D-glucopyranoside (8).
Compound 5 (107 mg, 0.149 mmol) was dissolved in dry THF (6.3 mL) under Ar atmosphere and 4Å molecular sieves (300 mg) and NaCNBH3 (140 mg, 2.23 mmol) were added. The mixture was stirred at rt for 3 h, then at 0°C HCl (1 M in dioxane) was added dropwise until pH=1.5 and solution was left stirring at rt monitoring the consumption of starting material by
62
TLC (PE/EA 6:4). The solution was neutralized using NaHCO3 then extracted with CH2Cl2, the organic phase was dried over anhydrous Na2SO4, filtered and the solvent was evaporated in vacuo. The crude product was purified with flash chromatography (PE/EA/MeOH 7:3:0.05) affording compound 8 (63 mg, 70%)
1H-NMR (400 MHz, CDCl3, 25 °C, TMS): δ 7.25 (d, 3JH,H = 7.0 Hz, 2H; 2x H-ortho) 6.88 (d, 3JH,H = 8.6 Hz, 2H; 2x H-meta) 5.88 (d, 3JH,H = 9.4 Hz, 1H, NH) 5.21 (bs, 1H; H-1) 5.15 (t, 3JH,H = 9.9 Hz, 1H; H-3) 4.58 – 4.41 (m, 2H; CH2-Ph) 4.25 – 4.15 (m, 1H; H-2) 4.10 – 4.00 (m, 1H; H-5) 3.80 (s, 3H, OCH3) 3.80 – 3.72 (m, 1H; H-6a), 3.72 – 3.59 (m, 3H; H-6b, H-4) 2.32 (m, 2H, CH2α-chain1) 2.11 (m, 2H, CH2α-chain2) 1.56 (m, 4H, 2x CH2β-chains1,2) 1.25 (m, 24H, 12x CH2-chains) 0.86 (t, 3JH,H=6.5 Hz, 6H; 2x CH3-chains1,2 )
13C NMR (101 MHz, CDCl3, 25 °C, TMS) δ 175.38, 174.51, 159.15, 132.58, 129.53, 113.85, 91.83, 73.37, 73.28, 70.48, 70.06, 69.87, 55.27, 51.76, 36.75, 34.33, 31.86, 29.70, 29.44, 29.38, 29.31, 29.14, 25.64, 24.93, 22.67, 14.11, -1.60, -11.60.
1-O-tert-butyldimethylsilyl-2-deoxy-6-O-(4-methoxybenzyl)-3-O-dodecanoyl-2-dodecanoylamino- β -D-glucopyranoside (9).
Compound 6 (650 mg, 0.84 mmol) was dissolved in dry THF (35.4 mL) under Ar atmosphere and 4Å molecular sieves (1.9 g) and NaCNBH3 (789 mg, 12.56 mmol) were added. The mixture was stirred at rt for 1 h, then at 0°C HCl (1 M in dioxane) was added dropwise until pH=1.5 and solution was left stirring at rt monitoring the consumption of starting material by TLC (PE/EA 6:4). The solution was neutralized using NaHCO3 then extracted with CH2Cl2, the organic phase was dried over anhydrous Na2SO4, filtered and the solvent was evaporated in vacuo. The crude product was purified with flash chromatography (PE/EA/MeOH 7:3:0.05) affording compound 9 (120 mg, 22%)
1H-NMR: (400 MHz, CDCl3, 25 °C, TMS): δ 7.25 (d, 3JH,H = 7.0 Hz, 2H; 2x H-ortho) 6.88 (d, 3JH,H = 8.6 Hz, 2H; 2x H-meta) 5.88 (d, 3JH,H = 9.4 Hz, 1H; NH) 5.19 (bs, 1H, H-1) 5.15 (t, 3JH,H = 9.9 Hz, 1H; H-3) 4.58 – 4.41 (m, 2H; CH2-Ph) 4.25 – 4.17 (m,1H; H-2) 4.09 – 4.03 (m, 1H; H-5) 3.80 (s, 3H; OCH3) 3.72 – 3.59 (m, 3H; H-6a, H-6b, H-4) 2.32 (m, 2H; CH2α-chain1) 2.11 (m, 2H, CH2α-chain2) 1.56 (m, 4H; 2x CH2β-chains1,2) 1.25 (m, 32H; 16x CH2chains) 0.86 (t, 3JH,H=6.5 Hz, 6H; 2x CH3-chains1,2 )
13C-NMR (101 MHz, CDCl3, 25 °C, TMS): δ 175.38, 174.51, 159.15, 132.58, 129.10, 113.46, 94.501, 74.18, 73.72, 72.15, 71.43, 69.15, 56.04, 55.19, 50.40, 46.21, 40.31, 39.88, 37.99, 35.92, 33.71, 33.66, 33.59, 33.52, 33.51, 33.33, 33.26, 29.98, 28.68, 26.55, 17.27, 11.94, -1.60, -11.60.
1-O-tert-butyldimethylsilyl-2-deoxy-6-O-(4-methoxybenzyl)-3-O-hexadecanoyl-2-hexadecanoylamino- β -D-glucopyranoside (10).
63
Compound 7 (554 mg, 0.624 mmol) was dissolved in dry THF (30 mL) under Ar atmosphere and 4Å molecular sieves (1.6 g) and NaCNBH3 (588 mg, 9.35 mmol) were added. The mixture was stirred at rt for 1 h, then at 0°C HCl (1 M in dioxane) was added dropwise until pH=1.5 and solution was left stirring at rt monitoring the consumption of starting material by TLC (PE/EA 6:4). The solution was neutralized using NaHCO3 then extracted with CH2Cl2, the organic phase was dried over anhydrous Na2SO4, filtered and the solvent was evaporated in vacuo. The crude product was purified with flash chromatography (PE/EA/MeOH 7:3:0.05) affording compound 10 (56 mg, 12%)
1H-NMR: (400 MHz, CDCl3, 25 °C, TMS): δ 7.25 (d, 3JH,H =7.0 Hz, 2H; 2x H-ortho) 6.88 (d, 3JH,H = 8.6 Hz, 2H; 2x H-meta) 5.88 (d, 3JH,H = 9.4 Hz, 1H; NH) 5.19 (bs, 1H, H-1) 5.15 (t, 3JH,H = 9.9 Hz; 1H; H-3) 4.58 – 4.41 (m, 2H, CH2-Ph) 4.25 – 4.17 (m,1H; H-2) 4.09 – 4.03 (m, 1H, H-5) 3.80 (s, 3H, OCH3) 3.72 – 3.59 (m, 3H; H-6a, H-6b, H-4) 2.32 (m, 2H, CH2α-chain1) 2.11 (m, 2H, CH2α-chain2) 1.56 (m, 4H, 2x CH2β-chains1,2) 1.25 (m, 48H, 24x CH2chains) 0.86 (t, 3JH,H
= 6.5 Hz, 6H; 2x CH3-chains1,2 )
13C-NMR (101 MHz, CDCl3, 25 °C, TMS) δ 175.16, 173.18, 159.36, 129.52, 125.00, 113.85, 91.83, 73.38, 73.27, 70.50, 70.05, 69.88, 66.79, 55.26, 38.70, 36.76, 34.33, 33.99, 32.18, 31.92, 30.38, 29.71, 29.69, 29.67, 29.65, 29.53, 29.37, 29.31, 29.15, 28.90, 26.38, 25.64, 24.94, 24.46, 23.76, 23.43, 22.96, 22.69, 14.12, 14.04, 10.97
1,4-bis(O-dibenzylphosphoryl)-2-deoxy-6-O-(4-methoxybenzyl)-3-O-decanoyl-2-decanoylamino-
α -D-glucopyranose (11).
Compound 8 (250 mg, 0.41 mmol) was dissolved in dry CH2Cl2 (5.9 mL) under Ar atmosphere, then imidazolium triflate (404 mg, 1.85 mmol) and dibenzyl N,N-diisopropyl phosphoramidite (595 μl, 1.81 mmol) were added and the reaction was stirred at r.t. for 1.5 h (TLC PE/EA 7.5:2.5). The solution was then cooled in an ice bath and mCPBA (567 mg, 3.29 mmol) was added. The solution was then allowed to warm till rt and left stirring overnight. The mixture was then diluted with CH2Cl2, washed with a saturated solution of NaHCO3 and brine. The organic layer was dried over anhydrous Na2SO4, filtered and the solvents were evaporated in vacuo. The crude product was purified with flash chromatography (PE/EA 7:3) affording compound 11 (259 mg, 56%).
1H-NMR: (400 MHz, CDCl3, 25 °C, TMS): δ 7.39 – 7.29 (m, 20H; 4x BnO-P) 7.17 (d, 3JH,H = 8.4 Hz, 1H, 2x H-ortho PMB) 6.76 (d, 3JH,H = 8.4 Hz, 2H, 2x H-meta PMB) 5.69 (dd, 3JH,P= 5.6, 3JH,H= 3.2 Hz, 1H; H-1), 5.59 (d, 3JH,H= 9.1 Hz, 1H; NH), 5.27 (dd, 3JH,H= 10.8, 9.3 Hz, 1H; H-3), 5.10 – 4.98 (m, 4H; 2x CH2(Ph)-O-P), 4.96 – 4.82 (m, 4H; 2x CH2(Ph)-O-P), 4.61 (dd, 3JH,H= 18.8, 9.2 Hz, 1H; H-4), 4.42 – 4.25 (m, 3H; CH2-Ph PMB: H-2), 4.06 – 3.95 (m, 1H; H-5), 3.71 (s, 3H; OCH3), 3.56 (s, 2H; H-6a, H-6b), 2.13 (t, 3JH,H= 7.7 Hz, 2H; CH2α-chain1), 1.92 – 1.76 (m, 2H; CH2α-chain2), 1.40 (m, 4H; 2x CH2β-chains1,2), 1.35 – 1.07 (m, 24H;12x CH2 chains),
64
0.88 (t, 3JH,H= 6.6 Hz, 6H; 2x CH3-chains1,2).
13C-NMR (101 MHz, CDCl3, 25 °C, TMS): δ 174.29, 173.05, 159.07, 135.81, 135.74, 135.52, 135.44, 135.37, 135.33, 135.26, 129.79, 129.34, 128.75, 128.72, 128.66, 128.64, 128.59, 128.55, 128.51, 128.04, 127.99, 127.94, 127.91, 113.55, 96.19, 73.04, 72.83, 71.73, 71.67, 70.14, 69.80, 69.74, 69.69, 69.64, 69.59, 69.55, 69.50, 69.30, 69.24, 69.19, 67.30, 55.12, 51.70, 36.75, 34.33, 31.86, 29.70, 29.44, 29.38, 29.31, 29.14, 25.64, 24.93, 22.67, 14.11
1,4-bis(O-dibenzylphosphoryl)-2-deoxy-6-O-(4-methoxybenzyl)-3-O-dodecanoyl-2-
dodecanoylamino- α -D-glucopyranose (12).
Compound 9 (100 mg, 0.15 mmol) was dissolved in dry CH2Cl2 (2.4 mL) under Ar atmosphere, then imidazolium triflate (148 mg, 0.678 mmol) and dibenzyl N,N-diisopropyl phosphoramidite (218 μl, 0.663 mmol) were added and the reaction was stirred at r.t. for 1.5 h (TLC PE/EA 7.5:2.5). The solution was then cooled in an ice bath and mCPBA (208 mg, 1.205 mmol) was added. The reaction was stirred at 0 °C for 2 h, then the mixture was diluted with CH2Cl2, washed with a saturated solution of NaHCO3 and brine. The organic layer was dried over anhydrous Na2SO4, filtered and the solvents were evaporated in vacuo. The crude product was purified with flash chromatography (PE/EA 7:3) affording compound 12 (95 mg, 53%).
1H-NMR: (400 MHz, CDCl3, 25 °C, TMS): δ 7.39 – 7.29 (m, 20H; 4x BnO-P) 7.17 (d, 3JH,H = 8.4 Hz, 1H, 2x H-ortho PMB) 6.76 (d, 3JH,H = 8.4 Hz, 2H, 2x H-meta PMB) 5.69 (dd, 3JH,P= 5.6, 3JH,H= 3.2 Hz, 1H; H-1), 5.59 (d, 3JH,H= 9.1 Hz, 1H; NH), 5.28 (dd, 3JH,H= 10.8, 9.3 Hz, 1H; H-3), 5.10 – 4.98 (m, 4H; 2x CH2(Ph)-O-P), 4.96 – 4.82 (m, 4H; 2x CH2(Ph)-O-P), 4.67 – 4.54 (dd, 3JH,H= 18.8, 9.2 Hz, 1H; H-4), 4.47-4.26 (m, 3H; CH2-Ph PMB, H-2), 4.00 (m, 1H; H-5), 3.71 (s, 3H; OCH3), 3.56 (s, 2H; H-6a, H-6b), 2.13 (t, 3JH,H= 7.7 Hz, 2H; CH2α-chain1), 1.92 – 1.76 (m, 2H; CH2α-chain2), 1.40 (m, 4H; CH2β-chains1,2), 1.35 – 1.07 (m, 32H;16x CH2 chains), 0.88 (t, 3JH,H= 6.6 Hz, 6H; 2x CH3-chains1,2).
13C NMR (101 MHz, CDCl3, 25 °C, TMS): δ 174.29, 173.05, 159.07, 135.81, 135.74, 135.52, 135.44, 135.37, 135.33, 135.26, 129.79, 129.34, 128.75, 128.72, 128.66, 128.64, 128.59, 128.55, 128.51, 128.04, 127.99, 127.94, 127.91, 113.55, 96.19, 73.04, 72.83, 71.73, 71.67, 70.14, 69.80, 69.74, 69.69, 69.64, 69.59, 69.55, 69.50, 69.30, 69.24, 69.19, 67.30, 55.12, 51.70, 36.29, 33.94, 31.94, 29.73, 29.69, 29.53, 29.39, 29.36, 29.35, 29.27, 29.13, 25.39, 24.60, 22.71, 14.16.127.63, 113.74, 101.51, 97.60, 78.89, 71.93, 68.84, 66.83, 56.49, 55.48, 37.99, 35.92, 33.71, 33.66, 33.59, 33.52, 33.51, 33.33, 33.26, 29.98, 28.68, 26.55, 17.27, 11.94
1,4-bis(O-dibenzylphosphoryl)-2-deoxy-6-O-(4-methoxybenzyl)-3-O-hexadecanoyl-2-hexadecanoylamino- α -D-glucopyranose (13).
65
Compound 10 (56 mg, 0.072 mmol) was dissolved in dry CH2Cl2 (2.0 mL) under Ar atmosphere, then imidazolium triflate (79 mg, 0.361 mmol) and dibenzyl N,N-diisopropyl phosphoramidite (116 μl, 0.353 mmol) were added and the reaction was stirred at r.t. for 1.5 h (TLC PE/EA 7.5:2.5). The solution was then cooled in an ice bath and mCPBA (100 mg, 0.579 mmol) was added. The solution was then allowed to warm till rt and left stirring overnight. The mixture was then diluted with CH2Cl2, washed with a saturated solution of NaHCO3 and brine. The organic layer was dried over anhydrous Na2SO4, filtered and the solvents were evaporated in vacuo. The crude product was purified with flash chromatography (PE/EA 7:3) affording compound 13 (48 mg, 51%).
1H-NMR: (400 MHz, CDCl3, 25 °C, TMS): δ 7.39 – 7.29 (m, 20H; 4x BnO-P) 7.17 (d, 3JH,H= 8.4 Hz, 1H, 2x H-ortho) 6.76 (d, 3JH,H= 8.4 Hz, 2H, 2x H-meta) 5.69 (dd, 3JH,P= 5.6, 3JH,H= 3.2 Hz, 1H; H-1), 5.65 (d, 3JH,H= 9.1 Hz, 1H; NH), 5.28 (dd, 3JH,H= 10.8, 9.3 Hz, 1H; H-3), 5.10 – 4.98 (m, 1H,4H; 2x CH2(Ph)-O-P), 4.96 – 4.82 (m, 1H,4H; 2x CH2(Ph)-O-P), 4.61 (dd, 3JH,H= 18.8, 9.2 Hz, 1H; H-4), 4.35 (m, 3H; CH2-Ph PMB; H-2), 4.00 (d, 3JH,H= 9.7 Hz, 1H; H-5), 3.71 (s, 3H; OCH3), 3.56 (s, 2H; H-6a, H-6b), 2.13 (t, 3JH,H= 7.7 Hz, 2H; CH2α-chain1), 1.92 – 1.76 (m, 2H; CH2α-chain2), 1.40 (m, 4H; CH2β-chains1,2), 1.35 – 1.07 (m, 48H; 24x CH2 chains), 0.88 (t, 3JH,H= 6.6 Hz, 6H; 2x CH3chains1,2).
13C NMR (101 MHz, CDCl3, 25 °C, TMS): δ 174.29, 173.05, 159.07, 135.81, 135.74, 135.52, 135.44, 135.37, 135.33, 135.26, 129.79, 129.34, 128.75, 128.72, 128.66, 128.64, 128.59, 128.55, 128.51, 128.04, 127.99, 127.94, 127.91, 113.55, 96.19, 73.04, 72.83, 71.73, 71.67, 70.14, 69.80, 69.74, 69.69, 69.64, 69.59, 69.55, 69.50, 69.30, 69.24, 69.19, 67.30, 55.12, 51.70, 38.70, 36.76, 34.33, 33.99, 32.18, 31.92, 30.38, 29.71, 29.69, 29.67, 29.65, 29.53, 29.37, 29.31, 29.15, 28.90, 26.38, 25.64, 24.94, 24.46, 23.76, 23.43, 22.96, 22.69, 14.12, 14.04, 10.97
1,4-diphosphoryl-2-deoxy -3-O-decanoyl-2-decanoylamino- α -D-glucopyranoside (FP10): Compound 11 (50 mg, 0.044 mmol) was dissolved in dry CH2Cl2/MeOH 1:2 (2.4 mL), and Pd on activated charcoal was then added in catalytic amounts. The reaction mixture was stirred at RT under H2 overnight (TLC EA 100%). Triethylamine (100 µL) was then added to the reaction mixture, and the suspension was filtered with a syringe filter. The triethylammonium salt was then passed over an Amberlite IR 120 Na+ exchange resin to remove triethylamine, giving compound FP10 as its sodium salt (28 mg, 91%).
1H-NMR: (400 MHz, CD3OD, 25 °C, TMS): δ 5.52 (dd, 3JH,P=5.6 Hz, 3JH,H=3.2 Hz, 1H; H-1), 5.34 (t, 3JH,H=9.9 Hz, 1H; H-3), 4.34 (m, 1H; H-4), 4.34 (m, 1H; H-2) 4.00 (m, 1H; H-5), 3.83 (m, 2H; H-6a, H-6b), 2.46–2.14 (m, 4H; 2x CH2α chains), 1.56 (m, 4H; 2x CH2β chains), 1.39–1.20 (m, 24H, 12x CH2 chains), 0.89 (t, 3JH,H=6.6 Hz, 6H; 2x CH3 chains);
13C-NMR (101 MHz CD3OD, 25 °C, TMS) δ 175.03, 173.52, 94.69, 72.37, 72.00, 70.64, 60.05, 51.66, 35.62, 33.69, 31.68, 30.18, 29.26, 29.23, 29.21, 29.12, 29.10, 28.96, 25.56, 24.39, 22.35,
66
13.06, -5.54.
ESI-MS: [M]- m/z = 646.3; found: m/z = 646.5; [M]2- m/z = 322.6; found: m/z = 322.8;
1,4-diphosphoryl-2-deoxy-3-O-dodecanoyl-2-dodecanoylamino- α -D-glucopyranoside (FP12):
Compound 12 (50 mg, 0.042 mmol) was dissolved in dry CH2Cl2/MeOH 1:2 (2.4 mL), and Pd on activated charcoal was then added in catalytic amounts. The reaction mixture was stirred at RT under H2 overnight (TLC EA 100%). Triethylamine (100 µL) was then added to the reaction mixture, and the suspension was filtered with a syringe filter. The triethylammonium salt was then passed over an Amberlite IR 120 Na+ exchange resin to remove triethylamine, giving compound FP12 as its sodium salt in quantitative yield (32 mg).
1H-NMR: (400 MHz, CD3OD, 25 °C, TMS): δ 5.52 (dd, 3JH,P= 5.6 Hz, 3JH,H= 3.2 Hz, 1H; H-1), 5.36 (t, 3JH,H=9.9 Hz, 1H; H-3), 4.34 (m, 1H; H-4), 4.26 (m, 1H; H-2) 4.00 (m, 1H; H-5), 3.83 (m, 2H; H-6a, H-6b), 2.46–2.14 (m, 4H; 2x CH2α chains), 1.56 (m, 4H; 2x CH2β chains), 1.39–1.20 (m, 32H, 16x CH2 chains), 0.89 ppm (t, 3JH,H=6.6 Hz, 6H; 2x CH3 chains);
13C NMR (101 MHz, CD3OD, 25 °C, TMS) δ 175.03, 173.52, 94.69, 72.37, 72.00, 70.64, 60.05, 51.66, 35.62, 33.69, 31.68, 30.18, 29.26, 29.23, 29.21, 29.12, 29.10, 28.96, 25.56, 24.39, 22.35, 13.06, -5.54.
ESI-MS: [M]- m/z = 702.3; found: m/z = 702.6; [M]2- m/z = 350.6; found: m/z = 350.8.
1,4-diphosphoryl-2-deoxy-3-O-hexadecanoyl-2-hexadecanoylamino- α -D-glucopyranoside (FP116):
Compound 13 (38 mg, 0.029 mmol) was dissolved in dry CH2Cl2/MeOH 1:2 (2.4 mL), and Pd on activated charcoal was then added in catalytic amounts. The reaction mixture was stirred at RT under H2 overnight (TLC EA 100%). Triethylamine (80 µL) was then added to the reaction mixture, and the suspension was filtered with a syringe filter. The triethylammonium salt was then passed over an Amberlite IR 120 Na+ exchange resin to remove triethylamine, giving compound FP116 as its sodium salt (21 mg, 84%).
1H-NMR: (400 MHz, CD3OD, 25 °C, TMS): δ 5.51 (dd, 3JH,P= 5.6 Hz, 3JH,H= 3.2 Hz, 1H; H-1), 5.34 (t, 3JH,H= 9.9 Hz, 1H; H-3), 4.34 (m, 1H; H-4), 4.34 (m, 1H; H-2) 4.00 (m, 1H; H-5), 3.83 (m, 2H; H-6a, H-6b), 2.46–2.14 (m, 4H; 2x CH2α chains), 1.56 (m, 4H; 2x CH2β chains), 1.39–1.20 (m, 48H; 24xCH2 chains), 0.89 ppm (t, 3JH,H= 6.6 Hz, 6H; 2x CH3 chains);
13C NMR (101 MHz, CD3OD, 25 °C, TMS) δ 174.99, 173.51, 145.75, 98.14, 72.32, 66.21, 60.10, 46.41, 38.78, 35.66, 33.70, 33.32, 31.70, 31.67, 30.18, 29.48, 29.41, 29.37, 29.27, 29.12, 29.00, 25.60, 24.41, 24.12, 23.49, 22.62, 22.36, 13.07, 7.79, -8.30.
67
ESI-MS: [M]- m/z = 814.5; found: m/z = 814.7; [M]2- m/z = 406.7; found: m/z = 407.0;
68
Biology
Figure S10. MTT viability assay on HEK cells for FP10, FP12 and FP14 compounds. Cells were treated with the higher concentration of compounds used in the other assays and incubated overnight. The DMSO:H2O 1:1 solution is used as vehicle control to check for solvent toxicity. FP116 was not included in the assay as it is not active. Data is normalized to PBS treatment and represent the mean percentage ± SEM of at least 3 independent experiments.
Figure S11. Dose-dependent activation of TLR4 signal in RAW-Blue™ cells by FP7, FP10,
69
FP12 and FP116 compounds. RAW-Blue™ cells were treated with increasing concentrations of the indicated compound. SEAP levels were quantified after 20 hours of incubation. The results were normalized to stimulation with the LPS alone and expressed as the mean percentage ± SEM of at least three independent experiments.
Figure S12. Effect of FP derivatives on cell viability in THP-1 cells. Cells were pre-treated with FP variants (0-10µM) in the presence (grey) and absence (black) of LPS. Plates were incubated overnight and cell viability was measured using an MTT assay. Results are expressed as percentage of untreated cells accepted as (100% cell viability).
70