Embed Size (px)
Citation preview
8/3/2019 Arnold Et Al. - 1991 - Unknown
http://slidepdf.com/reader/full/arnold-et-al-1991-unknown 1/12
8/3/2019 Arnold Et Al. - 1991 - Unknown
http://slidepdf.com/reader/full/arnold-et-al-1991-unknown 2/12
8754 Arnold et& Vibrationally resolved spectra of CA,,
similar to that of Yang et al.,” but at considerably higher
resolution, we have obtained vibrationally resolved photo-
electron spectra of the anions C; -Cl; . The use of an anion
precursor allows study of the single mass-selected neutral
molecule of interest, circumventing chromophore uncer-
tainties encountered in absorption experiments. The photo-
electron experiment also complements infrared absorption
experiments by providing vibrational frequencies which are
infrared inactive. In addition, since anion photodetachmentis a vertical process, the length of the observed vibrational
progression provides information about the difference in ge-
ometry between the anion and the neutral. The spectra pre-
sented here, with the exception of C,;, show evidence for
transitions between linear carbon anions and linear, carbon
neutrals. Electron affinities ( EAs) are measured for all the
linear carbon molecules. Vibrational frequencies are deter-
mined for many of the linear neutral carbon species and an
excited electronic state is assigned for C,. In addition, the
photoelectron spectra of C, and C, , and to a lesser extent
those of C; , Cc, and Cc, show contributions from what are
believed to be nonlinear isomers of the carbon anions. Thestructures of the nonlinear anions cannot be determined
from these spectra, but it is apparent that photodetachment
of these anions results in a significant geometrical reorgani-
zation of the neutral.
II. EXPERIMENTAL
The apparatus used in these experiments is a modified
version of our previously described anion time-of-tlight pho-
toelectron spectrometer.” Carbon anions are generated in a
Smalley-type laser vaporization/pulsed molecular beam
source.28 A XeCl excimer laser is focused onto a rotating
and translating graphite rod (0.25 in. diam). The resultingplasma is swept through a 1 cm long, 0.25 cm diam channel
by helium carrier gas pulsed from a molecular beam valve
(General Valve Series 9)) operated at a backing pressure of
-5 atm. The gas mixture expands, allowing relaxation of
molecular vibrations and rotations by collisions with the car-
rier gas atoms. The anions generated in the plasma are inject-
ed into a Wiley-McLaren-type time-of-flight mass spec-
trometerz9 with a pulsed electric field. After .acceleration to
an energy of 1 keV, the ions separate out by mass and are
detected by a microchannel plate detector. The mass resolu-
tion of the instrument, M/AM, is - 150. The ion of interest
is selectively detached by a properly timed pulse of lightfrom a pulsed Nd:YAG photodetachment laser. After pho-
todetachment, a dual microchannel plate detector at the end
of a 1 m field-free flight tube detects a small fraction
( ~0.01%) of the detached electrons. Time-of-flight analy-
sis yields electron kinetic energies (eKE); the instrumental
resolution is 8 meV at 0.65 eV and degrades as (eKE) 3’2 at
higher electron kinetic energies.
The experiments described below were performed with
the third and fourth harmonic frequencies (355 nm, 3.49 eV
and 266 nm, 4.66eV, respectively) of a Nd:YAG laser. The
plane-polarized laser beam can be rotated using a half-waveplate. In the spectra shown, unless otherwise specified, the
laser beam is polarized at 8 = 54.7” (magic angle) 3o withrespect to the direction of electron collection. The spectra
presented here are averaged for 100 000-500 000 laser shots
at 20 Hz repetition rate, and smoothed by convolution with a
5 meV full-width at half-maximum (FWHM) Gaussian. In
order to account for the small background electron signal
which results from scattered light interacting with the pho-
todetachment chamber surfaces in the 4.66 eV spectra, a
background spectrum is collected, smoothed and subtracted
from the data.
III. RESULTS
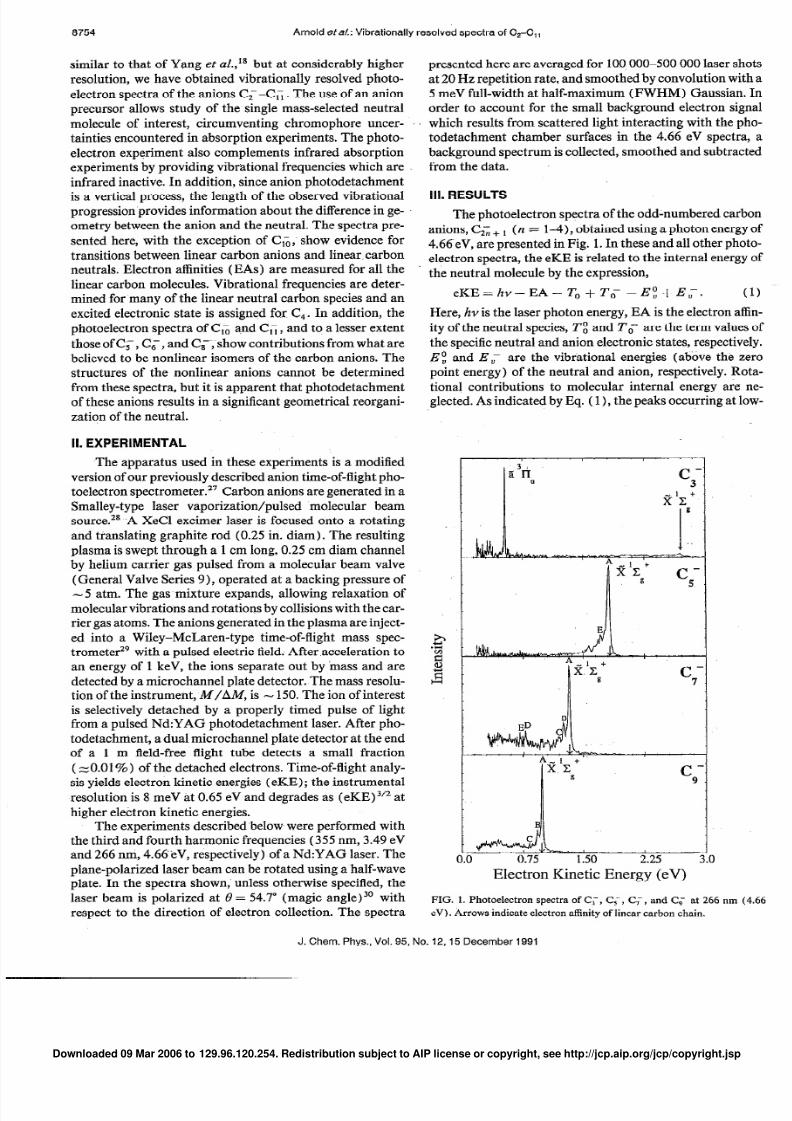
The photoelectron spectra of the odd-numbered carbon
anions, C2; + , (iz = l-4), obtained using a photon energy of
4.66eV, are presented in Fig. 1. In these and all other photo-
electron spectra, the eKE is related to the internal energy of
the neutral molecule by the expression,
eKE=/zhv--EA-To +T; -Elj+E;. (1)
Here, hv is the laser photon energy, EA is the electron affin-
ity of the neutral species, rz and To- are the term values of
the specific neutral and anion electronic states, respectively.
E E and E “- are the vibrational energies (above the zeropoint energy) of the neutral and anion, respectively. Rota-
tional contributions to molecular internal energy are ne-
glected. As indicated by Eq. ( 1 ), the peaks occurring at low-
0.6
Y
-‘--A,.l +’
XCg
,fQ@%?J!l~.
0.75 1.50 2.25
Electron Kinetic Energy (eV)
FIG. 1. Photoelectron spectra of C;, C;, C;, and Cc at 266 nm (4.66
eV) . Arrows indicate electron affinity of linear carbon chain.
J. Chem. Phys., Vol. 95, No. 12,15 December 1991
Downloaded 09 Mar 2006 to 129.96.120.254. Redistribution subject to AIP license or copyright, see http://jcp.aip.org/jcp/copyright.jsp
8/3/2019 Arnold Et Al. - 1991 - Unknown
http://slidepdf.com/reader/full/arnold-et-al-1991-unknown 3/12
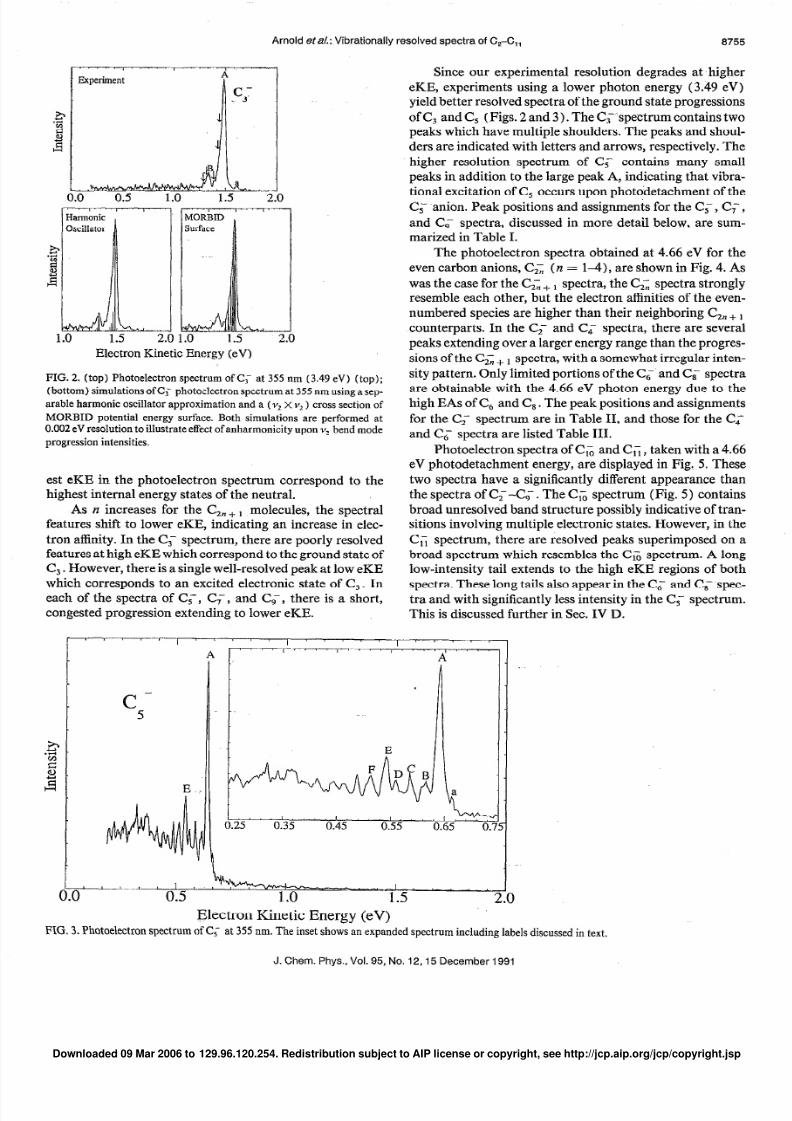
Arnold eta/.: Vibrationally resolved spectra of C,-C,, 8755
“...___
I‘1 --
Exuerimcnt Ip
0 1.5 2.0 1.0 1.5
Electron Kinetic Energy (eV)
2.0
FIG. 2. (top) Photoelectron spectrum of C; at 355 nm (3.49 eV) (top);
(bottom) simulations ofC; photoelectron spectrum at 355 nm using a sep-
arable harmonic oscillator approximation and a (y X v, ) cross section of
MORBID potential energy surface. Both simulations are performed at
0.002 eV resolution to illustrate effect of anharmonicity upon vz bend mode
progression ntensities.
est eKE in the photoelectron spectrum correspond to the
highest internal energy states of the neutral.
As n increases for the C,, + , molecules, the spectral
features shift to lower eKE, indicating an increase in elec-
tron affinity. In the C; spectrum, there are poorly resolvedfeatures at high eKE which correspond to the ground state of
C, . However, there is a single well-resolved peak at low eKE
which corresponds to an excited electronic state of C, . In
each of the spectra of CT, C;, and C,, there is a short,
congested progression extending to lower eKE.
Since our experimental resolution degrades at higher
eKE, experiments using a lower photon energy (3.49 eV)
yield better resolved spectra of the ground state progressions
of C, and C, (Figs. 2 and 3). The Cc-spectrum contains two
peaks which have multiple shoulders. The peaks and shoul-
ders are indicated with letters and arrows, respectively. The
higher resolution spectrum of C; contains many small
peaks in addition to the large peak A, indicating that vibra-tional excitation of C, occurs upon photo~detachment of the
C; -anion. Peak positions and assignments for the C; , C!; ,
and C!; spectra, discussed in more detail below, are sum-
marized in Table I.
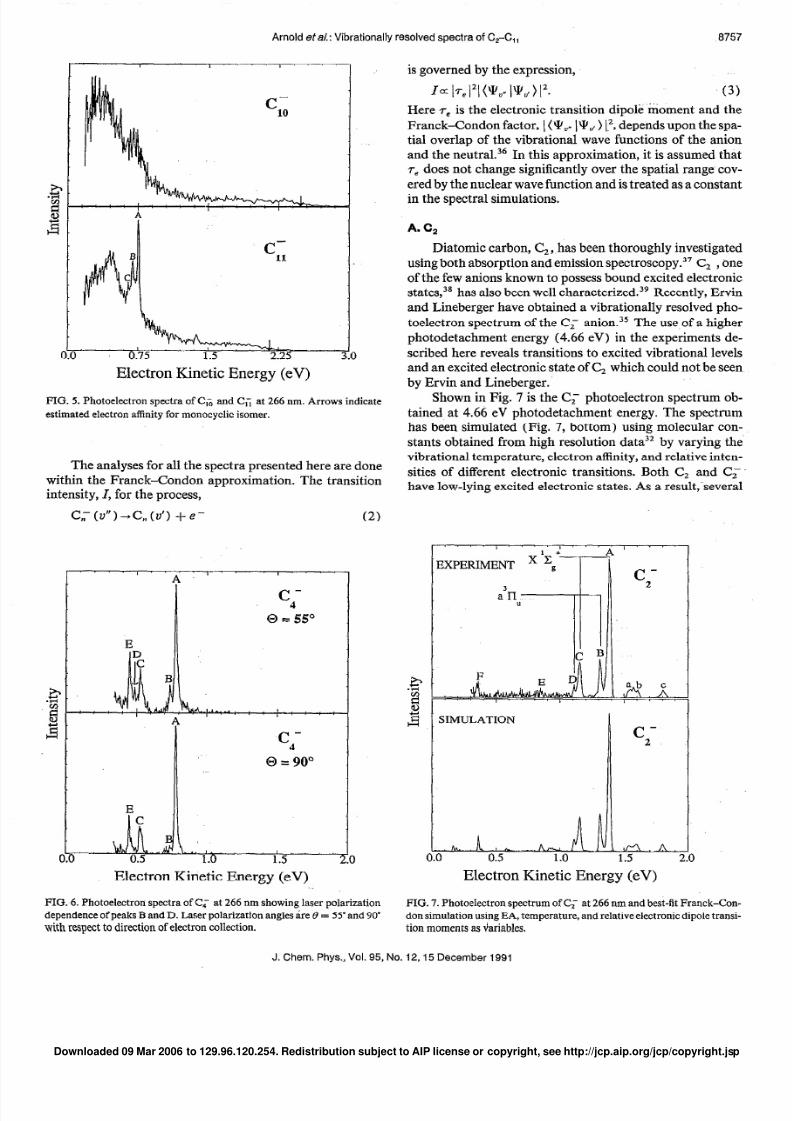
The photoelectron spectra obtained at 4.66 eV for the
even carbon anions, C!, (n = llr), are shown in Fig. 4. As
was the case for the C - n+ 1 spectra, the C;-, spectra strongly
resemble each other, but the electron affinities of the even-
numbered species are higher than their neighboring C,, + 1
counterparts. In the C,- and C!; spectra, there are several
peaks extending over a larger energy range than the progres-
sions of the C, + 1 spectra, with a somewhat irregular inten-sity pattern. Only l imited portions of the C; and C!; spectra
are obtainable with the 4.66 eV photon energy due to the
high EAs of C, and C, . The peak positions and assignments
for the (;- spectrum are in Table II, and those for the Cc
and Cc spectra are listed Table III.
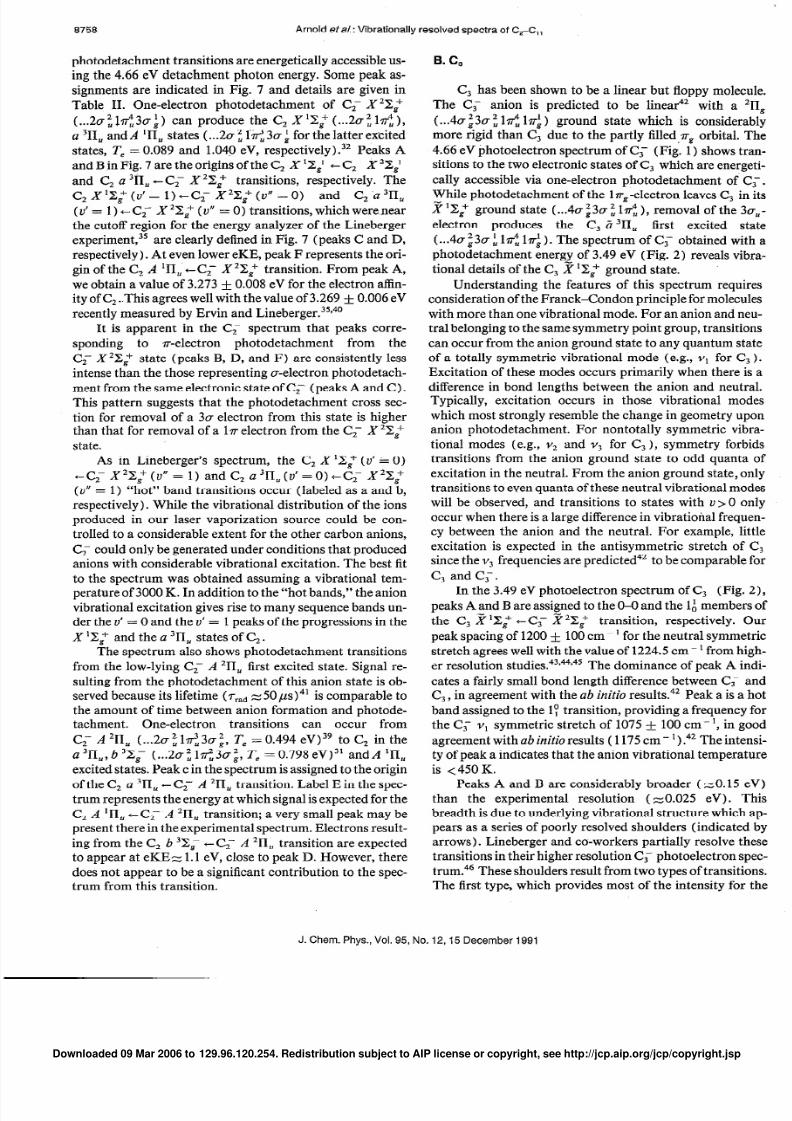
Photoelectron spectra of C; and C, , taken with a 4.66
eV photodetachment energy, are displayed in Fig. 5. These
two spectra have a significantly different appearance than
the spectra of C;--CL,- . The C!; spectrum (Fig. 5) contains
broad unresolved band structure possibly indicative of tran-
sitions involving multiple electronic states. However, in the
C, spectrum, there are resolved peaks superimposed on abroad spectrum which resembles the C, spectrum. A long
low-intensity tail extends to the high eKE regions of both
spectra. These long tails also appear in the Cc and Cc spec-
tra and with significantly less intensity in the C; spectrum.
This is discussed further in Sec. IV D.
--_r--r-T---7 , z I I , , , ___I--
E =
ok-. 0.35 .,,,,,,,,,,,,,,,,,.45 0.55 0.65 b.:
Electron Kinetic Energy (eV)FIG. 3. Photoelectron spectrum of Cc at 355 nm. The inset shows an expandedspectrum including labels discussed n text.
J. Chem. Phys., Vol. 95, No. 12,15 December 1991Downloaded 09 Mar 2006 to 129.96.120.254. Redistribution subject to AIP license or copyright, see http://jcp.aip.org/jcp/copyright.jsp
8/3/2019 Arnold Et Al. - 1991 - Unknown
http://slidepdf.com/reader/full/arnold-et-al-1991-unknown 4/12
TABLE II. Peak positions and assignments for the C;- photoelectron spec-
trum.
Peak Position
8756 Arnold eta/.:Vibrational ly resolved spectra of C&G,,
TABLE I. Peak positions and assignments for the C;, C;, and C; photo-
electron spectra.
Molecule Peak Position Splitting from Assignmentorigin (cm-‘)
GE A 0.641 0 Origin
B 0.616 202 7;
C 0.586 444 5:
D 0.560 653 SF 0E 0.542 798 zl
F 0.514 1024 6:
Gb A 1.302 0 Origin
B 1.234 548 3;
c 1.179 992 7:
D 0.773 4267 4l
Cg= A 0.978 0 Origin
B 0.918 484 4;
C 0.822 1258 3;
“The V~mode is a symmetric stretch and the vs, v~, and or modes are bend-ingmodes [seeFig. 8(b)].
‘The V~mode is a symmetric stretch, v4 s an antisymmetric stretch, and V,is a bending mode.‘The v? and v., modes are symmetric stretches,
A 1.384 x’~,+(u’=o)cx~2~(u”=o)
B 1.310 a ‘lx, (u’ = 0) +x2q+ (u” = 0)
C 1.153 X’H#+(u’= l)+xz&+(u”=O)
D 1.111 a’II,(d= l)+x*P&?(u” =O)
E 0.849 A’lI,(u’=O)e-A%I,(u” =0)F 0.362 A ‘II, (u’ = 0) +X*Z~ (u” = 0)
a 1.542 a3rI,(u’=o,~.~2~~(U” = 1)
b 1.609 X’&T (u’ = 0) +x2x; (u” = 1)
C 1.804 a %, (u’ = 0) c A *LI, (u” = 0)
a For each peak assigned, there are also underlying sequence bands which
are unresolved in the spectrum.
Data collected for Cc at two different laser polariza-
tions are shown in Fig. 6. The important difference between
the two spectra is the variation of the relative intensities ofpeaks B and D as a function of laser polarization angle; these
peaks are essentially absent in the 0 = 90 ’ spectrum. Thisbehavior will be addressed in greater detail below.
-c6
Assignment” (C, c C; )
IV. ANALYSIS AND DlSCUSSlON
In this section, the C!; and C; photoelect ron spectraare analyzed in considerable detail and used to lay the frame-work for the discussion of the larger carbon molecules. The
spectroscopy of C, (Refs. 3 1 and 32) and C!, (Refs. 9 and
33) has been studied intensely for several years using a var-
iety of techniques, including anion photoelect ron spectros-c~py.‘*,‘~,~’ Therefore, the discussion of these systems will
be limited to the new information provided by the photoelec-
tron spectra presented here. The spectra of the larger mole-
cules are treated more qualitatively.
TABLE III. Peak positions and assignments for the C; and Cc photoelec-
tron spectra.
Molecule Peak Position Splitting from Assignment
origin (cm- ‘)
Electron Kinetic Energy (eV)
A 0.778 0
B 0.736 339
C 0.526 2032D 0.487 2347
E 0.45 1 2637
A 0.475 0
B 0.45 1 194
C 0.416 480
D 0.312 1315
E 0.269 1660
-rigin
4;
1:1’4’0‘Agb
Origin
Sequence band3; or 7;
2:Sequence band
FIG. 4. Photoelectron spectra of C;, Cc, Cc, and Cc at 266 nm. Arrows
on axis indicate electron affinity of linear carbon chain.
*The v, mode is a symmetric stretch and V~ s a bend mode [see Fig. 8(a) 1.
bPeak E is assigned to an excited el ectronic state, see text.‘Both v2 and v, are symmetric stretches while v, is a bend mode.
J. Chem. Phys.. Vol. 95, No. 12‘15 December 1991
Downloaded 09 Mar 2006 to 129.96.120.254. Redistribution subject to AIP license or copyright, see http://jcp.aip.org/jcp/copyright.jsp
8/3/2019 Arnold Et Al. - 1991 - Unknown
http://slidepdf.com/reader/full/arnold-et-al-1991-unknown 5/12
Arnold et a/.:Vibrationall y resolved spectra of CTC,, 8757
Electron Kinetic Energy (eV)
FIG. 5. Photoelectron spectra of C, and C, at 266 nm. Arrows indicate
estimated electron affinity for monocyclic isomer.
The analyses for all the spectra presented here are done
within the Franck-Condon approximation. The transition
intensity, I, for the process,
CL(o”)-+C,(u’) +e-
I “ . ‘, ” I ” ”
A
E
A0.5 ?F-+ is
Electron Kinetic Energy (eV) Electron Kinetic Energy (eV)
(2)
FIG. 6. Photoelectron spectra of Cc at 266 nm showing laser polarization FIG. 7. Photoelectron spectrum of C;; at 266 nm and best-fit Franck-Con-
dependence of peaks B and D. Laser polarization angles are 0 = 55” and 90” don simulation using EA, temperature, and relative electronic dipole transi-
with respect o directionof electron ollection. tion moments as tiariables.
is governed by the expression,
I= I’-= 17 WV” IY”, ) 12. (3)
Here T, is the electronic transition dipole moment and the
Franck-Condon factor, I (‘4,. I I, USIz, depends upon the spa-
tial overlap of the vibrational wave functions of the anion
and the neutral.36 In this approximation, it is assumed that
7, does not change significantly over the spatial range cov-
ered by the nuclear wave function and is treated as a constant
in the spectral simulations.
A. C,
Diatomic carbon, C,, has been thoroughly investigated
using both absorption and emission spectroscopy.37 C; , bne
of the few anions known to possess bound excited electronic
states,38 has also been well characterized.3g Recently, Ervin
and Lineberger have obtained a vibrationally resolved pho-
toelectron spectrum of the C; anion.35 The use of a higher
photodetachment energy (4.66 eV) in the experiments de-
scribed here reveals transitions to excited vibrational levels
and an excited electronic state of C, which could not. be seen
by Ervin and Lineberger.’
Shown in Fig. 7 is the C!; photoelect ron spectrum ob-
tained at 4.64 eV photodetachment energy. The spectrum
has been simulated (Fig. 7, bottom) using molecular con-
stants obtained from high resolution data32 by varying the
vibrational temperature, electron affinity, and relative inten-
sities of different electronic transitions. Both C, and q.
have low-lying excited electronic states. As a result;several
SIMULATION
2.
J. Chem. Phys., Vol. 95, No. 12,15 December 1991Downloaded 09 Mar 2006 to 129.96.120.254. Redistribution subject to AIP license or copyright, see http://jcp.aip.org/jcp/copyright.jsp
8/3/2019 Arnold Et Al. - 1991 - Unknown
http://slidepdf.com/reader/full/arnold-et-al-1991-unknown 6/12
8758 Arnold &al.: Vibrationally resolved spectra of t&C,,
photodetachment transitions are energetically accessible us-
ing the 4.66 eV detachment photon energy. Some peak as-
signments are indicated in Fig. 7 and details are given in
Table II. One-electron photodetachment of q X2&?
(...2a2,1~~3,~) can produce the C, X12,+ (...2a2,17~:),
a 311uand A ‘II, states (...20 ‘, idu 30 i for the latter excited
states, T, = 0.089 and 1.040 eV, respectively).32 Peaks A
and B in Fig. 7 are the origins of the C, X ‘Zz + c X ‘xl
and C, a311,- C, X “&? transitions, respectively. TheC, X12,+ (u’ = 1) +C!; X22,+ (v” = 0) and C, a 311u
(u’ = 1) t CT X “2: (u” = 0) transitions, which were near
the cutoff region for the energy analyzer of the Lineberger
experiment,35 are clearly defined in Fig. 7 (peaks C and D,
respectively). At even lower eKE, peak F represents the ori-
gin of the C2 A ‘III, +-C2- X28,f transition. From peak A,
we obtain a value of 3.273 f 0.008 eV for the electron affin-
ity of C!, .This agrees well with the value of 3.269 * 0.006 eV
recently measured by Ervin and Lineberger.3’*40
B. C,
C, has been shown to be a linear but floppy molecule.
The C; anion is predicted to be lineaf12 with a Qp
(...40 : 30 “, 1~: 177-i ground state which is considerably
more rigid than C, due to the partly filled G-~orbital. The
4.66 eV photoelectron spectrum of CT (Fig. 1) shows tran-
sitions to the two electronic states of C, which are energeti-
cally accessible via one-elect ron photodetachment of C;.While photodetachment of the IT,-electron leaves C, in its
2 ‘EC ground state (...40 :3c~ t 1~” ), removal of the 3a, -
electron produces the C, ii 311, first excited state
(...4~~3~f,l~~l~~). The spectrum of Cc obtained with a
photodetachment energy of 3.49 eV (Fig. 2) reveals vibra-
tional details of the C, 2 ‘8: ground state.
It is apparent in the C; spectrum that peaks corre-
sponding to r-electron photodetachment from the
C!, X28,+ state (peaks B, D, and F) are consistently lessintense than the those representing a-electron photodetach-
ment from the same electronic state of CT (peaks A and C) .
This pattern suggests that the photodetachment cross sec-
tion for removal of a 3a electron from this state is higherthan that for removal of a la electron from the CT X ‘8:
state.
As in Lineberger’s spectrum, the C!, X ‘2: (0 ti 0)
tC,X*X,+(~II=l)andC,a’~~(u’=O)cC;X~8,f
(u” = 1) “hot” band transitions occur (labeled as a and b,
respectively). While the vibrational distribution of the ions
produced in our laser vaporization source could be con-
trolled to a considerable extent for the other carbon anions,C; could only be generated under conditions that produced
anions with considerable vibrational excitation. The best fit
to the spectrum was obtained assuming a vibrational tem-
perature of 3000 K. In addition to the “hot bands,” the anion
vibrational excitation gives rise to many sequence bands un-
der the v’ = 0 and the v’ = 1 peaks of the progressions in the
X ‘8,+ and the a 311ustates of C,.
Understanding the features of this spectrum requires
consideration of the Franck-Condon principle for molecules
with more than one vibrational mode. For an anion and neu-
tral belonging to the same symmetry point group, transitions
can occur from the anion ground state to any quantum state
of a totally symmetric vibrational mode (e.g., y1 for C, ).Excitation of these modes occurs primarily when there is a
difference in bond lengths between the anion and neutral.Typically, excitation occurs in those vibrational modes
which most strongly resemble the change in geometry upon
anion photodetachment. For nontotally symmetric vibra-
tional modes (e.g., ‘v, and Y:, for C, ), symmetry forbids
transitions from the anion ground state to odd quanta of
excitation in the neutral. From the anion ground state, only
transitions to even quanta of these neutral vibrational modes
will be observed, and transitions to states with u > 0 only
occur when there is a large difference in vibrational frequen-
cy between the anion and the neutral. For example, little
excitation is expected in the antisymmetric stretch of C,
since the Ye frequencies are predicted42 to be comparable for
C, and CT.
The spectrum also shows photodetachment transitions
from the low-lying CT A ‘111, first excited state. Signal re-
sulting from the photodetachment of this anion state is ob-
served because its lifetime (rrad =: 50 ~(19)~~s comparable tothe amount of time between anion formation and photode-
tachment. One-electron transitions can occur from
C; A ‘II, (-2~ : 1$,3a G, T, = 0.494eV)39 to C, in the
a311,,b3E; (...2~:17T2U3a$ T, =0.798eV)31 andA’II,
excited states. Peak c in the spectrum is assigned to the origin
of the CZ a 311u C2- A 211u ransition. Label E in the spec-
trum represents the energy at which signal is expected for the
c!, A ‘II, -Cc A ‘IL, transition; a very small peak may bepresent there in the experimental spectrum. Electrons result-
ing from the C, b 3”; + q d 211u ransition are expected
to appear at eKE--, 1.1 eV, close to peak D. However, there
does not appear to be a significant contribution to the spec-
trum from this transition.
In the 3.49 eV photoelectron spectrum of C; (Fig. 2))
peaks A and B are assigned to the O-O and the 1; members of
the C, 3 ‘2: + C, R “&+ transition, respectively. Our
peak spacing of 1200 + 100 cm ’ for the neutral symmetric
stretch agrees well with the value of 1224.5 cm - ’ from high-er resolution studies.43*44,45 he dominance of peak A indi-
cates a fairly small bond length difference between Cc and
C, , in agreement with the ab initio results.42 Peak a is a hot
band assigned to the 1: transition, providing a frequency for
the C; y1 symmetric stretch of 1075 f 100 cm _ ‘, in good
agreement with ab nitio results ( 1175 cm - ’ ) .42The intensi-
ty of peak a indicates that t he anion vibrational temperature
is ~450 K.
Peaks A and B are considerably broader ( ~0.15 eV)
than the experimental resolution ( ~0.025 eV). This
breadth is due to underlying vibrational structure which ap-
pears as a series of poorly resolved shoulders (indicated by
arrows). Lineberger and co-workers partially resolve these
transitions in their higher resolution Cc photoelectron spec-
trum.46 These shoulders result from two types of transitions.
The first type, which provides most of the intensity for the
J. Chem. Phys., Vol. 95, No. 12,15 December 1991
Downloaded 09 Mar 2006 to 129.96.120.254. Redistribution subject to AIP license or copyright, see http://jcp.aip.org/jcp/copyright.jsp
8/3/2019 Arnold Et Al. - 1991 - Unknown
http://slidepdf.com/reader/full/arnold-et-al-1991-unknown 7/12
Arnold eta/.:Vibrationall y resolved spectra of C,-C,, 8759
shoulders, is the 2$’ progression in the C, bend. The second
type is the 1: sequence band progression resulting from the
149 cm- i frequency difference for Y, between C, and C; .
The C, bending mode has a fundamental frequency9*47
of 63 cm-‘, which is significantly different from the calcu-
lated anion bending frequency ( v2 z, 300 cm - ’ ) .42 In addi-
tion, the neutral bending mode is very anharmonic and cou-
ples to both of the other C!, vibrational modes.45 All of theseeffects can produce excitation of the neutral upon anion pho-
todetachment, and the latter two effects create a vibrational
pattern for C, which is poorly described by a separable nor-
mal mode approximation.9~4’*48
The inadequacy of the normal mode approximation for
describing the C!, bend can been seen in Fig. 2. This shows
the results of a Franck-Condon calculation assuming sep-
arable harmonic oscillators for the y1 symmetric stretch and
the vz degenerate bend. The anion wave function is genera-
ted assuming an anion bending frequency of 300 cm - ’ based
upon ab initio predictions,4zJ49 and a symmetric stretch fre-
quency of 1075 cm-’ (discussed below). The simulationshows some excitation of the neutral bend due to the large
difference between the C, and CT bend frequencies. How-
ever, the frequency difference alone does not yield sufficient
bend excitation in C, .
In order to account for this discrepancy, an exact quan-
tum mechanical calculation.” of eigenvalues and Franck-
Condon intensities (Fig. 2)) was performed on a two-dimen-
sional cross section (‘t’, XY;) of the semiempirical Morse
oscillator rigid bender internal dynamics (MORBID) 51 po-
tential energy surface.52 This potential energy surface; gen-
erated by fitting Rohlfing’s laser-induced fluorescence
data,” includes the anharmonicity and vibrational couplingpresent between all three vibrational modes. The anion wave
function is the same as that used in the harmonic oscillator
simulation. Since the calculation considers only the bend
mode, the changes in the simulation from the harmonic os-
cillator results-are due to anharmonicity along the C, v2
coordinate. It is clear from this simulation that the extreme
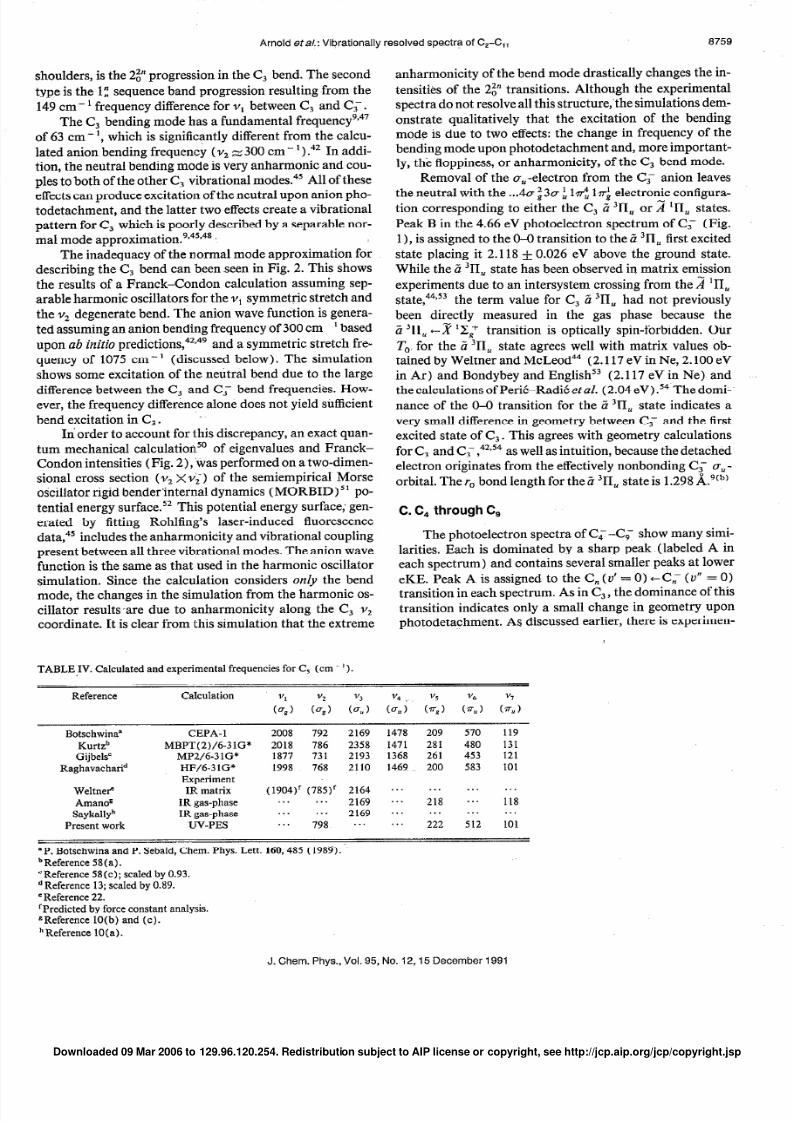
TABLE IV. Calculated and experimental frequencies for C, (cm ‘).
anharmonicity of the bend mode drastically changes the in-
tensities of the 2$’ transitions. Although the experimental
spectra do not resolve all this structure,‘the simulations dem-
onstrate qualitatively that the excitation of the bending
mode is due to two effects: the change in frequency of the
bending mode upon photodetachment and, more important-
ly, the floppiness, or anharmonicity, of the C, bend mode.
Removal of the a,-electron from the C; anion leavesthe neutral with the . .4a i3a k 11 lrri electronic configura-
tion corresponding to either the C, ii 311Uor 2 ‘IIU states.
Peak B in the 4.66 eV photoelectron spectrum of CT (Fig.
1 , is assigned to the O-O transition to the ii 311U irst excited
state placing it 2.118 t 0.026 eV above the ground state.
While the Z ‘II, state has been observed in matrix emission
experiments due to an intersystem crossing from the 1 ‘II,,
state,44Y53he term value for C, 2 311Uhad not previously
been directly measured in the gas phase because the
ii3rI L1 -B ‘Z,+ t ransition is optically spin-forbidden. Our
To for the ii 311Ustate agrees well with matrix values ob-
tained by Weltner and McLeod44 (2.117 eV in Ne, 2.100 eVin Ar) and Bondybey and English53 (2.117 eV in Ne) and
the calculations of Per&RadiC et al. (2.04 eV) .54 The domi-~
nance of the O-O transition for the ?i 311, state indicates a
very small difference in geometry between Cc and the first
excited state of C, . This agrees with geometry calculations
for C, and C; ,42,54 s well as intuition, because the detached
electron originates from the effectively nonbondi ng C; uU
orbital. The r, bond length for the 2 311, state is 1.298 A.9(b)
C. C, through C,
The photoelectron spectra of C!; --Cc show many simi-larities. Each is dominated by a sharp peak (labeled A in
each spectrum) and contains several smaller peaks at lower
eKE. Peak A is assigned to the C, (u’ = 0) +C; (0” = 0)
transition in each spectrum. As in C, , the dominance of this
transition indicates only a small change in geometry uponphotodetachment . As discussed earlier, there is experimen-
Reference Cdculation
Botschwina”
Kurt&Gijbels’
Raghavacha&
WeltneSAmanox
Saykallyh
Present work
CEPA- 1 2008 792 2169 1478 209 570 119MBPT(2)/6-31G* 2018 786 2358 1471 281 480 131
MP2/6-3 lG* 1877 731 2193 1368 261 453 121HF/6-3 lG* 1998 768 2110 1469 200 583 101
ExperimentIR matrix (1904)’ (785)’ 2164 ... ... ... ...
IR gas-phase .. ... 2169 *.. 218 ... 118IR gas-phase ... ..r 2169 . . . . . . . . . . . .
W-PES . . . 798 . . . . . . 222 512 101
“P. Botschwina and P. Sebald, Chem. Phys. Lett. 160,485 (1989).
‘Reference 58(a).“Reference 58(c); scaled by 0.93.
d Reference 13; scaled by 0.89.
‘Reference 22.‘Predicted by force constant analysis.
BReference 10(b) and (c).
hReference 10(a).
J. Chem. Phys., Vol. 95, No. 12,15 December 1991Downloaded 09 Mar 2006 to 129.96.120.254. Redistribution subject to AIP license or copyright, see http://jcp.aip.org/jcp/copyright.jsp
8/3/2019 Arnold Et Al. - 1991 - Unknown
http://slidepdf.com/reader/full/arnold-et-al-1991-unknown 8/12
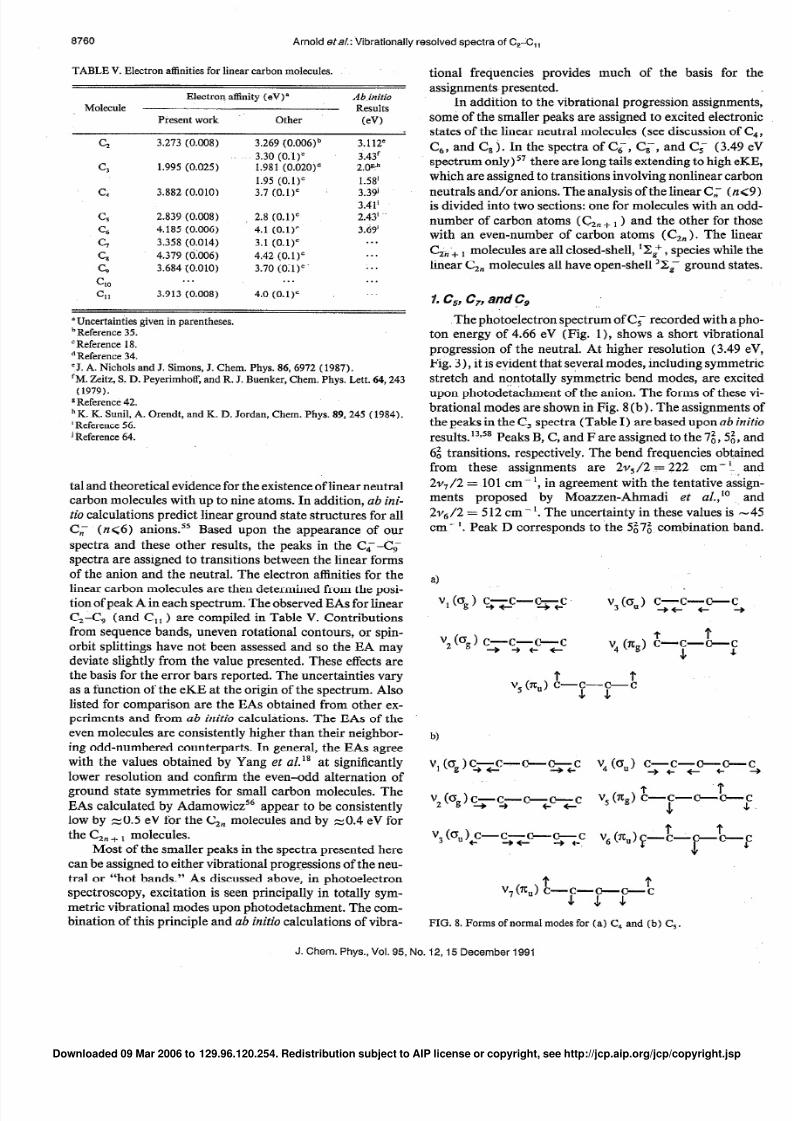
TABLE V. Electron affinities for linear carbon molecules.
Molecule
G
C3
c4
G
2
G
G
G3
c,,
Electron affinity (eV) *
Present work Other
3.273 (0.008) 3.269 (0.006)b
3.30 (o.l)=1.995 (0.025) 1.981 (0.020)d
1.95 (o.l)=3.882 (0.010) 3.7 (o.l)=
2.839 (0.008) 2.8 (0.1)’
4.185 (0.006) 4.1 (o.l)=
3.358 (0.014) 3.1 (0.1)’
4.379 (CkO6) 4.42 (0.1)’
3.684 (0.010) 3.70 (011)”. . . . . .
3.913 (0.008) 4.0 (0.1)’
Ab~initioResults
(eV)
3.112’
3.43’2.0K!h
1.58’3.39’
3.41’2.43’
3.69’..*
. . .
. . .
. . .
. . .
“Uncertainties given in parentheses.‘Reference 35.
‘Reference 18.
d Reference 34.‘J. A. Nichols and J. Simons, J. Chem. Phys. 86,6972 ( 1987).‘M. Zeitz, S. D. Peyerimhoff, and R. J. Buenker, Chem. Phys. Lett. 64,243
(1979).*Reference 42.‘K. K. Sunil, A. Orendt, and K. D. Jordan, Chem. Phys. 89,245 (1984).
’ Reference 56.i Reference 64.
tal and theoretical evidence for the existence of linear neutral
carbon molecules with up to nine atoms. In addition, ab ini-tio calculations predict linear ground state structures for all
CL (n<6) anions.” Based upon the appearance of our
spectra and these other results, the peaks in the Cc-Cc
spectra are assigned to transitions between the linear forms
of the anion and the neutral. The electron affinities for the
linear carbon molecules are then determined from the posi-
tion of peak A in each spectrum. The observed EAs for linear
C&-C, (and C,, > are compiled in Table V. Contributions
from sequence bands, uneven rotational contours, or spin-
orbit splittings have not been assessed and so the EA may
deviate slightly from the value presented. These effects arethe basis for the error bars reported. The uncertainties vary
as a function of the eKE at the origin of the spectrum. Also
listed for comparison are the EAs obtained from other ex-
periments and from ab initio calculations. The EAs of theeven molecules are consistently higher than their neighbor-
ing odd-numbered counterparts. In general, the EAs agree
with the values obtained by Yang et aZ.‘* at significantly
lower resolution and confn-m the even-odd alternation of
ground state symmetries for small carbon molecules. The
EAs calculated by Adamowiczs6 appear to be consistently
low by ~0.5 eV for the CZ, molecules and by -0.4 eV for
the G, + 1 molecules.
Most of the smaller peaks in the spectra presented here
can be assigned to either vibrational progressions of the neu-
tral or “hot bands.” As discussed above, in photoelectron
spectroscopy, excitation is seen principally in totally sym-metric vibrational modes upon photodetachment. The com-
bination of this principle and ab initio calculations of vibra-
8760 Arnold eta/: Vibrationally resolved spectra of C,-C,,
tional frequencies provides much of the basis for the
assignments presented.
In addition to the vibrational progression assignments,
some of the smaller peaks are assigned to excited electronic
states of the linear neutral molecules (see discussion of C,,
C!, , and C!, ) . In the spectra of Cc, Cc, and C; (3.49 eV
spectrum only)57 there are long tails extending to high eKE,
which are assigned to transitions involving nonlinear carbonneutrals and/or anions. The analysis of the linear C!; (n<9)
is divided into two sections: one for molecules with an odd-
number of carbon atoms (CZn + 1 and the other for those
with an even-number of carbon atoms (C,, 9.The linear
c,,, molecules are all closed-shell, ‘8:) species while the
linear C,, molecules all have open-shell 38; ground states.
1. G G, and?,
.The photoelectron spectrum of C!; recorded with a pho-
ton energy of 4.66 eV (Fig. 1 , shows a short vibrational
progression of the neutral. At higher resolution (3.49 eV,
Fig. 3)) it is evident that several modes, including symmetricstretch and nontotally symmetric bend modes, are excited
upon photodetachment of the anion. The forms of these vi-
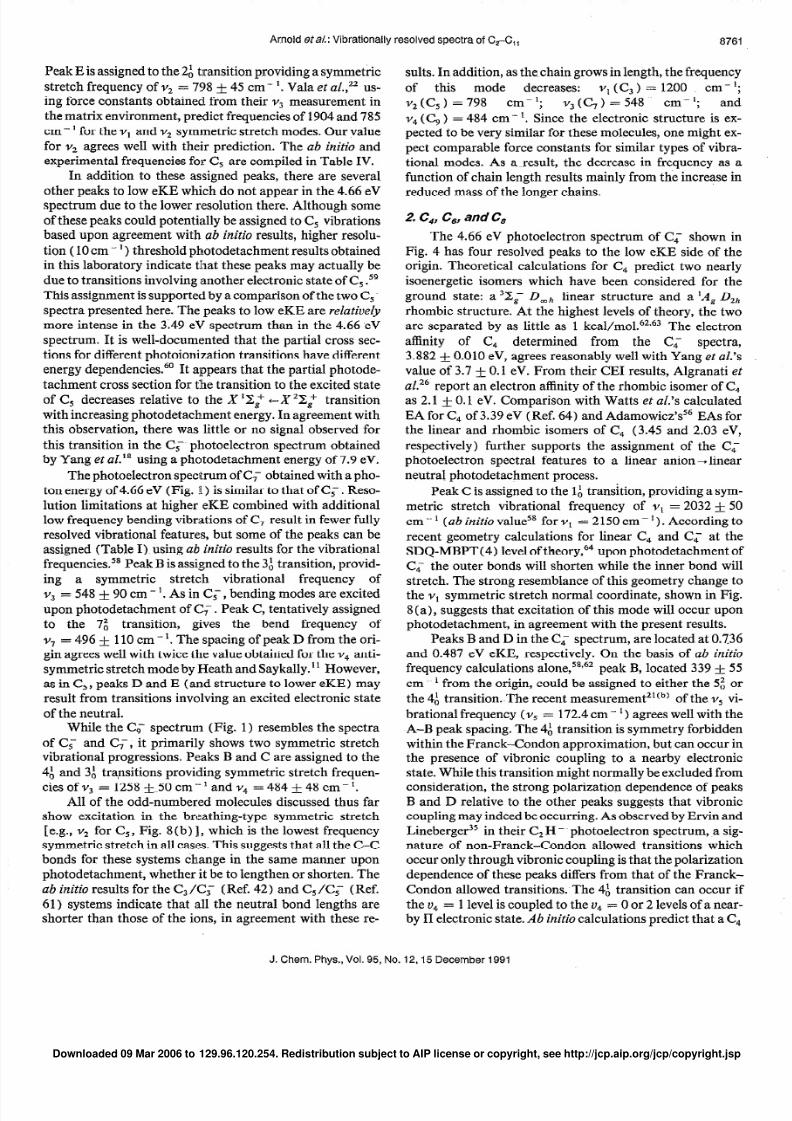
brational modes are shown in Fig. 8 (b) . The assignments of
the peaks in the C, spectra (Table I) are based upon ab initio
results. 13,58 eaks B, C, and F are assigned to the 7;) 5;) and
6; transitions, respectively. The bend frequencies obtained
from these assignments are 2~,/2 y 222 cm- ‘L; and
2~,/2 = 101 cm - ‘, in agreement with the tentative assign-
ments proposed by Moazzen-Ahmadi et al.,” and
21~~/2 = 5 12 cm -I. The uncertainty in these values is -45
cm- ‘. Peak D corresponds to the 5;7; combination band.
4
v, Q > c*-s-cr-$ v, (0,) c-c-c-c++t t
v2 cog > c-c-+ -3 ,T
tv4 (n,) L-c-c-;
J
rvs (7c”) E--p-~-C
* +
W
v, cogQ-2 -c-p-c v4 0,> “yyp-p- c,
v2<cgCT y- -yz--g+c v57cg)-C f--(;Lwc& J-
v3 0” +c-c+--+!+--~~c tV6 ”)--C- tr
c-f
* t
v7@,) L-c-c--o--J J. J
FIG. 8. Forms of normal modes for (a) C, and (b) C, .
J. Chem. Phys., Vol. 95, No. 12,15 December 1991Downloaded 09 Mar 2006 to 129.96.120.254. Redistribution subject to AIP license or copyright, see http://jcp.aip.org/jcp/copyright.jsp
8/3/2019 Arnold Et Al. - 1991 - Unknown
http://slidepdf.com/reader/full/arnold-et-al-1991-unknown 9/12
Peak E is assigned to the 2; transition providing a symmetric
stretch frequency of v2 = 798 f 45 cm.- ‘. Vala et al.,* us-ing force constants obtained from their v3 measurement in
the matrix environment, predict frequencies of 1904 and 785
cm- 1 or the Y, and vZ symmetric stretch modes. Our value
for v2 agrees well with their prediction. The ab initio and
experimental frequencies for C, are compiled in Table IV.
In addition to these assigned peaks, there are severalother peaks to low eKE which do not appear in the 4.66 eV
spectrum due to the lower resolution there. Although some
of these peaks could potentially be assigned to C, vibrations
based upon agreement with ab initio results, higher resolu-
tion ( 10 cm - ’ ) threshold photodetachment results obtained
in this laboratory indicate that these peaks may actually be
due to transitions involving another electronic state of C, .59
This assignment is supported by a comparison of the two C<
spectra presented here. The peaks to low eKE are relativelymore intense in the 3149 eV spectrum than in the 4.66 eV
spectrum. It is well-documented that the partial cross sec-
tions for different photoionization transitions have differentenergy dependencies. *’ It appears that the partial photode-
tachment cross section for the transition to the excited state
of 6, decreases relative to the X ‘2: +-X2&+ transition
with increasing photodetachment energy. In agreement with
this observation, there was little or no signal observed for
this transition in the C; photoelectron spectrum obtained
by Yang et al.” using a photodetachment energy of 7.9 eV.
The photoelectron spectrum of C; obtained with a pho-
ton energy of 4.66 eV (Fig. 1) is similar to that of C!; . Reso-
lution limitations at higher eKE combined with additional
low frequency bending vibrations of C, result in fewer fully
resolved vibrational features, but some of the peaks can beassigned (Table I) using ab initio results for the vibrational
frequencies.” Peak B is assigned to the 3: transition, provid-
ing a symmetric stretch vibrational frequency of
vJ = 548 & 90 cm - ‘. As in C; , bending modes are excited
upon photodetachment of C; . Peak C, tentatively assigned
to the 7; transition, gives the bend frequency of
Y-, = 496 f 110 cm - ‘. The spacing of peak D from the ori-
gin agrees well with twice the value obtained for the vb anti-
symmetric stretch mode by Heath and Saykally.’ ’ However,
as in C!, , peaks D and E (and structure to lower eKE) may
result from transitions involving an excited electronic state
of the neutral.While the C< spectrum (Fig. 1) resembles the spectra
of C; and C;, it primarily shows two symmetric stretch
vibrational progressions. Peaks B and C are assigned to the
4: and 3; transitions providing symmetric stretch frequen-
ciesofv, =1258f_50cm-‘andv, =484+48cm-‘.
All of the odd-numbered molecules discussed thus far
show excitation in the breathing-type symmetric stretch
[e.g., vZ for C,, Fig. 8(b) 1, which is the lowest frequency
symmetric stretch in all cases. This suggests that all the C-C
bonds for these systems change in the same manner upon
photodetachment, whether it be to lengthen or shorten. The
ab initio results for the C, /Cc (Ref. 42) and C, /Cc (Ref.
61) systems indicate that all the neutral bond lengths are
shorter than those of the ions, in agreement with these re-
sults. In addition, as the-chain grows in length, the frequency
of this mode decreases: v1 (C,) = 1200 cm-‘;
v2 (C, ) = 798 cm- ‘; ,v3 (C,) = 548 cm-‘; and
vd (C, ) = 484 cm- I. Since the electronic structure is ex-
pected to be very similar for these molecules, one might ex-
pect comparable force constants for similar types of vibra-
tional modes. As a-result, the decrease in frequency as a
function of chain length results mainly from the increase inreduced mass of the longer chains.
2. C,, Cb, and C,
The 4.66 eV photoelectron spectrum of C; shown in
Fig. 4 has four resolved peaks to the low eKE side of the
origin. Theoretical calculations for C!, predict two nearly
isoenergetic i somers which have been considered for the
ground state: a 3Xg- Dmh linear structure and a ‘A, Dzh
rhombic structure. At t he highest levels of theory, the two
are separated by as little as 1 kcal/mo1.62*63 The electron
affinity of C, determined from the C!; spectra,
3.882 f 0.010 eV, agrees reasonably well with Yang et aE.‘svalue of 3.7 f 0.1 eV. From their CEI results, Algranati etaZ.26 eport an electron affinity of the rhombic isomer of C,
as 2.1 * 0.1 eV. Comparison with Watts et al.‘s calculated
EA for C, of 3.39 eV (Ref. 64) and Adamowicz’s56 EAs for
the linear and rhombic isomers of C, (3.45 and 2.03 eV,
respectively) further supports the assignment of the C;
photoelectron spectral features to a linear anion-t linear
neutral photodetachment process.
Peak C is assigned to the 1: transition, providing a sym-
metric stretch vibrational frequency of Y, = 2032 + 50
cm __ (ab initio value5* for Y* = 2 1.50cm - ’ ). According to
recent geometry calculations for linear C!, and Cc at theSDQ-MBPT( 4) level of theory,64 upon photodetachment of
Cc the outer bonds will shorten while the inner bond will
stretch. The strong resemblance of this geometry change to
the Y, symmetric stretch normal coordinate, shown in Fig.
8 (a), suggests that excitation of this mode will occur upon
photodetachment, in agreement with the present results.
Peaks B and D in the CL spectrum, are located at 0.736
and 0.487 eV eKE, respectively. On the basis of ab initiofrequency calculations alone,‘8*62 peak B, located 339 * 55
cm ’ from the origin, could be assigned to either the 5: or
the 4; transition.-The recent measurement2’(b) of the vs vi-
brational frequency (Ye = 172.4 cm - ’ ) agrees well with theA-B peak spacing. The 4: transition is symmetry forbidden
within the Franck-Condon approximation, but can occur in
the presence of vibronic coupling to a nearby electronic
state. While this transition might normally be excluded from
consideration, the strong polarization dependence of peaks
B and D relative to the other peaks suggests that vibronic
coupling may indeed be occurring. As observed by Ervin and
Lineberger35 in their C$H- photoelectron spectrum, a sig-
nature of non-Franck-Condon allowed transitions which
occur only through vibronic coupling is that the polarization
dependence of these peaks differs from that of the Franck-
Condon allowed transitions. The 4; transition can occur if
the v4 = 1 level is coupled to the v, = 0 or 2 levels of a near-
by II electronic state. Ab initio calculations predict that a C,
Arnold Hal.: Vibrationally resolved spectra of CTC,, 8761
J. Chem. Phys., Vol. 95, No. 12.15 December 1991Downloaded 09 Mar 2006 to 129.96.120.254. Redistribution subject to AIP license or copyright, see http://jcp.aip.org/jcp/copyright.jsp
8/3/2019 Arnold Et Al. - 1991 - Unknown
http://slidepdf.com/reader/full/arnold-et-al-1991-unknown 10/12
8762 Arnold etal.:Vibrationall y resolved spectra of C,-C,,
excited state of the appropriate symmetry (311,) lies just
1.00 eV above the 3X; ground state.6’ While the assignment
of peak B to the 5; transition is certainly possible, the polar-
ization dependence of the intensity of such a transition is
difficult to explain. The assignment of peak B to the 4: tran-
sition provides a bending vibrational frequency of
1~~~ 339 f 55 cm-‘. Due to its similar polarization de-
pendence and appropriate spacing, peak D can be assigned
as the 1;4; combination band.
lie - 1200 cm- 1 above the ground state.“7,70
Although the relative intensity of peak E does not vary
significantly as a function of laser polarization, it is assigned
as a transition to an excited sttite of linear C4(To = 0.327 f 0.006 eV). This assignment is based upon
two major factors: ( 1) no reasonable vibrational state as-
signment can be made which agrees with the frequencies
available from theoretical and experimental results and (2)
two excited electronic states are predicted to lie in the vicini-
ty of peak E. From the electronic configuration of linear C, ,
. .11~44a25r.r:1<, three electronic states can be formed:
“2;) ‘2:, and ‘A,. ,Ab nitio calculations and high resolu-
tion gas phase absorption experiments agree that the ground
state of linear C, is ‘Zg .24,62 herefore, peak E can be as-
signed to either the ‘A, or the ‘Xz electronic states which
have been calculated as nearly isoenergetic states lying be-
tween 0.25 and 0.75 eV.65*66Based upon Hund’s rules and
Liang et al’s ab initio results,67 peak E is assigned to the ‘Acr
excited state.
Due to the high electron affinity of C, relative to C, and
C, , the amount of information obtained from the CL speo
trum is not as abundant. The spectrum (Fig. 4), contains
two peaks (A and B) at very low eKE separated by ~565
cm I. This lies close to the predicted value of the v4 sym-
metric stretch vibration in C!, ,” so peak B is tentatively as-
signed to the 4; transition. It is also possible that peak B
represents the ‘A., electronic state of C, (predicted 67 T,
-. 1130 cm-‘) based upon the calculations by Liang et aL6’which predict a decreasing 32; --IA, splitting as a function
of increasing chain length in the linear even-numbered car-
bon molecules.
D. C,, , C,, , and nonlinear anion photodetachment
The 4.66 eV Cc photoelectron spectrum (Fig. 4)) con-
tams several partially resolved peaks to the low eKE side of
the origin, peak A. A higher resolution ( 10 cm - ‘) threshold
photodetachment spectrum, recently obtained in our labora-
tory,68 better resolves peak C, which lies 480 cm ’ from the
origin: Based on the photoelectron spectra of the odd carboncluster anions, it is tempting to assign peak C to excitation of
the lowest frequency symmetric stretch in C, (the 3: transi-tion) . Ab initio ~calculations, *3X58 owever, predict that the
frequency of this mode is - 150-200 cm - ’ larger than theA-C peak spacing. Alternatively, agreement is found be-tween the A-C spacing and twice the predicted v7 frequen-
cy, indicating the possible assignment of peak C to the 7:transition (a rg bending mode). While peak B, which lies
194 cm- ’ from the origin, could be assigned to the 9; transi-
tion (a a, bending mode) on the basis of comparison with abinitio values,13*58 his peak does not appear in the threshold
photodetachment spectrum. It may instead be a sequenceband transition from vibrationally excited C!; which does
not appear in the threshold spectrum because of differing ion
source conditions in the two experiments; our experience
with Si; (Ref. 69) indicates that the source configuration inthe threshold instrument produces somewhat colder ions.
The photoelectron spectra of C, and Cc (Fig. 5) have
a different appearance than the other spectra presented. The
C, spectrum consists of several broad unresolved features.
The C, spectrum has similar broad features, but also exhib-
its three sharp peaks (labeled as A, B, and C) . These three
peaks taken alone strongly resemble the linear anion + linear
neutral transitions seen in the C2; + 1 spectra. We therefore
assign peak A to the linear + linear origin and peaks B and C,
spaced 440 and 830 cm I, respectively, from peak A to tran-
sitions to vibrationally excited levels of linear C,, . The ap-
proximately equal spacing of the three peaks suggests that
they may belong to a single vibrational progression, most
likely in the breathing mode analogous to the v4 symmetric
stretch in C, . The electron affinity determined for the linear
C!,, molecule, 3.9 13 & 0.010 eV, compares well with Yang etaL’si assignment of the linear C,, electron affinity as
4.00 * 0.1 eV. The C, spectrum, in contrast, shows no evi-dence for linear-t linear transitions.
We next consider the broad structure in the C, and C,
spectra. Every ab initio calculation for C,, has predicted a
monocyclic ground state with the lowest linear isomer con-
siderably higher in energy; Schaefer predicts an energy dif-
ference of 2.9 eV, for example. ” It is therefore reasonable to
assign the C,; spectrum to transitions to one or more elec-tronic states of the cyclic C,, isomer. Based upon its similar-
ity to the C,; spectrum, the broad structure in the Cl; spec-
trum is also assigned to a transition to cyclic C,, . Thus, the
C!, spectrum exhibits transitions to both the linear and cy-
clic forms of C, 1
Peak D, located at 0.312 eV, is 1315 cm-“above the
origin. This peak spacing does not agree well with calculated
vibrational frequencies for linear Cb . The nearest agreement
is with the 1~~ ymmetric stretch (ab initio value5*@) for51,= 1759 cm---‘). In accord with this assignment, peak E is
most likely a sequence band in combination with the 2; tran-
sition. It is also possible that peak D represents the transitio-n
to the ‘A, excited electronic state of linear C,, predicted to
A more difficult question pertains to the structures of
the C, and C, anions which yield the broad features in the
two spectra. Specifically, are these features due to linear an-
ion-cyclic neutral transitions or cyclic anion+cyclic neu-
tral transitions? The Cfi spectrum suggests the latter to be
the case. If only the linear C!, anions were responsible, thenit is difficult to understand why the integrated intensity of
the three sharp peaks assigned to the linear-linear transi-
tion is so much smaller than that of the broad features. A
more reasonable explanation is that both the cyclic and lin-
ear isomers of C1; are present in the ion beam, and that these
are responsible for the broad features and the narrow peaks,respectively, in the spectrum. Yang et al.‘* used similar rea-
J. Chem. Phys., Vol. 95, No. 12,15 December 1991
Downloaded 09 Mar 2006 to 129.96.120.254. Redistribution subject to AIP license or copyright, see http://jcp.aip.org/jcp/copyright.jsp
8/3/2019 Arnold Et Al. - 1991 - Unknown
http://slidepdf.com/reader/full/arnold-et-al-1991-unknown 11/12
Arnold etal.:Vibrationall y resolved spectra of C&S,,
soning to explain how their C,; photoelectron spectrum
changed as a function of ion source conditions.
V. CONCLUSIONS
For C,, and C!,, , the assignment of the long tails in the
spectra to the cyclic anion-cyclic neutral transitions allows
us to estimate the electron affinities of the cyclic molecules.
Based upon the eKE at which these long tails approach base
line, we can approximate the EAs of cyclic C,, and C, , to be
2.2 & 0.1 and 1.5 f 0.1 eV, respectively. These values areindicated by arrows in the C,;-and C!,; photoelect ron spec-
tra (Fig. 5).
One problem with the assignment of the broad features
to the cyclic -+ cyclic transinons is that these features extend
over at least 2 eV of electron kinetic energy, implying a sub-
stantial difference in geometry between the anion and the
neutral and/or the presence of overlapping electronic transi-
tions. Both of these possibilities appear reasonable in light of
the ab initio study by Liang and Schaeffer,‘l which predicts
three close-lying cyclic isomers of C,, : two cumulenic forms
(one with D,,, symmetry and one with D,,, symmetry) and
one acetylenic form (D,, ) . The bond lengths and angles arequite different among these three isomers. One can therefore
envision transitions between cyclic forms of the anion and
neutral involving a considerable change in geometry.
Whether such a change is sufficient to explain the broad
features in the Cfi and C, spectra will requi re calculations
of the anion geometries and a multidimensional Franck-
Condon simulation of the spectrum.
Vibrationally resolved spectra of the carbon molecules
C,-C, 1 have been obtained using anion photoelectron spec-
troscopy. The spectra of C;-Cc ‘are dominated by transi-
tions between the linear forms of the anions and neutrals.
Electron affinities are determined for the linear isomers of
C,-C, andC,, witha typicaluncertaintyof -O.OlOeV. The
spectra confirm the even-odd alternation of electronic struc-ture seen by Yang et al. * In addition, several vibrational
frequencies (including symmetric stretch, antisymmetric
stretch, and bending modes) are determined for these linear
species. The spectra of all the odd clusters show excitation of
the breathing mode symmetric stretch upon photodetach-
ment and there is a decrease in the frequency of this mode as
the carbon chain length increases. The 3.49 eV photoelec-
tron spectrum of C< shows evidence for a low-lying excited
electronic state. A possible transition to an excited state of C!,
is observed as well.
Several of the spectra show evidence for photodetach-
ment transitions involving nonlinear isomers of the anionand/or neutral. The spectra of C,; and C,; show broad fea;
tures which appear to result from transit ions between cyclic
anions and cyclic neutral clusters. For C; , C!; , and C; ; the
spectra suggest that a small number of cyclic anions in our
ion beam are detached to form either cyclic or linear neu-
trals.
As noted previously, the Cc, Cc, and C!; photoelec-
tron spectra show low-intensity “tails” on the high eKE side
of the sharp structure of the spectra (for C; , the tail is only
visible in the 3.49 eV spectrum). These tails extend for near-
ly 1 eV, suggesting that they are not simpIy “hot bands.”Based on our interpretation of the C, and C!, spectra, we
believe that the tails are due to transitions involving cyclic
forms of the anion and/or neutral molecules. Ab initio calcu-
lations indicate that while the cyclic and linear forms of neu-
tral C, are nearly degenerate, the cyclic form of the anionlies 1.4 eV above the linear ground state.55 This suggests that
the tail in the C; spectrum results from the presence of cy-
clic CL in the ion begm, and that either cyclic-+cyclic or
cyclic -+ inear transitions are occurring. Similar explana-
tions account for the tails in the C; and C< spectra.
It is clear from these results that anion photoelectron
spectroscopy can provide a wealth of information about car-
bon clusters. Planned experiments at higher photodetach-
ment energy will yield a more complete picture of the low-
lying excited electronic states of these species. In addition,
higher resolution (6-10 cm- ‘) investigations of carbonclusters using threshold photodetachment spectrosco-
PY5q,69,72re currently in progress.
ACKNOWLEDGMENTS
Support from the Office of Naval Research under Con-tract No. N0014-87-0495 is gratefully acknowledged. We
would like to thank Dr. J. M. L. Martin and Dr. K. Ragha-
vachari for communication of unpublished results.
Note that Feldman et aZ.26 laim to observe the cyclic
forms of C; and C!; with relatively low electron binding
energies in their CEI experiments. Their Cs t- bombardment
ion source lacked the cooling provided by a supersonic jet, so
one might expect more hig:her energy cyclic anions in their
experiment as compared to ours. In any case, our explana-
tion of the tails in our photoelect ron spectra is consistent
with their earlier work.
The most controversial “cyclic vs linear” debate con-
cerns the structure of Cq, as evidenced by the number of
recent theoretical results cited in the discussion of the C;
photoelectron spectrum. Unlike the spectra of the other
even-numbered carbon molecules, there is no evidence in the
Cc spectra that a detectable number of cyclic anions are
produced in our experiment. Thus, because we see no evi-dence for transitions to cyclic C,, we cannot say anything
about its stability relative to linear C!, .
’ P. Gerhardt, S. LoflIer, and K. H. Homann, Chem. Phys. Lett. 137,306
(1987).‘R. E. Honig, J. Chem. Phys. 22,126 (1954).
‘P. F. Bernath, K. H. Hinkle, and J. J. Keady, Science 244, 562 ( 1989).“W. Kratschmer, K. Fostiropoulos, and D. R. Huffman, Chem. Phys.
Lett. 170, 167 ( 1990).
‘J. M. Hawkins, A. Meyer, T. A. Lewis, S. Loren, and F. J. Hollander,Science 252,312 (1991).
‘W. Weltner, Jr., and R. J. van Zee, Chem. Rev. 89, 1713 (1989).‘K. S. Pitzer and E. Clementi, J. Am. Chem. Sot. 81,4477 (1959).
“R. Hoffman, Tetrahedron 22,521 (1966).
’ (a) C. A. Schmuttenmaer, R. C. Cohen, N. Pugliano, 3. R. Heath, A. L.Cooksy, K. L. Busarow, and R. J. Saykally, Science 249,897 (1990); (b)H. Sasada, T. Amano, C. Jarman, and P. F. Bernath, J. Chem. Phys. 94,2401 (1991).
“(a) J. R. Heath, A. L. Cooksy, M. H. W. Gruebele, C. A. Schmutten-maer, and R. J. Saykally, Science 244,564 (1989); (b) N. Moazzen-Ah-madi, A. R. W. McKellar, and T. Amano, J. Chem. Phys. 91, 2140
(1989); (c) Chem. Phys. Lett. 157, 1 (1989).” (a) J. R. Heath, R. A. Sheeks, A. L. Cooksy, and R. J. Saykally, Science
249,895 (1990); (b) J. R. Heath and R. J. Saykally, J. Chem. Phys. 94,
1724 (1991).
8763
J. Chem. Phys., Vol. 95, No. 12,15 December 1991Downloaded 09 Mar 2006 to 129.96.120.254. Redistribution subject to AIP license or copyright, see http://jcp.aip.org/jcp/copyright.jsp
8/3/2019 Arnold Et Al. - 1991 - Unknown
http://slidepdf.com/reader/full/arnold-et-al-1991-unknown 12/12
8764 Arnold eta/.: Vibrationall y resolved spectra of C,-C,,
“R. A. Whiteside, R. Krishnan, D. J. Defrees, J. A. Pople, and P. von R.
Schleyer, Chem. Phys. Lett. 78,538 (1981).I3 K. Raghavachari and J. S. Binkley, J. Chem. Phys. 87,2 19 1 ( 1987 ).l4 J. R. Heath and R-J. Saykally, J. Chem. Phys. 93, 8392 ( 1990).
“K. Raghavachari, R. A. Whiteside, and I. A. Pople, J. Chem. Phys. 85,
6623 (1986).l6 (a) 2 Slanina, Chem. Phys. Lett. 142,512 (1987); (b) 173,164 (1990).” (a) R. J. van Zee, R. F. Ferrante, K. J. Zeringue, W. Weltner, Jr., and D.
W. Ewing, I. Chem. Phys. 88,3465 (1988); (b) R. J. van Zee, R. F. Fer-
rante, K. J. Zeringue, and W. Weltner, Jr., ibid. 86, 5212 (1987); (c) H.
M. Cheung and W. R. M. Graham, ibid. 91,6664 (1989).“S. Yang, K. J. Taylor, M. J. Craycraft, J. Conceicao, C. L. Pettiette, 0.
Cheshnovsky, and R. E Smalley, Chem. Phys. Lett. 144,431 (1988).
“S. H. Yang, C. L. Pettiette, J. Conceicao, 0. Cheshnovsky, and R. E.
Smalley, Chem. Phys. Lett. 139 ,233 (1987).*OK. R. Thompson, R. L. DeKock, and W. Weltner, Jr., J. Am. Chem. Sot.
93,468s (1971).” (a) L. N. Shen and W. R. M. Graham, J. Chem. Phys. 91,511s (1989);
(b) P. A. Withey, L. N. Shen, and W. R. M. Graham, ibid. 95, 820
(1991); (c) L. N. Shen, P. A. Withey, and W. R. M. Graham, ibid. 94,
2395 (1991).*‘M. Vala, T. M. Chandrasekhar, J. Szczepanski, R. van Zee, and W.
Weltner, Jr., J. Chem. Phys. 90, 595 (1989).
13M. Vala, T. M. Chandrasekhar, J. Szczepanski, and R. Pellow, HighTemp. Sci. 27, 19 ( 1990).
“5. R. Heath and R. J. Saykally, J. Chem. Phys. 94,327l (1991).” One vibrational frequency is obtained for C,, C,, and C,, however, Moaz-
zen-Ahmadi etaI. (Ref. 21) determine three frequencies for C,, by assign-
ing hot band transitions.*‘(a) H. Feldman, D. Kella, E. Malkin, E. Miklazky, Z. Vager, I. Zajfman,
and R. Naaman, J. Chem. Sot. Faraday Trans. 86,2469 ( 1990); (b) M.Algranati, H. Feldman, D. Kella, E. Malkin, E. Miklazky, R. Naaman, Z.
Vager, and J. Zajfman, Isr. J. Chem. 30,79 (1990); (c) J. Chem. Phys90,
4617 11989).
“R. B. Metz, A. Weaver, S. E. Bradforth, T. N. Kitsopoulos, and D. M.Neumark, J. Chem. Phys. 94, 1377 (1990).
“0, Cheshnovsky, S. H. Yang, C. L. Pettiette, M. J. Craycraft, and R. E.
Smalley, Rev. Sci. Instrum. 58, 2131 (1987).“W. C. Wiley and I. H. McLaren, Rev. Sci. Instrum. 26, 1150 (1955).“A. Weaver, D. W. Arnold, S. E. Bradforth, and D. M. Neumark, J. Chem.
Phys. 94, 1740 (1991).
J’ (a) E. A. Ballik and D. A. Ramsay, Astrophys. J. 137, 84 (1963); (b)137,61 (1963).
“K. P. Huber and G. Herzberg, Molecular Spectra and Molecular Struc-
tureIE ConstantsofDiatomicMolecules (Van Nostrand-Reinhold, NewYork, 1977).
53(a) K. Kawaguchi, K. Matsumura, H. Kanamori, and E. Hirota, J.
Chem. Phys. 91.1953 (1989); (b) G. W. Lemire, Z. Fu, Y. M Hamrick,S. Taylor, and M. D. Morse, J. Phys. Chem. 93, 2313 (1989); (c) L.Gausset, G. Herzberg, A. Lagerqvist, and B. Rosen, Discuss. Faraday
sot. 35, 113 (1963).
.14. M. Oakes and G. B. Ellison, Tetrahedron 42,6263 ( 1986).‘sK. M. Ervin and W. C. Lineberger, J. Phys. Chem. 95, 1167 ( 1991).3o . W. Rabalais, Principles of Ultraviolet Photoelect ron Spectroscopy (Wi-
ley, New York, 1977).“For a full list of references, see Weltner and van Zee review, Ref. 6.I* (a) W. C. Lineberger and T. A. Patterson, Chem. Phys. Lett. 13, 40
(1972); (b) G. Herzberg and A. Lagerqvist, Can. J. Phys. 46, 2363(1968).
.19 a) R. D. Mead, U. Hefter, P. A. Schultz, and W. C. Lineberger, J. Chem.Phys. 82,1723 (1985); (b) B. D. Rehfuss, D. J. Liu, B. M. Dinelli, M. F.
Jagod, W. C. Ho, M. W. Crofton, and T. Oka, ibid. 89,129 (1988).
4aThis corrected the previous value measured from autodetachment experi-ments; P. L. Jones, R. D. Mead, B. E. Kohler, S. D. Rosner, and W. C.
Lineberger, J. Chem. Phys. 73.4419 (1980).
“‘P. Rosmus and H. Werner, J. Chem. Phys. SO,5085 (1984).“K. Raghavachari, Chem. Phys. Lett. 171,249 (1990).
47A. J. Merer, Can. J. Phys. 45,4103 (1967).44W. Weltner, Jr., and D. McLeod, Jr., J. Chem. Phys. 40,1305 (1964).45E. A. Rohlfing, J. Chem. Phys. 91,453l (1989).‘hM. Polak, M. Gilles, and C. Lineberger (private communication).
“L Gausset, G. Herzberg, A. Lagerqvist, and B. Rosen, Astrophys. J. 142,4; (1965).
4R(a) F. J. Northrup and T. J. Sears, J. Opt. Sot. Am. B 7,1924 ( 1990); (b)
E. A. Rohlting and J. E. M. Goldsmith, ibid. 7, 19 15 ( 1990).4yWhile the bending mode of C; is Renner-Teller active (as are the bend-
ing modes for all the carbon anions), no consideration is made for this
effect in the simulations. Rather, the vz mode is considered as a doublydegenerate harmonic oscillator with a frequency set at approximately theaverage of the frequencies calculated in Ref. 42.
“Time-dependent wave packet propagation technique is employed usingthe surface described. For further details, see, S. E. Bradforth, A. Weaver,
D. W. Arnold, R B. Metz, and D. M. Neumark, J. Chem. Phys. 92,7205(1990).
“Morse Oscillator Rigid Bender Internal Dynamics.
“(a) P. Jensen, Collect. Czech. Chem. Commun. 54, 1209 (1989); (b) J.
Mol. Spectrosc. 128,478 (1988).?. E. Bondybey and J. H. English, J. Chem. Phys. 68,464l ( 1978).
“‘5 PeribRadiC, J. RomeIt, S. D. Peyerimhoff, and R J. Buenker, Chem.
Whys. Lett. 50, 344 ( 1977).“K. Raghavachari, Z. Phys. D 12,61 (1989).
sGL. Adamowicz, J. Chem. Phys. 93,6685 (1990).‘rThe tail appears in the 3.49 eVspectrum as a result ofbetter sensitivity and
improved resolution at lower e&X.
58(a) J. Kurtzand L. Adamowicz, Astrophys. J. 370,784 (1991); (b) J. M.L. Martin, J. P. Franqois, and R. Gijbels, J. Comp. Chem 12.52 (1991);
(c) J. Chem. Phys. 93,88SO (1990).“T N Kitsopoulos, C. J. Chick, Y. Zhao, and D. M. Neumark, J. Chem.
Phys. J. Chem. Phys. 95, 5479 ( 199 1) .60J. W. Berkowitz, Photoabsorption, Photoionization and Photoelectron
Spectroscopy (Academic, New York, 1979), pp. 155-357.
“(a) J. M. L. Martin (privatecommunication); (b) K. Raghavachar i (pri-vate communication).
h2J M L. Martin, J. P. Franc;ois, and R. Gijbels, J. Chem. Phys. 94, 3753
(199.1).“‘V. Parasuk and J. Almlof, J. Chem. Phys. 94,8172 (1991).h4J. D. Watts, I. Cernusak, and R. J. Bartlett, Chem. Phys. Lett. 178, 259
(1991).“G. Pacchioni and J. Koutecky, J. Chem. Phys. 88, 1066 (1988).“(a) D. H. Magers, R. J. Harrison, and R. I. Bartlett, J. Chem. Phys. 84,
3284 ( 1986); (b) A. .V. Nemukhin, N. F. Stepanov, and A. A. Safonov,Teor. Eksp. Khim. 18,608 (1982).
“C. Liang and H. F. Schaefer III, Chem. Phys. Lett. 169, 150 (1990).
‘*C. J. Chick, Y. Zhao, T. N. Kitsopoulos, and D. M. Neumark (unpub-lished).
69T. N. Kitsopoulos, C. J. Chick, Y. Zhao, and D. M. Neumark, J. Chem.Phys. 95,144l (1991).
“V. Parasuk and J. Almlof, J. Chem. Phys91, 1137 (1989).“C. Liang and H. F. Schaefer III, J. Chem. Phys. 93, 8844 ( 1990).“T N Kitsopoulos, I. M. Waller, J. G. Loeser, and D. M. Neumark, Chem.
Phys. Lett. 159,300 (1989).


![Progress Report 1991-1992 [unknown], [unknown]lup.lub.lu.se/search/ws/files/5550427/2296920.pdf · Biennial report 1991-1992, Dept of Physics, LTH, Lund, Sweden pulse of about 150](https://img.dokumen.tips/doc/110x75/5e8498e0e13f36511f444fcb/progress-report-1991-1992-unknown-unknownluplublusesearchwsfiles5550427.jpg)