Embed Size (px)
Citation preview
FILENAME: H:\11\11834 - ARLINGTON COUNTY TRANSPORTATION ON-CALL\TASK 32 - TRAFFIC STUDY ARMY NAVY
DRIVE\REPORT\OPTIONAL TASK\DRAFT\11834-32_OPT-TASK_MEMO-DRAFT - V2.DOCX
MEMORANDUM
Date: November 13, 2017 Project #: 11834 Task 32
To: Jon Lawler
Arlington County Division of Traffic
2100 Clarendon Boulevard, Suite 900
Arlington, Virginia 22201
From: Brandon Nevers, P.E., Jon Crisafi, P.E., Laura Zhao
Project: Army Navy Drive Traffic Analysis
Subject: Supplemental Traffic Analysis Memorandum
This memorandum details the work performed for the Optional Task effort of the Army Navy Drive
Traffic Analysis.
EXECUTIVE SUMMARY
The Optional Task was designed as an effort to follow-up on the lessons learned from the original
assessment (Reference 1) of the Arlington County (County) design concept for Army Navy Drive
between S Joyce Street and 12th Street S. The scope of the Optional Task is to analyze the new design
concept and evaluate the new features compared to the original models (“Original” design concept).
This next iteration of the design concept was aimed toward developing 30% design plans of the corridor
that could be presented to the public and stakeholders for feedback.
This effort focused on the 2020 and 2040 “Build” scenarios only for both AM and PM peak periods.
Arlington County staffed revised the previous design concept to a “new baseline” condition focusing
largely on lane configuration and turn lane lengths. The Build scenarios were updated with these new
baseline features to compare against the latest models analyzed.
The S Hayes Street/Army Navy Drive intersection, identified as the most critical of the corridor due to
its direction connection to Interstate-395 and Route 27 (S Washington Boulevard), was investigated
further with a series of “experimental modifications” to vet possible design features to improve the
operations. The mitigations at the Hayes Street intersection evaluated were:
Dual southbound left-turn lanes;
Eastbound protect + overlap right-turn phasing, and;
Removal of the channelized westbound right turn.
Army Navy Drive Traffic Analysis Project #: 11834 Task 32 November 13, 2017 Page 2
Kittelson & Associates, Inc. Reston, Virginia
The evaluation of these mitigations vetted that only the “eastbound protected + overlap right-turn
phasing” should be carried forward for the new final models.
New ultimate models showed a general improvement from the previous models in terms of network
operations and individual intersection performance.
SCOPE OF OPTIONAL TASK
The Optional Task was designed as an effort to follow-up on the lessons learned from the original
assessment of the Arlington County (County) design concept for Army Navy Drive between S Joyce
Street and 12th Street S. The scope of the Optional Task is to analyze the new design concept and
evaluate the new features compared to the Original models. This next iteration of the design concept
was aimed toward developing 30% design plans of the corridor that could be presented to the public
and stakeholders for feedback.
The full scope of the Optional Task is outlined as the following:
Model and analyze the New Baseline design concept;
Evaluate “experimental modifications” at the Hayes Street/Army Navy Drive intersection;
Model and analyze the newly developed “Ultimate” design concept, and;
Conduct and prepare a marked crossing study, per the Arlington County Marked Crosswalk
Guidelines, for the existing unmarked crossing east of the Eads Street/Army Navy Drive
intersection on the US 110 off-ramp.
The marked crossing study (Reference 2) was prepared for addressing concerns VDOT raised during the
original analysis of that particular crossing location. The study was prepared and submitted to Arlington
County independent of this memo.
NEW BASELINE DESIGN CONCEPT
After the submission of the original traffic analysis report, County staff revised the corridor design
concept considering the findings and recommendations provided. These revisions established a “new
baseline” to evaluate. Part of the Optional Task effort was to model these revisions and compare
operational results to the Original models. Since these are applicable only to the proposed design
concept, only 2020 and 2040 AM and PM Build scenarios were analyzed.
The New Baseline was created by updating the Original models with the following modifications:
Modify turn lanes to reflect the following storage and tapers:
o Pentagon City Mall Entrance- dual WB left turn lane: 130-ft storage, 80-ft taper;
o S Hayes St – EB left turn lane: 205-ft storage, 90-ft taper;
o S Hayes St – WB left turn lane: 125-ft storage, 80-ft taper;
o S Fern St – EB left turn lane: 150-ft storage, 70-ft taper;
Army Navy Drive Traffic Analysis Project #: 11834 Task 32 November 13, 2017 Page 3
Kittelson & Associates, Inc. Reston, Virginia
o S Fern St – WB left turn lane: 50-ft storage, 95-ft taper;
o S Eads St – EB left turn lane: 415-ft storage, 85-taper, and;
o S Eads St – WB right turn lane: 50-ft storage, 175-ft taper.
Bus stop modifications:
o Remove near-side bus stop on southwest corner of S Hayes St/Army Navy Dr.
o Expand mid-block bus stop between S Joyce St and Pentagon City Mall Garage Entrance
westward for a total length of 120-ft.
Pentagon City Mall Garage Intersection Modifications
o Reconfigure the west bound approach to include the dual left-turn lanes.
o Optimize signal timing and corridor offsets as needed.
S Hayes St Intersection Modifications
o Add new crosswalk on north side of intersection; adjust signal timing to include
pedestrian interval.
S Eads St Intersection Modifications
o I-395 HOT Lane Widening Improvements – the following adjustments are to be made to
the southbound approach (north leg) of the S Eads St intersection:
Approach should be configured with one 230-ft long left turn storage lane, one
thru lane, and one 80-ft right turn storage lane.
The receiving lanes on the north leg should be widened from one lane to two
lanes.
Assess operational need to determine protected/permissive side-street left turn
phasing improves operations.
Optimize signal timing and corridor offsets as needed.
o Reorient the west crosswalk and eastbound stop bars to reflect adjustments in design
concept.
o Remove the westbound left turn lane and reconfigure the westbound approach to two
(2) thru lanes and a dedicated right turn lane.
Configure the US 110 off-ramp to align with middle thru lane and add the
dedicated right turn lane, per design concept.
o Reroute traffic impacted by left turn removal through network as needed.
o Optimize signal timings and corridor offsets as needed.
Army Navy Drive/12th St S Intersection Modifications
o Reconfigure westbound approach to allow left turns from the transit lane.
Reroute the U-turns at S Eads St/12th St S to this movement.
EXPERIMENTAL MODIFICATIONS AT HAYES STREET
Recognizing the Hayes Street/Army Navy Drive intersection as a key congestion point in the corridor
(particularly because of its direction connection to Interstate-395 and Route 27 [S Washington
Boulevard]), modifications to new baseline models at the intersection were analyzed for their
Army Navy Drive Traffic Analysis Project #: 11834 Task 32 November 13, 2017 Page 4
Kittelson & Associates, Inc. Reston, Virginia
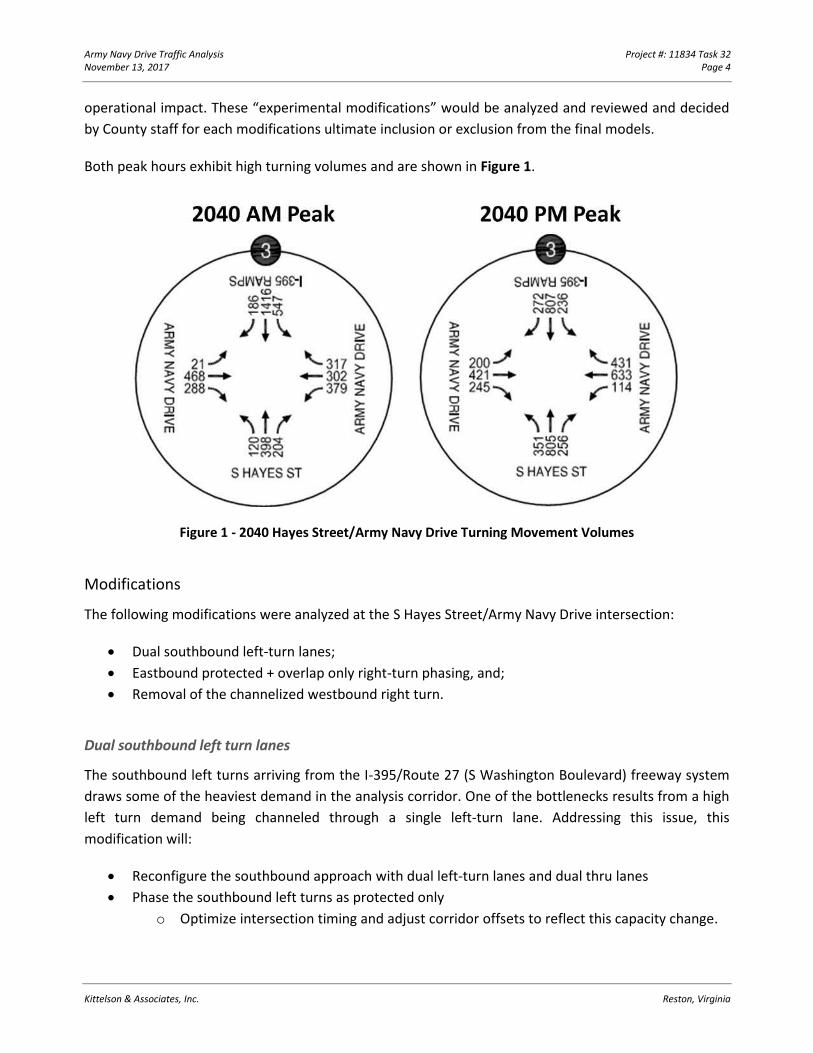
operational impact. These “experimental modifications” would be analyzed and reviewed and decided
by County staff for each modifications ultimate inclusion or exclusion from the final models.
Both peak hours exhibit high turning volumes and are shown in Figure 1.
Figure 1 - 2040 Hayes Street/Army Navy Drive Turning Movement Volumes
Modifications
The following modifications were analyzed at the S Hayes Street/Army Navy Drive intersection:
Dual southbound left-turn lanes;
Eastbound protected + overlap only right-turn phasing, and;
Removal of the channelized westbound right turn.
Dual southbound left turn lanes
The southbound left turns arriving from the I-395/Route 27 (S Washington Boulevard) freeway system
draws some of the heaviest demand in the analysis corridor. One of the bottlenecks results from a high
left turn demand being channeled through a single left-turn lane. Addressing this issue, this
modification will:
Reconfigure the southbound approach with dual left-turn lanes and dual thru lanes
Phase the southbound left turns as protected only
o Optimize intersection timing and adjust corridor offsets to reflect this capacity change.
Army Navy Drive Traffic Analysis Project #: 11834 Task 32 November 13, 2017 Page 5
Kittelson & Associates, Inc. Reston, Virginia
Eastbound protect + overlap only right-turn phasing
The presence of a two-way cycle track on the south side of Army Navy Drive presents safety challenges
for eastbound right turns along the corridor. At the Hayes Street/Army Navy Drive intersection, there
are many conflicts with a heavy right turn demand and non-motorized users (both cyclists and
pedestrians). Given westbound cyclists are essentially “contraflow” to the adjacent eastbound vehicles,
right turning traffic must now yield to an unconventional movement when phased permissively. By
restricting right turns to protected only in addition to overlapping with the northbound left turns, the
conflicts with adjacent non-motorized users is eliminated entirely. Addressing this issue, this
modification will:
Phase the EB right turns as protected only + overlap with NB left turns.
Assess the queuing impacts on the eastbound approach and eastbound travel times.
o Severity of impact will be reported by KAI and the County will determine whether to
move forward with the protected + overlap phasing or to engage Optional Task 1
adjustment
Removal of the channelized westbound right turn
The existing westbound channelized right turn provides an easier movement for westbound right-
turning vehicles to access the I-395 South/Route 27 (S Washington Boulevard) West on-ramp by
allowing for higher speed turn bypassing the signal control. However, this higher speed movement
presents a safety issue for pedestrians crossing the north side of the Hayes Street/Army Navy Drive
intersection. Removing the channelization and bringing the dedicated right-turn lane to the intersection
would improve pedestrian safety, but likely increase delay and queuing for westbound right turns.
Addressing this issue, this modification will:
Reconfigure the westbound approach to remove the channelized right and bring the dedicated
right turn lane to the intersection stop bar.
o Dedicated right turn lane will permit westbound buses to go thru from this lane
Assess impact to queues, delays, and westbound travel time between S Hayes St and S Eads St
Scenarios Tested
The following scenarios were developed and tested for evaluating the mitigations proposed to the
Hayes Street/Army Navy Drive intersection (summarized in Table 1). Each scenario was tested under
2040 AM and PM peak volume conditions to assess the most conservative operations for the proposed
mitigations.
Army Navy Drive Traffic Analysis Project #: 11834 Task 32 November 13, 2017 Page 6
Kittelson & Associates, Inc. Reston, Virginia
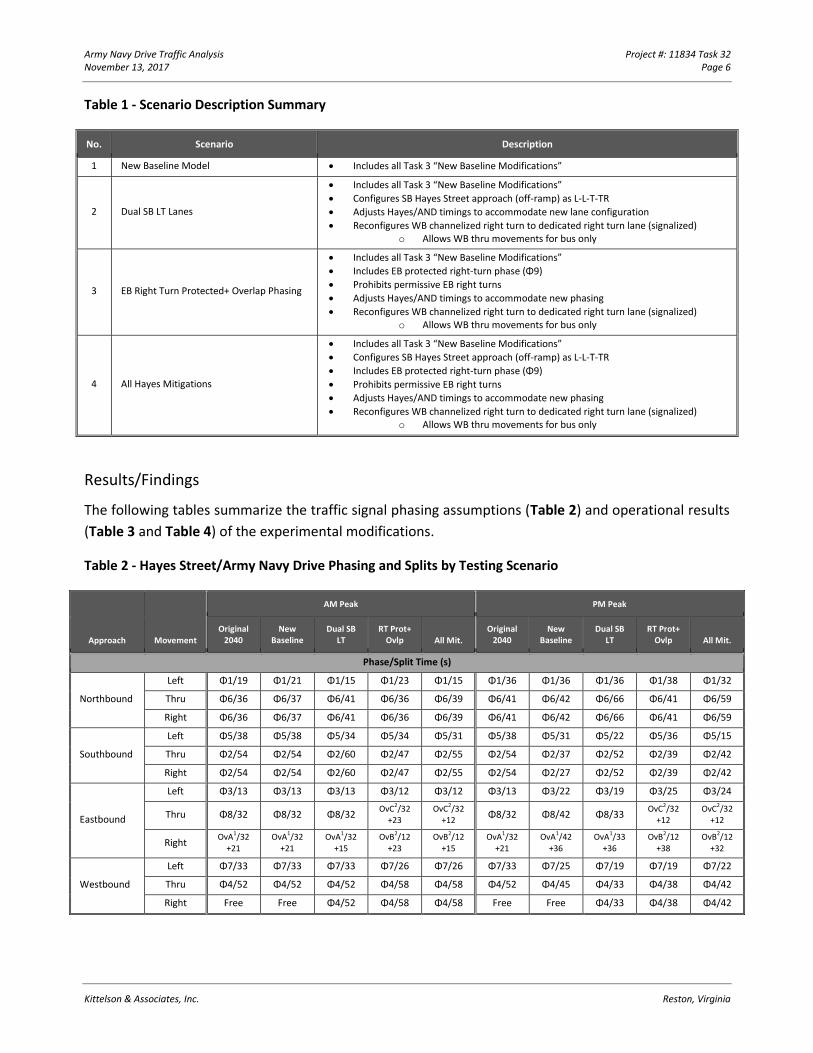
Table 1 - Scenario Description Summary
No. Scenario Description
1 New Baseline Model Includes all Task 3 “New Baseline Modifications”
2 Dual SB LT Lanes
Includes all Task 3 “New Baseline Modifications”
Configures SB Hayes Street approach (off-ramp) as L-L-T-TR
Adjusts Hayes/AND timings to accommodate new lane configuration
Reconfigures WB channelized right turn to dedicated right turn lane (signalized) o Allows WB thru movements for bus only
3 EB Right Turn Protected+ Overlap Phasing
Includes all Task 3 “New Baseline Modifications”
Includes EB protected right-turn phase (Φ9)
Prohibits permissive EB right turns
Adjusts Hayes/AND timings to accommodate new phasing
Reconfigures WB channelized right turn to dedicated right turn lane (signalized) o Allows WB thru movements for bus only
4 All Hayes Mitigations
Includes all Task 3 “New Baseline Modifications”
Configures SB Hayes Street approach (off-ramp) as L-L-T-TR
Includes EB protected right-turn phase (Φ9)
Prohibits permissive EB right turns
Adjusts Hayes/AND timings to accommodate new phasing
Reconfigures WB channelized right turn to dedicated right turn lane (signalized) o Allows WB thru movements for bus only
Results/Findings
The following tables summarize the traffic signal phasing assumptions (Table 2) and operational results
(Table 3 and Table 4) of the experimental modifications.
Table 2 - Hayes Street/Army Navy Drive Phasing and Splits by Testing Scenario
Approach Movement
AM Peak PM Peak
Original 2040
New Baseline
Dual SB LT
RT Prot+ Ovlp All Mit.
Original 2040
New Baseline
Dual SB LT
RT Prot+ Ovlp All Mit.
Phase/Split Time (s)
Northbound
Left Φ1/19 Φ1/21 Φ1/15 Φ1/23 Φ1/15 Φ1/36 Φ1/36 Φ1/36 Φ1/38 Φ1/32
Thru Φ6/36 Φ6/37 Φ6/41 Φ6/36 Φ6/39 Φ6/41 Φ6/42 Φ6/66 Φ6/41 Φ6/59
Right Φ6/36 Φ6/37 Φ6/41 Φ6/36 Φ6/39 Φ6/41 Φ6/42 Φ6/66 Φ6/41 Φ6/59
Southbound
Left Φ5/38 Φ5/38 Φ5/34 Φ5/34 Φ5/31 Φ5/38 Φ5/31 Φ5/22 Φ5/36 Φ5/15
Thru Φ2/54 Φ2/54 Φ2/60 Φ2/47 Φ2/55 Φ2/54 Φ2/37 Φ2/52 Φ2/39 Φ2/42
Right Φ2/54 Φ2/54 Φ2/60 Φ2/47 Φ2/55 Φ2/54 Φ2/27 Φ2/52 Φ2/39 Φ2/42
Eastbound
Left Φ3/13 Φ3/13 Φ3/13 Φ3/12 Φ3/12 Φ3/13 Φ3/22 Φ3/19 Φ3/25 Φ3/24
Thru Φ8/32 Φ8/32 Φ8/32 OvC2/32
+23 OvC2/32
+12 Φ8/32 Φ8/42 Φ8/33
OvC2/32 +12
OvC2/32+12
Right OvA
1/32
+21 OvA
1/32
+21 OvA
1/32
+15 OvB
2/12
+23 OvB
2/12
+15 OvA
1/32
+21 OvA
1/42
+36 OvA
1/33
+36 OvB
2/12
+38 OvB
2/12
+32
Westbound
Left Φ7/33 Φ7/33 Φ7/33 Φ7/26 Φ7/26 Φ7/33 Φ7/25 Φ7/19 Φ7/19 Φ7/22
Thru Φ4/52 Φ4/52 Φ4/52 Φ4/58 Φ4/58 Φ4/52 Φ4/45 Φ4/33 Φ4/38 Φ4/42
Right Free Free Φ4/52 Φ4/58 Φ4/58 Free Free Φ4/33 Φ4/38 Φ4/42
Army Navy Drive Traffic Analysis Project #: 11834 Task 32 November 13, 2017 Page 7
Kittelson & Associates, Inc. Reston, Virginia
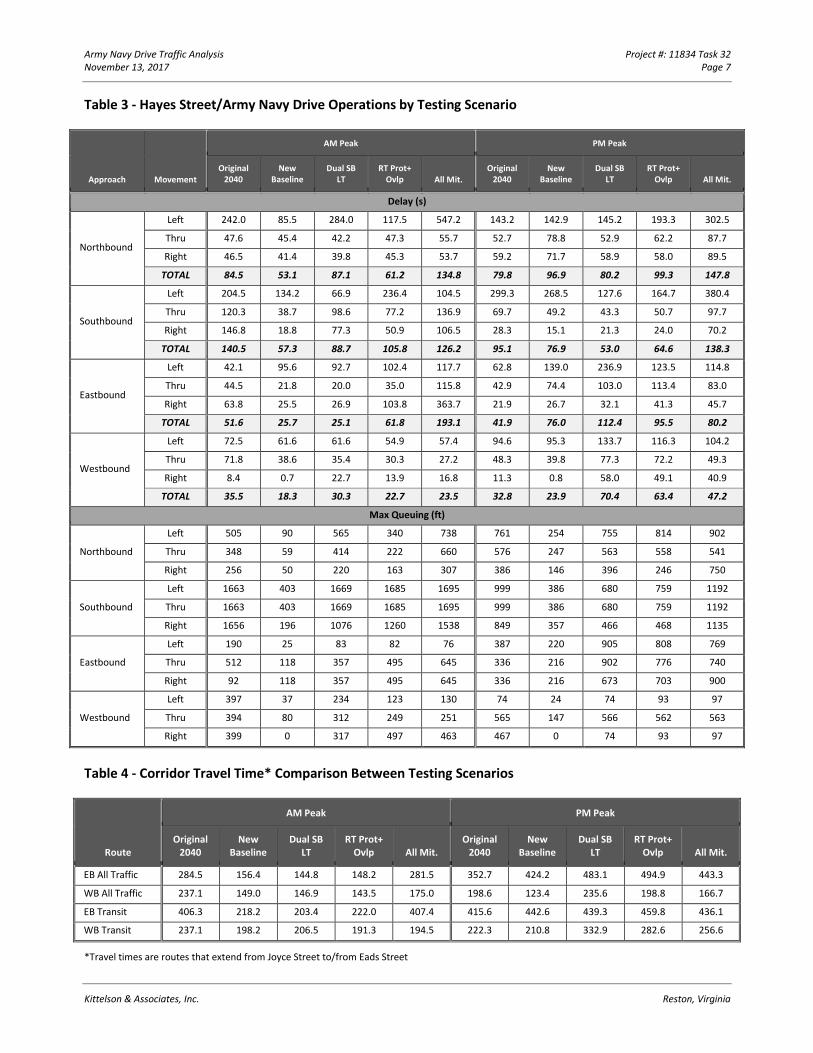
Table 3 - Hayes Street/Army Navy Drive Operations by Testing Scenario
Approach Movement
AM Peak PM Peak
Original 2040
New Baseline
Dual SB LT
RT Prot+ Ovlp All Mit.
Original 2040
New Baseline
Dual SB LT
RT Prot+ Ovlp All Mit.
Delay (s)
Northbound
Left 242.0 85.5 284.0 117.5 547.2 143.2 142.9 145.2 193.3 302.5
Thru 47.6 45.4 42.2 47.3 55.7 52.7 78.8 52.9 62.2 87.7
Right 46.5 41.4 39.8 45.3 53.7 59.2 71.7 58.9 58.0 89.5
TOTAL 84.5 53.1 87.1 61.2 134.8 79.8 96.9 80.2 99.3 147.8
Southbound
Left 204.5 134.2 66.9 236.4 104.5 299.3 268.5 127.6 164.7 380.4
Thru 120.3 38.7 98.6 77.2 136.9 69.7 49.2 43.3 50.7 97.7
Right 146.8 18.8 77.3 50.9 106.5 28.3 15.1 21.3 24.0 70.2
TOTAL 140.5 57.3 88.7 105.8 126.2 95.1 76.9 53.0 64.6 138.3
Eastbound
Left 42.1 95.6 92.7 102.4 117.7 62.8 139.0 236.9 123.5 114.8
Thru 44.5 21.8 20.0 35.0 115.8 42.9 74.4 103.0 113.4 83.0
Right 63.8 25.5 26.9 103.8 363.7 21.9 26.7 32.1 41.3 45.7
TOTAL 51.6 25.7 25.1 61.8 193.1 41.9 76.0 112.4 95.5 80.2
Westbound
Left 72.5 61.6 61.6 54.9 57.4 94.6 95.3 133.7 116.3 104.2
Thru 71.8 38.6 35.4 30.3 27.2 48.3 39.8 77.3 72.2 49.3
Right 8.4 0.7 22.7 13.9 16.8 11.3 0.8 58.0 49.1 40.9
TOTAL 35.5 18.3 30.3 22.7 23.5 32.8 23.9 70.4 63.4 47.2
Max Queuing (ft)
Northbound
Left 505 90 565 340 738 761 254 755 814 902
Thru 348 59 414 222 660 576 247 563 558 541
Right 256 50 220 163 307 386 146 396 246 750
Southbound
Left 1663 403 1669 1685 1695 999 386 680 759 1192
Thru 1663 403 1669 1685 1695 999 386 680 759 1192
Right 1656 196 1076 1260 1538 849 357 466 468 1135
Eastbound
Left 190 25 83 82 76 387 220 905 808 769
Thru 512 118 357 495 645 336 216 902 776 740
Right 92 118 357 495 645 336 216 673 703 900
Westbound
Left 397 37 234 123 130 74 24 74 93 97
Thru 394 80 312 249 251 565 147 566 562 563
Right 399 0 317 497 463 467 0 74 93 97
Table 4 - Corridor Travel Time* Comparison Between Testing Scenarios
Route
AM Peak PM Peak
Original 2040
New Baseline
Dual SB LT
RT Prot+ Ovlp All Mit.
Original 2040
New Baseline
Dual SB LT
RT Prot+ Ovlp All Mit.
EB All Traffic 284.5 156.4 144.8 148.2 281.5 352.7 424.2 483.1 494.9 443.3
WB All Traffic 237.1 149.0 146.9 143.5 175.0 198.6 123.4 235.6 198.8 166.7
EB Transit 406.3 218.2 203.4 222.0 407.4 415.6 442.6 439.3 459.8 436.1
WB Transit 237.1 198.2 206.5 191.3 194.5 222.3 210.8 332.9 282.6 256.6
*Travel times are routes that extend from Joyce Street to/from Eads Street
Army Navy Drive Traffic Analysis Project #: 11834 Task 32 November 13, 2017 Page 8
Kittelson & Associates, Inc. Reston, Virginia
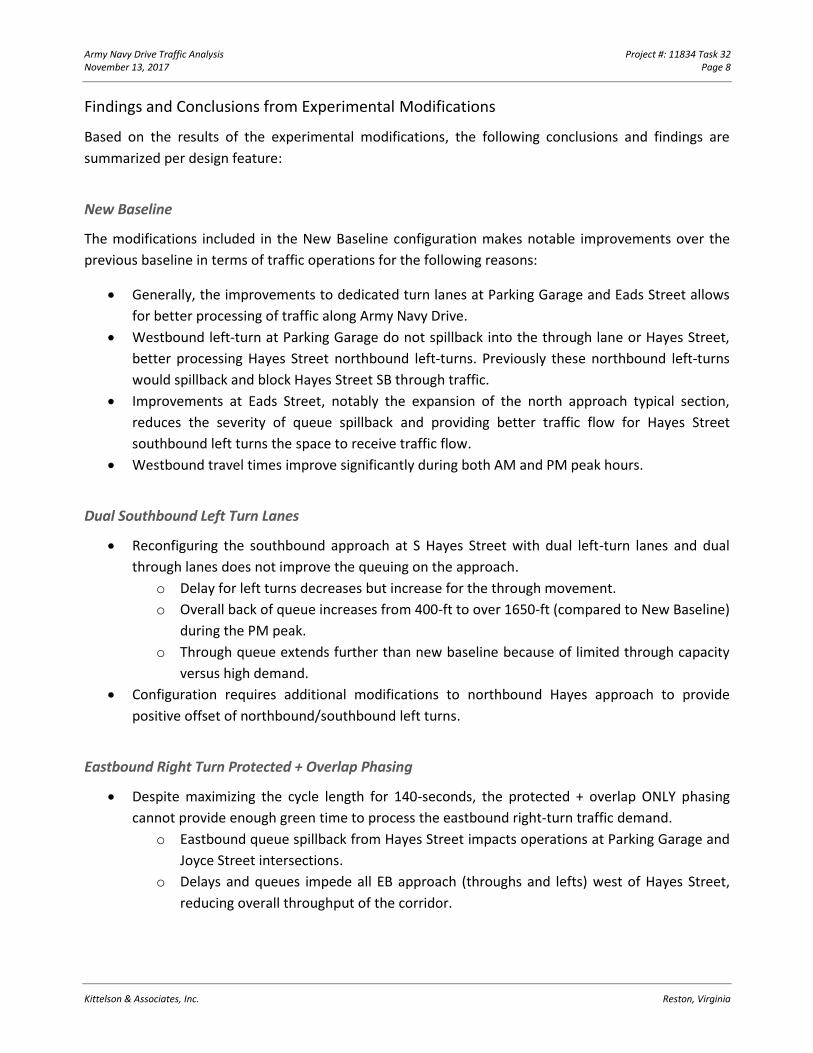
Findings and Conclusions from Experimental Modifications
Based on the results of the experimental modifications, the following conclusions and findings are
summarized per design feature:
New Baseline
The modifications included in the New Baseline configuration makes notable improvements over the
previous baseline in terms of traffic operations for the following reasons:
Generally, the improvements to dedicated turn lanes at Parking Garage and Eads Street allows
for better processing of traffic along Army Navy Drive.
Westbound left-turn at Parking Garage do not spillback into the through lane or Hayes Street,
better processing Hayes Street northbound left-turns. Previously these northbound left-turns
would spillback and block Hayes Street SB through traffic.
Improvements at Eads Street, notably the expansion of the north approach typical section,
reduces the severity of queue spillback and providing better traffic flow for Hayes Street
southbound left turns the space to receive traffic flow.
Westbound travel times improve significantly during both AM and PM peak hours.
Dual Southbound Left Turn Lanes
Reconfiguring the southbound approach at S Hayes Street with dual left-turn lanes and dual
through lanes does not improve the queuing on the approach.
o Delay for left turns decreases but increase for the through movement.
o Overall back of queue increases from 400-ft to over 1650-ft (compared to New Baseline)
during the PM peak.
o Through queue extends further than new baseline because of limited through capacity
versus high demand.
Configuration requires additional modifications to northbound Hayes approach to provide
positive offset of northbound/southbound left turns.
Eastbound Right Turn Protected + Overlap Phasing
Despite maximizing the cycle length for 140-seconds, the protected + overlap ONLY phasing
cannot provide enough green time to process the eastbound right-turn traffic demand.
o Eastbound queue spillback from Hayes Street impacts operations at Parking Garage and
Joyce Street intersections.
o Delays and queues impede all EB approach (throughs and lefts) west of Hayes Street,
reducing overall throughput of the corridor.
Army Navy Drive Traffic Analysis Project #: 11834 Task 32 November 13, 2017 Page 9
Kittelson & Associates, Inc. Reston, Virginia
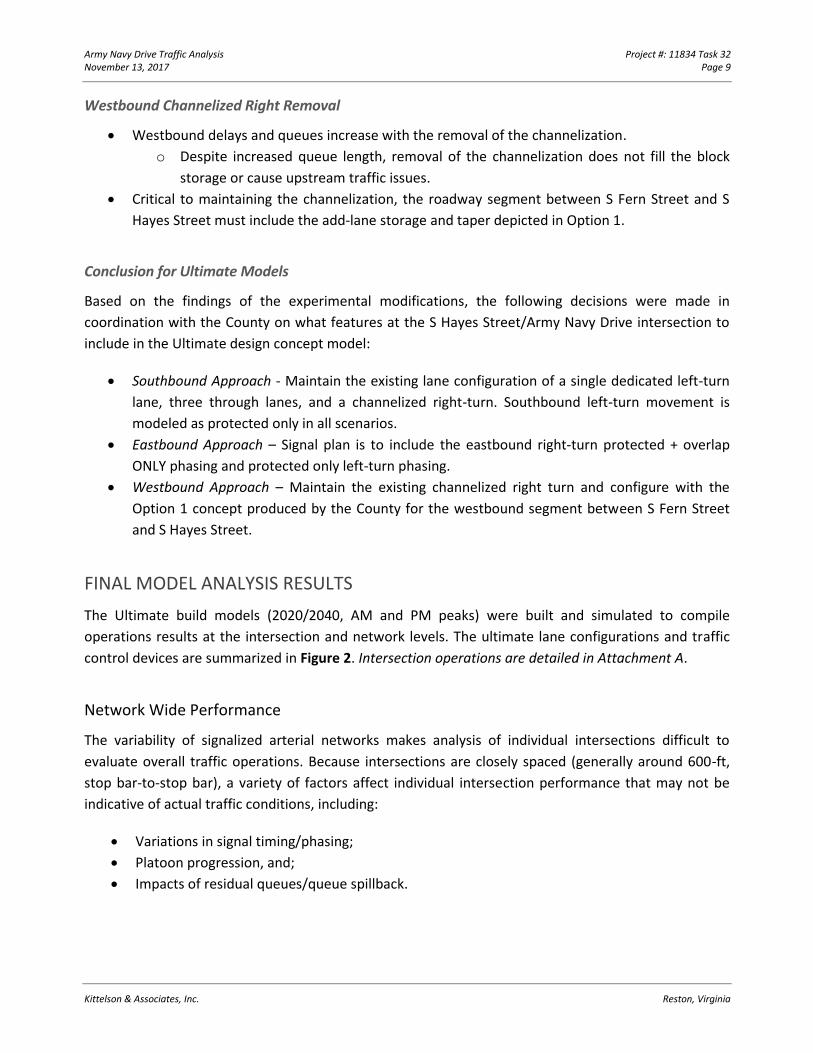
Westbound Channelized Right Removal
Westbound delays and queues increase with the removal of the channelization.
o Despite increased queue length, removal of the channelization does not fill the block
storage or cause upstream traffic issues.
Critical to maintaining the channelization, the roadway segment between S Fern Street and S
Hayes Street must include the add-lane storage and taper depicted in Option 1.
Conclusion for Ultimate Models
Based on the findings of the experimental modifications, the following decisions were made in
coordination with the County on what features at the S Hayes Street/Army Navy Drive intersection to
include in the Ultimate design concept model:
Southbound Approach - Maintain the existing lane configuration of a single dedicated left-turn
lane, three through lanes, and a channelized right-turn. Southbound left-turn movement is
modeled as protected only in all scenarios.
Eastbound Approach – Signal plan is to include the eastbound right-turn protected + overlap
ONLY phasing and protected only left-turn phasing.
Westbound Approach – Maintain the existing channelized right turn and configure with the
Option 1 concept produced by the County for the westbound segment between S Fern Street
and S Hayes Street.
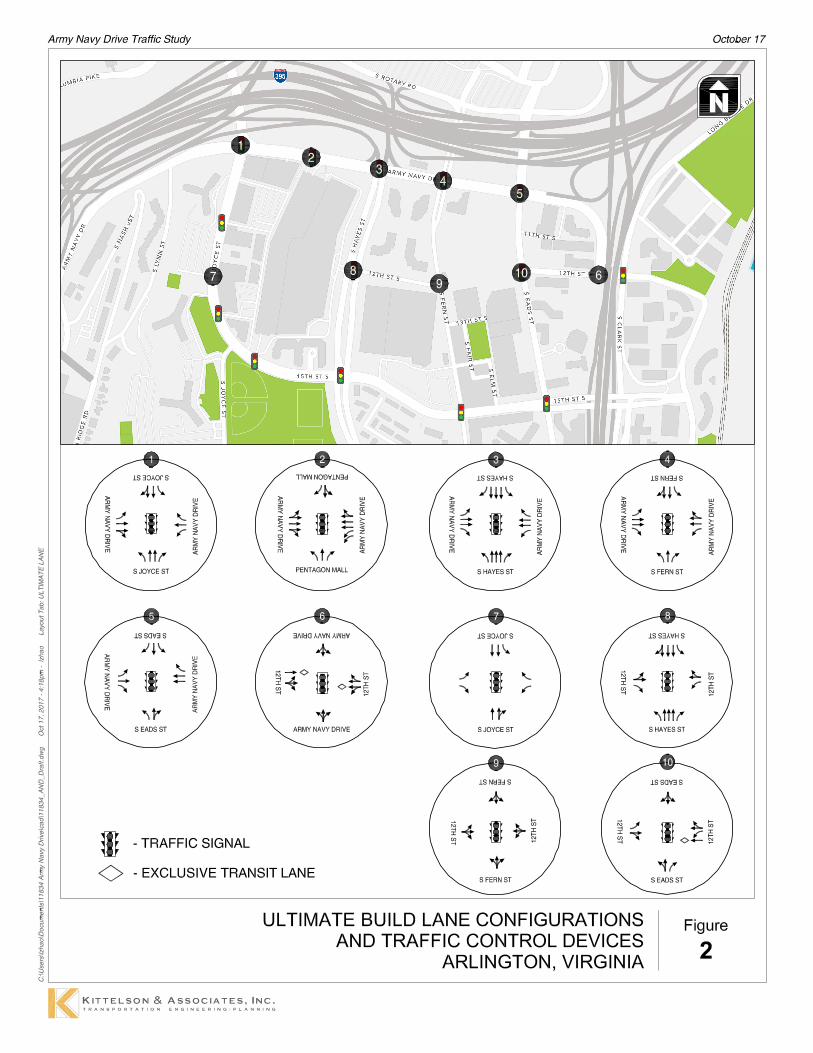
FINAL MODEL ANALYSIS RESULTS
The Ultimate build models (2020/2040, AM and PM peaks) were built and simulated to compile
operations results at the intersection and network levels. The ultimate lane configurations and traffic
control devices are summarized in Figure 2. Intersection operations are detailed in Attachment A.
Network Wide Performance
The variability of signalized arterial networks makes analysis of individual intersections difficult to
evaluate overall traffic operations. Because intersections are closely spaced (generally around 600-ft,
stop bar-to-stop bar), a variety of factors affect individual intersection performance that may not be
indicative of actual traffic conditions, including:
Variations in signal timing/phasing;
Platoon progression, and;
Impacts of residual queues/queue spillback.
Army Navy Drive Traffic Analysis Project #: 11834 Task 32 November 13, 2017 Page 11
Kittelson & Associates, Inc. Reston, Virginia
To better compare the operational impact of the Ultimate versus Original design concepts, network-
wide average delay, transit travel times, and the southbound queuing at S Hayes Street were used as
primary performance measures. The following section and graphs demonstrate these network level
performance measures across the different analyzed scenarios.
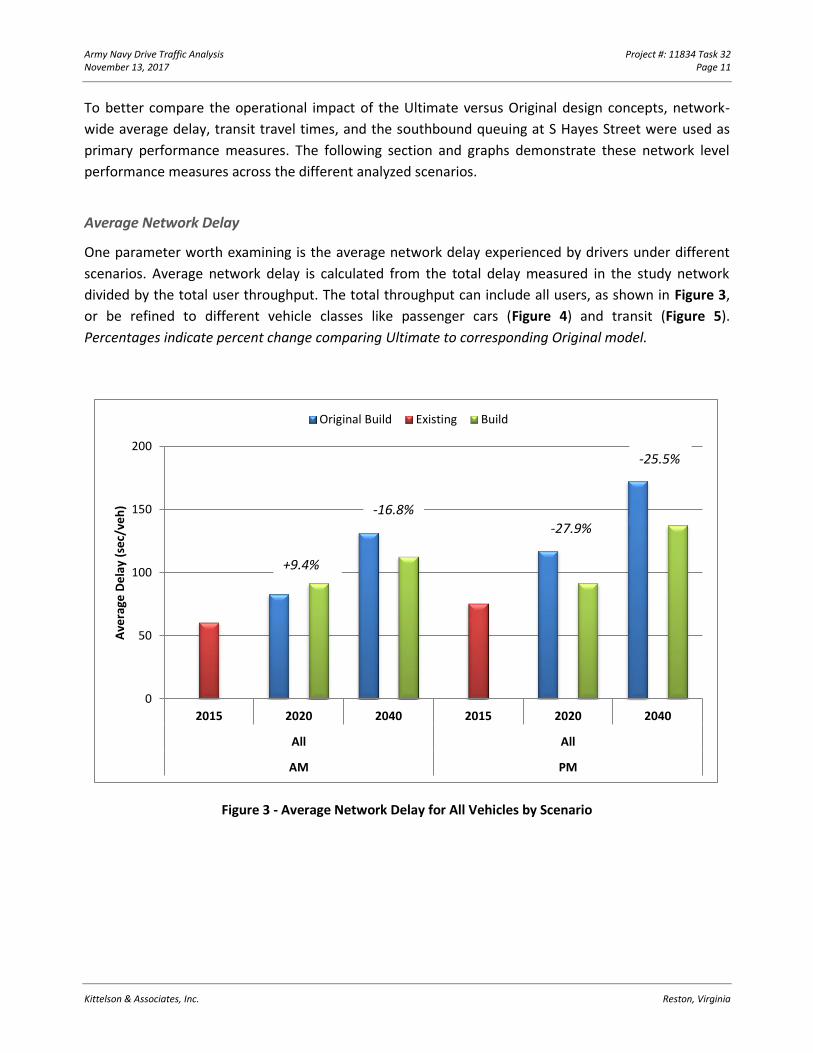
Average Network Delay
One parameter worth examining is the average network delay experienced by drivers under different
scenarios. Average network delay is calculated from the total delay measured in the study network
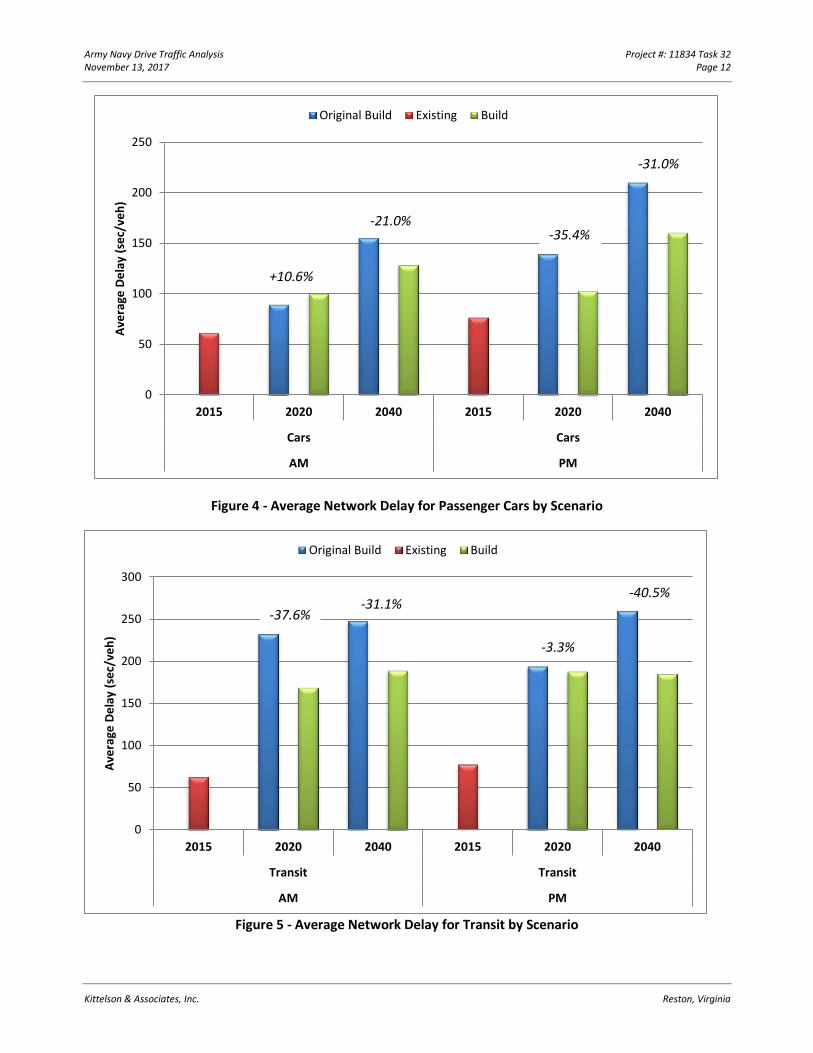
divided by the total user throughput. The total throughput can include all users, as shown in Figure 3,
or be refined to different vehicle classes like passenger cars (Figure 4) and transit (Figure 5).
Percentages indicate percent change comparing Ultimate to corresponding Original model.
Figure 3 - Average Network Delay for All Vehicles by Scenario
0
50
100
150
200
2015 2020 2040 2015 2020 2040
All All
AM PM
Ave
rage
De
lay
(se
c/ve
h)
Original Build Existing Build
+9.4%
-16.8%
-27.9%
-25.5%
Army Navy Drive Traffic Analysis Project #: 11834 Task 32 November 13, 2017 Page 12
Kittelson & Associates, Inc. Reston, Virginia
Figure 4 - Average Network Delay for Passenger Cars by Scenario
Figure 5 - Average Network Delay for Transit by Scenario
0
50
100
150
200
250
2015 2020 2040 2015 2020 2040
Cars Cars
AM PM
Ave
rage
De
lay
(se
c/ve
h)
Original Build Existing Build
0
50
100
150
200
250
300
2015 2020 2040 2015 2020 2040
Transit Transit
AM PM
Ave
rage
De
lay
(se
c/ve
h)
Original Build Existing Build
+10.6%
-21.0% -35.4%
-31.0%
-37.6% -31.1%
-3.3%
-40.5%
Army Navy Drive Traffic Analysis Project #: 11834 Task 32 November 13, 2017 Page 13
Kittelson & Associates, Inc. Reston, Virginia
The primary finding from these network wide results is that the new ultimate build model improves
average delay for both passenger cars and transit, suggesting the mitigations investigated do improve
the overall network. Notable instances show the Original build performing better than the new
ultimate build (e.g. all vehicles/passenger car delay 2020 AM). This has been found to be related to the
signal timing changes at S Eads Street/Army Navy Drive, where the north and south legs have been
expanded to include protected left turn phases. These additional phases require more of the cycle
length, limiting green time for the east-west phases. However, by 2040, traffic demands across all
approaches rises enough to realize the benefit of the protected/permissive phasing of the north and
south legs, resulting in a better overall performance. Both 2020 and 2040 PM scenarios operate better
for transit average network delay compared to the Original build.
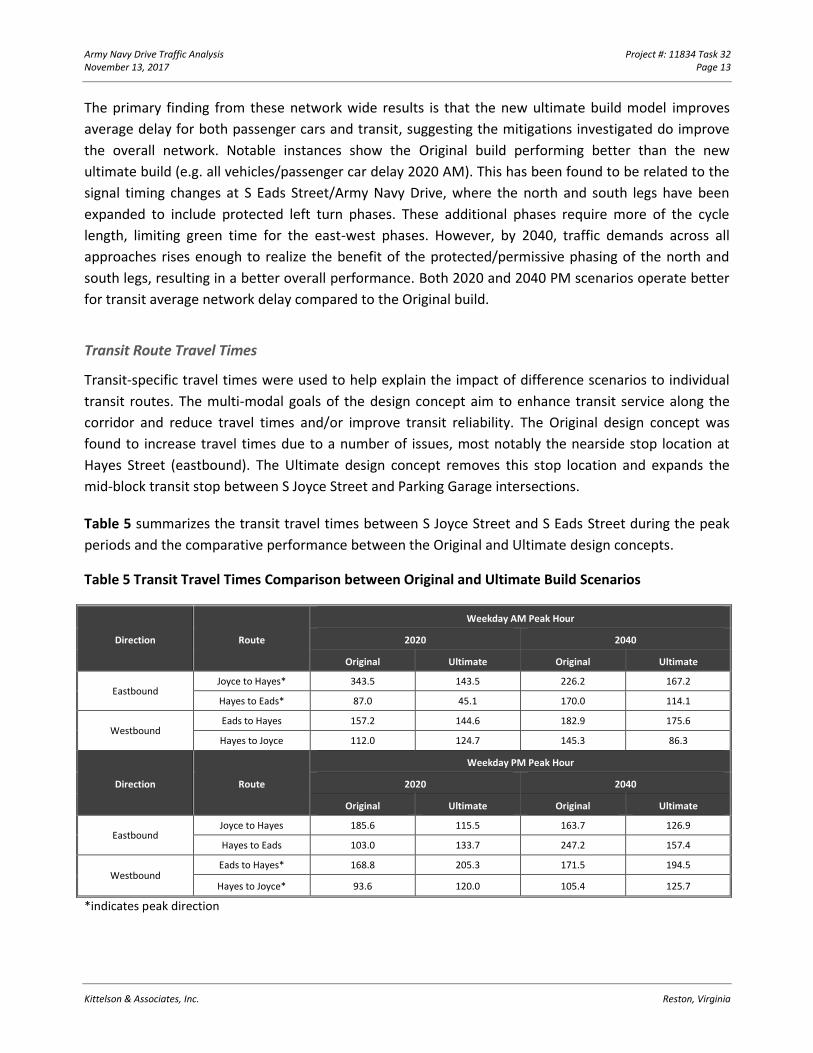
Transit Route Travel Times
Transit-specific travel times were used to help explain the impact of difference scenarios to individual
transit routes. The multi-modal goals of the design concept aim to enhance transit service along the
corridor and reduce travel times and/or improve transit reliability. The Original design concept was
found to increase travel times due to a number of issues, most notably the nearside stop location at
Hayes Street (eastbound). The Ultimate design concept removes this stop location and expands the
mid-block transit stop between S Joyce Street and Parking Garage intersections.
Table 5 summarizes the transit travel times between S Joyce Street and S Eads Street during the peak
periods and the comparative performance between the Original and Ultimate design concepts.
Table 5 Transit Travel Times Comparison between Original and Ultimate Build Scenarios
Direction Route
Weekday AM Peak Hour
2020 2040
Original Ultimate Original Ultimate
Eastbound Joyce to Hayes* 343.5 143.5 226.2 167.2
Hayes to Eads* 87.0 45.1 170.0 114.1
Westbound Eads to Hayes 157.2 144.6 182.9 175.6
Hayes to Joyce 112.0 124.7 145.3 86.3
Direction Route
Weekday PM Peak Hour
2020 2040
Original Ultimate Original Ultimate
Eastbound Joyce to Hayes 185.6 115.5 163.7 126.9
Hayes to Eads 103.0 133.7 247.2 157.4
Westbound Eads to Hayes* 168.8 205.3 171.5 194.5
Hayes to Joyce* 93.6 120.0 105.4 125.7
*indicates peak direction

Army Navy Drive Traffic Analysis Project #: 11834 Task 32 November 13, 2017 Page 14
Kittelson & Associates, Inc. Reston, Virginia
As shown in Table 5, 2020 and 2040 AM transit travel times have notably improved under the Ultimate
design concept compared to the Original in both directions of the Army Navy Drive corridor. This is
likely attributable to the roadway improvements along Army Navy Drive and the Eads S Street
intersection to better process queues and avoid excessive delays due to queue spillback.
Similar findings are shown during the PM peak for the eastbound transit routes where the Ultimate
design concept decreases travel times compared to the Original, but not for westbound transit routes.
The reason for westbound transit travel times increasing compared to the Original design concept is
likely an amalgamation of traffic patterns and the signal progression of the corridor.
Queuing
The intersection at S Hayes Street/Army Navy Drive is of particular importance because of its
connection to I-395 and Washington Boulevard, with the southbound approach serving as the
freeway’s off-ramps to Army Navy Drive. A priority goal for the design concept must include mitigating
queues on this approach as to not spillback onto the freeway. Examining the full queue storage
available on the approach is shown in Figure 6. In VISSIM models, the queues are modeled from one
single ramp whereas in reality vehicles accumulating the queues are from two ramps (i.e., Washington
Blvd and I-395 ramp) as shown in Figure 6.
Figure 6 – Measured Southbound Queue Storage at S Hayes Street/Army Navy Drive
The shortest queue storage is from Washington Blvd at 1,970 feet. This storage distance serves as the
threshold no maximum queue may extend past to be considered acceptable. Furthermore, because the
maximum modeled queues will, in reality, be divided between the I-395 ramp and Washington Blvd
ramp, the maximum queue distance on either ramp will always be less than the maximum queue
reported. Findings from the original analysis showed that queues were accommodated by the Original
design concept, however finding means of reducing queue lengths further were pursued to provide
greater reliability the storage would be sufficient.
Table 6 summarizes the maximum simulated queues for southbound movements at S Hayes
Street/Army Navy Drive between the Original and Ultimate design concepts.
Army Navy Drive Traffic Analysis Project #: 11834 Task 32 November 13, 2017 Page 15
Kittelson & Associates, Inc. Reston, Virginia
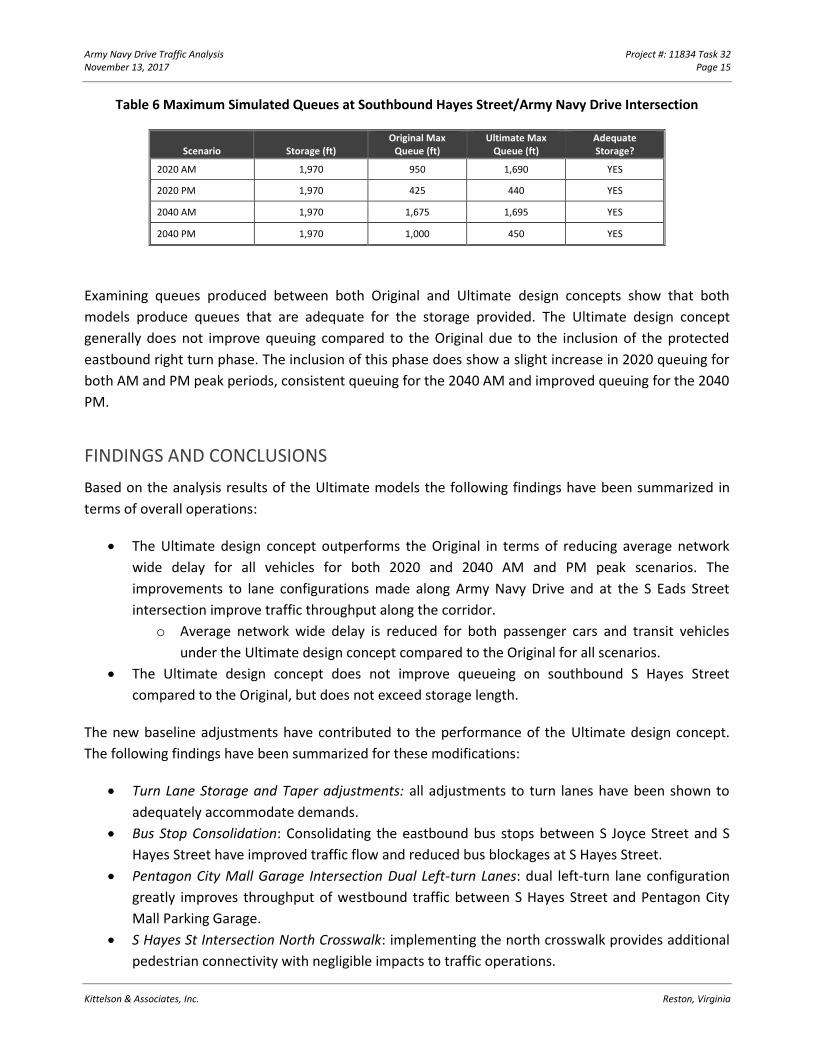
Table 6 Maximum Simulated Queues at Southbound Hayes Street/Army Navy Drive Intersection
Scenario Storage (ft) Original Max
Queue (ft) Ultimate Max
Queue (ft) Adequate Storage?
2020 AM 1,970 950 1,690 YES
2020 PM 1,970 425 440 YES
2040 AM 1,970 1,675 1,695 YES
2040 PM 1,970 1,000 450 YES
Examining queues produced between both Original and Ultimate design concepts show that both
models produce queues that are adequate for the storage provided. The Ultimate design concept
generally does not improve queuing compared to the Original due to the inclusion of the protected
eastbound right turn phase. The inclusion of this phase does show a slight increase in 2020 queuing for
both AM and PM peak periods, consistent queuing for the 2040 AM and improved queuing for the 2040
PM.
FINDINGS AND CONCLUSIONS
Based on the analysis results of the Ultimate models the following findings have been summarized in
terms of overall operations:
The Ultimate design concept outperforms the Original in terms of reducing average network
wide delay for all vehicles for both 2020 and 2040 AM and PM peak scenarios. The
improvements to lane configurations made along Army Navy Drive and at the S Eads Street
intersection improve traffic throughput along the corridor.
o Average network wide delay is reduced for both passenger cars and transit vehicles
under the Ultimate design concept compared to the Original for all scenarios.
The Ultimate design concept does not improve queueing on southbound S Hayes Street
compared to the Original, but does not exceed storage length.
The new baseline adjustments have contributed to the performance of the Ultimate design concept.
The following findings have been summarized for these modifications:
Turn Lane Storage and Taper adjustments: all adjustments to turn lanes have been shown to
adequately accommodate demands.
Bus Stop Consolidation: Consolidating the eastbound bus stops between S Joyce Street and S
Hayes Street have improved traffic flow and reduced bus blockages at S Hayes Street.
Pentagon City Mall Garage Intersection Dual Left-turn Lanes: dual left-turn lane configuration
greatly improves throughput of westbound traffic between S Hayes Street and Pentagon City
Mall Parking Garage.
S Hayes St Intersection North Crosswalk: implementing the north crosswalk provides additional
pedestrian connectivity with negligible impacts to traffic operations.
Army Navy Drive Traffic Analysis Project #: 11834 Task 32 November 13, 2017 Page 16
Kittelson & Associates, Inc. Reston, Virginia
S Eads St Intersection Modifications:
o I-395 HOT Lane Widening Improvements: the improvements to the S Eads Street
intersection due to the I-395 HOT lanes have greatly improved the throughput of
vehicles routed to/from the north leg. Expanding the typical section to two-receiving
lanes and dedicated turn lanes on the approach better processes vehicles going to/from
the freeways. Protected/permissive left turn phasing was implemented to favor traffic
operations at this key intersection.
o Westbound approach: Removing the westbound left turn lane and reconfiguring the
westbound approach to two (2) through lanes and a dedicated right turn lane better
processes the vehicle merge of the US 110 off-ramp and Army Navy Drive. Elimination
of westbound left turns reduces lane changes within the short segment.
o Optimize signal timings and corridor offsets as needed.
Army Navy Drive/12th St S Westbound Approach: the minimal left turns on the westbound
approach mixing with the transit lane shows negligible impact and more direct access to the
proximate parking garage.
While the Army Navy Drive corridor experiences peak hour congestion, many of the modifications
proposed in the Ultimate design concept have provided some relief for the high traffic demands. Other
future considerations may include:
Variable lane configurations (e.g. eastbound Army Navy Drive at Eads Street configured
with dual left turn lanes during PM peak period).
Transit signal priority at strategically identified intersections to improve transit
reliability.
Overall, across multiple performance metrics the Ultimate design concept is an improvement over the
Original and is recommended to be advanced forward in the design process.
Army Navy Drive Traffic Analysis Project #: 11834 Task 32 November 13, 2017 Page 17
Kittelson & Associates, Inc. Reston, Virginia
REFERENCES
1. Army Navy Drive Traffic Study. Kittelson & Associates, Inc. March 2017.
2. Marked Crosswalk Study. Kittelson & Associates, Inc. September 2017.
ATTACHMENTS
Attachment A – Ultimate Build Intersection Operations
Attachment A Ultimate Build Intersection Operations

Army Navy Drive Traffic Study VISSIM Operations Results 2020 Build Conditions
Optional Task - Ultimate Concept
AM Peak Hour
Delay LOS Vehicle Transit Person
Army Navy & Joyce 53 40.56 D 40.82 31.71 39.51 = Main Intersections
Army Navy & Pentagon Mall 54 39.45 D 54.65 NA 54.65
Army Navy & Hayes 28 65.83 E 65.87 65.42 64.74
Army Navy & Fern 35 45.69 D 45.99 34.93 44.89
Army Navy & Eads 34 29.02 C 29.47 16.80 28.57
Army Navy & 12th 27 70.52 E 70.44 82.58 69.89
Joyce 55 7.59 A 7.59 8.59 7.55
12th & Hayes 29 8.36 A 7.95 39.40 7.88
12th & Fern 36 15.90 B 15.77 27.62 15.61
12th & Eads 46 15.91 B 15.73 51.23 15.39
EBL EBT EBR WBL WBT WBR NBL NBT NBR SBL SBT SBR
Movement Delay (sec/veh) 19.6 32.8 32.6 99.3 24.0 4.8 36.2 52.3 35.5 55.8 37.5 22.2
Movement LOS B C C F C A D D D E D C
Approach Delay (sec/veh)
Approach LOS
Average Queue (ft) 81 81 81 78 78 47 5 45 45 108 108 98
95th Percentile Queue (ft) 433 433 433 286 286 288 79 256 256 487 487 490
40.6 D
EBL EBT EBR WBL WBT WBR NBL NBT NBR SBL SBT SBR
Movement Delay (sec/veh) 27.2 35.3 51.1 76.8 10.3 14.5 54.6 N/A 29.7 42.9 0.0 12.7
Movement LOS C D D E B B D N/A C D A B
Approach Delay (sec/veh)
Approach LOS
Average Queue (ft) 110 110 110 92 12 15 1 1 1 2 2 3
95th Percentile Queue (ft) 522 522 522 371 150 165 17 17 17 50 50 64
39.4 D
EBL EBT EBR WBL WBT WBR NBL NBT NBR SBL SBT SBR
Movement Delay (sec/veh) 91.5 36.4 121.8 105.1 17.4 5.5 127.2 45.8 41.2 229.6 53.5 29.3
Movement LOS F D F F B A F D D F D C
Approach Delay (sec/veh)
Approach LOS
Average Queue (ft) 12 198 198 25 20 0 96 39 11 1229 1229 387
95th Percentile Queue (ft) 72 525 525 111 157 66 313 148 114 1688 1688 1251
65.8 E
EBL EBT EBR WBL WBT WBR NBL NBT NBR SBL SBT SBR
Movement Delay (sec/veh) 26.1 35.9 56.2 63.2 35.3 30.4 103.2 58.2 22.0 45.1 34.9 22.5
Movement LOS C D E E D C F E C D C C
Approach Delay (sec/veh)
Approach LOS
Average Queue (ft) 12 101 87 24 65 67 158 18 18 27 34 32
95th Percentile Queue (ft) 127 466 452 239 338 343 609 139 139 200 211 212
45.7 D
EBL EBT EBR WBL WBT WBR NBL NBT NBR SBL SBT SBR
43.4 42.2 22.8
D D D C
Intersection Delay (sec/veh)
Intersection Delay (sec/veh)
34/I. Army Navy & Eads
Army Navy Eads
Eastbound Westbound Northbound Southbound
40.1 38.4 88.9 33.0
D D F C
Intersection Delay (sec/veh)
35/G. Army Navy & Fern
Army Navy Fern
Eastbound Westbound Northbound Southbound
68.3 15.4 62.6 85.4
E B E F
Intersection Delay (sec/veh)
28/E. Army Navy & Hayes
Army Navy Hayes
Eastbound Westbound Northbound Southbound
29.7 48.9 47.1 49.0
C D D D
54/C. Army Navy & Pentagon Mall
Entrance
Army Navy Pentagon Mall Entrance
Eastbound Westbound Northbound Southbound
36.7
53/A. Army Navy & Joyce
Army Navy Joyce St
Eastbound Westbound Northbound Southbound
Intersection No
Total Traffic Delay
2020 Build Conditions
Ultimate Concept
AM Peak Hour
1 of 2

Army Navy Drive Traffic Study VISSIM Operations Results 2020 Build Conditions
Optional Task - Ultimate Concept
AM Peak Hour
Movement Delay (sec/veh) 10.3 20.3 10.0 N/A 45.4 8.1 42.4 63.3 69.7 37.1 39.8 9.1
Movement LOS B C A N/A D A D E E D D A
Approach Delay (sec/veh)
Approach LOS
Average Queue (ft) 40 40 40 N/A 35 40 86 86 86 51 43 2
95th Percentile Queue (ft) 256 256 256 N/A 190 198 431 431 431 396 466 114
29.0 C
EBL EBT EBR WBL WBT WBR NBL NBT NBR SBL SBT SBR
Movement Delay (sec/veh) 65.0 70.0 0.0 0.0 91.5 86.9 52.9 30.7 32.4 62.0 0.0 115.2
Movement LOS E E A A F F D C C E A F
Approach Delay (sec/veh)
Approach LOS
Average Queue (ft) 150 150 184 93 93 98 7 7 7 425 425 425
95th Percentile Queue (ft) 598 598 641 642 642 652 76 76 76 1177 1177 1177
70.5 E
EBL EBT EBR WBL WBT WBR NBL NBT NBR SBL SBT SBR
Movement Delay (sec/veh) 18.5 - 6.0 19.9 - 5.2 - 6.7 5.0 8.1 7.1 -
Movement LOS C - A C - A - A A A A -
Approach Delay (sec/veh)
Approach LOS
Average Queue (ft) 2 - 4 2 - 2 - 8 6 1 4 -
95th Percentile Queue (ft) 48 - 68 34 - 40 - 131 135 42 91 -
7.6 A
EBL EBT EBR WBL WBT WBR NBL NBT NBR SBL SBT SBR
Movement Delay (sec/veh) 54.0 48.0 46.2 55.3 34.0 14.3 16.3 7.5 6.1 6.8 4.7 4.9
Movement LOS D D D E C B B A A A A A
Approach Delay (sec/veh)
Approach LOS
Average Queue (ft) 14 14 15 15 15 15 1 7 1 1 6 7
95th Percentile Queue (ft) 107 107 106 134 134 141 55 124 75 44 158 164
8.4 A
EBL EBT EBR WBL WBT WBR NBL NBT NBR SBL SBT SBR
Movement Delay (sec/veh) 29.1 24.3 20.3 24.0 23.8 11.6 13.7 11.5 8.0 14.3 14.1 12.7
Movement LOS C C C C C B B B A B B B
Approach Delay (sec/veh)
Approach LOS
Average Queue (ft) 17 17 18 3 3 4 16 16 20 13 13 12
95th Percentile Queue (ft) 178 178 181 80 80 88 166 166 189 210 210 213
15.9 B
EBL EBT EBR WBL WBT WBR NBL NBT NBR SBL SBT SBR
Movement Delay (sec/veh) 90.8 51.9 18.1 45.2 32.5 18.6 13.9 11.4 3.2 23.9 13.5 8.4
Movement LOS F D B D C B B B A C B A
Approach Delay (sec/veh)
Approach LOS
Average Queue (ft) 1 7 11 21 21 23 12 12 12 20 20 22
95th Percentile Queue (ft) 21 91 108 229 229 234 177 177 179 261 261 267
15.9 BIntersection Delay (sec/veh)
28.1 37.6 7.6 14.3
C D A B
Intersection Delay (sec/veh)
Intersection Delay (sec/veh)
Intersection Delay (sec/veh)
Intersection Delay (sec/veh)
46/V. 12th & Eads
12th Eads
Eastbound Westbound Northbound Southbound
24.6 17.1 11.9 13.9
C B B B
36/S. 12th & Fern
12th Fern
Eastbound Westbound Northbound Southbound
48.5 37.5 7.8 0.0
D D A A
29/Q. 12th & Hayes
12th Hayes
Eastbound Westbound Northbound Southbound
17.7 13.0 6.5 7.2
C B A A
55/O. Joyce
- Joyce
Eastbound Westbound Northbound Southbound
69.9 22.6 34.1 64.8
E C C E
Intersection Delay (sec/veh)
27/M. Army Navy & 12th
12th Army Navy
Eastbound Westbound Northbound Southbound
15.9 35.6 58.1 27.7
B D E C
2 of 2

Army Navy Drive Traffic Study VISSIM Operations Results 2020 Build Conditions
Optional Task - Ultimate Concept
PM Peak Hour
Delay LOS Vehicle Transit Person
Army Navy & Joyce 53 34.96 C 34.82 40.02 34.10 = Main Intersections
Army Navy & Pentagon Mall 54 27.88 C 60.58 NA 60.58
Army Navy & Hayes 28 43.61 D 43.70 45.37 43.04
Army Navy & Fern 35 45.34 D 45.31 50.12 44.48
Army Navy & Eads 34 78.87 E 79.18 62.51 77.35
Army Navy & 12th 27 80.84 F 80.73 89.63 80.02
Joyce 55 9.80 A 9.77 22.10 9.74
12th & Hayes 29 12.59 B 12.38 21.16 12.27
12th & Fern 36 23.16 C 23.26 13.59 23.05
12th & Eads 46 25.09 C 25.17 54.19 24.73
EBL EBT EBR WBL WBT WBR NBL NBT NBR SBL SBT SBR
Movement Delay (sec/veh) 24.6 34.7 36.5 64.6 27.4 9.9 39.1 48.5 30.1 49.2 44.5 33.8
Movement LOS C C D E C A D D C D D C
Approach Delay (sec/veh)
Approach LOS
Average Queue (ft) 37 37 37 134 134 130 47 73 73 107 107 106
95th Percentile Queue (ft) 217 217 217 571 571 575 332 351 351 427 427 430
35.0 C
EBL EBT EBR WBL WBT WBR NBL NBT NBR SBL SBT SBR
Movement Delay (sec/veh) 25.8 29.0 29.4 65.8 12.9 6.5 60.6 N/A 51.5 37.4 0.0 6.2
Movement LOS C C C E B A E N/A D D A A
Approach Delay (sec/veh)
Approach LOS
Average Queue (ft) 59 59 59 51 51 57 75 75 75 9 9 12
95th Percentile Queue (ft) 317 317 317 247 331 346 263 263 263 90 90 101
27.9 C
EBL EBT EBR WBL WBT WBR NBL NBT NBR SBL SBT SBR
Movement Delay (sec/veh) 104.5 33.6 51.3 86.0 49.8 6.0 86.6 35.5 29.3 70.2 45.9 11.8
Movement LOS F C D F D A F D C E D B
Approach Delay (sec/veh)
Approach LOS
Average Queue (ft) 168 107 107 20 125 0 151 49 9 149 149 2
95th Percentile Queue (ft) 606 451 451 234 484 67 524 319 160 437 437 229
43.6 D
EBL EBT EBR WBL WBT WBR NBL NBT NBR SBL SBT SBR
Movement Delay (sec/veh) 52.1 18.9 32.4 87.9 34.7 40.0 108.5 78.7 83.4 65.3 34.2 12.9
Movement LOS D B C F C D F E F E C B
Approach Delay (sec/veh)
Approach LOS
Average Queue (ft) 27 68 19 21 139 142 536 237 237 7 23 20
95th Percentile Queue (ft) 229 397 211 243 583 588 941 773 773 80 200 201
45.3 D
EBL EBT EBR WBL WBT WBR NBL NBT NBR SBL SBT SBR
21.2 55.3 16.3
C C E B
Intersection Delay (sec/veh)
Intersection Delay (sec/veh)
34/I. Army Navy & Eads
Army Navy Eads
Eastbound Westbound Northbound Southbound
30.1 37.4 94.5 23.3
C D F C
Intersection Delay (sec/veh)
35/G. Army Navy & Fern
Army Navy Fern
Eastbound Westbound Northbound Southbound
55.2 31.9 49.7 42.6
E C D D
Intersection Delay (sec/veh)
28/E. Army Navy & Hayes
Army Navy Hayes
Eastbound Westbound Northbound Southbound
32.6 27.3 41.7 42.4
C C D D
54/C. Army Navy & Pentagon Mall
Entrance
Army Navy Pentagon Mall Entrance
Eastbound Westbound Northbound Southbound
28.9
53/A. Army Navy & Joyce
Army Navy Joyce St
Eastbound Westbound Northbound Southbound
Intersection No
Total Traffic Delay
2020 Build Conditions
Ultimate Concept
PM Peak Hour
1 of 2
Army Navy Drive Traffic Study VISSIM Operations Results 2020 Build Conditions
Optional Task - Ultimate Concept
PM Peak Hour
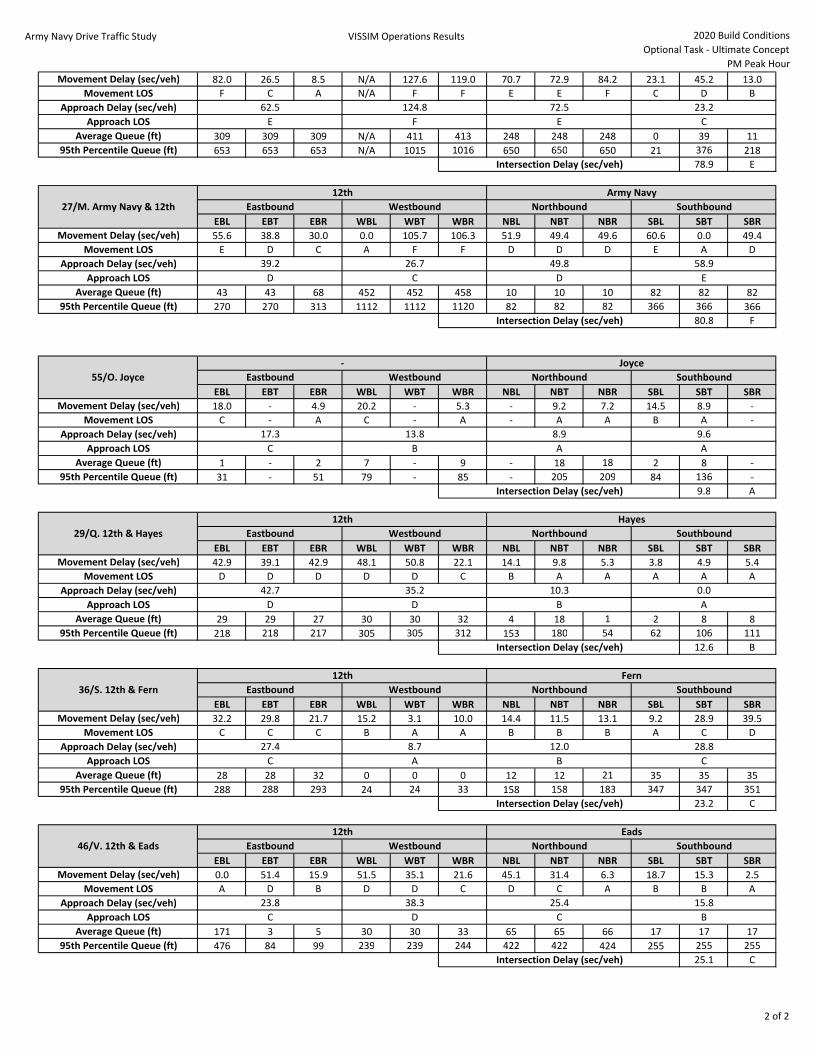
Movement Delay (sec/veh) 82.0 26.5 8.5 N/A 127.6 119.0 70.7 72.9 84.2 23.1 45.2 13.0
Movement LOS F C A N/A F F E E F C D B
Approach Delay (sec/veh)
Approach LOS
Average Queue (ft) 309 309 309 N/A 411 413 248 248 248 0 39 11
95th Percentile Queue (ft) 653 653 653 N/A 1015 1016 650 650 650 21 376 218
78.9 E
EBL EBT EBR WBL WBT WBR NBL NBT NBR SBL SBT SBR
Movement Delay (sec/veh) 55.6 38.8 30.0 0.0 105.7 106.3 51.9 49.4 49.6 60.6 0.0 49.4
Movement LOS E D C A F F D D D E A D
Approach Delay (sec/veh)
Approach LOS
Average Queue (ft) 43 43 68 452 452 458 10 10 10 82 82 82
95th Percentile Queue (ft) 270 270 313 1112 1112 1120 82 82 82 366 366 366
80.8 F
EBL EBT EBR WBL WBT WBR NBL NBT NBR SBL SBT SBR
Movement Delay (sec/veh) 18.0 - 4.9 20.2 - 5.3 - 9.2 7.2 14.5 8.9 -
Movement LOS C - A C - A - A A B A -
Approach Delay (sec/veh)
Approach LOS
Average Queue (ft) 1 - 2 7 - 9 - 18 18 2 8 -
95th Percentile Queue (ft) 31 - 51 79 - 85 - 205 209 84 136 -
9.8 A
EBL EBT EBR WBL WBT WBR NBL NBT NBR SBL SBT SBR
Movement Delay (sec/veh) 42.9 39.1 42.9 48.1 50.8 22.1 14.1 9.8 5.3 3.8 4.9 5.4
Movement LOS D D D D D C B A A A A A
Approach Delay (sec/veh)
Approach LOS
Average Queue (ft) 29 29 27 30 30 32 4 18 1 2 8 8
95th Percentile Queue (ft) 218 218 217 305 305 312 153 180 54 62 106 111
12.6 B
EBL EBT EBR WBL WBT WBR NBL NBT NBR SBL SBT SBR
Movement Delay (sec/veh) 32.2 29.8 21.7 15.2 3.1 10.0 14.4 11.5 13.1 9.2 28.9 39.5
Movement LOS C C C B A A B B B A C D
Approach Delay (sec/veh)
Approach LOS
Average Queue (ft) 28 28 32 0 0 0 12 12 21 35 35 35
95th Percentile Queue (ft) 288 288 293 24 24 33 158 158 183 347 347 351
23.2 C
EBL EBT EBR WBL WBT WBR NBL NBT NBR SBL SBT SBR
Movement Delay (sec/veh) 0.0 51.4 15.9 51.5 35.1 21.6 45.1 31.4 6.3 18.7 15.3 2.5
Movement LOS A D B D D C D C A B B A
Approach Delay (sec/veh)
Approach LOS
Average Queue (ft) 171 3 5 30 30 33 65 65 66 17 17 17
95th Percentile Queue (ft) 476 84 99 239 239 244 422 422 424 255 255 255
25.1 CIntersection Delay (sec/veh)
23.8 38.3 25.4 15.8
C D C B
Intersection Delay (sec/veh)
Intersection Delay (sec/veh)
Intersection Delay (sec/veh)
Intersection Delay (sec/veh)
46/V. 12th & Eads
12th Eads
Eastbound Westbound Northbound Southbound
27.4 8.7 12.0 28.8
C A B C
36/S. 12th & Fern
12th Fern
Eastbound Westbound Northbound Southbound
42.7 35.2 10.3 0.0
D D B A
29/Q. 12th & Hayes
12th Hayes
Eastbound Westbound Northbound Southbound
17.3 13.8 8.9 9.6
C B A A
55/O. Joyce
- Joyce
Eastbound Westbound Northbound Southbound
39.2 26.7 49.8 58.9
D C D E
Intersection Delay (sec/veh)
27/M. Army Navy & 12th
12th Army Navy
Eastbound Westbound Northbound Southbound
62.5 124.8 72.5 23.2
E F E C
2 of 2
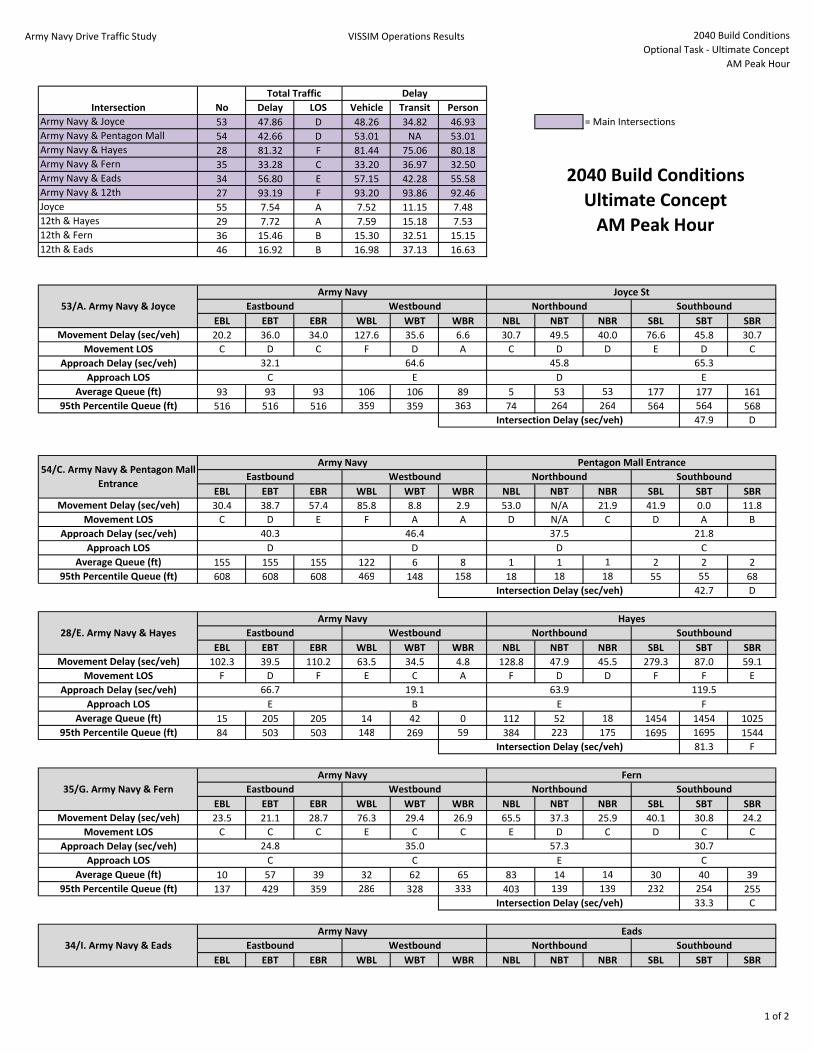
Army Navy Drive Traffic Study VISSIM Operations Results 2040 Build Conditions
Optional Task - Ultimate Concept
AM Peak Hour
Delay LOS Vehicle Transit Person
Army Navy & Joyce 53 47.86 D 48.26 34.82 46.93 = Main Intersections
Army Navy & Pentagon Mall 54 42.66 D 53.01 NA 53.01
Army Navy & Hayes 28 81.32 F 81.44 75.06 80.18
Army Navy & Fern 35 33.28 C 33.20 36.97 32.50
Army Navy & Eads 34 56.80 E 57.15 42.28 55.58
Army Navy & 12th 27 93.19 F 93.20 93.86 92.46
Joyce 55 7.54 A 7.52 11.15 7.48
12th & Hayes 29 7.72 A 7.59 15.18 7.53
12th & Fern 36 15.46 B 15.30 32.51 15.15
12th & Eads 46 16.92 B 16.98 37.13 16.63
EBL EBT EBR WBL WBT WBR NBL NBT NBR SBL SBT SBR
Movement Delay (sec/veh) 20.2 36.0 34.0 127.6 35.6 6.6 30.7 49.5 40.0 76.6 45.8 30.7
Movement LOS C D C F D A C D D E D C
Approach Delay (sec/veh)
Approach LOS
Average Queue (ft) 93 93 93 106 106 89 5 53 53 177 177 161
95th Percentile Queue (ft) 516 516 516 359 359 363 74 264 264 564 564 568
47.9 D
EBL EBT EBR WBL WBT WBR NBL NBT NBR SBL SBT SBR
Movement Delay (sec/veh) 30.4 38.7 57.4 85.8 8.8 2.9 53.0 N/A 21.9 41.9 0.0 11.8
Movement LOS C D E F A A D N/A C D A B
Approach Delay (sec/veh)
Approach LOS
Average Queue (ft) 155 155 155 122 6 8 1 1 1 2 2 2
95th Percentile Queue (ft) 608 608 608 469 148 158 18 18 18 55 55 68
42.7 D
EBL EBT EBR WBL WBT WBR NBL NBT NBR SBL SBT SBR
Movement Delay (sec/veh) 102.3 39.5 110.2 63.5 34.5 4.8 128.8 47.9 45.5 279.3 87.0 59.1
Movement LOS F D F E C A F D D F F E
Approach Delay (sec/veh)
Approach LOS
Average Queue (ft) 15 205 205 14 42 0 112 52 18 1454 1454 1025
95th Percentile Queue (ft) 84 503 503 148 269 59 384 223 175 1695 1695 1544
81.3 F
EBL EBT EBR WBL WBT WBR NBL NBT NBR SBL SBT SBR
Movement Delay (sec/veh) 23.5 21.1 28.7 76.3 29.4 26.9 65.5 37.3 25.9 40.1 30.8 24.2
Movement LOS C C C E C C E D C D C C
Approach Delay (sec/veh)
Approach LOS
Average Queue (ft) 10 57 39 32 62 65 83 14 14 30 40 39
95th Percentile Queue (ft) 137 429 359 286 328 333 403 139 139 232 254 255
33.3 C
EBL EBT EBR WBL WBT WBR NBL NBT NBR SBL SBT SBR
Intersection No
Total Traffic Delay
2040 Build Conditions
Ultimate Concept
AM Peak Hour
53/A. Army Navy & Joyce
Army Navy Joyce St
Eastbound Westbound Northbound Southbound
Intersection Delay (sec/veh)
28/E. Army Navy & Hayes
Army Navy Hayes
Eastbound Westbound Northbound Southbound
32.1 64.6 45.8 65.3
C E D E
54/C. Army Navy & Pentagon Mall
Entrance
Army Navy Pentagon Mall Entrance
Eastbound Westbound Northbound Southbound
40.3
Intersection Delay (sec/veh)
35/G. Army Navy & Fern
Army Navy Fern
Eastbound Westbound Northbound Southbound
66.7 19.1 63.9 119.5
E B E F
Intersection Delay (sec/veh)
34/I. Army Navy & Eads
Army Navy Eads
Eastbound Westbound Northbound Southbound
24.8 35.0 57.3 30.7
C C E C
46.4 37.5 21.8
D D D C
Intersection Delay (sec/veh)
1 of 2
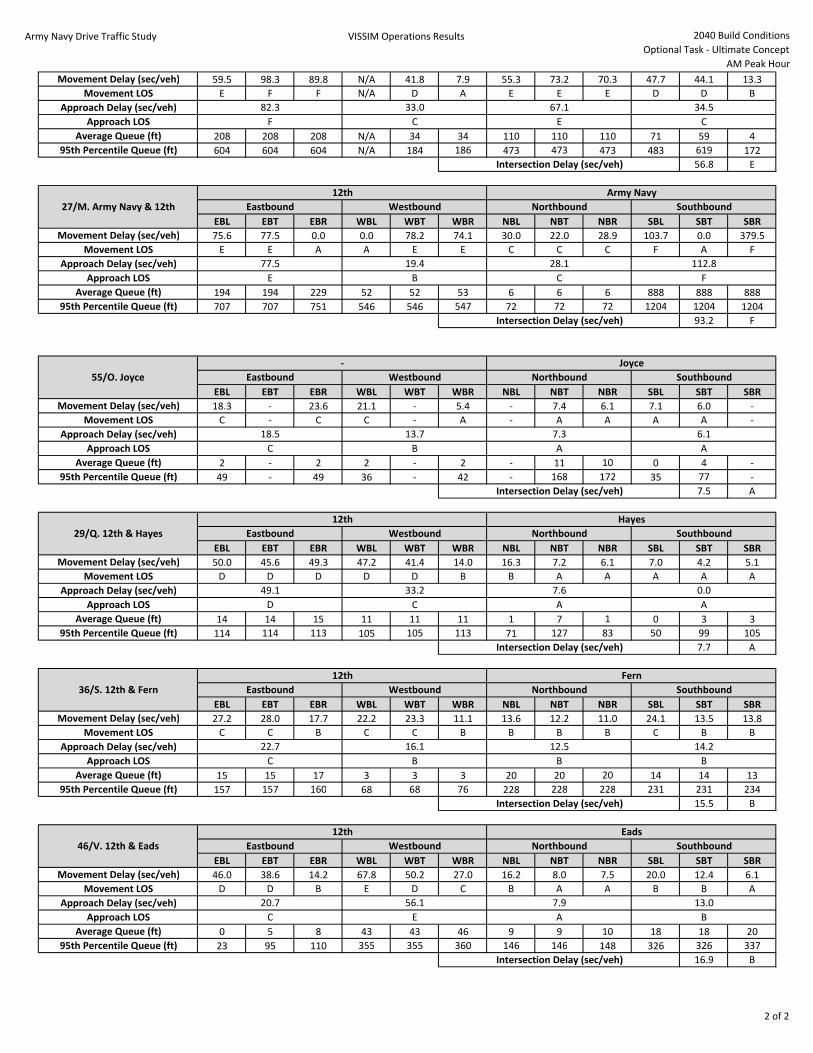
Army Navy Drive Traffic Study VISSIM Operations Results 2040 Build Conditions
Optional Task - Ultimate Concept
AM Peak Hour
Movement Delay (sec/veh) 59.5 98.3 89.8 N/A 41.8 7.9 55.3 73.2 70.3 47.7 44.1 13.3
Movement LOS E F F N/A D A E E E D D B
Approach Delay (sec/veh)
Approach LOS
Average Queue (ft) 208 208 208 N/A 34 34 110 110 110 71 59 4
95th Percentile Queue (ft) 604 604 604 N/A 184 186 473 473 473 483 619 172
56.8 E
EBL EBT EBR WBL WBT WBR NBL NBT NBR SBL SBT SBR
Movement Delay (sec/veh) 75.6 77.5 0.0 0.0 78.2 74.1 30.0 22.0 28.9 103.7 0.0 379.5
Movement LOS E E A A E E C C C F A F
Approach Delay (sec/veh)
Approach LOS
Average Queue (ft) 194 194 229 52 52 53 6 6 6 888 888 888
95th Percentile Queue (ft) 707 707 751 546 546 547 72 72 72 1204 1204 1204
93.2 F
EBL EBT EBR WBL WBT WBR NBL NBT NBR SBL SBT SBR
Movement Delay (sec/veh) 18.3 - 23.6 21.1 - 5.4 - 7.4 6.1 7.1 6.0 -
Movement LOS C - C C - A - A A A A -
Approach Delay (sec/veh)
Approach LOS
Average Queue (ft) 2 - 2 2 - 2 - 11 10 0 4 -
95th Percentile Queue (ft) 49 - 49 36 - 42 - 168 172 35 77 -
7.5 A
EBL EBT EBR WBL WBT WBR NBL NBT NBR SBL SBT SBR
Movement Delay (sec/veh) 50.0 45.6 49.3 47.2 41.4 14.0 16.3 7.2 6.1 7.0 4.2 5.1
Movement LOS D D D D D B B A A A A A
Approach Delay (sec/veh)
Approach LOS
Average Queue (ft) 14 14 15 11 11 11 1 7 1 0 3 3
95th Percentile Queue (ft) 114 114 113 105 105 113 71 127 83 50 99 105
7.7 A
EBL EBT EBR WBL WBT WBR NBL NBT NBR SBL SBT SBR
Movement Delay (sec/veh) 27.2 28.0 17.7 22.2 23.3 11.1 13.6 12.2 11.0 24.1 13.5 13.8
Movement LOS C C B C C B B B B C B B
Approach Delay (sec/veh)
Approach LOS
Average Queue (ft) 15 15 17 3 3 3 20 20 20 14 14 13
95th Percentile Queue (ft) 157 157 160 68 68 76 228 228 228 231 231 234
15.5 B
EBL EBT EBR WBL WBT WBR NBL NBT NBR SBL SBT SBR
Movement Delay (sec/veh) 46.0 38.6 14.2 67.8 50.2 27.0 16.2 8.0 7.5 20.0 12.4 6.1
Movement LOS D D B E D C B A A B B A
Approach Delay (sec/veh)
Approach LOS
Average Queue (ft) 0 5 8 43 43 46 9 9 10 18 18 20
95th Percentile Queue (ft) 23 95 110 355 355 360 146 146 148 326 326 337
16.9 B
Intersection Delay (sec/veh)
27/M. Army Navy & 12th
12th Army Navy
Eastbound Westbound Northbound Southbound
82.3 33.0 67.1 34.5
F C E C
77.5 19.4 28.1 112.8
E B C F
55/O. Joyce
- Joyce
Eastbound Westbound Northbound Southbound
29/Q. 12th & Hayes
12th Hayes
Eastbound Westbound Northbound Southbound
18.5 13.7 7.3 6.1
C B A A
36/S. 12th & Fern
12th Fern
Eastbound Westbound Northbound Southbound
49.1 33.2 7.6 0.0
D C A A
46/V. 12th & Eads
12th Eads
Eastbound Westbound Northbound Southbound
22.7 16.1 12.5 14.2
C B B B
Intersection Delay (sec/veh)
20.7 56.1 7.9 13.0
C E A B
Intersection Delay (sec/veh)
Intersection Delay (sec/veh)
Intersection Delay (sec/veh)
Intersection Delay (sec/veh)
2 of 2

Army Navy Drive Traffic Study VISSIM Operations Results 2040 Build Conditions
Optional Task - Ultimate Concept
PM Peak Hour
Delay LOS Vehicle Transit Person
Army Navy & Joyce 53 40.36 D 40.37 38.42 39.63 = Main Intersections
Army Navy & Pentagon Mall 54 30.87 C 59.44 26.48 59.44
Army Navy & Hayes 28 50.93 D 51.09 42.92 50.32
Army Navy & Fern 35 49.42 D 49.27 59.95 48.44
Army Navy & Eads 34 108.71 F 109.52 70.48 107.19
Army Navy & 12th 27 209.65 F 209.90 63.32 207.70
Joyce 55 11.36 B 11.35 16.08 11.33
12th & Hayes 29 16.31 B 16.17 36.12 16.03
12th & Fern 36 26.23 C 26.34 19.31 26.13
12th & Eads 46 63.28 E 63.84 39.55 62.68
EBL EBT EBR WBL WBT WBR NBL NBT NBR SBL SBT SBR
Movement Delay (sec/veh) 27.2 25.9 23.0 71.8 30.1 12.2 47.9 55.8 17.8 68.0 58.3 46.0
Movement LOS C C C E C B D E B E E D
Approach Delay (sec/veh)
Approach LOS
Average Queue (ft) 26 26 26 157 157 153 99 120 130 169 169 170
95th Percentile Queue (ft) 178 178 178 599 599 604 467 465 480 554 554 558
40.4 D
EBL EBT EBR WBL WBT WBR NBL NBT NBR SBL SBT SBR
Movement Delay (sec/veh) 30.0 32.7 39.1 75.1 15.9 9.1 59.4 N/A 51.7 42.8 0.0 5.8
Movement LOS C C D E B A E N/A D D A A
Approach Delay (sec/veh)
Approach LOS
Average Queue (ft) 88 88 88 66 70 78 74 74 74 10 10 14
95th Percentile Queue (ft) 373 373 373 398 415 431 251 251 251 99 99 109
30.9 C
EBL EBT EBR WBL WBT WBR NBL NBT NBR SBL SBT SBR
Movement Delay (sec/veh) 101.6 36.5 40.8 101.8 53.7 6.7 145.7 49.8 42.5 63.7 47.6 13.6
Movement LOS F D D F D A F D D E D B
Approach Delay (sec/veh)
Approach LOS
Average Queue (ft) 162 100 132 14 140 0 299 140 18 144 144 2
95th Percentile Queue (ft) 528 417 663 85 541 117 739 541 385 453 453 215
50.9 D
EBL EBT EBR WBL WBT WBR NBL NBT NBR SBL SBT SBR
Movement Delay (sec/veh) 63.9 24.2 32.8 97.2 42.3 51.9 83.8 63.0 116.5 164.8 37.2 15.2
Movement LOS E C C F D D F E F F D B
Approach Delay (sec/veh)
Approach LOS
Average Queue (ft) 40 99 23 37 183 186 126 675 675 26 32 30
95th Percentile Queue (ft) 263 439 282 446 588 593 340 960 960 171 229 230
49.4 D
EBL EBT EBR WBL WBT WBR NBL NBT NBR SBL SBT SBR
24.8 55.0 18.0
C C D B
Intersection Delay (sec/veh)
Intersection Delay (sec/veh)
34/I. Army Navy & Eads
Army Navy Eads
Eastbound Westbound Northbound Southbound
38.2 45.9 79.7 32.7
D D E C
Intersection Delay (sec/veh)
35/G. Army Navy & Fern
Army Navy Fern
Eastbound Westbound Northbound Southbound
52.8 37.1 77.1 42.9
D D E D
Intersection Delay (sec/veh)
28/E. Army Navy & Hayes
Army Navy Hayes
Eastbound Westbound Northbound Southbound
25.6 30.5 44.4 57.3
C C D E
54/C. Army Navy & Pentagon Mall
Entrance
Army Navy Pentagon Mall Entrance
Eastbound Westbound Northbound Southbound
33.1
53/A. Army Navy & Joyce
Army Navy Joyce St
Eastbound Westbound Northbound Southbound
Intersection No
Total Traffic Delay
2040 Build Conditions
Ultimate Concept
PM Peak Hour
1 of 2
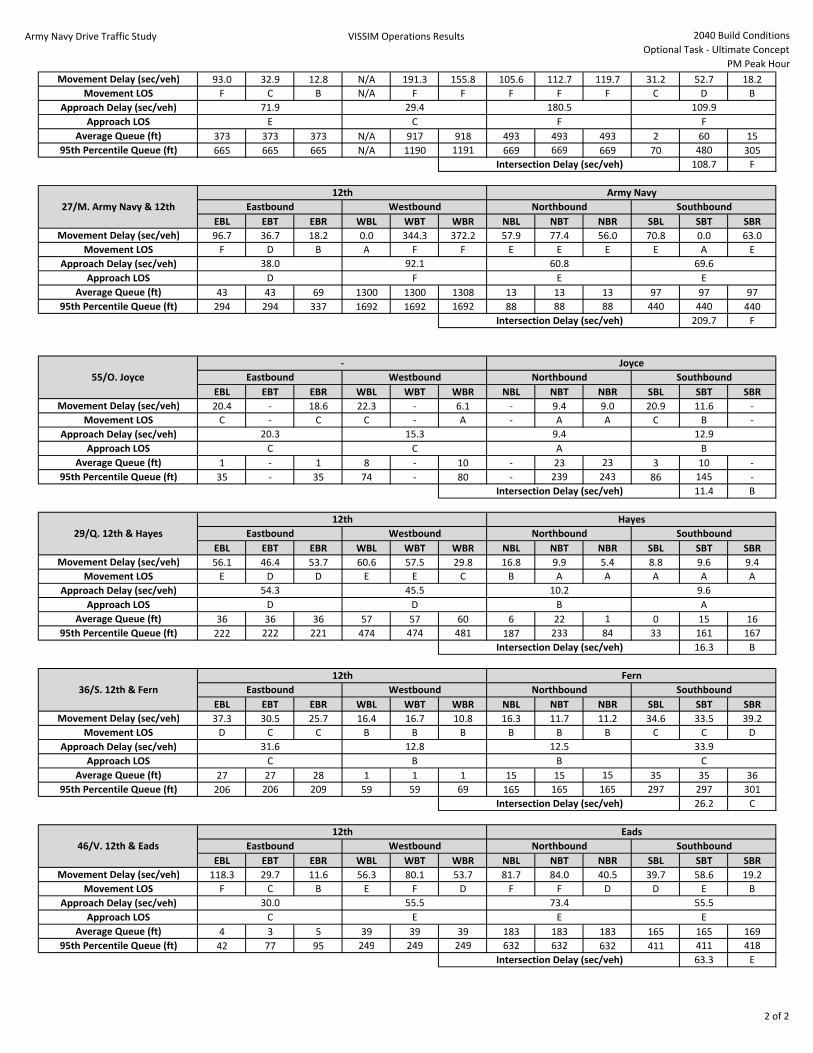
Army Navy Drive Traffic Study VISSIM Operations Results 2040 Build Conditions
Optional Task - Ultimate Concept
PM Peak Hour
Movement Delay (sec/veh) 93.0 32.9 12.8 N/A 191.3 155.8 105.6 112.7 119.7 31.2 52.7 18.2
Movement LOS F C B N/A F F F F F C D B
Approach Delay (sec/veh)
Approach LOS
Average Queue (ft) 373 373 373 N/A 917 918 493 493 493 2 60 15
95th Percentile Queue (ft) 665 665 665 N/A 1190 1191 669 669 669 70 480 305
108.7 F
EBL EBT EBR WBL WBT WBR NBL NBT NBR SBL SBT SBR
Movement Delay (sec/veh) 96.7 36.7 18.2 0.0 344.3 372.2 57.9 77.4 56.0 70.8 0.0 63.0
Movement LOS F D B A F F E E E E A E
Approach Delay (sec/veh)
Approach LOS
Average Queue (ft) 43 43 69 1300 1300 1308 13 13 13 97 97 97
95th Percentile Queue (ft) 294 294 337 1692 1692 1692 88 88 88 440 440 440
209.7 F
EBL EBT EBR WBL WBT WBR NBL NBT NBR SBL SBT SBR
Movement Delay (sec/veh) 20.4 - 18.6 22.3 - 6.1 - 9.4 9.0 20.9 11.6 -
Movement LOS C - C C - A - A A C B -
Approach Delay (sec/veh)
Approach LOS
Average Queue (ft) 1 - 1 8 - 10 - 23 23 3 10 -
95th Percentile Queue (ft) 35 - 35 74 - 80 - 239 243 86 145 -
11.4 B
EBL EBT EBR WBL WBT WBR NBL NBT NBR SBL SBT SBR
Movement Delay (sec/veh) 56.1 46.4 53.7 60.6 57.5 29.8 16.8 9.9 5.4 8.8 9.6 9.4
Movement LOS E D D E E C B A A A A A
Approach Delay (sec/veh)
Approach LOS
Average Queue (ft) 36 36 36 57 57 60 6 22 1 0 15 16
95th Percentile Queue (ft) 222 222 221 474 474 481 187 233 84 33 161 167
16.3 B
EBL EBT EBR WBL WBT WBR NBL NBT NBR SBL SBT SBR
Movement Delay (sec/veh) 37.3 30.5 25.7 16.4 16.7 10.8 16.3 11.7 11.2 34.6 33.5 39.2
Movement LOS D C C B B B B B B C C D
Approach Delay (sec/veh)
Approach LOS
Average Queue (ft) 27 27 28 1 1 1 15 15 15 35 35 36
95th Percentile Queue (ft) 206 206 209 59 59 69 165 165 165 297 297 301
26.2 C
EBL EBT EBR WBL WBT WBR NBL NBT NBR SBL SBT SBR
Movement Delay (sec/veh) 118.3 29.7 11.6 56.3 80.1 53.7 81.7 84.0 40.5 39.7 58.6 19.2
Movement LOS F C B E F D F F D D E B
Approach Delay (sec/veh)
Approach LOS
Average Queue (ft) 4 3 5 39 39 39 183 183 183 165 165 169
95th Percentile Queue (ft) 42 77 95 249 249 249 632 632 632 411 411 418
63.3 EIntersection Delay (sec/veh)
30.0 55.5 73.4 55.5
C E E E
Intersection Delay (sec/veh)
Intersection Delay (sec/veh)
Intersection Delay (sec/veh)
Intersection Delay (sec/veh)
46/V. 12th & Eads
12th Eads
Eastbound Westbound Northbound Southbound
31.6 12.8 12.5 33.9
C B B C
36/S. 12th & Fern
12th Fern
Eastbound Westbound Northbound Southbound
54.3 45.5 10.2 9.6
D D B A
29/Q. 12th & Hayes
12th Hayes
Eastbound Westbound Northbound Southbound
20.3 15.3 9.4 12.9
C C A B
55/O. Joyce
- Joyce
Eastbound Westbound Northbound Southbound
38.0 92.1 60.8 69.6
D F E E
Intersection Delay (sec/veh)
27/M. Army Navy & 12th
12th Army Navy
Eastbound Westbound Northbound Southbound
71.9 29.4 180.5 109.9
E C F F
2 of 2