Embed Size (px)
Citation preview
Argos Web Client for End-users Page 1 of 9 Revised: June 11, 2019
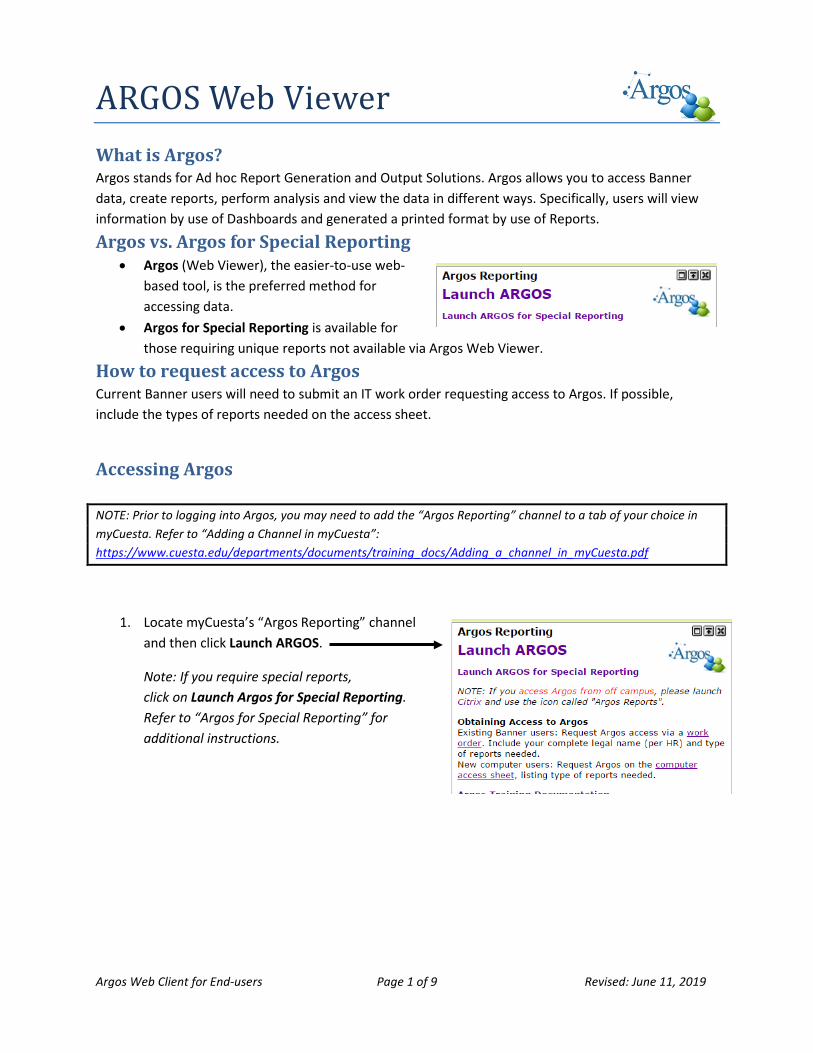
ARGOS Web Viewer What is Argos? Argos stands for Ad hoc Report Generation and Output Solutions. Argos allows you to access Banner data, create reports, perform analysis and view the data in different ways. Specifically, users will view information by use of Dashboards and generated a printed format by use of Reports.
Argos vs. Argos for Special Reporting • Argos (Web Viewer), the easier-to-use web-
based tool, is the preferred method for accessing data.
• Argos for Special Reporting is available for those requiring unique reports not available via Argos Web Viewer.
How to request access to Argos Current Banner users will need to submit an IT work order requesting access to Argos. If possible, include the types of reports needed on the access sheet.
Accessing Argos NOTE: Prior to logging into Argos, you may need to add the “Argos Reporting” channel to a tab of your choice in myCuesta. Refer to “Adding a Channel in myCuesta”: https://www.cuesta.edu/departments/documents/training_docs/Adding_a_channel_in_myCuesta.pdf
1. Locate myCuesta’s “Argos Reporting” channel and then click Launch ARGOS.
Note: If you require special reports, click on Launch Argos for Special Reporting. Refer to “Argos for Special Reporting” for additional instructions.
Argos Web Client for End-users Page 2 of 9 Revised: June 11, 2019
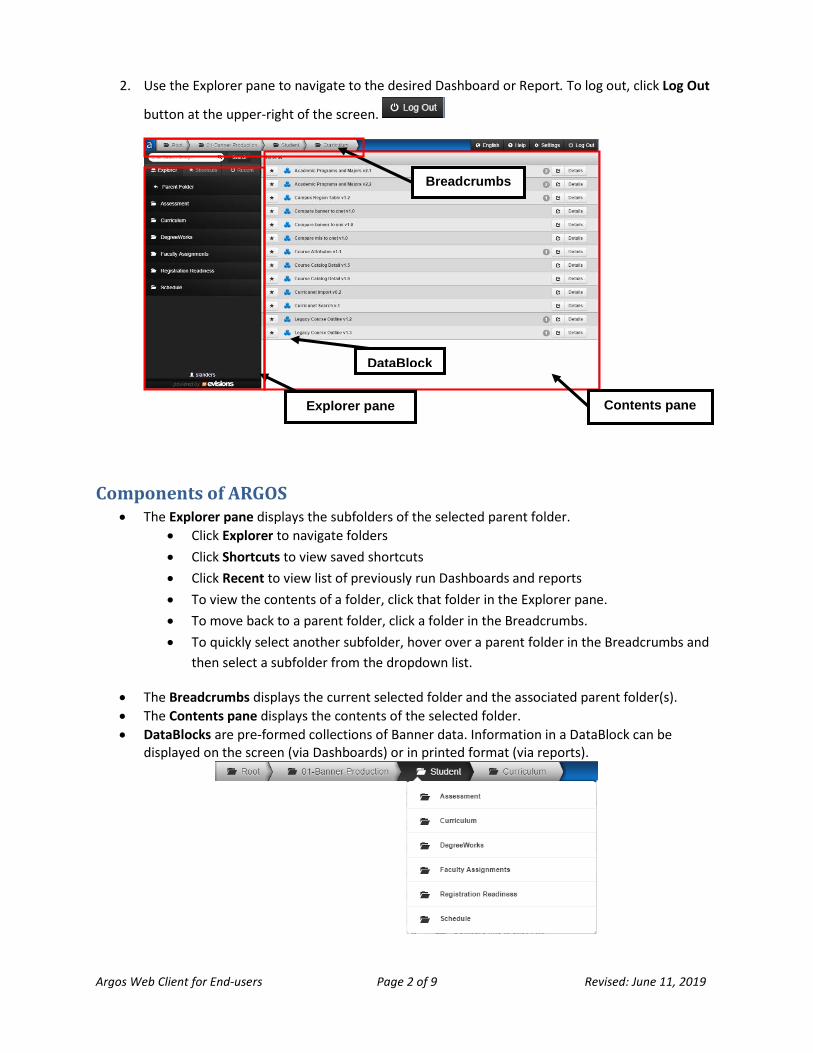
2. Use the Explorer pane to navigate to the desired Dashboard or Report. To log out, click Log Out
button at the upper-right of the screen.
Components of ARGOS • The Explorer pane displays the subfolders of the selected parent folder.
• Click Explorer to navigate folders • Click Shortcuts to view saved shortcuts • Click Recent to view list of previously run Dashboards and reports • To view the contents of a folder, click that folder in the Explorer pane. • To move back to a parent folder, click a folder in the Breadcrumbs. • To quickly select another subfolder, hover over a parent folder in the Breadcrumbs and
then select a subfolder from the dropdown list.
• The Breadcrumbs displays the current selected folder and the associated parent folder(s). • The Contents pane displays the contents of the selected folder. • DataBlocks are pre-formed collections of Banner data. Information in a DataBlock can be
displayed on the screen (via Dashboards) or in printed format (via reports).
Breadcrumbs
Explorer pane Contents pane
DataBlock
Argos Web Client for End-users Page 3 of 9 Revised: June 11, 2019
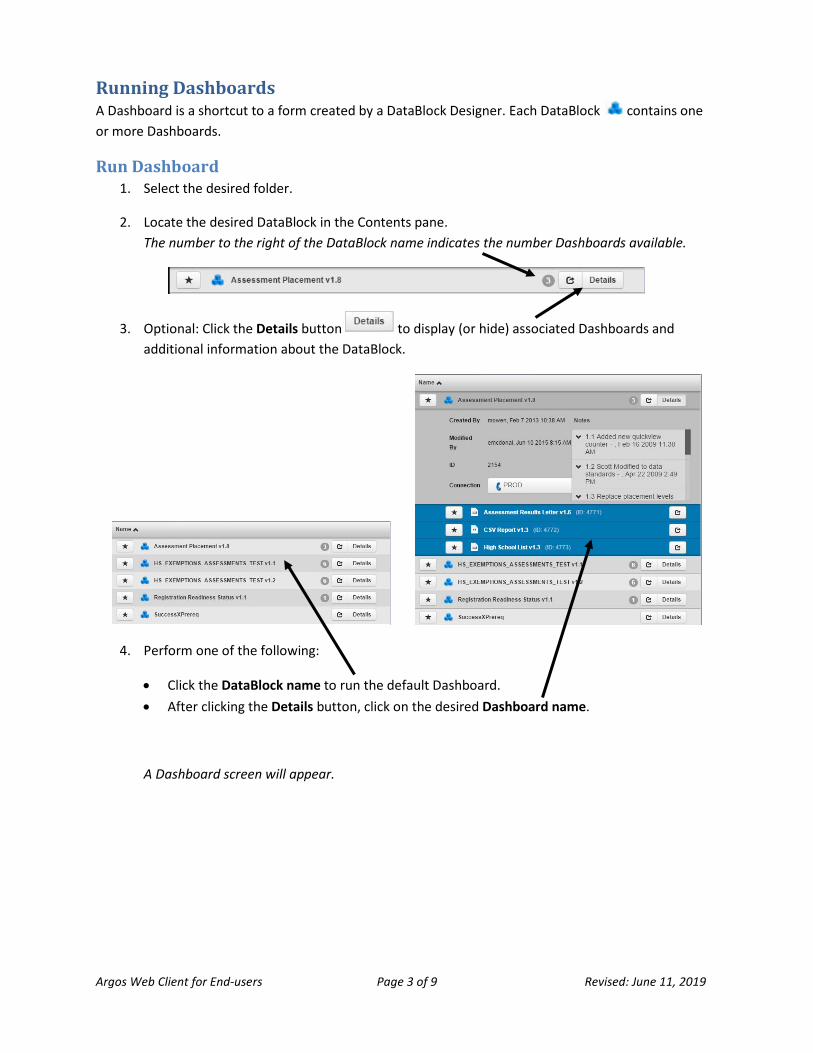
Running Dashboards A Dashboard is a shortcut to a form created by a DataBlock Designer. Each DataBlock contains one or more Dashboards.
Run Dashboard 1. Select the desired folder.
2. Locate the desired DataBlock in the Contents pane. The number to the right of the DataBlock name indicates the number Dashboards available.
3. Optional: Click the Details button to display (or hide) associated Dashboards and additional information about the DataBlock.
4. Perform one of the following:
• Click the DataBlock name to run the default Dashboard. • After clicking the Details button, click on the desired Dashboard name.
A Dashboard screen will appear.
Argos Web Client for End-users Page 4 of 9 Revised: June 11, 2019
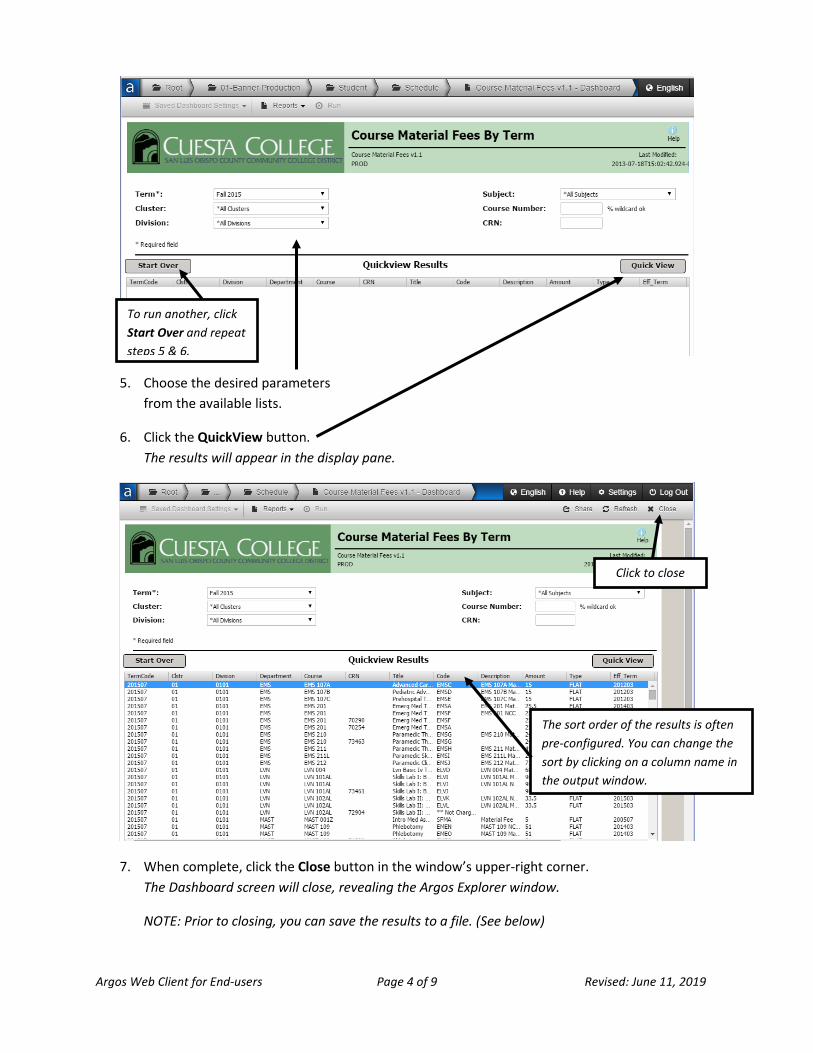
5. Choose the desired parameters from the available lists.
6. Click the QuickView button. The results will appear in the display pane.
7. When complete, click the Close button in the window’s upper-right corner. The Dashboard screen will close, revealing the Argos Explorer window.
NOTE: Prior to closing, you can save the results to a file. (See below)
The sort order of the results is often pre-configured. You can change the sort by clicking on a column name in the output window.
Click to close
To run another, click Start Over and repeat steps 5 & 6.
Argos Web Client for End-users Page 5 of 9 Revised: June 11, 2019
Filter Dashboard Results
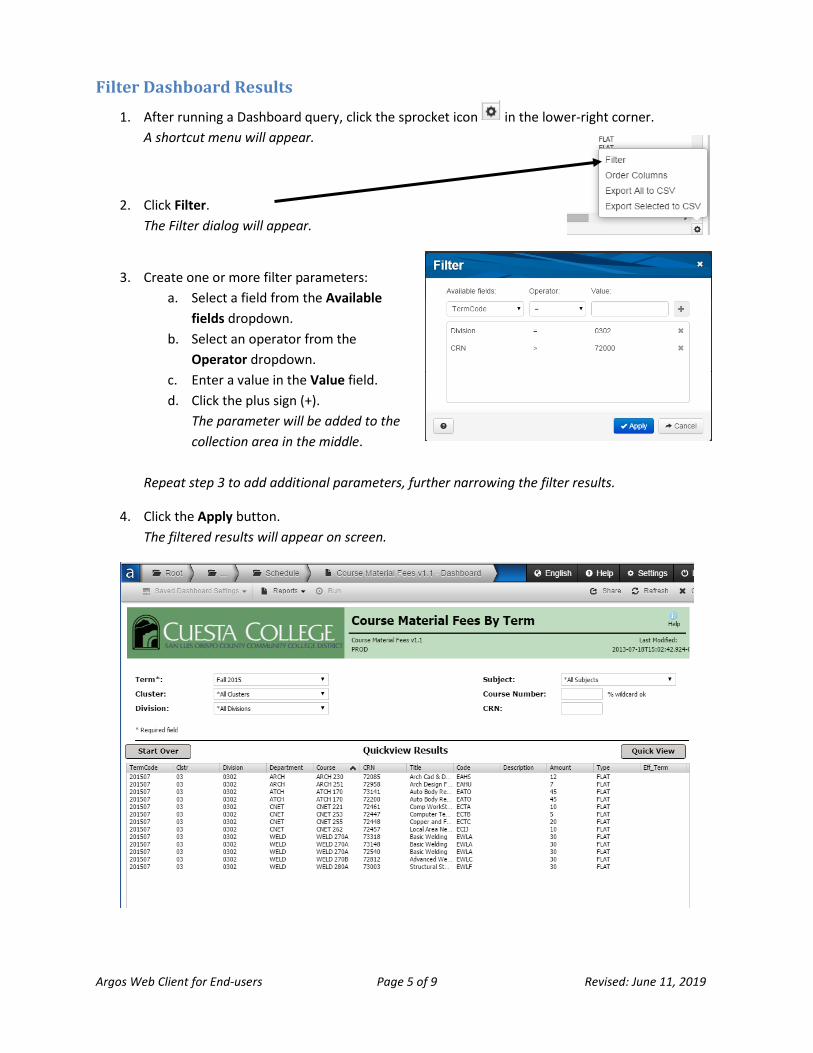
1. After running a Dashboard query, click the sprocket icon in the lower-right corner. A shortcut menu will appear.
2. Click Filter. The Filter dialog will appear.
3. Create one or more filter parameters:
a. Select a field from the Available fields dropdown.
b. Select an operator from the Operator dropdown.
c. Enter a value in the Value field. d. Click the plus sign (+).
The parameter will be added to the collection area in the middle.
Repeat step 3 to add additional parameters, further narrowing the filter results.
4. Click the Apply button. The filtered results will appear on screen.
Argos Web Client for End-users Page 6 of 9 Revised: June 11, 2019
Save Dashboard Results
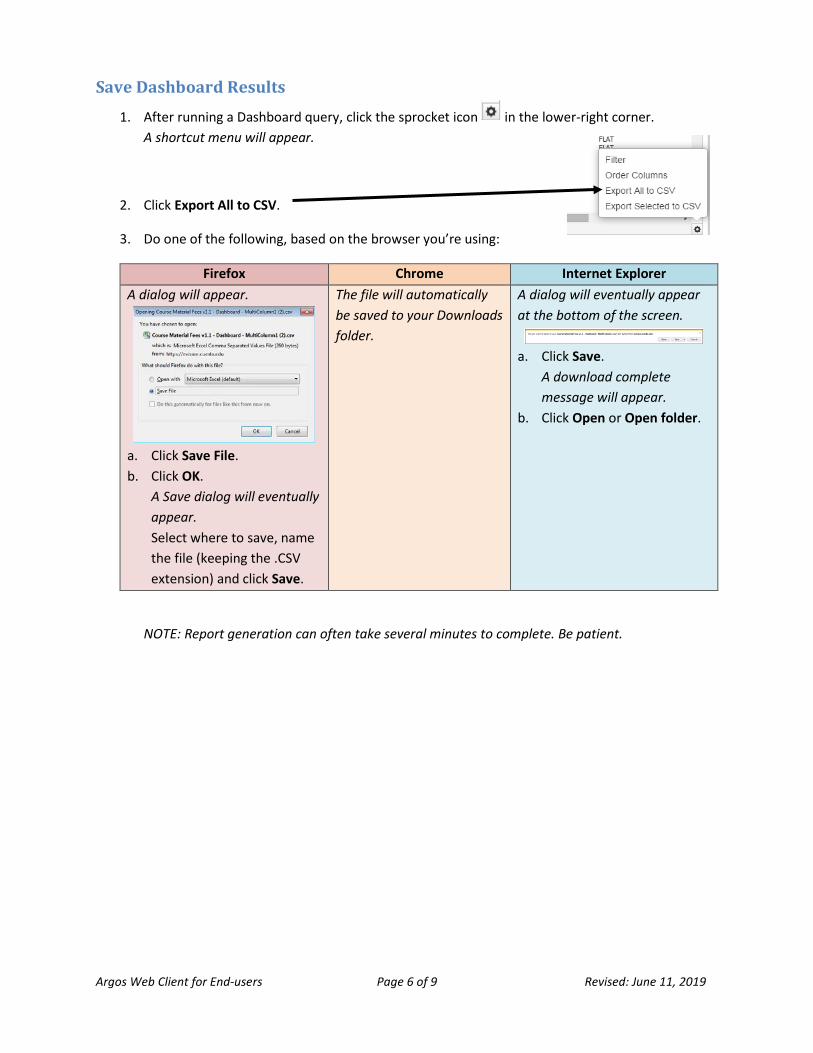
1. After running a Dashboard query, click the sprocket icon in the lower-right corner. A shortcut menu will appear.
2. Click Export All to CSV.
3. Do one of the following, based on the browser you’re using:
Firefox Chrome Internet Explorer A dialog will appear.
a. Click Save File. b. Click OK.
A Save dialog will eventually appear. Select where to save, name the file (keeping the .CSV extension) and click Save.
The file will automatically be saved to your Downloads folder.
A dialog will eventually appear at the bottom of the screen.
a. Click Save.
A download complete message will appear.
b. Click Open or Open folder.
NOTE: Report generation can often take several minutes to complete. Be patient.
Argos Web Client for End-users Page 7 of 9 Revised: June 11, 2019
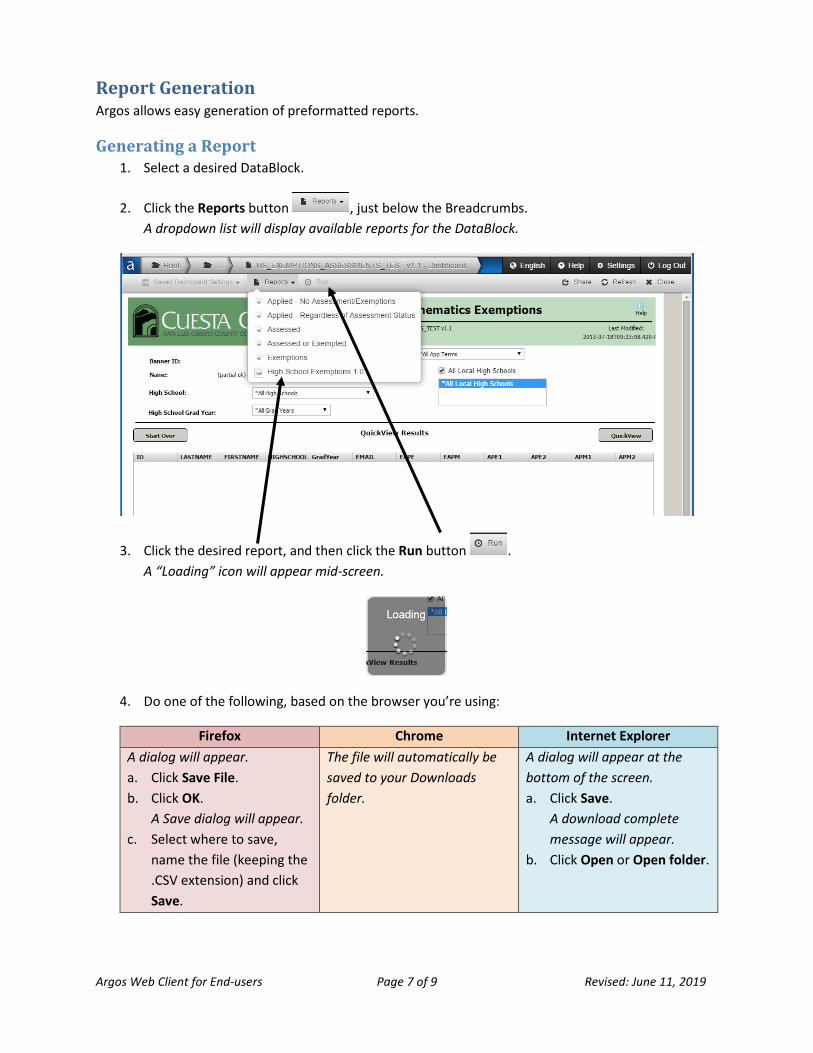
Report Generation Argos allows easy generation of preformatted reports.
Generating a Report 1. Select a desired DataBlock.
2. Click the Reports button , just below the Breadcrumbs. A dropdown list will display available reports for the DataBlock.
3. Click the desired report, and then click the Run button . A “Loading” icon will appear mid-screen.
4. Do one of the following, based on the browser you’re using:
Firefox Chrome Internet Explorer A dialog will appear. a. Click Save File. b. Click OK.
A Save dialog will appear. c. Select where to save,
name the file (keeping the .CSV extension) and click Save.
The file will automatically be saved to your Downloads folder.
A dialog will appear at the bottom of the screen. a. Click Save.
A download complete message will appear.
b. Click Open or Open folder.
Argos Web Client for End-users Page 8 of 9 Revised: June 11, 2019
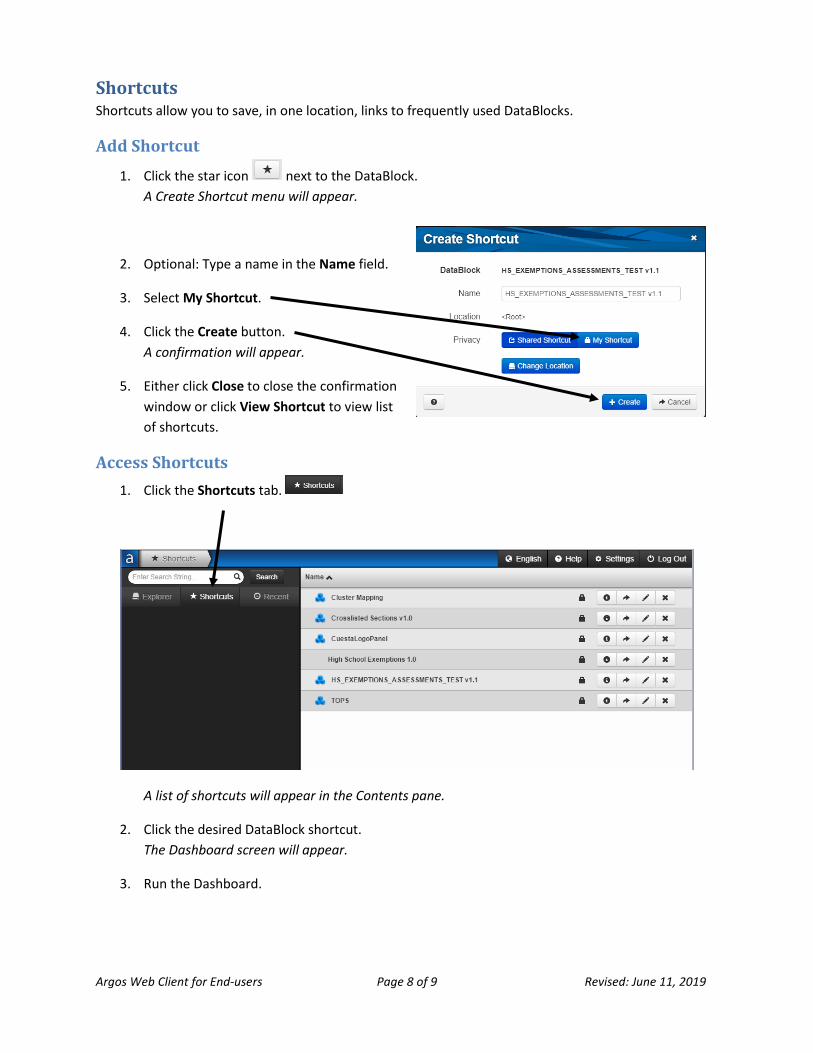
Shortcuts Shortcuts allow you to save, in one location, links to frequently used DataBlocks.
Add Shortcut
1. Click the star icon next to the DataBlock. A Create Shortcut menu will appear.
2. Optional: Type a name in the Name field.
3. Select My Shortcut.
4. Click the Create button. A confirmation will appear.
5. Either click Close to close the confirmation window or click View Shortcut to view list of shortcuts.
Access Shortcuts 1. Click the Shortcuts tab.
A list of shortcuts will appear in the Contents pane.
2. Click the desired DataBlock shortcut. The Dashboard screen will appear.
3. Run the Dashboard.
Argos Web Client for End-users Page 9 of 9 Revised: June 11, 2019
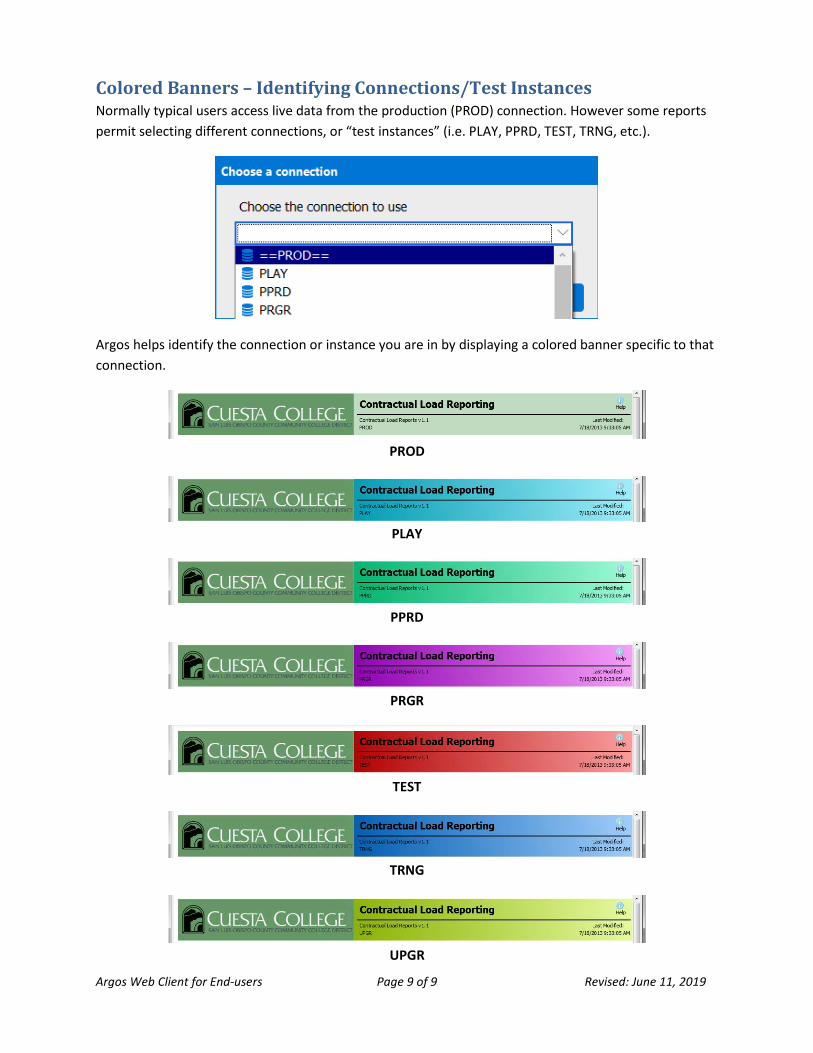
Colored Banners – Identifying Connections/Test Instances Normally typical users access live data from the production (PROD) connection. However some reports permit selecting different connections, or “test instances” (i.e. PLAY, PPRD, TEST, TRNG, etc.).
Argos helps identify the connection or instance you are in by displaying a colored banner specific to that connection.
PROD
PLAY
PPRD
PRGR
TEST
TRNG
UPGR


![[MS-PWVPDP]: PowerPoint Web Viewer Presentation Data Protocol · PowerPoint Web Viewer Presentation Data Protocol presentation](https://img.dokumen.tips/doc/110x75/5ecd14f0381ce046273d8f44/ms-pwvpdp-powerpoint-web-viewer-presentation-data-protocol-powerpoint-web-viewer.jpg)