Embed Size (px)
Citation preview

2011
TRC0901
Investigating the Use of Self-Consolidating Concrete in
Transportation Structures
J. Garrison Smith, Royce W. Floyd, W. Micah Hale
Final Report

1. Report No.
2. Government Accession No. 3. Recipient's Catalog No.
4. Title and Subtitle
Investigating the Use of Self-Consolidating Concrete in Transportation Structures
5. Report Date Aug 2011
6. Performing Organization Code
7. Authors
J. Garrison Smith, Royce W. Floyd, and W. Micah Hale
8. Performing Organization Report No.
AHTD TRC 0901
9. Performing Organization Name and Address 4190 Bell 1 University of Arkansas Fayetteville, AR 72701
10. Work Unit No. (TRAIS)
11. Contract or Grant No.
12. Sponsoring Agency Name and Address Arkansas Highway and Transportation Department P. O. Box 2261 Little Rock, AR 72203
13. Type of Report and Period Covered
Final Report
14. Sponsoring Agency Code
15. Supplementary Notes
Supported by a grant from the Arkansas Highway and Transportation Department
16. Abstract
Self Consolidating Concrete (SCC) is a recent advancement in the concrete industry. SCC is a type of concrete that can be placed without consolidation and is beginning to be widely accepted. SCC is particularly suited for use in concrete members such as box culverts, drilled piers, and precast beams. However, current AHTD Specifications only address slump which cannot be used to specify the workability of SCC. Therefore, requirements such as slump flow test, L-box test, or J-ring test must be added to AHTD’s Specifications to ensure the SCC is indeed self consolidating and is resistant to segregation.
17. Key Words
Self-consolidating concrete
18. Distribution Statement
NO RESTRICTIONS. THIS DOCUMENT IS AVAILABLE FROM THE NATIONAL TECHNICAL INFORMATION SERVICE, SPRINGFIELD, VA. 22161
19. Security Classif. (of this report)
UNCLASSIFIED
20. Security Class. (of this page)
UNCLASSIFIED
21. No. of Pages
22. Price
N/A

TABLE OF CONTENTS Section Page Chapter 1 Introduction..................................................................................................... 1 1.1 Self-Consolidating Concrete ......................................................................................... 2 1.2 Background ................................................................................................................... 2 1.3 Research Objectives ...................................................................................................... 2 Chapter 2 Literature Review ......................................................................................... 3 2.1 Definition ...................................................................................................................... 3 2.2 Constituent Materials .................................................................................................... 3 2.3 Benefits of SCC ............................................................................................................ 5 2.4 Mixture Proportioning Procedures for SCC ................................................................. 5 2.4.1 General Procedures ............................................................................................. 5 2.4.2 The Japanese Method ......................................................................................... 6 2.4.3 European Practices ............................................................................................. 7 2.4.4 The Sedran et al. Method ................................................................................... 7 2.4.5 Method Proposed by Gomes, Gettu, et al ........................................................... 9 2.4.6 Method Proposed by Vengala et al ................................................................... 10 2.5 Fresh Concrete Properties and Tests Performed on SCC ........................................... 12 2.5.1 Introduction ...................................................................................................... 12 2.5.2 Slump Flow Test .............................................................................................. 12 2.5.3 T-20 (T-50) Test ............................................................................................... 13 2.5.4 VSI Test ............................................................................................................ 15 2.5.5 J-Ring Test ....................................................................................................... 15 2.5.6 L-Box Test ........................................................................................................ 17 2.5.7 Surface Settlement Test .................................................................................... 18 2.5.8 Conclusion ........................................................................................................ 20 2.6 Hardened Concrete Properties and Tests Performed on SCC ..................................... 22 2.6.1 Compressive Strength ....................................................................................... 22 2.6.2 Tensile Strength ................................................................................................ 24 2.6.3 Bond Strength ................................................................................................... 26 2.6.4 Modulus of Elasticity ....................................................................................... 29 2.6.5 Shrinkage .......................................................................................................... 31 2.6.5.1 Introduction ...................................................................................... 31 2.6.5.2 Autogenous Shrinkage ..................................................................... 32 2.6.5.3 Drying Shrinkage ............................................................................. 34 2.6.5.4 Plastic Shrinkage .............................................................................. 36 2.6.6 Creep ................................................................................................................ 38 2.7 SCC Applications ....................................................................................................... 40 2.7.1 Deep Foundations ............................................................................................. 40 2.7.2 Prestressed Bridge Girders ............................................................................... 41 2.7.3 Basement and Foundation Walls ...................................................................... 43 2.8 Conclusion .................................................................................................................. 45 Chapter 3 Experimental Procedures ........................................................................... 47 3.1 Introduction ................................................................................................................. 47

3.2 Materials ..................................................................................................................... 48 3.2.1 Materials ........................................................................................................... 48
3.2.2 Chemical Admixtures ....................................................................................... 51 3.3 Testing Procedures ...................................................................................................... 53 3.4 Tests Performed on SCC ............................................................................................. 55 3.4.1 Slump Flow ...................................................................................................... 56 3.4.1.1 Slump Flow Procedure ..................................................................... 57 3.4.2 T-20 (T-50) ....................................................................................................... 61 3.4.3 VSI .................................................................................................................... 62 3.4.4 J-Ring ............................................................................................................... 65 3.4.5 Supplementary Cementing Materials ............................................................... 67 3.5 Curing ........................................................................................................................ 68 Chapter 4 Developing SCC Specifications .................................................................... 76 4.1 Experimental Program ................................................................................................ 76 4.2 Mixture Proportions .................................................................................................... 76 4.3 Procedure .................................................................................................................... 78 4.3.1 Wall Selection and Construction ...................................................................... 78 4.3.2 Mixing and Pouring .......................................................................................... 78 4.3.3 Testing .............................................................................................................. 79 4.4 Results ......................................................................................................................... 81 4.4.1 Slump Flow ...................................................................................................... 81 4.4.2 T-20 Time ......................................................................................................... 85 4.4.3 VSI .................................................................................................................... 86 4.4.4 J-Ring ............................................................................................................... 86 4.4.5 Compressive Strength ....................................................................................... 87 4.4.6 Aggregate Distribution ..................................................................................... 88 4.5 Conclusions ................................................................................................................. 92 Chapter 5 Results and Discussions ................................................................................ 93 5.1 Introduction ................................................................................................................. 93 5.2 Selection/Determination of Constituent Materials...................................................... 93 5.3 Developing SCC Using Type I Portland Cement ....................................................... 94
5.3.1 Phase 1 – Binder Content ................................................................................. 94 5.3.2 Phase 2 – Increasing Binder Content to 811 lb/yd3 .......................................... 99 5.3.2.1 S/Agg ............................................................................................. 101 5.3.2.2 Flowability ..................................................................................... 104 5.3.3 Phase 3 – Reducing Binder Content to 761 lb/yd3 ......................................... 109 5.3.4 Phase 4 – Further Reducing Binder Content to 750 lb/yd3 ............................. 116 5.3.5 Phase 5 – Increasing Binder Content to 775 lb/yd3 & S/Agg = 0.52.............. 122 5.3.6 Phase 6 – Reducing S/Agg to 0.50 ................................................................. 129 5.3.7 Phase 7 – Further Reducing S/Agg to 0.48 ..................................................... 136
5.4 Developing SCC Using Type I Portland Cement and Class C Fly Ash ................... 142 5.4.1 Phase 8 – FA Replacement Rates of 5, 10, and 15% ..................................... 142 5.4.2 Phase 9 – FA Replacement Rates of 20 and 25% .......................................... 151 5.5 Methodology for Developing SCC Mixtures ............................................................ 157 5.5.1 Binder Content ............................................................................................... 158 5.5.1.1 Binder Content and Flowability ..................................................... 158

5.5.1.2 Binder Content and Stability .......................................................... 160 5.5.1.3 High Binder Content and Stability ................................................. 162 5.5.1.4 Conclusion ..................................................................................... 164 5.5.2 HRWRS .......................................................................................................... 165 5.5.3 S/Agg .............................................................................................................. 167 5.5.4 Steps to Develop SCC .................................................................................... 169 Chapter 6 Casting Box Culverts ................................................................................. 173 6.1 Introduction ............................................................................................................... 173 6.2 Reinforced Box Culvert Design ................................................................................ 174 6.3 Assembly................................................................................................................... 176
6.3.1 Erection ........................................................................................................... 177 6.3.1.1 Inner Wall ...................................................................................... 177 6.3.1.2 Rebar, Spacing, PVC Pipe ............................................................. 178 6.3.1.3 Outer Wall ...................................................................................... 180
6.4 Trial Batching ........................................................................................................... 182 6.4.1 SCC Mixture #1 .............................................................................................. 182 6.4.1.1 Trial Batch #1a ............................................................................... 182 6.4.1.2 Trial Batch #1b .............................................................................. 185 6.4.1.3 Conclusion ..................................................................................... 186 6.4.2 SCC Mixture #2 .............................................................................................. 187 6.5 Casting Procedure ..................................................................................................... 190 6.5.1 Box Culvert #1a .............................................................................................. 190 6.5.2 Box Culvert #1b ............................................................................................. 192 6.5.3 Box Culvert #2 ............................................................................................... 198 6.6 Conclusions ............................................................................................................... 205 Chapter 7 Conclusions and Recommendations ......................................................... 206 7.1 Conclusions ............................................................................................................... 206 7.2 Recommendations ..................................................................................................... 209 References ...................................................................................................................... 212 Appendix A – Mixture Design Analysis for Mixture #1 ............................................ 219 Appendix B – Mixture Design Analysis for Mixture #41 .......................................... 221

LIST OF TABLES Section Page Table 2.1 VSI Values, Descriptions, and Criteria ............................................................. 19 Table 2.2 Workability Characteristics, Test Methods, and Recommended Values.......... 25 Table 3.1 Minimum Binder Content and Slump Range for Structural Concrete .............. 51 Table 3.2 Aggregates, Tests, and Standards ..................................................................... 53 Table 3.3 Fine Aggregate Gradation ................................................................................. 54 Table 3.4 Fine Aggregate Physical Properties .................................................................. 54 Table 3.5 Coarse Aggregate Gradation ............................................................................. 54 Table 3.6 Coarse Aggregate Physical Properties .............................................................. 55 Table 4.1 SCC Mix Proportions........................................................................................ 76 Table 4.2 Summary of Concrete Properties ...................................................................... 82 Table 4.3 Comparison of Slump Flow Tests .................................................................... 84 Table 4.4 Aggregate Distribution and Core Strength ....................................................... 90 Table 5.1 Phase 1 Mix Designs and Slump Flow Data..................................................... 97 Table 5.2 Phase 2 Mix Designs and Test Results ........................................................... 107 Table 5.3 Phase 3 Mix Designs and Test Results ........................................................... 114 Table 5.4 Phase 4 Mix Designs and Test Results ........................................................... 120 Table 5.5 Phase 5 Mix Designs and Test Results ........................................................... 127 Table 5.6 Phase 6 Mix Designs and Test Results .......................................................... 134 Table 5.7 Phase 7 Mix Designs and Test Results ........................................................... 140 Table 5.8 Phase 8 Mix Designs and Test Results ........................................................... 149 Table 5.9 Phase 9 Mix Designs and Test Results ........................................................... 155 Table 5.10 Effect of Increasing Binder Content on Slump Flow ................................... 157 Table 5.11 Effect of Increasing Binder Content on Concrete Density ........................... 160 Table 5.12 Effect of an Increase in FA Replacement on Concrete Density ................... 162 Table 5.13 Effect of HRWR Type and Dosage on Rheological Properties .................... 164 Table 5.14 Effect of Increasing S/Agg on Slump Flow and T-20 .................................. 167 Table 6.1 Mixture Designs Used in Culvert Casting ...................................................... 172 Table 6.2 Trial Batch #1a and Trial Batch #1b Details .................................................. 186 Table 6.3 SCC Mixture #2 Details .................................................................................. 188 Table 6.4 Box Culvert #1a Details .................................................................................. 190 Table 6.5 Box Culvert #1b Details ................................................................................. 197 Table 6.6 Box Culvert #2 Details ................................................................................... 203 Table 7.1 Proposed Addition to Table 802-1 .................................................................. 209

LIST OF FIGURES Section Page Figure 2.1 Comparison of Relative Volumes ..................................................................... 8 Figure 2.2 Marsh Cone Test.............................................................................................. 12 Figure 2.3 Mini-Slump Test Apparatus ............................................................................ 13 Figure 2.4 View of Slump Flow Spread ........................................................................... 17 Figure 2.5 Approximate Concrete Spread Diameter ........................................................ 18 Figure 2.6 View of J-Ring Flow Spread ........................................................................... 21 Figure 2.7 Schematic of L-Box Test ................................................................................. 22 Figure 2.8 Details of Surface Settlement Test .................................................................. 23 Figure 2.9 Compressive Strength at 1 and 28 days ........................................................... 28 Figure 2.10 Tensile Strength at 1 and 28 days .................................................................. 29 Figure 2.11 Bond Strength Development in SCC ............................................................. 32 Figure 2.12 Drying Shrinkage of SCC and Conventional Mixtures ................................. 39 Figure 2.13 Plastic Shrinkage of SCC and Conventional Mixtures ................................. 41 Figure 2.14 Specific Creep of SCC and Conventional Concrete ...................................... 43 Figure 3.1 Rotating Drum Mixer ...................................................................................... 57 Figure 3.2 Stirring Process ................................................................................................ 60 Figure 3.3 Slump Flow Board ........................................................................................... 62 Figure 3.4 Dampening the Slump Flow Board ................................................................. 62 Figure 3.5 Wetting the Slump Cone ................................................................................. 63 Figure 3.6 Filling the Slump Cone .................................................................................... 64 Figure 3.7 Lifting the Slump Cone ................................................................................... 64 Figure 3.8 Measuring the Slump Flow Spread ................................................................. 65 Figure 3.9 Mixture with VSI = 0 ...................................................................................... 66 Figure 3.10 Mixture with VSI = 1 .................................................................................... 67 Figure 3.11 Mixture with VSI = 2 .................................................................................... 68 Figure 3.12 Mixture with VSI = 3 .................................................................................... 68 Figure 3.13 J-Ring Setup .................................................................................................. 69 Figure 3.14 Measuring SCC Height Difference ............................................................... 70 Figure 3.15 Measuring the J-Ring Flow Spread ............................................................... 70 Figure 3.16 SCC Cylinders Tested in Compression ......................................................... 71 Figure 3.17 DAQ and Apparatus use for MOE ............................................................... 72 Figure 3.18 Labeled Cylinders Curing in Lime Saturated Water ..................................... 73 Figure 4.1 Wall 7 Showing Good Slump Flow................................................................. 82 Figure 4.2 Wall 16 Showing Poor Slump Flow ................................................................ 83 Figure 4.3 Wall 12 Showing Good T-20 ......................................................................... 85 Figure 4.4 Variation of One Day Strength with Slump Flow ........................................... 87 Figure 4.5 Variation of Compressive Strength with T-20 ................................................ 87 Figure 4.6 Core Locations for Wall 5 ............................................................................... 89 Figure 5.1 Slump Flow of the First Mixture ..................................................................... 94 Figure 5.2 Slump Flow of Mixture #6 .............................................................................. 99 Figure 5.3 Slump Flow of Mixture # .............................................................................. 100 Figure 5.4 Compressive Strength Cylinders for Mixture #12 at 28 Days ...................... 105

Figure 5.5 Slump Flow of Mixture #15 .......................................................................... 109 Figure 5.6 J-Ring Flow Spread of Mixture #20 .............................................................. 112 Figure 5.7 J-Ring Flow Spread of Mixture #25 .............................................................. 117 Figure 5.8 28-Day Compressive Strength Testing on Cylinder Cast from Mix #29 ...... 123 Figure 5.9 Slump Flow of Mixture #31 .......................................................................... 125 Figure 5.10 Compressive Strength Cylinders for Mixture #34 at 28 Days .................... 130 Figure 5.11 Evidence of Segregation in Mixture #36 ..................................................... 132 Figure 5.12 J-Ring Flow Spread of Mixture #38 ............................................................ 137 Figure 5.13 Slump Flow of Mixture #39 ........................................................................ 138 Figure 5.14 Shear-Type Compression Failure ................................................................ 143 Figure 5.15 Instability Observed in Mixture #44............................................................ 145 Figure 5.16 Slump Flow of Mixture #49 ........................................................................ 151 Figure 5.17 Slump Flow of the Final Mixture ................................................................ 154 Figure 6.1 Culvert Cross-Section Including Rebar Placement ....................................... 174 Figure 6.2 Steel-ply Formwork and Rebar ..................................................................... 175 Figure 6.3 Steel Key Locking System ............................................................................ 176 Figure 6.4 Inner Wall of the First Culvert ...................................................................... 177 Figure 6.5 Rebar Cages and the Corresponding Rebar Matrix ....................................... 178 Figure 6.6 Completed Inner Structure of the First Box Culvert ..................................... 179 Figure 6.7 Reinforced Box Culverts Near Completion .................................................. 180 Figure 6.8 Sample of Trial Batch #1a Before HRWR was Added ................................. 182 Figure 6.9 Conducting Slump Test on Sample of Trial Batch #1a ................................. 182 Figure 6.10 Adding HRWR to Trial Batch #1a .............................................................. 183 Figure 6.11 Segregation Observed in Trial Batch #1a .................................................... 183 Figure 6.12 View of Slump Flow Spread for Trial Batch #1a ........................................ 184 Figure 6.13 Evidence of the Declining Effectiveness of HRWR ................................... 190 Figure 6.14 Formwork Failure in Box Culvert #1 .......................................................... 192 Figure 6.15 Critical Location Where Failure Occurred in Box Culvert #1 .................... 193 Figure 6.16 Smooth Finish of Box Culvert #1 ................................................................ 194 Figure 6.17 Smooth Finish on Interior and Exterior Corners of Box Culvert #1 ........... 194 Figure 6.18 Localized Surface Blemishes Present on Box Culvert #1 ........................... 195 Figure 6.19 Comparison between Predicted and Measured E for Box Culvert #1b ....... 196 Figure 6.20 External Lateral Reinforcement Provided For Box Culvert #2 ................... 198 Figure 6.21 Ready-Mix Truck Casting Box Culvert #2 ................................................. 200 Figure 6.22 Top Surface of Box Culvert #2 after Finishing ........................................... 200 Figure 6.23 Bleed Water Observed in Mixture Used for Casting Box Culvert #2 ......... 201 Figure 6.24 Completed Box Culvert #2 after Removal of Formwork ............................ 202 Figure 6.25 Comparison Between Predicted and Measured E for Box Culvert #2 ........ 203

6
CHAPTER 1
INTRODUCTION
1.1 SELF-CONSOLIDATING CONCRETE
Proper concrete consolidation is essential in obtaining the desired fresh and
hardened properties from any given concrete mixture. In conventional-slump concrete,
appropriate consolidation is achieved through the mechanism of vibration. The ability to
sufficiently vibrate concrete is a unique skill. Insufficient vibration increases the
likelihood of bug holes or honeycombed areas; whereas excessive vibration can lead to
bleeding and segregation. 1 In the early 1980’s, the construction industry of Japan began
to suffer due to the decreasing amount of skilled concrete laborers. Consequently, the
structural integrity of Japan’s concrete structures declined as well.2 Self-consolidating
concrete (SCC) was developed in Japan in the late 1980’s as the result of a drive toward a
better and more uniform quality of concrete. Its initial purpose was to solve the poor
performance issues of concrete structures that existed at the time due to a lack of uniform
and complete consolidation. 3 Now the popularity of SCC is expanding globally; it is
revered as one of the most influential advancements in concrete technology in the past
decade.4

7
1.2 BACKGROUND
Ongoing research has and will continue to be performed on SCC because of its
various benefits. In the U.S., SCC has been used in many precast concrete structures
including basement and foundation walls, box culverts, bridge girders, and drilled shafts.
The current status of SCC is denoted as a specialty concrete, but researchers and workers
in industry alike are hopeful that in the near future SCC will become a standard concrete
that is routinely used for many different applications. The Arkansas State Highway and
Transportation Department (AHTD) Standard Specifications for Highway Construction5
do not address SCC. The primary goal of this research program was to develop fresh
concrete guidelines for SCC.
1.3 RESEARCH OBJECTIVES
The principal goal of this project was to investigate if the binder content (611
lb/yd3, 362.61 kg/m3) was suitable for SCC and determine an acceptable range of fresh
concrete properties for SCC. The variables examined cover cement content, water
content, sand to total aggregate ratio (S/Agg), chemical admixtures, and supplementary
cementitious materials (SCM).

8
CHAPTER 2
LITERATURE REVIEW
2.1 DEFINITION
SCC is proportioned to exhibit a moderate viscosity and a low yield stress value.
When achieved, these parameters ensure high deformability and filling capacity of
formwork while minimizing the risk of flow blockage or segregation.6, 7 SCC is defined
by ACI Committee 2378 as “highly flowable, nonsegregating concrete that can spread
into place, fill the formwork, and encapsulate the reinforcement without any mechanical
consolidation.”
2.2 CONSTITUENT MATERIALS
SCC is composed of the same constituent materials as conventional-slump
concrete; however, it is the different quantities of these materials that distinguish the
properties of SCC. The mixture proportioning of SCC is multifaceted and involves
adjusting several variables to obtain balance among the workability requirements that
affect the successful casting of SCC.9 When compared with conventional-slump concrete
mixtures, it has been reported that SCC mixtures contain a lower coarse aggregate
content, 10 smaller coarse aggregate, 11 similar water content, higher fine aggregate
content, and higher cementitious materials (CM) content.12 It is also necessary for SCC
mixtures to include chemical admixtures such as high-range water reducing (HRWR)

9
admixtures and/or viscosity modifying admixtures (VMA).13 All the aforementioned
trends are unique because the combination of these modified parameters results in a
highly flowable yet stable concrete mixture. Figure 2.1 compares the constituent material
quantities in SCC to conventional-slump concrete schematically.
Air Air
Water Water
Cement + Filler Cement
Fine Aggregate
Fine Aggregate
Coarse Aggregate Coarse Aggregate
SCC Conventional-Slump Concrete
Figure 2.1: Comparison of Relative Volumes of Constituent Materials in Self-Consolidating Concrete and Conventional-Slump Concrete12

10
2.3 BENEFITS OF SCC
When compared with conventional-slump concrete mixtures, SCC can be a
beneficial alternative for many reasons. Some advantages of SCC consist of, but are not
limited to, the following: SCC can be used in narrow members where there is a high
probability of congestion; the use of SCC can reduce construction costs by requiring
fewer laborers;14 implementing SCC can decrease construction time; SCC does not
require vibration; SCC reduces noise pollution; SCC improves the interfacial transition
zone (ITZ) between the cement paste and aggregate or reinforcement; SCC improves the
durability and decreases the permeability of concrete; and SCC aids in constructability
and promotes better structural performance.3
2.4 MIXTURE PROPORTIONING PROCEDURES FOR SCC
2.4.1 General Procedures
Several mixture proportioning guidelines or procedures based on experimental
practices or scientific hypotheses have been developed for SCC. Generally these
procedures can be categorized by either one of the following three methods. The first
method requires the concrete to be fractioned into two components consisting of only
coarse aggregate and mortar. The term “mortar” is defined as a mixture consisting of
cement paste, filler, and fine aggregate. By incorporating chemical admixtures such as
HRWR and VMA to the mixture, the flowability of the mortar is then altered to obtain
SCC. The second method consists of optimizing the particle size distribution of the
binder. This is achieved by increasing the amount of SCM such as fly ash (FA) or silica

11
fume (SF) in the SCC mixture. 15 The third method is simply a combination of methods
one and two. In addition to the general procedures that are previously mentioned, more
specific methods are also available and discussed in detail in the following sections.
2.4.2 The Japanese Method
The ‘Japanese method’ was proposed by Okamura, et al.16, 17 and is based upon
research performed by Ozawa, Okamura, and Maekawa at the University of Tokyo. This
method was further enhanced by Ouchi et al. The first step is to choose the air content; if
no air-entrainment is specified then it is acceptable to assume an air content of about 2%.
The coarse aggregate content in the concrete is then set at 50 to 60% of the volume of the
concrete based on its bulk density. The fine aggregate content is also fixed at 40 to 50%
of the mortar volume of the concrete. The type of filler and its ratio to cement are
subsequently determined based on the designer’s experience. In order to establish the
apposite value of powder ratio, tests are performed on mortar for different water-powder
ratios (generally 1.1, 1.2, 1.3, and 1.4) with a flow cone. The term “powder” is defined as
particles that are smaller than 3.5x10⁻³ in. (90 micrometers (0.09 mm)). HRWR is then
added to the mortar at different dosage rates to attain adequate flowability. Once the
water-powder ratio and HRWR dosage have been selected, coarse aggregate is added to
the mortar and trial batching commences.12

12
2.4.3 European Practices
In European practices18 mixture proportioning begins by selecting a water-powder
ratio by solid volume that is between 0.80 and 1.10. In this case the term “powder” is
characterized by particles that are smaller than 4.9x10⁻³ in. (125 micrometers (0.125
mm)). The total powder content by solid volume is then taken to be between 674 to 1,011
lb/yd3 (400 to 600 kg/m3) of concrete. The coarse aggregate content is fixed to be
between 28 to 35% by volume of the mixture. Next, the water-cementitious material ratio
(w/cm) is chosen based on strength and durability constraints. For this method the sand
content is a dependent variable; it balances the volume of the other constituent materials
that have already been determined to account for a total volume of 27 ft3 (0.76 m3). VMA
may be used to ensure the mixture’s stability. 19 If one elects to design a SCC mixture by
this method it is imperative that the relative ratios of essential components are based upon
absolute volume20 instead of by mass. It is good practice to allow for longer mixing times
when batching SCC as opposed to conventional-slump concrete mixtures to ensure the
powder is dispersed homogeneously.12
2.4.4 The Sedran et al. [LCPC, Paris] Method
The ‘Sedran et al. [LCPC, Paris] method’ was proposed by Sedran et al. It is a
method of mixture proportioning of SCC which utilizes two developments implemented
at the Laboratoire Central des Ponts Chaussées (LCPC), Paris.21, 22 The two developments
are a rheometer, (BTRHEOM), which distinguishes the rheological characteristics of
fresh concrete. The second is a software program, [RENE-LCPC], which optimizes the

13
aggregate-binder granular skeleton.12 For this method the binder quantity (cement + filler)
is initially chosen based on the designer’s experience. The HRWR dosage is determined
from its saturation point using the Marsh cone test. To execute the test, 0.26 gallons (1
liter) of cement paste is placed into the cone and the time required for half of the paste to
flow out of the cone is recorded. The plot of T versus percent of HRWR (Sp/c) in the
cement paste yields the saturation point. The saturation point is the optimal amount of
HRWR where any additional amount does not increase the fluidity required for all
material to flow out of the cone. The Marsh cone test provides the optimum dosage of
HRWR. A Marsh cone and the corresponding data are shown in Figure 2.2.
Figure 2.2: Marsh Cone Test – Determination of HRWR Dosage12 *NOTE: 1 in. = 2.54 cm = 25.4 mm
The water requirement is subsequently established by utilizing the REN-LCPC software.
Afterward, the mixture proportions are computed. The strength of the mixture is
estimated by a theoretical formula given (developed by the authors). If the required
strength is not attained or is surpassed, another trial blend of binders is selected and the

14
mixture design process is rerun by the software. In addition to the software, trial batching
can be conducted to verify the strength acquired.12
2.4.5 Method Proposed by Gomes, Gettu, et al.
Gomes, Gettu, et al. proposed a multi-phase optimized method for developing
SCC.23 The first phase in the process establishes the HRWR dosage based on cement
content; this is determined by performing the Marsh cone test as prescribed in Section
2.4.4. In the second phase, the optimum filler dosage is determined by using a mini-
slump test (Figure 2.3).
Figure 2.3: Mini-Slump Test Apparatus12
The time required for the pastes which are at the saturation point to reach a diameter of
4.53 in. (115 mm) is measured (T115). The recommended spreads range from 6.69 to 7.48
in. (170 to 190 mm) with T115 values of 2 to 3.5 seconds. In the third stage, an aggregate

15
gradation is developed that possesses the least voids. The procedure for this phase is
based on ASTM C 29/C 29M24 standard for determining the dry density of diverse
aggregate mixtures without applying compaction. The fourth stage of the process is to
select the paste content by volume. Tests are conducted on differing paste volumes
(typically ranging from 35 to 45% of the total volume). In order to determine the fresh
and hardened concrete properties that are necessary, this method mandates that the
volume of paste must be the least amount necessary to facilitate fluidity and cohesion,
without forfeiting the durability, resistance to shrinkage, and concrete strength. In the
fifth and final phase, the original w/cm that was assumed is modified if the required
strength is not attained during preliminary castings.12
2.4.6 Method Proposed by Vengala et al.
Jagadish Vengala et al. proposed a method for obtaining SCC that is similar to the
mixture proportioning of conventional-slump concrete.25 According to the authors, any of
the recognized methods such as ACI20 can be applied. For the required compressive
strength (f’c), the w/cm is established for the given cement content by utilizing ACI 31826
or other analogous recommended guidelines. The desired workability is fixed between a
slump of 2.95 to 3.94 in. (75 to 100 mm). The water content for this workability range is
attained based upon available published guidelines and the attributes of the aggregates.
No HRWR is present in the mixture at this time. Based on aggregate properties such as
bulk density, fineness modulus, specific gravity, and other essential characteristics, the
mixture proportion is established as indicated by the aforementioned method of choice.

16
The saturation point of HRWR is determined by a Marsh cone test as previously detailed
in Section 2.4.4; this dosage is then added to the mixture. A trial batch is prepared, and if
any bleed water is present then a small portion of the coarse aggregate (approximately
8.43 to 16.86 lb/yd3 (5 to 10 kg/m3)) is substituted by fine aggregate. If no visual
evidence of bleeding is observed, then the mixture is deemed adequate. The process of
replacing a small portion of coarse aggregate with fine aggregate, in increasing
percentages is continued progressively until no bleed water is observed in the preliminary
castings. This step, while possibly tedious, is crucial in guaranteeing that no excess water
is present within the mixture that could lead to segregation. A portion of the coarse
aggregate is subsequently replaced with a chosen filler material (such as FA) gradually in
increasing quantities (such as 8.43 lb, 16.86 lb, 25.28 lb/yd3(5 kg, 10 kg, 15 kg/m3) of
concrete). At this step of design, the concrete is evaluated as SCC. This partial
replacement of coarse aggregate with the filler material ends when an acceptable SCC
mixture is developed. The previous step may be omitted if the original fine aggregate
content is regarded as satisfactory and does not need to be supplemented. Compressive
strength data are gathered from all the preliminary castings to confirm if the assumed
w/cm is adequate. If the assumed w/cm is found to be inadequate then this ratio can be
increased or decreased as needed, and the final preliminary castings are completed at this
time.12

17
2.5 FRESH CONCRETE PROPERTIES AND TESTS PERFORMED ON SCC
2.5.1 Introduction
High deformability, high passing ability or restricted deformability, and high
resistance to segregation are the three fundamental criteria that are required to achieve
self-consolidation.27, 28 These parameters are accurately and effectively measured by
performing fresh concrete tests. The tests include, but are not limited to: the slump flow
test (ASTM C 1611/C 1611M) 29, the T-20 (T-50) test (ASTM C 1611/C 1611M) 29, the
visual stability index (VSI) test (ASTM C 1611/C 1611M) 29, the J-Ring test (ASTM C
1621/C 1621M) 30, the L-Box test, and the surface settlement test. It has been reported
that these fresh tests should be conducted as soon as mixing is finished. The time allotted
to complete all tests is approximately 20 minutes. 31 These tests have been approved and
utilized in practice by researchers and workers in industry alike.
2.5.2 Slump Flow Test
The slump flow test measures the filling ability of the concrete. This test can
either be performed with the slump cone in the traditional orientation or inverted as per
ASTM C 1611/C 1611M29. Slump flow is measured as the arithmetic mean of two
perpendicular diameters at the base of the concrete.32 It is desirable for the concrete
spread to have no bleed water or visible segregation. Research performed by Khayat and
Mitchell33 states that low slump flow values range from 23.5 to 25.0 in. (600 to 635 mm),
normal slump flow values range from 26.0 to 27.5 in. (660 to 700 mm), and high slump
flow values range from 28.0 to 30.0 in. (710 to 760 mm). The Japan Society of Civil

18
Engineers (JSCE) 34 recommends low to normal slump flows varying from 23.5 to 27.5
in. (600 to 700 mm). A visual representation of a typical concrete spread after the slump
cone has been removed from a slump flow test can be viewed in Figure 2.4.
Figure 2.4: View of Slump Flow Spread
2.5.3 T-20 (T-50) Test
The T-20 (T-50) test is a measure of the time that it takes for the concrete to
obtain a slump flow diameter of 20 in. (50 cm.).31 The test, as per ASTM C 1611/C
1611M29 (slump flow test), commences the moment the slump cone is lifted and ends as
soon as the concrete spread reaches a diameter of 20 in. (50 cm). It is important to note

19
that if the slump cone is inverted the T-20 (T-50) times will increase.14 This test provides
an indication of the mixture’s viscosity. The European Federation of National Trade
Associations (EFNARC) 18 recommends T-20 (T-50) values from 2 to 5 seconds. Any
measured time that takes less than 2 seconds indicates that the mixture is too fluid and
susceptible to segregation, whereas any time longer than 5 seconds suggests that the
mixture is likely too viscous and may experience blockage. Figure 2.5 below displays a
photograph of the approximate concrete spread diameter at which the T-20 (T-50) test
ends.
Figure 2.5: Approximate Concrete Spread Diameter at which the T-20 (T-50) Test
Ends

20
2.5.4 VSI Test
The VSI test is a subjective visual evaluation of the stability of the slump flow
patty.31 VSI values range from 0 to 3 in increments of 0.5 as per ASTM C 1611/C
1611M.29 A value of 0 is warranted for SCC that is highly stable and has no evidence of
segregation or bleeding, whereas a value of 3 is given for SCC that is highly unstable and
has visible segregation. The Precast/Prestressed Concrete Institute (PCI) Interim
Guidelines35 proposes that VSI values ranging from 0 to 1 should ensure acceptable
stability for SCC. A more thorough explanation of VSI values and their corresponding
interpretations in its entirety can be observed in Table 2.1.
Table 2.1: VSI Values, Descriptions, and Criteria VSI Value Description Criteria
0 Highly Stable No evidence of segregation or bleeding.
1 Stable No evidence of segregation and slight bleeding observed as a sheen on the concrete mass.
2 Unstable A slight mortar halo ≤ 0.5 in. and/or aggregate pile in the middle of the concrete mass.
3 Highly Unstable
Clearly segregating by evidence of a large mortar halo > 0.5 in. and/or large aggregate pile in the center of the concrete
mass.
(Adapted from ASTM C 1611/C 1611M29 “Slump Flow”)
2.5.5 J-Ring Test
The J-Ring test assesses the passing ability (blockage) of the concrete (ASTM C
1621/C 1621M30). The dimensions of a standard J-Ring are 11.81 in. (300 mm) in

21
diameter of its centerline and 3.94 in. (100 mm) in height. The clear spacing between the
sixteen 0.47 in. (12 mm)-diameter rebar is 2.17 in. (55 mm).36 The test is performed by
placing the slump cone in the center of the J-Ring, filling the slump cone with SCC, and
then removing the slump cone. This procedure simulates the passing ability of the
concrete through narrowly spaced obstacles. 37 As with the slump flow test, it is desirable
for the concrete spread to have no bleed water or visible segregation. Once the spread has
settled two measurements are taken. The first measurement is the difference in the height
of the SCC from the inside to the outside of the J-Ring; the PCI Interim Guidelines35
advises that this measurement must be less than 0.59 in. (15 mm) in order to achieve
sufficient passing ability. The second measurement is the J-Ring flow spread. It can be
taken by the same procedure as the slump flow spread. Khayat and Mitchell33 state that J-
Ring flow spreads should range from 21.5 to 26.0 in. (545 to 660 mm) and that a
difference in slump flow and J-Ring flow values should be less than 4 in. (100 mm).
Conversely, The German SCC guideline proposes that the difference in slump flow and J-
Ring flow measurements should not exceed 2 in. (50 mm), otherwise the concrete
mixture is no longer considered adequate to permeate the reinforcement38; this value,
however, was limited to 0.39 in. (10 mm) by the EFNARC recommendations.18 This
dissimilarity in values among the researchers suggests that the European
recommendations are significantly stricter. A view of a representative J-Ring flow spread
can be seen in Figure 2.6.

22
Figure 2.6: View of J-Ring Flow Spread
2.5.6 L-Box Test
The L-box test is an L-shaped apparatus that has a gate which separates the
vertical and horizontal compartments of the apparatus. 39 The vertical component of the
box is filled with concrete, and after 1 minute of rest the gate is opened. The concrete
then flows down through 0.47 in. (12 mm)-diameter reinforcing bars at the base of the
apparatus that are spaced at 1.38 in. (35 mm). The time elapsed for the leading edge of
the concrete to reach the end of the 23.62 in. (600 mm)-long horizontal segment is then
recorded. The ratio of concrete height that is present in the horizontal section h2 to the
height of the concrete still present in the vertical section h1 is established to assess the
passing and self-leveling ability of the concrete sample; this comparison is called the L-

23
box blocking ratio.40 The researchers are in agreement about establishing the L-box
blocking ratio. Both EFNARC18 and the Swedish Concrete Association (SCA) 41
recommend the L-box blocking ratio to be greater than 0.8, and the PCI Interim
Guidelines35 proposes that the ratio should be larger than 0.75. A schematic of the L-box
test can be viewed in Figure 2.7.
Figure 2.7: Schematic of L-Box Test42
2.5.7 Surface Settlement Test
The surface settlement test evaluates the static stability of SCC from the time the
concrete is placed until it hardens. This is accomplished by measuring the total surface
settlement while the concrete is still workable after it is cast in a cylindrical polyvinyl
chloride (PVC) column 8 in. (200 mm) in diameter and 26 in. (660 mm) in height. The
test begins by placing a sample of freshly mixed SCC in the PVC cylindrical column

24
mold up to a height of approximately 19.69 in. (500 mm) without packing or vibration. A
thin acrylic plate 6 in. (150 mm) in diameter and 0.15 in. (4 mm) in thickness is
positioned at the upper surface of the concrete, and a linear variable differential
transformer (LVDT) with a minimum travel range of 2 in. (50 mm) or a dial gage with a
4x10⁻⁴ in. (0.01 mm) precision is secured to the plate. After the monitoring system is
installed the initial height of the concrete is measured. Subsequent adjustments in height
are monitored at 5-minute intervals for the first 30 minutes and then every 2 hours until
reaching steady state conditions, which approximately corresponds to the beginning of
hardening. The difference in height designates the total settlement of the concrete
specimen.33 Hwang et al.42 propose surface settlement values of less than or equal to
0.5% in order to ensure static stability of SCC. A detailed diagram of a typical surface
settlement test can be viewed in Figure 2.8.
Figure 2.8: Details of Surface Settlement Test33

25
2.5.8 Conclusion
All the aforementioned test methods to evaluate the workability characteristics of
SCC and several others (the V-funnel test, the U-box test, the filling vessel “caisson” test,
the penetration test, and the GTM screen stability test) are summarized in Table 2.2.42
The recommended limit values for these test methods are proposed by several different
entities including Hwang et al., 42 EFNARC, 18 JSCE, 34, 43 PCI, 35 RILEM TC 174, 27 and
SCA.41 It is essential to note that no single fresh concrete test can verify if SCC can be
implemented in any given situation. Four workability categories (deformability, passing
ability, filling capacity, and static stability) must be satisfied. Thus it is imperative to
perform multiple fresh concrete tests on any SCC mixture to ensure adequate workability.

26
Table 2.2: Workability Characteristics, Test Methods, and Recommended Values42 Workability characteristic Test methods Recommended values suggested in 1 to 6
Deformability and flow rate (filling ability, unrestricted
flow)
Slump flow
1. Authors: 620 to 720 mm 2. EFNARC: 650 to 800 mm (MSA up to 20 mm) 3. JSCE: 600 to 700 mm 4. PCI: ≥ 660 mm 5. RILEM TC 174: N/A 6. Swedish Concrete Association: 650 to 750 mm
T-50 2. 2 to 5 seconds 4. 3 to 5 seconds 6. 3 to 7 seconds
Passing ability (narrow-opening passing ability, confined flow, restricted flow, dynamic stability)
V-funnel* 1. < 8 seconds 2. 6 to 12 seconds 4. 6 to 10 seconds
L-box, h2/h1 2. > 0.8 4. > 0.75 6. > 0.8
U-box, Bh
2. h2/h1: 0 to 30 mm 3. Rank 1† (35 to 60 mm reinforcing bar spacing) Rank 2‡ (60 to 200 mm reinforcing bar spacing) 4. Rank 1
J-Ring§ 2. < 10 mm 4. < 15 mm
Filling capacity (filling ability + passing ability, restricted deformability)
Filling vessel (caisson)
1. ≥ 80% 2. 90 to 100%
L-box, h2/h1 Same as passing ability U-box, Bh Same as passing ability
J-Ring Same as passing ability
Static stability (resistance to segregation, bleeding, and
settlement)
Surface settlement 1. ≤ 0.5%
Visual stability index 4. 0 or 1
Penetration 5 and 6. ≤ 8 mm GTM screen
stability 2. ≤ 15% *V-funnel opening of 65 x 75 mm. †Rank 1 refers to Bh of 305 mm through 5 to 10 mm-diameter bars with 35 mm clear spacing. ‡Rank 2 refers to Bh of 305 mm through 3 to 12 mm-diameter bars with internal and external spacing of 35 to 45 mm, respectively. §J-Ring value is determined by difference in height of concrete between inside and outside in J-Ring.
*NOTE: 1 in. = 25.4 mm

27
2.6 HARDENED CONCRETE PROPERTIES & TESTS PERFORMED ON SCC
2.6.1 Compressive Strength
As with conventional-slump concrete, SCC has the greatest strength when it is in
compression. Compressive strength is one of the most important mechanical properties of
concrete because it is relatively simple to test and correlate to other hardened properties
such as bond strength and tensile strength. Compressive strength testing should be in
accordance with ASTM C 39/C 39M44. When compared with conventional-slump
concrete, SCC consistently exhibits compressive strength that is comparable in
magnitude. Based solely on compressive strength, SCC can perform as well or even
better than conventional-slump concrete.
The compressive strength of concrete is inversely related to its w/cm. If the w/cm
is too low in conventional-slump concrete, the mixture will either not be workable or it
will not have a sufficient amount of water present to fully hydrate the cement. However,
in SCC mixtures HRWR are employed so that the concrete can develop and maintain a
high degree of workability while utilizing a lower amount of water. Also, the increased
amount of cement paste in SCC allows it to achieve a higher compressive strength than
conventional-slump concrete with the same w/cm.45
Research performed by Schindler et al.14 proposes that the S/Agg has little to no
effect on the long-term compressive strength. In their study, the authors tested
compressive strength on cylinders with S/Agg values of 0.38, 0.42, and 0.46. A possible
reason why the S/Agg parameter was shown to have a minimal effect on compressive

28
strength could be that the increase in binder content offset the decrease in strength that
can occur with a higher coarse aggregate content.
In addition, SCC is oftentimes stronger than conventional-slump concrete because
it has a demand for chemical and/or mineral admixtures. HRWR and SF assist SCC in
gaining higher early-age strength, while supplementing FA allows SCC to develop
superior later-age strength. Moreover, research suggests that larger quantities of SCM in
SCC permit it to develop strength at a greater rate. As a result, the concrete has the ability
to acquire a higher ultimate compressive strength.46
Although the mix design of SCC typically aids it in obtaining greater compressive
strength than conventional-slump concrete, curing regimens also affect compressive
strength. In tests performed at R&D Laboratories of Master Builders, Inc. in Cleveland,
Ohio, when compared with conventional-slump concrete specimens designed to have the
same compressive strength, the compressive strength of the steam-cured SCC specimens
was slightly lower or approximately equal to that of the conventional-slump concrete
specimens. However, when the samples were air-cured, the SCC surpassed the
compressive strength of conventional-slump concrete with ease. These results are
presented graphically in Figure 2.9.

29
Figure 2.9: Compressive Strengths at 1 and 28 Days47
*NOTE: 145.04 psi = 1 MPa
This variation in results is probably due to the fact that air-cured concrete is less prone to
microcracking in the ITZ than steam-cured concrete. In addition, SCC has a stronger,
more densely packed ITZ than conventional-slump concrete. Consequently, concrete’s
weakest link, the cement-to-aggregate bond, is stronger in SCC; this improves the
compressive strength of SCC.47 Furthermore, the findings of this research suggest that
when moist-cured, SCC will perform just as well if not better than conventional-slump
concrete in compression.
2.6.2 Tensile Strength
While information on SCC’s tensile strength is limited, the literature indicates that
SCC has comparable and, oftentimes, superior tensile performance when compared to
conventional-slump concrete. SCC and conventional-slump concrete experience similar
rates of tensile strength evolution over time. It has been reported that reinforced concrete

30
members made with SCC perform well in tension because of its microstructure, mix
design, and bond strength. 45, 48
By design, SCC contains a large amount of fines and a greater quantity of smaller
coarse aggregate particles. This type of particle size distribution increases the packing
density, which creates a denser, less porous ITZ. As a result, the ITZ is stronger,
therefore the bond between the concrete and reinforcing steel is stronger. This allows for
better transfer of tensile loads from the steel to the concrete, which ultimately results in
increased tensile strength in reinforced SCC members.45
SCC also has strong resistance to splitting tensile failure. Full scale load tests
performed on SCC bridge girders at Texas A&M University confirmed that SCC girders
had greater splitting tensile strength than conventional-slump concrete girders.49 In a
separate test conducted at R&D Laboratories by Attiogbe et. al, SCC specimens tested for
splitting tensile resistance also exhibited equivalent or superior performance compared to
conventional-slump concrete.47 The results of Attiogbe et al.’s research are shown in
Figure 2.10.
Figure 2.10: Tensile Strengths at 1 and 28 Days47
*NOTE: 145.04 psi = 1 MPa

31
2.6.3 Bond Strength
The bond between the concrete and the reinforcing steel is a significant factor in
evaluating the strength of reinforced concrete members. A weak bond can result in pull-
out failures in concrete beams. This occurs when a member is subjected to flexural
loading and the reinforcing bars begin to slip as a result of poor bond with the concrete,
ultimately causing the member to fail. Bond behavior is affected by the properties of the
cement matrix, including its compressive strength, tensile strength, and homogeneity, as
well as the amount of cover around the reinforcing bars, the geometry of the
deformations in the reinforcing bars, and the top-bar effect.45, 46, 50
The concrete’s bond strength is directly proportional to the square root of its
compressive strength. Most sources agree that, given a SCC and conventional-slump
concrete with the same compressive strength, the SCC will exhibit a greater bond
strength. This is due to the fact that SCC has a denser, more homogeneous cement matrix
which corresponds to a denser and more uniform ITZ. 45, 46, 50The weakest link in
concrete typically occurs within the ITZ, so a denser ITZ results in a stronger bond
between the concrete and steel. This enhanced bond strength increases the flexural
resistance and capacity of the members.46
In addition to strengthening the bond between concrete and steel, the
homogeneous nature of SCC also combats the top-bar effect, which often causes failure
in reinforced concrete members. The top-bar effect is a decrease in bond strength due to
bleeding, segregation, or settlement in concrete which results in an increased risk of
pullout failure for bars cast in the top of a member. 47 Since SCC has the ability to fill

32
formwork better than conventional-slump concrete without any vibration, it is less
susceptible to bleeding and segregation. Hence, SCC is less prone to the top-bar effect.
Research performed by Chan et al. supports this notion. In Chan’s experiment,
two 47.24 X 35.43 X 169.29 in. (1200 X 900 X 4300 mm) walls were erected. Each wall
contained deformed reinforcing bars at heights of 7.87, 19.69, and 31.50 in. (200, 500,
and 800 mm), respectively. One wall was constructed from conventional-slump concrete,
and the other wall was constructed from SCC; both walls were designed to have
equivalent compressive strengths. The bond strength of the bars was tested and, while
SCC and conventional-slump concrete both experienced the top-bar effect in bars cast at
higher elevations, the effects were not nearly as significant in the SCC wall. This is
because the conventional-slump concrete was cast in multiple lifts and each lift was
vibrated, whereas the SCC was able to be cast in a single lift without the need for
vibration. Consequently, the conventional-slump concrete experienced more bleeding and
segregation, which ultimately resulted in pullout failure due to the top-bar effect. The
bond strength of the reinforcing bars cast within both walls is illustrated in Figure 2.11.

33
Figure 2.11: Bond Strength Development in SCC and Conventional-Slump
Concrete46 *NOTE: 145.04 psi = 1 MPa
Due to plastic shrinkage the top-bar effect caused some problems in the SCC wall;
however, the SCC wall still outperformed the conventional-slump concrete wall. The
authors state that it should be noted that plastic shrinkage is typically less of a problem in
actual construction than it was in their test.46
An analogous test was performed by Khayat et al. at the University of Sherbrooke
in Quebec, Canada. The results of this investigation were in agreement with the findings
stated in Chan’s conclusions. It was reported that the SCC specimens acquired pull-out
and top-bar effect resistance that was equal to or greater than that of the conventional-
slump concrete specimens. Under the same circumstances, the University of Sherbrooke
trial also tested prestressing strands in addition to deformed reinforcing bars. Similar to
the rebar, the strands cast in SCC displayed better resistance to pull-out failure than those
cast in conventional-slump concrete; this was even the case for the strands cast at higher
elevations in the specimen.51 Thus, it is evident that SCC can perform well in prestressed
applications.

34
Furthermore, the results of an investigation conducted by Sonebi et al. concur
with the aforesaid trends. The authors performed bond tests (pullout tests) with 0.47 and
0.79 in. (12 and 20 mm) deformed bars cast in concrete specimens of 3.94 X 3.94 X 5.91
in. (100 X 100 X 150 mm) to study the performance of SCC compared to normal-slump
concrete. The test results showed 10 to 40% higher normalized bond strength in SCC
compared to normal-slump concrete.52
However, it should be noted that there are some conflicting results in the
literature. The conclusions of research performed by Robert Peterman53 propose that
when keeping the w/cm of a mixture constant, an increase in concrete fluidity will result
in a decrease in bond capacity. This effect becomes even more prominent near the top
surface. Peterman states that the findings of this research are in agreement with previous
results associated with the top-bar effect in pretensioned piles54 and also with the present
understanding of the effect of concrete’s fluidity on the bond strength of deformed bars.55
2.6.4 Modulus of Elasticity
The modulus of elasticity of concrete (Ec) is dependent upon the modulus of
elasticity of its constituents. As a result, strong, rigid aggregates will increase Ec, whereas
high air content and elevated paste volume will decrease it. Since SCC has more paste
and less coarse aggregate than conventional-slump concrete, it has a lower Ec.10, 56, 57
According to the ACI 31858 Building Code, Section 8.5.1, Ec can be estimated
implementing Eq. (1). This formulation is also utilized with the AASHTO LRFD, 59
Section 5.4.2.4 to approximate Ec.

35
𝐸𝑐 = 33𝑤𝑐1.5 �𝑓′𝑐 (1)
where Ec is the modulus of elasticity (psi, MPa), wc is the unit weight of the concrete
(lb/ft3, kg/m3), and f’c is the compressive strength (psi, MPa).14
Research conducted by Su et al.60 evaluated the effect of S/Agg values ranging
from 0.30 to 0.55 on Ec. They concluded that when the fine and coarse aggregate have
similar elastic moduli, and the total volume of aggregate is invariable, the S/Agg does not
significantly affect the Ec. Further research performed by Schindler et al.14 confirms this
concept.
Due to its lower Ec, SCC requires less applied stress to deform, and it is also more
ductile than conventional-slump concrete. In an experiment conducted by Lin et al., a test
was established to compare the compressive strength of SCC and conventional-slump
concrete in reinforced concrete columns under concentric compression. The results show
that SCC was 32% more ductile than conventional-slump concrete.56
However, more ductility results in greater deflection. A study performed by Kim
at Texas A&M University supports this statement. In the experiment, full scale reinforced
SCC and conventional-slump concrete bridge girders were loaded to compare the
deflections. The girders contained limestone coarse aggregate or river gravel. The results
display that regardless of the type of aggregate, the SCC girders exhibited more
deflection than those cast in conventional-slump concrete.49
As it is more densely packed and contains a greater volume of paste than
conventional-slump concrete, SCC is apt to have a lower Ec than conventional-slump
concrete. This dense packing of paste combined with the superior bond strength of SCC

36
increases the tensile strength of reinforced concrete members and enables them to
perform well when subjected to flexural loading. For this reason SCC can be practical in
moment resisting members such as beam columns. Nevertheless, there is cause for
concern since the lower Ec of SCC increases deflection. Given this undesirable effect, it
may be necessary to camber SCC members in bridge and floor applications to prevent the
development of uncomfortable amounts of deflection.
2.6.5 Shrinkage
2.6.5.1 Introduction
Since SCC has a higher proportion of fines and a lower quantity of coarse
aggregate than conventional-slump concrete, it experiences greater amounts of shrinkage.
In some cases it has been reported that SCC can experience as much as 50% more
shrinkage than conventional-slump concrete.45 Therefore, SCC is more susceptible to
shrinkage cracking; shrinkage cracking occurs when a structural element resists the creep
occurring within it, creating tensile stress. This stress ultimately causes concrete to crack.
48 It has been reported that some prestress losses and long-term deflection variations
experienced by prestressed concrete members are the direct result of shrinkage effects.61
Shrinkage is a property of the paste within concrete, and the aggregates are the
most significant constituents that influence the change in volume within the paste.57, 62
When the w/cm is held constant, an increase in cement content will increase shrinkage
because of the increased volume of hydrated cement paste.57 Conversely, if the water
content is held constant and the cement content is increased, the amount of shrinkage is

37
less. This occurs because the higher strength paste acquires an improved resistance to
shrinkage.57 According to Neville, 57 though the size and grading of the aggregate do not
have a significant impact on shrinkage, increasing the maximum size of aggregate (MSA)
will create a leaner mixture, thus minimizing the shrinkage.
Several categories of shrinkage exist, all of which tend to be more detrimental to
SCC than conventional-slump concrete. However, some techniques can be applied to
reduce the amount of shrinkage that occurs in SCC. The different types of shrinkage
include autogenous shrinkage, drying shrinkage, and plastic shrinkage and are discussed
in greater detail in the following sections.
2.6.5.2 Autogenous Shrinkage
Autogenous shrinkage occurs due to the production of hydration products that
form when cement reacts with water. Concrete has a tendency to shrink over time
because the hydration products have smaller volumes than that of hydrated cement and
water.63 Concrete can experience autogenous shrinkage for many years after it hardens
because hydration reactions continually occur long after the concrete initially sets.
Internal curing is a process that has been reported to combat autogenous
shrinkage; this can be accomplished by adding presaturated lightweight aggregate or
superabsorbent polymers. Supplementing a small portion of presaturated lightweight
aggregate to a concrete mixture provides additional water that can restore the water lost
through the formation of hydration products.64 Research shows that adding as little
presaturated lightweight aggregate as 6% of the weight of cement can produce high

38
strength concrete without any of the effects of autogenous shrinkage.65 Likewise, adding
superabsorbent polymers to concrete has also shown to reduce autogenous shrinkage.
Commercially available superabsorbent polymer products can absorb approximately 20
times their weight in water. After supplementation into a concrete mix, the polymers
form macro-inclusions of water within the concrete while mixing. The macro-inclusions
are utilized during the formation of cement hydration products. Hence, autogenous
shrinkage effects are reduced.64
Barrita et al.66 assessed high-performance concrete (HPC) mixtures that can be
implemented in hot arid climates. In their research magnetic resonance imaging (MRI)
was used to determine the effectiveness of lengthening the moist curing period by
replacing 11% by volume of the total aggregate content with saturated lightweight
aggregate in a concrete mixture that was placed in a hot arid climate. Arrays of concrete
mixtures were moist-cured either for 0, 0.5, 1, or 3 days, or by applying a curing
compound. This procedure was continued by air drying at 100.4°F (38°C) and 40%
relative humidity.67
Three concrete mixtures were studied; the mixtures included low-strength
concrete (w/cm = 0.60), SCC containing 30% FA (w/cm = 0.33), and high-strength
concrete containing 8% SF (w/cm = 0.30). Samples from these mixtures were cast in
triplicate. The samples were dried in an environmental chamber at 100.4°F (38°C) and
40% relative humidity after curing. MRI was used to evaluate the evaporable water
supply as the samples were drying. After the drying sequence, the samples were placed
inside an oven at 221°F (105°C). While in the oven, water absorption tests were
conducted on the samples to ascertain their sorptivity.66, 67

39
The data acquired during the drying sequences signified a decreased moisture loss
with increasing duration of moist curing. It was also reported that the addition of
saturated lightweight aggregate does not abolish the requirement of providing some
external moist curing for a condensed time period. The findings from the water
absorption tests indicated that the incorporation of lightweight aggregate particles
significantly increases the sorptivity in low strength concrete. However, when compared
to the same concrete mixtures containing only normal-weight aggregate, the addition of
lightweight aggregate has a subsidiary effect in both SCC and high-strength concrete.66, 67
2.6.5.3 Drying Shrinkage
Drying shrinkage occurs whenever concrete is mixed with more water than is
necessary for cement hydration. As a result, the concrete shrinks due to the
evaporation of excess water. When the concrete shrinks, the structural element resists this
shrinkage and causes the concrete to crack.47
Although SCC does experience more shrinkage than conventional-slump
concrete, research suggests that drying shrinkage is probably not the most significant
portion of it. The previously mentioned tests performed by Attiogbe et al.47 indicate that
there is not a major difference in the amount of drying shrinkage that occurs among SCC
and conventional-slump concrete. These results are presented in Figure 2.12.

40
Figure 2.12: Drying Shrinkage of SCC and Conventional-Slump Concrete
Mixtures47
The findings stated by Mazzotti et al.68 are in agreement. In their experiment, SCC and
conventional-slump concrete specimens were loaded to 35% and 50% of their equivalent
compressive strengths. The results showed that the SCC specimens experienced merely a
slight increase in shrinkage with respect to the conventional-slump concrete specimens.
The mix design of concrete is also a factor in mitigating the effects of drying
shrinkage. SCC with a lower S/Agg will experience smaller amounts of drying shrinkage
than SCC with a higher S/Agg. However, if S/Agg is too low the concrete will lose its
flowability and cease to be self-consolidating; this side-effect can be avoided by adding
VMA to the mixture. The addition of VMA enables low S/Agg SCC to experience less
drying shrinkage while maintaining its flowability. It has been reported that

41
implementing this method can produce SCC mixtures with slump flow values ranging
from 24.02 in. to 25 in. (610 to 635 mm) with S/Agg of 0.48 and 0.39; these S/Agg values
are typical for conventional-slump concrete mixtures.47
Further research proposed by Ozyildirim and Lane69 recommends a large nominal
maximum aggregate size (NMSA) (3/4 in. (1.905 cm)), large amount of coarse aggregate
(1,550 lb/yd3 (919.58 kg/m3)), and low water content (270 lb/yd3 (160.18 kg/m3)) to
diminish the effects of drying shrinkage in SCC applications. However, in congested
concrete applications such as prestressed members, increasing the NMSA reduces the
desired filling ability and passing ability of SCC.
In order to establish if drying shrinkage values for SCC mixtures correspond to
behavior assumed during design, these values can be compared to those estimated by ACI
209R70 and/or AASHTO LRFD.59 The ACI 209R shrinkage prediction formulation
accounts for the air content, age of the specimen, cement content, curing method and
duration, fine aggregate percentage, humidity, slump, and volume-to-surface ratio. It
should be noted that the AASHTO LRFD drying shrinkage formulation (Section
5.4.2.3.3) only accounts for the age of the specimen, curing method, humidity, and
volume-to-surface ratio.14
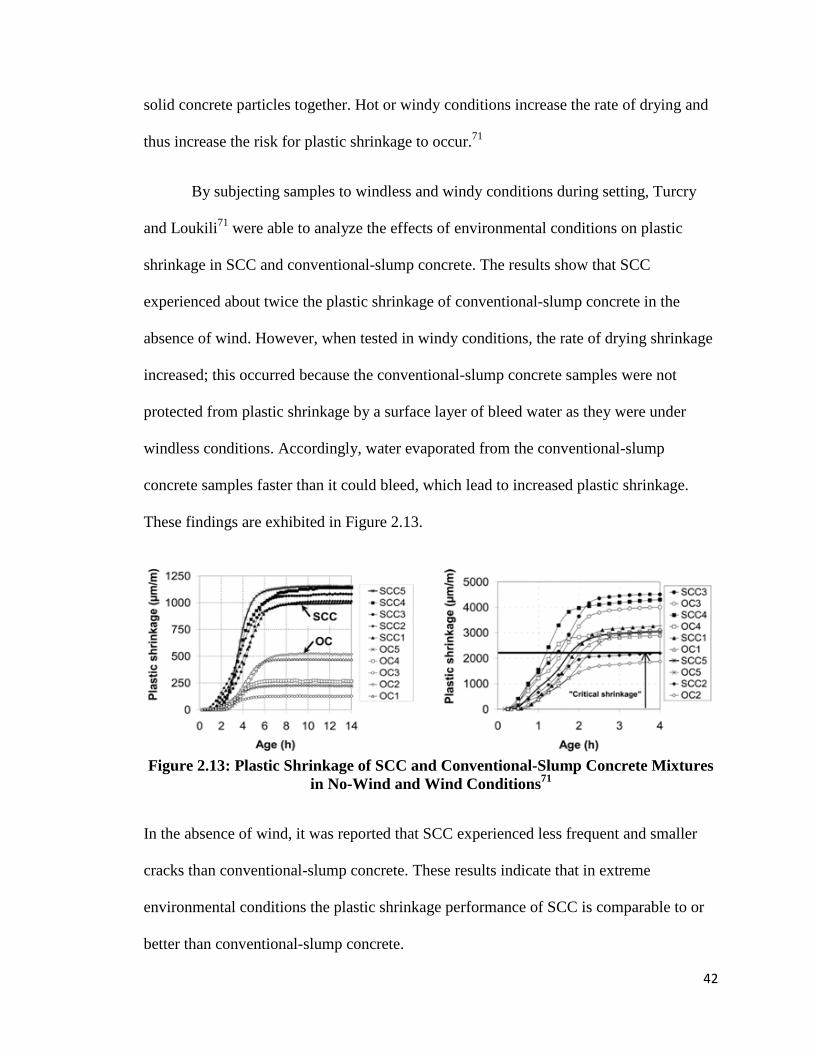
2.6.5.4 Plastic Shrinkage
Plastic shrinkage occurs when bleed water forms menisci on the surface of freshly
cast concrete during curing. Negative capillary pressure is created because the menisci
evaporate faster than the concrete bleeds. This pressure causes shrinkage by pulling the
42
solid concrete particles together. Hot or windy conditions increase the rate of drying and
thus increase the risk for plastic shrinkage to occur.71
By subjecting samples to windless and windy conditions during setting, Turcry
and Loukili71 were able to analyze the effects of environmental conditions on plastic
shrinkage in SCC and conventional-slump concrete. The results show that SCC
experienced about twice the plastic shrinkage of conventional-slump concrete in the
absence of wind. However, when tested in windy conditions, the rate of drying shrinkage
increased; this occurred because the conventional-slump concrete samples were not
protected from plastic shrinkage by a surface layer of bleed water as they were under
windless conditions. Accordingly, water evaporated from the conventional-slump
concrete samples faster than it could bleed, which lead to increased plastic shrinkage.
These findings are exhibited in Figure 2.13.
Figure 2.13: Plastic Shrinkage of SCC and Conventional-Slump Concrete Mixtures
in No-Wind and Wind Conditions71
In the absence of wind, it was reported that SCC experienced less frequent and smaller
cracks than conventional-slump concrete. These results indicate that in extreme
environmental conditions the plastic shrinkage performance of SCC is comparable to or
better than conventional-slump concrete.

43
Turcry and Loukili71 report that plastic shrinkage can be reduced threefold by
applying a curing compound to freshly cast SCC. When sprayed, curing compounds will
coat the concrete’s surface with a solid membrane that reduces the amount of plastic
shrinkage by preventing moisture loss through evaporation.
2.6.6 Creep
Creep is an occurrence that develops after concrete expands or contracts as a
result of long term loading. SCC experiences greater amounts of creep than conventional-
slump concrete because the high paste content reduces its Ec.68 However, there are
conflicting results within the literature. While some research supports the claim that SCC
will have greater amounts of creep than conventional-slump concrete, other research,
such as that performed by Turcry et al. asserts that SCC and conventional-slump concrete
of the same compressive strength will have the same specific creep.48, 68 Also, even if
creep is a larger detriment to SCC, research has shown that increased amounts of creep in
SCC could counteract the negative effects of shrinkage.48
Mazzotti et al.68 examined the differences in creep behavior in SCC and
conventional-slump concrete. Cylinders of SCC and conventional-slump concrete
measuring 3.86 X 7.87 in. (98 X 200 mm) and 4.92 X 9.84 in. (125 X 250 mm) were cast
with the same compressive strength. After 6 days of curing, the cylinders were loaded
longitudinally to 35% and 55% of their compressive strength for 180 days. The results of
this test clearly showed that SCC experiences more creep than conventional-slump
concrete. On the other hand, when Turcry et al. loaded SCC and conventional-slump

44
concrete cylinders to 20% of their compressive strength over a period of 100 days, it was
reported that both types of cylinders experienced approximately the same amount of
creep.48
The aforementioned creep and shrinkage tests conducted by Attiogbe et al.47
yielded results that are in agreement with Mazzotti et al. It was reported that during the
first year of loading SCC specimens exhibited more creep than conventional-slump
concrete specimens. Resembling the specimens tested for shrinkage, concrete displayed
less creep when steam-cured than when air-cured. Also, under steam-cured conditions,
SCC and conventional-slump concrete specimens demonstrated fewer discrepancies in
creep values. These results are illustrated in Figure 2.14.
Figure 2.14: Specific Creep of SCC and Conventional-Slump Concrete Mixtures47
*NOTE: 145.04 psi = 1 MPa

45
SCC has shown to experience more creep during the first year of loading, but
mathematical models project that steam-cured SCC will begin to creep at a slower rate
and experience 13.6% less creep at 10 years of age.47
More research concerning creep in SCC needs to be conduced to better establish
the general trend of its performance compared to that of conventional-slump concrete. If
SCC is proven to exhibit more creep than conventional-slump concrete, it is a possibility
that this characteristic may actually be an advantage in structural applications. Turcry et
al.48 propose that creep could possibly “…compensate for the effects of shrinkage…” by
expanding under applied loading when its innate propensity is to contract over time.
However, further research is required to validate this assertion.
2.7 SCC APPLICATIONS
2.7.1 Deep Foundations
Many placing problems can arise with concrete when pouring in-place deep
foundations. Concerning deep foundations such as drilled shafts or caissons, the majority
of concrete placed can not be seen; this poses quality control concerns. Conventional-
slump concrete must be vibrated as it is placed in the shaft. Since nearly all the concrete
placed is not visible at ground level, under- or over-vibrating routinely occurs. If the
concrete is under-vibrated, it will not fully consolidate; this can cause cavities to develop
and can also lead to soil encroachment and inadequate concrete cover for the reinforcing
steel. Over time this can cause corrosion in the reinforcing steel and reduce the structural
properties of the element. Whereas if the concrete is over-vibrated, segregation or

46
excessive air voids can develop; this can lead to a lack of uniformity in the member.72 In
the event that any of the aforementioned quandaries occur, the load capacity of the
structure will be significantly reduced as a result.
Implementing SCC for deep foundations can resolve numerous dilemmas related
to concrete homogeny and consistency. Regarding drilled shafts or caissons, the
properties of SCC are especially beneficial. The flowability SCC develops enables the
concrete to consolidate due to its own self weight without vibration. In addition to
significantly decreasing the amount of time required to pour the in-place deep foundation,
completely excluding vibration eliminates the risks associated with under- or over-
vibrating the concrete. Also, SCC’s deformability allows for the concrete to completely
encapsulate the reinforcing steel and fill the voids of the structural member.
2.7.2 Prestressed Bridge Girders
In recent years there has been substantial interest pertaining to the use of SCC for
prestressed applications. However, for use in bridge members, SCC has not yet been
widely accepted by many states’ departments of transportation (DOT). Research
performed by Zia et al.73 compared the performance of prestressed SCC and
conventional-slump concrete bridge girders. Three AASHTO Type III girders were cast,
two with SCC and one with conventional-slump concrete. All the beams had the same
dimensions and equal amounts of reinforcing steel. The conventional-slump concrete
girder took 30 minutes to cast, whereas the SCC girder was cast in 20 minutes without
vibration.

47
At 28 days of age, the conventional-slump concrete cylinders obtained average
compressive strength values that surpassed 7,000 psi (48.3 MPa) and the SCC cylinders
exceeded 10,000 psi (69 MPa). When tested, bond strength and transfer length were
comparable between the conventional-slump concrete and SCC. The flexural modulus
(MOR) for the conventional-slump concrete and SCC were also comparable, yet lower
than expected given the compressive strength. It was reported that this likely occurred
due to the fact that weak fine aggregate was used in the mixture, and the samples were
not moist-cured. As was predicted, the Ec for the SCC cylinders showed lower values
than those recorded from the conventional-slump concrete cylinders. It should be noted
that since the cylinders tested were not nearly as massive as the girders, they were not
subjected to the curing benefits associated with a high heat of hydration like the girders
were. It is also important to note that the Ecs recorded 98 days after load testing were
comparable to the Ecs acquired from the initial camber measurements. While the
compressive strength of the girders increased with age, this finding indicates that as the
girders aged (without moist curing) the Ec was not improved.73
Subsequent load testing indicated elastic behavior in all girders. The initial
camber of all three girders was equivalent. During the first 98 days after casting, all three
girders experienced growth; this occurred during the summer season. As temperatures fell
and the fall season arrived, the camber of the three girders was reduced; the most
significant decrease in camber occurred in the SCC girders. This suggests that the
stiffness diminishes most prevalently in SCC girders subjected to sustained loading.73
In the future, long term hardened properties of SCC should be tested in order to
completely assess its performance in prestressed bridge girder applications.

48
2.7.3 Basement and Foundation Walls
For residential and small building construction it is customary to utilize concrete
in basement and foundation wall applications. However, oftentimes poor quality,
extremely fluid concrete is used in an attempt to decrease the need for vibration and also
to decrease casting times. This type of mixture is produced by increasing the w/cm.
Although this can improve workability, the lasting effects of a poor quality concrete can
lead to various problems for future owners, such as high permeability and excessive
cracking due to bleed water and segregation.
Khayat et al.74 examined the effects of implementing SCC in basement and
foundation walls. In the experiment, two trial walls and a foundation wall of a three
townhouse complex were cast. If SCC is to be used in residential and small building
construction, it is imperative that the mixture design is economical. A portion of the
cement was replaced with SF and either FA or blast-furnace slag (BFS) in order to reduce
the cost and also to enhance the fresh and hardened properties of the SCC mixtures. The
mixtures were designed to readily deform through narrow formwork containing no steel
reinforcement.
The two trial walls were cast at a single location. After approximately 20 hours
the formwork was removed, and the walls were draped with wet burlap for 4 days and
allowed to moist-cure. The SCC readily flowed throughout every section of the
formwork, and no surface defects as a result of bleeding, honey combing, or segregation
were observed. The plywood formwork was the only source of any surface blemishes
(which consisted solely of air bubbles) that were detected. Coring was also performed on

49
the walls. The examination of core samples taken from areas where surface air bubbles
were prevalent did not reveal any large concentration of air voids. This finding suggests
that the high air void concentration in some locations is purely a surface phenomenon.
Upon inspection, there was no shrinkage cracking examined in the trial walls three
months after casting.74
The townhouse complex was cast simultaneously in two locations to ensure that
the spreading concrete would not exceed 82.02 ft. (25 m). The formwork varied from
7.55 to 8.53 ft. (2.3 to 2.6 m) in height, and additional steel reinforcement was included at
the bottom of the formwork due to the enlarged hydrostatic pressure of SCC. The SCC
flowed well all through the formwork, filling in the entire space, and totally
encapsulating the reinforcement. The width of the foundation wall was not consistent as
the slopes at the end of the pour were 1.5 to 2.5%. In order to level the surface of the
wall, a garden rake was dragged across the concrete at the end of casting.74
After two days had passed, the formwork was removed. The concrete proved to
be soundly compacted and showed no substantial evidence of segregation. The surface
finish contained a large amount of air bubbles where the form releasing agent had not
been applied. However, the authors affirm that those surface flaws would lessen by
employing well-oiled high quality plywood. After one year had elapsed, only three
shrinkage cracks were present along the 262.47 ft. (80 m) length of wall.74
Pertaining to the application of basement and foundation walls, SCC acquires all
of the essential fresh and hardened properties to be an effective alternative to
conventional-slump concrete. In residential locations, the capability of SCC to totally

50
consolidate due to its own self weight without vibration while retaining the stability to
resist segregation makes it a particularly reliable option. The utilization of SCC can
greatly increase durability, impermeability, and resistance to shrinkage. These
characteristics are immensely beneficial for any would-be owner of a structure that has a
SCC basement or foundation wall. In addition, implementing SCC enables construction
crews to pour basement and foundation walls swiftly, thus decreasing labor costs. Seeing
that long-term testing on SCC structures is limited, research should be ongoing in the
future to make certain that SCC can perform adequately throughout its intended useful
life.
2.8 CONCLUSION
When compared with conventional-slump concrete, SCC can be an advantageous
alternative. Fresh concrete properties, hardened concrete properties, the tests associated
with each, and common applications for SCC were discussed in the preceding sections. It
is necessary to reiterate the following; multiple fresh concrete tests should be conducted
on SCC mixtures to ensure that the four workability categories (deformability, passing
ability, filling capacity, and static stability) are satisfied. In many cases the hardened
properties of SCC are comparable or superior to that of conventional-slump concrete.
Furthermore, deep foundations, prestressed bridge girders, basement and foundation
walls, and other precast elements are ideal applications for SCC.
The scope of the research program included trial batching SCC and FA SCC
mixtures to establish fresh concrete specifications. The SCC and FA SCC mixtures that

51
possessed the most desirable fresh concrete properties were employed in casting two
reinforced box culverts.
The advantages presented in previous research efforts substantiate re-evaluation
of the current Standard Specifications in Arkansas based on research specifically
proposed to test materials that are readily available in this state. If the same advantages
are established from the current research program as from prior research efforts, the state
of Arkansas would benefit from an amendment to the Standard Specifications5 that
includes fresh concrete provisions for SCC mixtures.

52
CHAPTER 3
EXPERIMENTAL PROCEDURE
3.1 INTRODUCTION
The goal of this research program was to develop fresh concrete specifications for
SCC mixtures. In the “Arkansas 2003 Standard Specification for Highway Construction”5
(Table 802-1), AHTD lists a minimum binder content and slump range for a Class S
“structural” concrete as 6.5 bags (611 lb/yd3,362.61 kg/m3) and 1 – 4 in. (25.4 – 101.6
mm), respectively. These specifications can be seen below in Table 3.1.
Table 3.1: Minimum Binder Content and Slump Range Specified for Structural Concrete5
*NOTE: 1 lb/yd3 = 0.59 kg/m3, 1 in. = 25.4 mm, 145.04 psi = 1 MPa
Although SCC is a structural concrete, its properties, particularly fresh concrete
properties such as deformability, passing ability, filling capacity, and static stability,

53
differ significantly from those of conventional-slump concrete. Therefore, it is relevant
for SCC to have its own set of standard specifications. The distinctive fresh properties of
SCC were determined by performing the slump flow test (ASTM C 1611/C 1611M), the
T-20 (T-50) test (ASTM C 1611/C 1611M), the VSI test (ASTM C 1611/C 1611M), and
the J-Ring test (ASTM C 1621/C 1621M). The ranges of the values acquired from these
tests were based upon recommendations listed in the literature. A slump flow or spread of
at least 23.5 in. (600 mm), 33 T-20 (T-50) time within the range of 2 to 5 seconds, 18 VSI
of 0 to 1, 35 for the difference in height of concrete from the inside to the outside of the J-
Ring to be less than 0.59 in. (15 mm), 35 and for a difference in slump flow and J-Ring
flow values to be less than 4 in. (100 mm).33 Also, as prescribed in Figure 3.1, the
mixtures were designed to obtain a minimum compressive strength of 3500 psi (24 MPa)
at 28 days.5
3.2 MATERIALS
3.2.1 Materials
All materials used in the research program were locally available. As stipulated
by AHTD Standard Specifications for Highway Construction5, Division 800, Section
802.02 Materials, Type I portland cement conforming to the requirements of AASHTO
M 85 was used. Multiple adequate SCC mixtures were developed by only utilizing
cement as the binder component. However, in an attempt to make the mixtures more
economical, Class C FA was also included in the scope of the research program. The FA

54
used was in compliance with AASHTO M 295. SCC was successfully batched with FA
replacement rates of 5, 10, 15, 20, and 25%.
The fine aggregate used in the mixtures was washed river sand which consisted of
clean, hard, durable particles. The coarse aggregate was crushed limestone which
consisted of clean and durable fragments of rock of uniform quality. S/Agg values
varying from 0.44 to 0.56 were used in all mixtures. The sieve requirements listed in
AHTD’s Standard Specifications5 were followed for both the fine and coarse aggregates.
Table 3.2 lists the tests performed on the fine and coarse aggregate. The fine
aggregate gradation and physical properties are shown in Table 3.3 and Table 3.4,
respectively. The coarse aggregate gradation and physical properties are shown
correspondingly in Table 3.5 and 3.6.
Table 3.2: Aggregates, Tests, and Standards Material Test Name Standards
Fine Aggregate Sieve Analysis ASTM C 136
Specific Gravity and Absorption ASTM C 128 Dry Rodded Unit Weight ASTM C 29
Coarse Aggregate Sieve Analysis ASTM C 136
Specific Gravity and Absorption ASTM C 127 Dry Rodded Unit Weight ASTM C 29
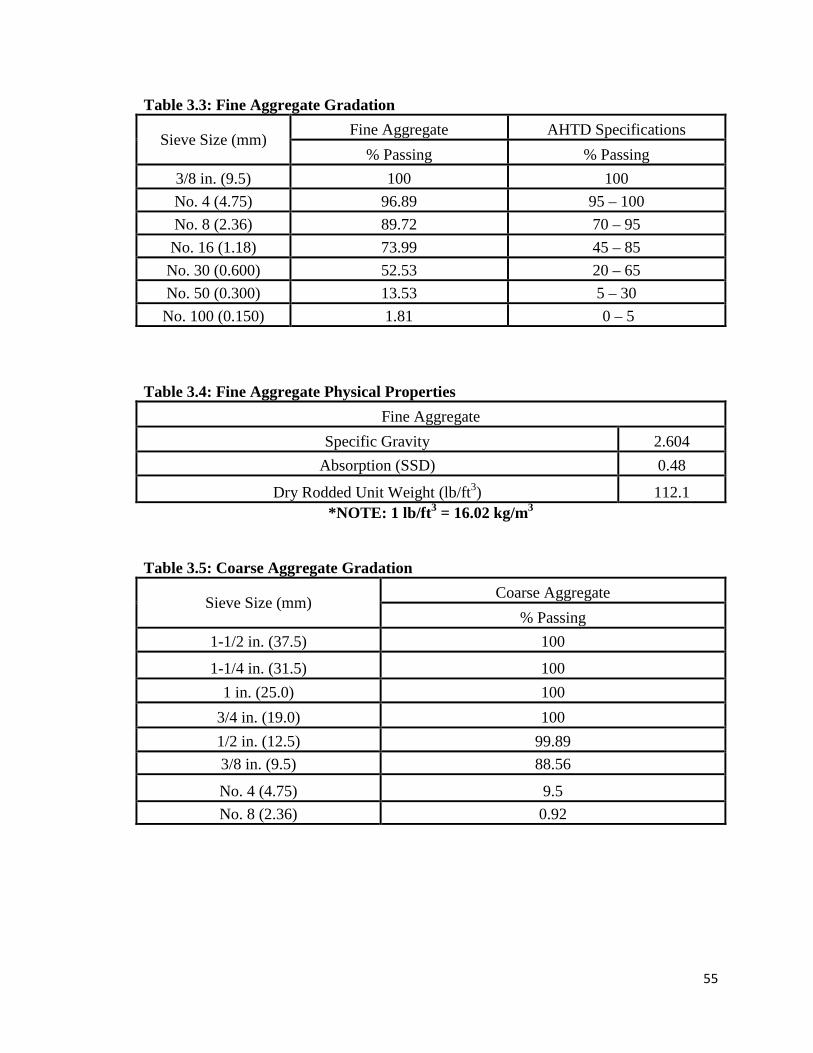
55
Table 3.3: Fine Aggregate Gradation
Sieve Size (mm) Fine Aggregate AHTD Specifications % Passing % Passing
3/8 in. (9.5) 100 100 No. 4 (4.75) 96.89 95 – 100 No. 8 (2.36) 89.72 70 – 95 No. 16 (1.18) 73.99 45 – 85 No. 30 (0.600) 52.53 20 – 65 No. 50 (0.300) 13.53 5 – 30 No. 100 (0.150) 1.81 0 – 5
Table 3.4: Fine Aggregate Physical Properties
Fine Aggregate Specific Gravity 2.604
Absorption (SSD) 0.48
Dry Rodded Unit Weight (lb/ft3) 112.1 *NOTE: 1 lb/ft3 = 16.02 kg/m3
Table 3.5: Coarse Aggregate Gradation
Sieve Size (mm) Coarse Aggregate % Passing
1-1/2 in. (37.5) 100
1-1/4 in. (31.5) 100 1 in. (25.0) 100
3/4 in. (19.0) 100 1/2 in. (12.5) 99.89 3/8 in. (9.5) 88.56
No. 4 (4.75) 9.5 No. 8 (2.36) 0.92

56
Table 3.6: Coarse Aggregate Physical Properties Coarse Aggregate
Specific Gravity 2.678 Absorption (SSD) 0.38
Dry Rodded Unit Weight (lb/ft3) 89.5 *NOTE: 1 lb/ft3 = 16.02 kg/m3
The water used in the mixtures was in agreement with AHTD’s Standard
Specifications.5 It was clean and free from harmful amounts of oil, salts, and other
deleterious substances, and it did not contain more than 1000 ppm of chlorides. Also, as
recommended by AHTD, the w/b was set at 0.44 for all trial mixtures.
3.2.2 Chemical Admixtures
HRWRs provided by Grace Construction were implemented in the concrete
mixtures to promote flowability. It is important to note that every mixture contained at
least one HRWR. The first chemical admixture used was ADVA Cast 530. ADVA Cast
530 is a polycarboxylate-based HRWR that is designed to conform to ASTM C 494/C
494M as a Type A and F admixture and ASTM C 1017/C 1017M as a Type I admixture.
It is manufactured to substantially enhance the flowability of SCC without causing
segregation. Also, it aids concrete in acquiring high early-age compressive strength.
Consequently, it is especially appropriate for the production of SCC in
precast/prestressed applications. Although dosage rates can fluctuate with the type of
application, addition rates will typically be within the range of 3 to 10 fl. oz. /cwt (195 to
650 mL/100 kg).75

57
The second chemical admixture implemented was ADVA 170. It is a HRWR
developed for the ready-mix concrete industry. It complies with ASTM C 494/C 494M as
a Type A and F admixture and ASTM C 1017/C 1017M as a Type I admixture. ADVA
170 produces concrete mixtures that are exceptionally workable, but it also allows
concrete to be batched with low w/b for high strength. In addition, ADVA 170 improves
the slump life of concrete without lengthening the setting time. While addition rates can
be different depending on the type of application, dosage rates will normally be within
the range of 3 to 9 fl. oz. /cwt (195 to 590 mL/100 kg). ADVA 170 should be added to
the mixing water to yield optimal results.75
The final chemical admixture employed in the research program was ADVA Cast
575. ADVA Cast 575 is a polycarboxylate-based HRWR that is intended for the
production of an extensive variety of concrete mixtures, from conventional-slump
concrete to SCC. Its high efficiency, low dosage rate design allows for concrete mixtures
to be extremely workable without segregating. ADVA Cast 575 meets the requirements
of ASTM C 494/C 494M as a Type A and F admixture and ASTM C 1017/C 1017M as a
Type I admixture. It is formulated to obtain high early-age compressive strength, and is
particularly suitable for the production of SCC in precast/prestressed applications. ADVA
Cast 575 can be used to produce concrete mixtures with low w/b while preserving
desirable workability characteristics. Addition rates can be altered to meet a broad range
of performance standards. Dosage rates can vary from 2 to 10 fl. oz. /cwt (130 to 650
mL/100 kg) depending on the kind of application. However, the usual rate range is from
3 to 6 fl. oz. /cwt (195 to 390 mL/100 kg).75
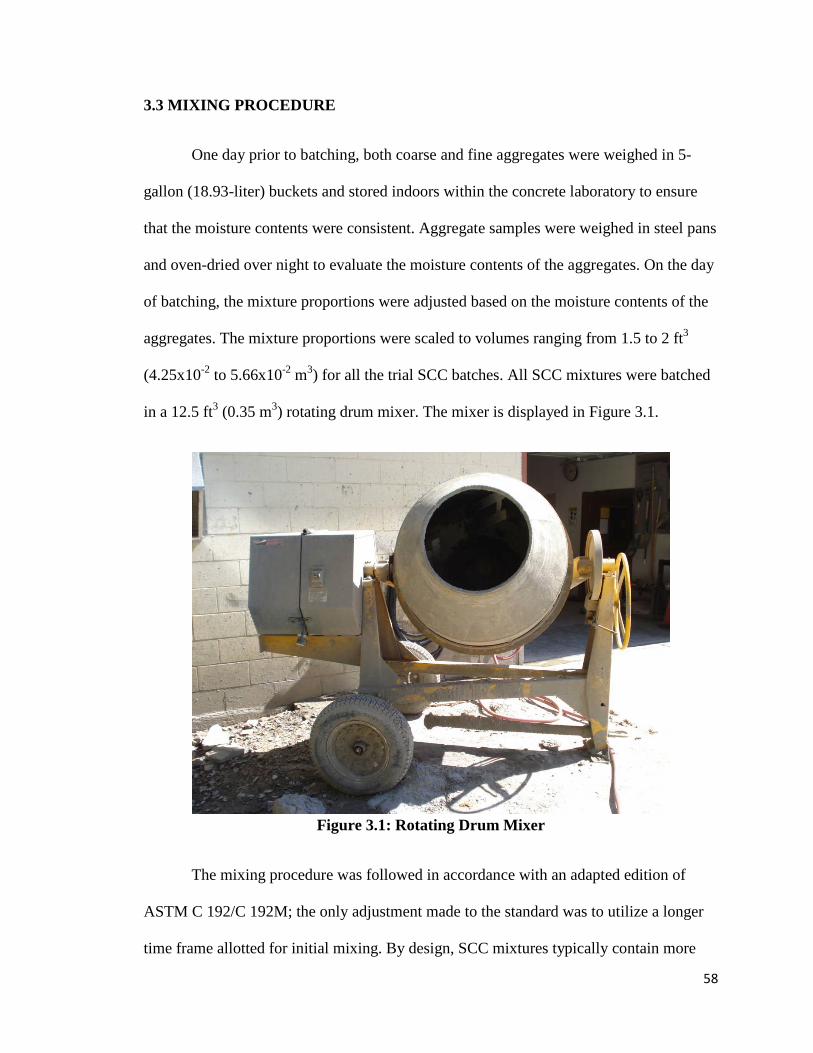
58
3.3 MIXING PROCEDURE
One day prior to batching, both coarse and fine aggregates were weighed in 5-
gallon (18.93-liter) buckets and stored indoors within the concrete laboratory to ensure
that the moisture contents were consistent. Aggregate samples were weighed in steel pans
and oven-dried over night to evaluate the moisture contents of the aggregates. On the day
of batching, the mixture proportions were adjusted based on the moisture contents of the
aggregates. The mixture proportions were scaled to volumes ranging from 1.5 to 2 ft3
(4.25x10⁻² to 5.66x10⁻² m3) for all the trial SCC batches. All SCC mixtures were batched
in a 12.5 ft3 (0.35 m3) rotating drum mixer. The mixer is displayed in Figure 3.1.
Figure 3.1: Rotating Drum Mixer
The mixing procedure was followed in accordance with an adapted edition of
ASTM C 192/C 192M; the only adjustment made to the standard was to utilize a longer
time frame allotted for initial mixing. By design, SCC mixtures typically contain more

59
paste volume than conventional concrete mixtures. According to research performed by
Chopin et al.76, when compared with coarse aggregate, it was reported that sand and fine
particles take a longer amount of time to disperse homogeneously in SCC mixtures.
Hence, the initial mixing time was lengthened with the purpose of ensuring that all the
constituent materials could diffuse uniformly. In addition, prolonging the initial mixing
time supplies extra time for the chemical admixtures to achieve their desired
effectiveness.
For every batching sequence, all the coarse aggregate and half of the mixing water
were added to the mixer as per ASTM C 192/ C 192M. At this time, the HRWR was
combined with the residual mixing water, and the mixer was activated. The measured
quantities of fine aggregate, binder, and remaining mixing water were subsequently
incorporated into the mixer. Batching commenced for a period of 5 minutes once all the
constituent materials had been integrated. The mixer was then switched off, and a 2 to 3
minute break from mixing ensued. Once the concrete had settled inside the mixer, the
mixture was assessed to determine if any additional HRWR needed to be added. After
evaluating the mixture, one of three scenarios occurred. If the concrete had segregated,
then the mixture was rejected and discarded. If the concrete was fluid and stable, then a
concluding mixing segment of 2 to 3 minutes followed. If the concrete was thick and
viscous, then additional HRWR was incorporated, and the intermediate mixing segment
proceeded for approximately 3 more minutes to enable the chemical admixtures to react
with and further disperse the binder particles. After the intermediate mixing period, the
mixer was turned off, and the concrete was reevaluated by repeating the previously

60
mentioned steps. In some trial mixtures, HRWR was incrementally added up to three
times in order to obtain adequate SCC or to cause the concrete to segregate.
It is important to note that all of the chemical admixtures were introduced
separately into the mixtures based on the type of chemical admixture. If only one HRWR
was utilized, it was combined with the residual mixing water. In certain mixtures, both
ADVA 170 and ADVA Cast 530 were implemented. The primary goal for these mixtures
was to produce a concrete sample that was extremely flowable and stable. Also, the
secondary objective was to enhance the slump life without lengthening the setting time of
the concrete. For these mixtures, the ADVA 170 was combined with the residual mixing
water and the ADVA Cast 530 was added during the break period. This procedure is
validated with research performed by Grace Construction75 on these chemical
admixtures. The findings affirm that for ADVA 170 to yield optimal results, it should be
dissolved in the residual mixing water. To promote flowability and reduce the
segregation potential of the mixture, ADVA Cast 530 would then be added during the
break period.
3.4 TESTS PERFORMED ON SCC
Immediately after mixing, the concrete was poured into a wheelbarrow and the
mixer was switched off. The wheelbarrow was then moved to a level surface where
testing would occur. Using a concrete scoop, the SCC was stirred for approximately 1
minute to ensure a uniform consistency; this was done because the last bit of concrete to

61
leave the mixture was usually paste. Fresh concrete tests were conducted promptly
thereafter. The stirring process is displayed below in Figure 3.2.
Figure 3.2: Stirring Process
3.4.1 Slump Flow
The slump flow test is simple in nature and easy to conduct. This test is most
widely used to establish the flowability properties of SCC. The only materials required to
perform the test are a concrete scoop, a traditional slump cone, a tape measure, and a flat,
level, nonabsorbent surface. The test can be executed with the slump cone in the
conventional orientation or inverted. The slump cone is first filled in one lift with
concrete. The slump cone is then lifted and the concrete spreads out. The slump flow is
measured by computing the arithmetic mean of two perpendicular diameters at the base
of the concrete. When compared with established values in the literature, the slump flow

62
measurement is an adequate indication of the flowability of the SCC mixture. Khayat and
Mitchell33 have established three defined ranges of slump flow measurements.
Specifically, low slump flow values vary from 23.5 to 25.0 in. (600 to 635 mm), normal
slump flow values vary from 26.0 to 27.5 in. (660 to 700 mm), and high slump flow
values vary from 28.0 to 30.0 in. (710 to 760 mm). Depending on the type of application,
numerous researchers specify different ranges of slump flow values. However, regarding
SCC intended for various structural applications, JSCE34 recommends low to normal
slump flows varying from 23.5 to 27.5 in. (600 to 700 mm) to ensure that the mixture
acquires sufficient self-consolidation.
3.4.1.1 Slump Flow Procedure
Prior to testing, the board (Figure 3.3) was wiped down (Figure 3.4) with a damp
sponge; this ensured saturated conditions that would promote the slump flow. In this
research program, the slump cone was inverted during testing. This approach was
implemented as a convenience to the operative; being that the cone was inverted, it was
not required for the operative to stand on the base and hold on to the handles as is the
case when the cone is set up conventionally. Immediately before testing, the slump cone
was wiped down with a damp sponge (Figure 3.5); this prevented the SCC from sticking
to the inside of the cone and allowed for a smooth transition through the outlet.

63
Figure 3.3: Slump Flow Board
Figure 3.4: Dampening the Slump Flow Board

64
Figure 3.5: Wetting the Slump Cone
A visual depiction of the inverted slump flow test procedure is shown in Figures 3.6, 3.7,
and 3.8.

65
Figure 3.6: Filling the Slump Cone
Figure 3.7: Lifting the Slump Cone

66
Figure 3.8: Measuring the Slump Flow Spread
3.4.2 T-20 (T-50)
The T-20 (T-50) test measures the time that it takes for the concrete to reach a
slump flow diameter of 20 in. (50 cm). This measurement provides an indication of the
relative viscosity of the mixture, and it is performed in conjunction with the slump flow
test as per ASTM C 1611/C 1611M. EFNARC18 recommends T-20 (T-50) values that
range from 2 to 5 seconds. Any measured time that takes less than 2 seconds indicates
that the mixture is likely too fluid and susceptible to segregation, whereas any measured
time that takes longer than 5 seconds suggests that the mixture is likely too viscous and

67
have severe blockage potential. In this research program, a stopwatch was used to obtain
all T-20 (T-50) measurements.
3.4.3 VSI
The VSI test is a subjective visual assessment of the stability of the slump flow
spread. It was utilized in the research program to establish the quality of SCC. By
evaluating the VSI, it could be determined if the particular mixture was adequate or if
modifications were needed. As stated in ASTM C 1611/C 1611M, VSI values vary from
0 to 3 in increments of 0.5. The PCI Interim Guidelines35 states that VSI values of 0 to 1
should guarantee sufficient stability. A value of 0 is assigned to a slump flow spread that
is highly stable, has a uniform distribution of coarse aggregate, has no mortar halo around
the perimeter of the spread, and has no visual indication of segregation or bleeding. The
mixture displayed below in Figure 3.9 has a VSI value of 0 and is highly recommended
for use.
Figure 3.9: Mixture with VSI equal to 0

68
A value of 1 is designated to a slump flow spread that is stable, has a uniform
distribution of coarse aggregate, has no mortar halo around the perimeter of the spread,
and has no visual indication of segregation. However, such a mixture will exhibit slight
bleeding, which is observed as a sheen on the concrete mass. The mixture shown below
in Figure 3.10 has a VSI value of 1 and is recommended for use.
Figure 3.10: Mixture with VSI equal to 1
A value of 2 is given to a slump flow spread that is unstable, has an irregular
distribution of coarse aggregate, has a slight mortar halo (less than or equal to 0.5 in.
(12.7 mm)) and/or an aggregate pile in the center of the concrete mass, and has a visual
indication of segregation or bleeding. The mixture presented in Figure 3.11 has a VSI
value of 2 due to the visible mortar halo and bleed water. This mixture is not
recommended for use until modifications are made to improve the stability.

69
Figure 3.11: Mixture with VSI equal to 2
A value of 3 is specified to a slump flow spread that is highly unstable, has an
irregular distribution of coarse aggregate, and has clearly segregated by evidence of a
large mortar halo (greater than 0.5 in. (12.7 mm)) and/or a large aggregate pile in the
center of the concrete mass. The mixture displayed in Figure 3.12 has a VSI value of 3
due to the irregular distribution of coarse aggregate, the large mortar halo, and the
indication of severe segregation. Obviously, this mixture is not recommended for use,
and adjustments should be made in subsequent trial batches.
Figure 3.12: Mixture with VSI equal to 3

70
3.4.4 J-Ring
As prescribed in ASTM C 1621/C 1621M, the J-Ring test is utilized for
evaluating the passing ability (blockage) of SCC. The J-Ring test is performed in
conjunction with the slump flow test. The test is conducted by positioning the slump cone
in the middle of the J-Ring, completely filling the slump cone with SCC, and then lifting
the slump cone. Figure 3.13 shows the setup for the J-Ring test apparatus that was used in
the research program.
Figure 3.13: J-Ring Setup
This procedure simulates the passing ability of concrete through closely spaced
impediments. Once the concrete spread has come to rest, two measurements are recorded.
The first measurement is the difference in the height of the SCC from the inside to the
outside of the J-Ring. The PCI Interim Guidelines35 recommends that this measurement

71
must be less than 0.59 in. (15 mm) in order to acquire adequate passing ability. Figure
3.14 demonstrates how this measurement was obtained.
Figure 3.14: Measuring SCC Height Difference
The second measurement is of the J-Ring flow spread, and it is evaluated by the same
process as the slump flow spread. Research performed by Khayat and Mitchell33 states
that the difference in slump flow and J-Ring flow measurements should be less than or
equal to 4 in. (100 mm) to ensure that the SCC can readily encapsulate the reinforcement.
The measurement process is shown below in Figure 3.15.
Figure 3.15: Measuring the J-Ring Flow Spread

72
3.4.5 Supplementary Concrete Tests
Additional concrete tests, such as temperature, unit weight, compressive strength,
and modulus of elasticity were also measured for some of the trial SCC mixtures. Fresh
concrete temperature was assessed as stated in ASTM C 1604/C 1604M. Fresh concrete
unit weight was calculated as indicated in ASTM C 138/ C 138M. Hardened concrete
compressive strength was computed at 1, 7, and 28 days of age following the guidelines
of ASTM C 39/ C 39M. Hardened concrete modulus of elasticity was determined at 28
days of age as per ASTM C 469. Figure 3.16 shows a photograph of three SCC cylinders
that were tested to failure in compression at 28 days of age. Also, the data acquisition
system (DAQ) and the apparatus that was used to test for concrete modulus of elasticity
are presented in Figure 3.17.
Figure 3.16: SCC Cylinders Tested in Compression

73
Figure 3.17: DAQ and Apparatus used for Modulus of Elasticity Testing
3.5 CURING
For compressive strength testing, nine cylinders were cast from each batch and
placed inside an environmental chamber. As outlined in ASTM C 192/C 192M, the
temperature inside the environmental chamber was held constant at 73°F (23°C) with a
relative humidity of approximately 50%. Testing occurred for an array of three cylinders
at 1, 7, and 28 days of age. After 24 hours had elapsed from the time of casting, all nine
cylinders were de-molded and visually evaluated for surface deficiencies. The three
cylinders that exhibited the most severe defects were tested that same day. The three
cylinders that showed moderate surface flaws were labeled to be tested at 7 days of age.

74
The last three cylinders that displayed the least amount of blemishes were labeled to be
tested at 28 days of age. The six cylinders that were not tested after the de-molding
procedure were submerged in a lime saturated water bath located in the environmental
chamber. These specimens remained in the lime saturated water until testing. Figure 3.18
displays a selection of labeled cylinders that were placed inside the tub filled with lime
saturated water to cure.
Figure 3.18: Labeled Cylinders Curing in Lime Saturated Water
For modulus of elasticity testing, three cylinders were cast from each batch and
placed inside the environmental chamber. After 24 hours had passed from the time of
casting, the cylinders were de-molded and submerged in the lime saturated water bath.

75
All three specimens were left in the lime saturated water until testing was to occur at 28
days of age.

76
CHAPTER 4
DEVELOPING SCC SPECIFICATIONS
4.1 EXPERIMENTAL PROGRAM
This portion of the research program developed fresh concrete specifications for
structures cast with self-consolidating concrete (SCC), specifically for box culverts.
However, results from this research easily apply to precast wall panels of similar size and
configuration. The experimental program consisted of selecting an SCC mix design and
then using this mix proportion to cast 11 mock box culvert wall sections. Cores were
taken throughout the depth of the wall sections and tested in compression. The
compressive strength of the concrete was examined throughout the depth of the section as
well as to cylinders cast at the same time as the wall section. The cores were also
examined for aggregate segregation as well.
4.2 MIXTURE PROPORTIONS
The research began with mixing several test batches. The test batches were used
to ensure that the fresh concrete properties of the chosen mix design were within the
desired ranges. Some adjustment of high range water reducer (HRWR) dosage was
required to get a feasible SCC mixture. The ability to vary the flow characteristics and
other fresh properties was essential to getting a good range of results. The desired range
of slump flow and T20 were between 25 and 29 in. and 2 and 5 seconds respectively. The
SCC mix proportion chosen for use in this experimental program was the result of

77
previous research at the University of Arkansas.2 This mixture was developed for use in
prestressed concrete bridge girders. Since this research only focused on the effects of
fresh concrete properties on concrete performance, the exact mix proportion was not
critical, only the fresh properties. The mix proportion used in this research is shown in
Table 4.1.
Table 4.1: SCC Mix Proportion
Material Quantity
Cement (lb/yd3) 950
Fly Ash (lb/yd3) 0
Coarse Aggregate (lb/yd3) 1350
Fine Aggregate (lb/yd3) 1474
Water (lb/yd3) 285
w/b 0.3
ADVA 170 (fl oz/cwt) 9-13a
ADVA 555 (fl oz/cwt) 0-2.0a
Note: 1 lb = 0.454 kg; 1 oz = 29.57 mL
aAdmixture dosage varied due to temperature and desired flow
The fresh concrete properties that were examined in this research include: Slump Flow,
T20 time, Visual Stability Index (VSI) and, J-Ring. Slump flow and T20 were used as a
measure of filling ability, J-Ring as a measure of passing ability and VSI as a measure of
segregation resistance.

78
4.3 PROCEDURE
4.3.1 Wall Selection and Construction
The criteria used to select the test specimen size were based upon ease of
construction and available mixer capacity. The wall sections employed were constructed
by mimicking current AHTD box culvert plans. It was determined that a 4-foot by 4-foot
barrel should be adequate for both of the previously mentioned criteria. Specifically, a
single barrel edge wall was chosen and three sets of mobile wooden forms were created.
When cast, the resulting wall sections measured 4 feet high by four feet wide, with a
thickness of 6 inches, and a required volume of concrete of 8 ft3. Also included in the
plan set were the reinforcing bar size and spacing requirements. The typically used steel
reinforcing bars were replaced with wooden dowel rods of equal diameter. Since the
wooden dowels had the same cross-section as the required reinforcing bars they created
an equivalent blocking effect. The wooden dowel rods proved quite rigid when tied and
placed in the arrangement required in the plans. No failure of dowel rods was observed
during concrete placement. Once again, the goal of this project is not to determine any
flexural or compressive strengths of the entire composite wall section, rather the strength
of the wall cores versus their molded counterparts.
4.3.2 Mixing and Pouring
In order to have an adequate amount of concrete to fill the form and perform tests,
two mixers of differing capacities were used. The first and primary mixer, a Stone,
capable of handling 12.5 ft3, contained batch sizes of 9.5 ft3. The second and alternate

79
mixer was also of the Stone brand; with a capacity of 4 ft3, this mixer was used to batch
an additional 2 ft3. The second mixer was used strictly for contingency purposes. The
required material quantities were carefully weighed in advance of each batch and the
required quantity of HRWR was added to the mixing water.
For each pour, the wall form was placed on level ground and the mix was
introduced via a wheelbarrow at one end only. A small trough was created to help
channel and minimize loss of material during placement into the wall form. When
poured into the trough, the concrete was allowed to flow on its own and fill the form
without any method of vibration being utilized. Shovels were used to help regulate the
flow for both fast and slow moving mixes. Once the forms were filled, hooks were
placed in top of the walls to allow for transport once the concrete had sufficiently set.
The forms were not removed for a minimum of 20 hours after the final placement.
4.3.3 Testing
Slump flow tests were performed in accordance with ASTM C 1611. The
research team preferred the inverted cone method based on previous experience and its
ease of use. The cone was filled in one lift; afterwards, the cone was raised and the
concrete was allowed to flow until it ceased. Next, the maximum diameter of the
displaced concrete was measured, and another measurement was taken perpendicular to
the first measurement. Measurements were made to the nearest ¼ in. The two resulting
values were then averaged and recorded to the nearest ½ in. Two slump flow tests were

80
performed for each batch since some previous research has indicated increasing slump
flows over the short term.
When the slump flow test is performed, the time in which it takes for the sample
to reach a 20 inch diameter is known as the T20 time. The test method is also from
ASTM C 1611. The researchers utilized a board specific for testing SCC. The board
essentially provides a template for placement of the inverted slump cone and a clearly
marked 20 inch diameter ring. Since two slump flow tests were conducted for each
batch, two T20 values were also recorded.
The Visual Stability Index or VSI, has its basis in ASTM C 1611 as well. The
purpose of this test is to categorize the stability of a mix by observing the concrete once it
has been displaced from the slump cone. The sample is indexed from 0 to 3 in
increments of 0.5. For the scale, 0 indicates the best possible mix, one that includes no
segregation, mortar halo, or bleed water. A value of 3 indicates the worst possible case: a
heavily segregated mix which includes a pile of aggregate surrounded by a thin, wide
spread of paste with very little aggregate interspersed. The outer edges of this sample
will have a ring of paste, known as mortar halo, as well as bleed water which may be seen
as a discoloration on or around the edges of the sample and a sheen on the surface.
The J-Ring test is also used in conjunction with the slump flow test. The J-Ring
test was performed in accordance with ASTM C 1621. The J-ring contains 16 vertical
bars of ⅝ in. diameter and 4 in. height evenly spaced around a 12 in. diameter ring. The
ring serves to simulate the ability of the mix to pass through rebar similar to field
conditions. For the test to be performed, the ring is placed on the testing surface and the

81
inverted slump cone is placed inside of the ring. The slump cone is filled and lifted in
accordance with ASTM C 1621. Once the concrete has stopped flowing, a diameter is
measured across the largest part of the displaced concrete mass and a second diameter is
measured perpendicular to the first. These measurements are made to the nearest ¼ in.
and then the average of the two is taken to the nearest ½ in. In addition to the J-ring
flow, the height difference between the inside and outside the ring was measured to the
nearest ¼ in.
4.4 RESULTS
The fresh concrete properties of each batch along with one day compressive
strengths are shown in Table 4.2. Slump flow tests were performed before and after the
J-Ring test for each batch and the first slump flow was recorded as the official value. The
overall values of fresh concrete properties gave a good representation of the target range
as well as covering values just outside of that range. VSI values were consistently
between 0 and 1 with only two of the batches showing significant segregation. One day
compressive strengths met the desired value for all batches except for Batch 11, where
segregation was readily noticeable.
4.4.1 Slump Flow
Slump flows varied between 15 in. and 37.5 in. This range easily covered the
desired range of 25.5 to 29.0 in. as well as values on both the high and low side of the

82
desired range. These limits show that both the extremes of basically high slump concrete
(non SCC) and segregated mixtures were examined as well as everything in between. All
batches except Batch 11 met the target values for strength at one day. Wall sections cast
with Batches 5, 6, 7, and 9 (having slump flows in the desired range) had a good surface
finish without significant bugholes. An example can be seen in Figure 4.1. Walls cast
with batches having a slump flow larger than the desired range also showed a good finish.
Low slump flows led to significant bug holes and a poor finish as can be seen in Figure
4.2.

83
Table 4.2: Summary of Concrete Properties
Batch Slump
Flow (in.) T20
(sec) VSI J-Ring Flow (in.)
J-Ring ΔH (in.)
1 Day fc
1* NA NA NA NA NA NA 2* 18.5 NA NA NA NA NA 3* 26.0 NA 0 27.5 NA NA 4* 27.5 NA 1 27.5 0.50 7670 5 27.0 NA 1 27.5 0.75 6880 6 26.5 10.4 1 27.5 0.50 7500 7 26.5 8.4 1 27.0 0.25 NA 8 22.5 9.8 0 22.0 1.00 6720 9 27.5 6.4 0 30.0 0.25 7420 10 21.0 15.6 0 19.0 1.75 7600 11 37.5 1.6 2.5 41.0 0.00 2330 12 31.0 3.8 2 29.5 0.75 6290 13 24.0 5.0 0 22.5 1.00 6510 14 29.5 4.0 1 27.0 0.50 6230 15* 15.0 NA NA NA NA NA 16 16.0 NA NA NA NA 6190
*Indicates test batch only.
Figure 4.1: Wall 7 Showing Good Slump Flow

84
Figure 4.2: Wall 16 Showing Poor Slump Flow
Since previous research at the University of Arkansas had indicated5 that slump
flows tended to increase over the short term, a second slump flow test was performed
after each J-Ring test. These tests yielded some interesting results. A comparison of the
first set of slump flow tests to the second set are shown in Table 4.3. Batches 4, 5, 6, 7,
8, 9, and 11 showed an increase in slump flow in the approximately 10 minutes between
tests. This increase ranged from 0.5 in to 4 in. The source of the increase in slump flow
is unclear, but may be caused by water exiting the aggregate as the concrete sits, or by
continued action of the HRWR. Batches 10, 12, 13, 14, and 16 showed a decrease in
slump flow, as would typically be expected. T20 times followed the same pattern as
slump flows, with lower T20 when slump flow increased and higher T20 when slump flow
decreased.

85
Table 4.3: Comparison of Slump Flow Tests
First Trial Second Trial
Batch Slump Flow
(in.) T20
(sec) VSI
Slump Flow (in.)
T20 (sec)
VSI
1 NA NA NA NA NA NA 2 18.5 NA NA NA NA NA 3 26.0 NA 0 NA NA NA 4 27.5 NA 1 31.5 NA NA 5 27.0 NA 1 29.0 NA 1 6 26.5 10.4 1 28.5 NA 1 7 26.5 8.4 1 30.0 6.4 1 8 22.5 9.8 0 25.0 7.6 1 9 27.5 6.4 0 30.5 4.0 1 10 21.0 15.6 0 19.5 20.0 0 11 37.5 1.6 2.5 38.0 4.4 2.5 12 31.0 3.8 2 31.0 4.0 2 13 24.0 5.0 0 22.0 7.2 0 14 29.5 4.0 1 27.5 4.2 1 15 15.0 NA NA NA NA NA 16 16.0 NA NA 15.0 NA NA
4.4.2 T20 Time
T20 times covered a broad range with a minimum of 1.6 seconds and a maximum
of 15.6 seconds. Wall sections cast with Batches 12, 13, and 14, exhibiting T20 times in
the desired range of 2 to 5 seconds, had a good finish with a minimum amount of
bugholes. Figure 4.3 shows the surface finish of the wall cast with Batch 12. Wall 11
had a very low T20 but showed some poor surface finish due to segregation. Batches with
a high T20 but good slump flow yielded a good surface finish as well. However, since T20
is a measure of filling ability, consequences of high T20 times may not be discovered until
cores are examined. The mixture used in this research program tended to have a high

86
viscosity and more batches are necessary to obtain additional data points for low T20
times.
Figure 4.3: Wall 12 Showing Good T20 4.4.3 VSI
All batches had a VSI in the target range of 0 to 1 except for Batches 11 and 12.
Batch 11 showed significant segregation (VSI of 2.5) and the wall cast with this batch
had a substantial amount of bugholes. Batch 12 showed moderate segregation (VSI of 2),
but the wall had a good surface finish. As mentioned previously, the cores will give a
much better indication of how this segregation affected concrete performance. The low
VSI values for all other batches indicate adequate segregation resistance.
4.4.4 J-Ring
Differences between slump flow and J-Ring flows were typically less than 2 in.
However, in some cases the J-Ring flow was higher than the slump flow. The increase

87
could also be attributed to the water in the aggregate or HRWR action mentioned in the
slump flow section. This result was true for Batches 3, 5, 6, 7, 9, and 11. The difference
in height inside and outside the J-Ring was seemingly more consistent in showing the
true value of blockage. Height differences varied from 0.25 in. to 1.75 in. From previous
research, a height difference of 0.5 in. or less indicated minimal blockage. Batches 4, 6,
7, 9, 11, and 14 exhibited this characteristic. This implies that all other batches had some
measure of blockage. Only Batches 10, 15, and 16 had a value higher than 1 in. All
three of these batches had low slump flows and batch 15 was not used to cast a wall
section. The J-Ring values will be useful when examining the cores from the wall
sections to determine how the reinforcement affected consolidation of the concrete.
4.4.5 Compressive Strength
All batches for which cylinders were cast met the target one day compressive
strength of 6000 psi except for Batch 11, which had significant segregation. Since the
target compressive strength was met at one day, core strengths should meet the target
compressive strength at time of testing. The variation of compressive strength with
slump flow and T20 is shown in Figures 4.4 and 4.5 with the target range of fresh
properties indicated.

88
Figure 4.4: Variation of One Day Strength with Slump Flow
Figure 4.5: Variation of Compressive Strength with T20
4.4.6 Aggregate Distribution
Each wall slab was cored in nine locations which are identified in Figure 4.6. The
approximate locations of the cores are identified by Row and Column number. Also
shown in Figure 4.6 are the corresponding compressive strengths and aggregate
0
1000
2000
3000
4000
5000
6000
7000
8000
0.0 10.0 20.0 30.0 40.0
Slump Flow (in.)
Com
pres
sive
Stre
ngth
(psi)
25.5 29.0
0
1000
2000
3000
4000
5000
6000
7000
8000
0.0 5.0 10.0 15.0 20.0
T20 (sec)
Com
pres
sive S
treng
th (p
si)
2.0

89
distributions for the cores of Wall 5. The compressive strength or aggregate distribution
for each core location and wall section is given in Table 4.4.
Each wall specimen was cored in new locations. Three cores equally spaced
along the top of the wall, three cores equally specimen in the center of the specimen, and
three along the bottom of the specimen. For each row, two of the three cores were tested
in compression and the third core was used to measure aggregate distribution. To
measure aggregate distribution, the core was cut lengthwise and the number of coarse
aggregate particles was counted. This number was then divided by the area of the core.
For Wall 5 (Figure 4.6), the aggregate distribution was 7.53 aggregate particles per
square inch (agg./in.2) in Row 1, 7.88 agg./in.2 in Row 2, and 5.81 agg./in.2 in Row 3.
Likewise, the compressive strength ranged from a low of 13,170 psi to a high of 15,000
psi. Data from all wall sections along with the fresh concrete properties are shown in
Table 4.4.
For all samples, the average number of coarse aggregate particles per square inch
of concrete was 7.02. The lowest aggregate count per square inch was 5.51 and the
greatest was 8.74. All mixtures no matter the fluidity had aggregate distribution near the
average. For example, Wall 10 which was a very viscous mixture had a slump flow of 21
in. and a T20 of 15.6 seconds, but the aggregate was evenly dispersed through the wall
section. This mixture was an extremely stable mixture with little to no potential of
segregation. However, Wall 11 had a slump flow of 37.5 in. and a T20 of 1.6 seconds.
This mixture had a very low viscosity and therefore a high potential for segregation, but
the aggregate distribution ranged from 6.91 to 8.74 agg./in2. For all wall sections, the
greatest disparity amongst samples from the same wall was approximately 2 agg./in.2.
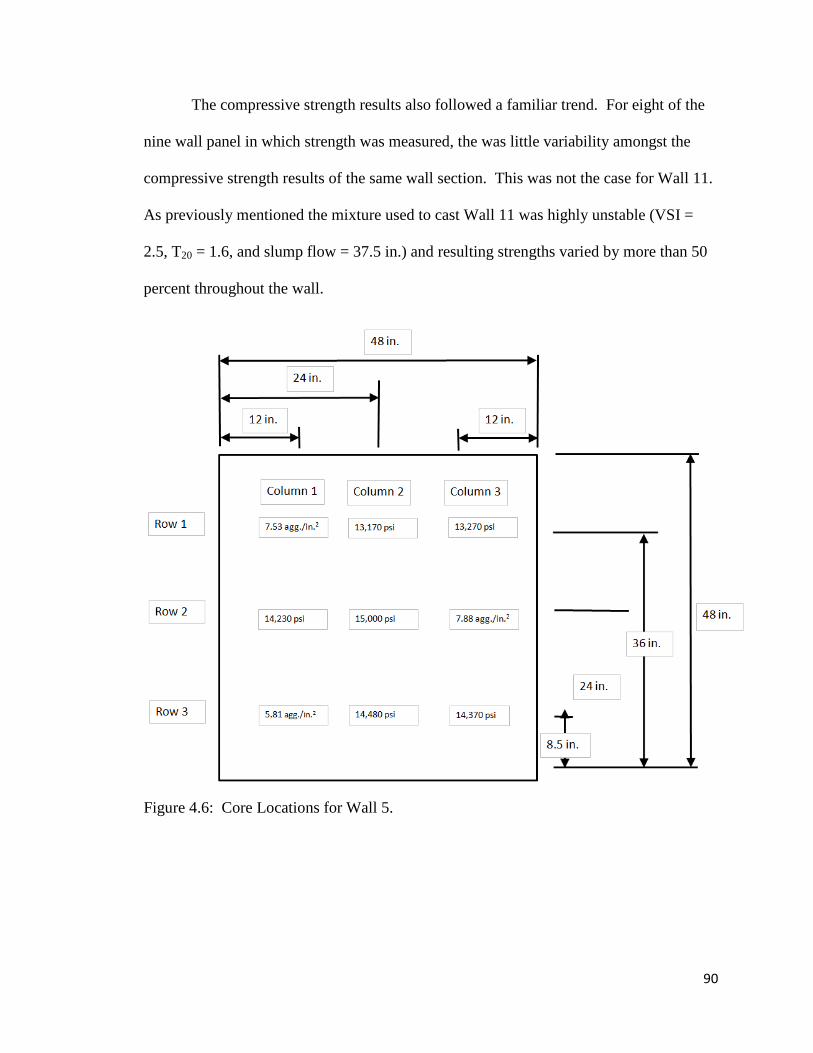
90
The compressive strength results also followed a familiar trend. For eight of the
nine wall panel in which strength was measured, the was little variability amongst the
compressive strength results of the same wall section. This was not the case for Wall 11.
As previously mentioned the mixture used to cast Wall 11 was highly unstable (VSI =
2.5, T20 = 1.6, and slump flow = 37.5 in.) and resulting strengths varied by more than 50
percent throughout the wall.
Figure 4.6: Core Locations for Wall 5.

91
Table 4.4: Aggregate Distribution and Core Strength.
Wall ID
Fresh Concrete Properties Row
Column Flow (in.)
T20 (sec)
VSI J-Ring (in.)
J-Ring ΔH (in.)
1 2 3
5 27.0 - 1.0 27.5 0.50 1 7.53A 13,710 13,270 2 14,230 15,000 7.88 3 5.81 14,440 14,370
6 26.5 10.4 1 27.5 0.50 1 14,730 12,960 7.44 2 13,970 13,260 7.01 3 11,970 8.47 12,840
7 26.5 8.4 1 27.0 0.25 1 6.41 14,280 14,530 2 12,010 6.82 - 3 14,840 12,990 6.61
8 22.5 9.8 0 22.0 1.00 1 12,630 13,930 7.22 2 12,580 13,130 7.04 3 14,170 14,200 7.34
9 27.5 6.4 0 30.0 0.25 1 12,990 13,810 7.22 2 13,260 6.77 13,000 3 6.57 13,820 13,090
10 21.0 15.6 0 19.0 1.75 1 13,090 7.27 14,420 2 13,450 7.00 12,330 3 14,360 13,600 6.03
11 37.5 1.6 2.5 41.0 37.5 1 8,820 8.39 8.54 2 5,920 8,590 8.74 3 6.91 5,590 7,582
12 31.0 3.8 2 29.5 0.75 1 6.42 11,590 12,990 2 13,090 11,480 7.15 3 8.08 12,220 8.10
13 24.0 5.0 0 22.5 1.00 1 12,800 7.17 14,590 2 12,400 6.13 13,220 3 13,670 6.80 12,790
14 29.5 4.0 1 27.0 0.50 1 6.88 7.74 6.11 2 6.95 6.93 5.95 3 5.92 7.02 5.86
16 16.0 NA NA NA NA 1 6.43 5.81 5.51 2 6.27 6.00 7.59 3 6.37 7.35 7.69
A = Bold and italicized numbers represent coarse aggregate distribution per square inch of the core. The remaining numbers represent concrete compressive strength in psi.

92
4.5 CONCLUSIONS
Conclusions from this portion of the research project are summarized below.
• Mixtures with slump flows within the target range of 25 in. to 29.0 in. yielded
wall sections with a good surface finish.
• Mixtures with T20 times within the target range of 2-5 seconds yielded wall
sections with a good surface finish.
• Mixtures with low slump flows and high T20 times resulted in wall sections with a
very poor surface finish.
• Surface finish of the wall sections was affected by a combination of slump flow
and T20.
• All mixtures except one with very significant segregation reached the target
compressive strength of 6000 psi at one day.

93
CHAPTER 5
RESULTS AND DISCUSSION
5.1 INTRODUCTION
Chapter 5 is separated into two sections. The opening section explains the
development process of a SCC mixture using only Type I portland cement as the binder
constituent. The next section investigates the use of Class C FA in SCC mixtures;
replacement rates of cement with FA were utilized in increments of 5, 10, 15, 20, and
25%. There are forty batches separated into seven phases that present the experimental
procedure of developing a SCC mixture with Type I portland cement. An additional
twelve batches (two phases) were examined to develop SCC mixtures with different
replacement rates of FA. This chapter also presents quandaries that the author
experienced throughout the development process coupled with an explanation of how the
dilemmas were overcome. Finally, a methodology for developing SCC mixtures based
upon the findings of this research program will be presented.
5.2 SELECTION/DETERMINATION OF CONSTITUENT MATERIALS
Initially, the mixture proportions were chosen based on AHTD’s Standard
Specifications5. The minimum binder content for structural concrete is 6.5 bags (611
lb/yd3, 362.49 kg/m3) per cubic yard. Binder is one of if not the most expensive
component in any given concrete mixture. Hence, contractors will typically utilize the

94
minimum specified binder content for concrete mixtures in an attempt to reduce costs.
For this reason, 611 lb/yd3 (362.49 kg/m3) was the preliminary quantity of binder that
was used. Also, the Standard Specifications5 state that the water-to-binder ratio (w/b)
should not exceed a value of 0.49 (a value of 0.44 was recommended). Accordingly, this
value (w/b = 0.44) was implemented in every trial mixture with the exception of the first.
The water content was established by multiplying the binder content by the w/b. All the
SCC mixtures were designed to be non-air-entrained; this corresponds to an assumed air
content of 2%. The total volume of aggregate was calculated by applying the ACI
Absolute Volume Method20. The proportion of fine aggregate was determined via
multiplying a selected S/Agg value “0.52” (based upon recommended S/Agg values from
literature77) by the total volume of aggregate. Subsequently, the amount of coarse
aggregate was computed by subtracting the volume of fine aggregate from the total
aggregate volume. An example mixture design analysis that was performed for the first
mixture is shown in Appendix A.
5.3 DEVELOPING SCC USING TYPE I PORTLAND CEMENT
5.3.1 Phase 1 – Binder Content
As previously discussed in the literature review (Section 2.4.1), there are
essentially three mixture proportioning procedures that can be followed to obtain SCC.
The first method was primarily followed in this research program because multiple SCMs
were not utilized in any of the trial mixtures. However, it should be noted that the third
“combination” method was used in the trial mixtures containing FA.

95
The mixture proportions of the first trial batch are shown below in Table 4.1. In
addition to those constituents, ADVA Cast 530 was incorporated to promote the
flowability. An initial dosage rate of 3 fl. oz. /cwt (195 mL/100 kg) was selected. This
addition rate is listed on the low end of the manufacturer’s “Grace Construction75”
recommended range.
The mixture was batched as previously discussed in the experimental procedure
(Section 3.3). During the break period, the concrete was evaluated for flowability and
stability. For the purpose of this research program, stability is defined as the resistance of
SCC mixtures to the onset of segregation. Upon assessment, the mixture seemed dry and
still appeared to have a slump. This mixture failed because it did not flow. The target
slump flow for the mixture was anywhere within the range of 23.5 to 30.0 in. (600 to 760
mm). Figure 4.1 shows the mixture after the slump flow test was performed.
Figure 5.1: Slump Flow of the First Mixture

96
As can be seen in the figure, the concrete still had a slump. Consequently, the mixture
was discarded.
For the second batch, the w/b was increased to the recommended value of 0.44. In
order to account for this increase in water volume, the proportions of fine and coarse
aggregate were reduced slightly. Also, to enhance the flowability, a total of 5 fl. oz.
HRWR/cwt (326 mL/100 kg) was implemented. This sum consisted of 2.5 fl. oz. ADVA
Cast 530/cwt (163 mL/100 kg) and 2.5 fl. oz. ADVA 170/cwt (163 mL/100 kg). All other
mixture parameters were held constant. When tested, there was only a slight
improvement in workability when the results were compared with those of the first
mixture. This mixture also had a slump, so it was rejected.
In the next mixture, only ADVA 170 was added. A dosage rate of 5 fl. oz. /cwt
(326 mL/100 kg) was incorporated in an attempt to further increase the workability of the
concrete. The proportions of all additional constituents remained unchanged.
The mixture was evaluated during the break period, and upon assessment the
concrete appeared thick and viscous. The slump flow test was conducted on the batch;
however, it was determined that this mixture still had a slump as well. This mixture failed
because the concrete did not flow.
After three SCC mixtures had been batched with unsatisfactory results, a new
strategy was developed. The previous mixtures were unable to flow and self-consolidate
due to an insufficient amount of water that was made available in the mix design. The
w/b was recommended to be 0.44, so this parameter was held constant. The only other
way to allow for more water during mixing was to increase the binder content.
97
In the fourth trial mixture, the binder content was increased from 611 lb/yd3
(362.49 kg/m3) to 711 lb/yd3 (421.82 kg/m3). To account for this increase in binder
volume, the fine and coarse aggregate volumes were reduced significantly. When
compared with the previous mix design it was evident that the 100 lb/yd3 (59.33 kg/m3)
increase in binder content resulted in an increase in water content from 269 lb/yd3
(159.59 kg/m3) to 313 lb/yd3 ( 185.70 kg/m3). This adjustment allotted for 16.36% more
water to be utilized during mixing. All other design constraints were held constant.
When the mixture was evaluated during the break period it appeared workable
and stable. The slump flow test was subsequently performed. The results of the test
yielded a 14 in. (355.6 mm) slump flow. In addition, a VSI value equal to 1 was
warranted. The concrete proved to be workable and stable, and it did not exhibit any
indication of segregation or bleed water. However, because the mixture failed to acquire
a slump flow that was greater than or equal to 23.5 in. (600mm), it was discarded.
For the fifth mixture, all the mixture proportions remained constant (when
compared with the fourth mixture). However, the ADVA 170 dosage was increased to 7.5
fl. oz. /cwt (489 mL/100 kg); this was done to increase the mixture’s flowability. When
the slump flow test was conducted, segregation and bleed water were not observed. A
slump flow of 18.5 in. (469.9 mm) and a VSI value of 1 were recorded. Although the
additional ADVA 170 did increase the flowability of the mixture, the desired slump flow
was still not acquired. Thus, this mixture also failed.
The first five mixtures complete Phase 1 of the trial batching process. The mix
designs for these mixtures along with the corresponding slump flow test data are

98
presented in Table 5.1. It is important to note that since all of these mixtures proved to be
inadequate to classify as SCC, no further fresh or hardened concrete tests were
performed.
Table 5.1: Phase 1 Mix Designs and Slump Flow Data
Materials Mixtures 1 2 3 4 5
Total Cementitious Materials (lb/yd3) 611 611 611 711 711 Fly Ash (%) --- --- --- --- ---
Coarse Aggregate (lb/yd3) 1550 1527 1527 1429 1429
Fine Aggregate (lb/yd3) 1631 1606 1606 1506 1506
Water (lb/yd3) 251 269 269 313 313 Water/Binder 0.41 0.44 0.44 0.44 0.44
Sand/Aggregate 0.52 0.52 0.52 0.52 0.52 ADVA CAST 530 (fl oz./cwt) 3 2.5 --- --- ---
ADVA 170 (fl oz./cwt) --- 2.5 5 5 7.5 ADVA CAST 575 (fl oz./cwt) --- --- --- --- ---
Fresh Concrete Properties Slump Flow (in.) --- --- --- 14 18.5
Segregation Observed --- --- --- no no VSI --- --- --- 1 1
Bleed Water --- --- --- no no
T-20 (sec) --- --- --- --- ---
For the next phase of mixtures, the objective was to further improve the
rheological properties. To accomplish this, the binder content was increased to 811 lb/yd3
(481.15 kg/m3). The methodology behind this adjustment is more thoroughly explained in
the following section.
99
5.3.2 Phase 2 – Increasing Binder Content to 811 lb/yd3
Since the specified binder content and ADVA 170 dosage rate for the fifth
mixture (Table 4.1) were unsatisfactory, the author elected to further increase the binder
content. This step was taken because the mixture’s flowability needed to increase without
exceeding the manufacturer’s maximum recommended dosage rate of ADVA 170.
Therefore, for the sixth mixture, the binder content was increased from 711 lb/yd3
(421.82 kg/m3) to 811 lb/yd3 (481.15 kg/m3). This increase in binder content decreased
the fine and coarse aggregate proportions. Also, when compared with the previous mix
design (mixture # 5), it was apparent that the 100 lb/yd3 (59.33 kg/m3) increase in binder
content increased the water content from 313 lb/yd3 (185.70 kg/m3) to 357 lb/yd3 (
211.80 kg/m3). This adjustment allowed for 14.06% more water to be utilized during
mixing. The ADVA 170 dosage rate was reduced to 5 fl. oz. /cwt (326 mL/100 kg) to
diminish the likelihood of segregation occurring.
The mixture was assessed during the break period. For the first time, the concrete
appeared to be fluid. The results of the slump flow test displayed a concrete spread that
had no evidence of segregation or bleed water. Additionally, a slump flow of 25 in. (635
mm), a VSI value of 0, and a T-20 (T-50) of 5.37 seconds were recorded. The slump flow
of mixture # 6 is presented in Figure 5.2.

100
Figure 5.2: Slump Flow of Mixture # 6
Upon performing the J-Ring test, the height difference between concrete inside
and outside the J-Ring was recorded to be 0 in. (0 mm), and the difference between the
slump flow spread and the J-Ring spread was documented to be 1 in. (25.4 mm).
Consequently, this mixture proved to be an adequate SCC mixture because all of the
fresh concrete properties were consistent with those found in the literature to classify
acceptable SCC mixtures.
Since the results of the fresh concrete tests indicated that this mixture was an
acceptable SCC mixture, compressive strength testing was also performed to determine if
the hardened properties would satisfy requirements (3500 psi, (24.0 MPa) at 28 days)
present in the Standard Specifications5. The 1, 7, and 28-day breaks had averages of

101
2940, 7310, and 9490 psi (20.25, 50.37, 65.41 MPa), respectively. The 28-day strength
exceeded the minimum specified compressive strength by more than 271%. Thus, it was
confirmed that mixture # 6 would also develop adequate compressive strength as well.
5.3.2.1 S/Agg
A broad range of S/Agg values was recommended in the literature.77 Therefore,
the author chose to examine each one and determine the effect that it had on the
properties of SCC. Seeing as the sixth mixture performed so well, the only adjustment
that was made for the seventh mixture was to increase the S/Agg from 0.52 to 0.54. All
other mixture proportions were held constant. A slump flow of 26 in. (660.4 mm) was
reported. The spread did not segregate, but some bleed water was present; this justified a
VSI designation equal to 1. The slump flow for this mixture is shown below in Figure
5.3.
Figure 5.3: Slump Flow of Mixture # 7

102
When compared with mixture # 6, the T-20 (T-50) decreased; a time of 5.16
seconds was recorded. The author attributes this to the increase in fine aggregate content
which elevated the concentration of fine particles and resulted in a more fluid transition
through the outlet of the inverted slump cone. The results of the J-Ring test showed the
height difference between concrete inside and outside the J-Ring to be 0.5 in. (12.7 mm),
and the difference between the slump flow spread and the J-Ring spread was reported to
be 2.5 in. (63.5 mm). Finally, mixture # 7 developed strength in compression that was
similar to mixture # 6. The average 28-day compressive strength was 9680 psi (66.73
MPa). Accordingly, mixture # 7 was also established to be an acceptable SCC mixture.
For mixture # 8, the S/Agg was further increased to 0.56. All the other mixture
design parameters remained the same. This mixture had a slump flow equal to 27.5 in.
(698.5 mm), which was an increase compared with that of mixture # 7. However, the
slump flow patty had visibly segregated; a small aggregate pile was present in the center
of the spread and a small mortar halo was displayed around the perimeter of the spread.
Hence, a VSI value of 2 was given for the mixture. The T-20 (T-50) value decreased to
4.53 seconds; the author attributes this to the same phenomenon described in the previous
paragraph. The J-Ring test confirmed that segregation had occurred as well. The height
difference between concrete inside and outside the J-Ring increased to 1 in. (25.4 mm),
and the difference between the slump flow spread and the J-Ring spread increased to 4 in.
(101.6 mm). The recorded 28-day compressive strength was 7880 psi (54.30 MPa). When
compared with the 28-day compressive strength of mixture # 7 that is a reduction of
18.63%. The author believes that the reduction in strength is directly related to the
103
segregation that occurred. As a result of the segregation, this mixture was proven to be
inadequate.
In the ninth mixture, the S/Agg was decreased from the initial starting point of
0.52 to 0.50. The other mixture proportions remained unchanged. The slump flow for this
mixture was 25.5 in. (647.7 mm), and the T-20 (T-50) time was 6.03 seconds. No visible
segregation or bleed water was present, so a VSI of 0 was issued. The results of the J-
Ring test indicated that the blockage potential of the mixture was not significant. Also,
the 28-day compressive strength for this mixture was 9380 psi (64.65 MPa). Therefore,
this mixture was validated as a suitable SCC mixture.
For mixture # 10, the S/Agg was further decreased to a value of 0.48. All the other
mixture constituents were held constant. A slump flow of 23.5 in. (596.9 mm) was
documented, and the measured T-20 (T-50) time was 4.89 seconds. The mixture did not
segregate, but a small amount of bleed water was present across the slump flow spread;
this rationalized a VSI value of 1. The height difference between concrete inside and
outside the J-Ring was 0.75 in. (19.05 mm), and the difference between the slump flow
spread and the J-Ring spread was 2.5 in. (63.5 mm); these results signified that this
mixture had slight to moderate blockage potential. In addition, the average 28-day
compressive strength was 9610 psi (66.23 MPa). Mixture # 10 was classified as a
passable SCC mixture. However, the blockage potential of the mixture was a cause for
concern.
The trend of decreasing the S/Agg continued in mixture # 11. For this mixture, the
S/Agg that was utilized was 0.46. The other mixture proportions did not change. The

104
measured slump flow was 22 in. (558.8 mm). While the spread did not segregate, it did
have more bleed water than was present in mixture # 10. Therefore, the spread was
designated a VSI equal to 1.5. The T-20 (T-50) time measured was 7.64 seconds; this was
a significant increase in time from the T-20 (T-50) of mixture # 10 considering that the
slump flow for mixture # 11 was smaller in diameter. The author believes that the
increase in coarse aggregate content (which occurred by decreasing the S/Agg) is the
reason why it took longer for the slump flow to reach a diameter of 20 in. (50 cm). The
quantity of larger particles present decreased the amount of fines within the mixture,
which caused more congestion at the outlet of the inverted slump cone during the slump
flow test. While the concrete mixture was flowable, it did not acquire the flowability
necessary to classify it as SCC. Therefore, the J-Ring test and compressive strength
testing were not conducted for mixture # 11.
5.3.2.2 Flowability
In the twelfth mixture, the S/Agg and all the other mixture components with the
exception of the ADVA 170 dosage were held constant. For this mixture, the objective
was to enhance the flowability. Therefore, the ADVA 170 dosage rate was increased to 6
fl. oz. /cwt (391.19 mL/100 kg).
The results of the slump flow test were surprising. The slump flow did increase to
26.5 in. (673.1 mm). However, the spread had clearly segregated. A large aggregate pile
was located in the center of the concrete mass, and a considerable mortar halo had
developed around the entire perimeter of the spread. Hence, a VSI value of 3 was given
105
to the mixture. The recorded T-20 (T-50) time was 9.07 seconds. The author attributes
this lengthy T-20 (T-50) measurement to the severe segregation that occurred between
the aggregates and the cement paste. Within the inverted slump cone, the concrete
diffused into two sections; the aggregates sank to the bottom while the cement paste
rested above it. When the slump cone was initially lifted, blockage had occurred at the
outlet. It took a few seconds for the weight of the cement paste to take effect and unclog
the outlet, but once the outlet had been cleared the cement paste was able to flow out with
ease.
The height difference between concrete inside and outside the J-Ring was 1.25 in.
(31.75 mm), and the difference between the slump flow spread and the J-Ring spread was
1 in. (25.4 mm); these results indicated that this mixture had severe blockage potential.
The majority of aggregate particles were stacked up inside the J-Ring, while most of the
cement paste was able to flow around the deformed bars.
Mixture # 12 acquired an average 28-day compressive strength of 7490 psi (51.63
MPa). The results of the compressive strength testing regimen were significantly lower
than previous mixtures’ that were batched with the same w/b and binder content. This is
likely due to the occurrence of segregation, which ultimately led to this mixture failing to
qualify as an acceptable SCC mixture. The cylinders that were broken at twenty-eight
days of age are displayed in Figure 5.4 below. As can be seen in the photograph,
numerous bug holes are present on each of the three cylinders. The author also attributes
this occurrence to segregation.

106
Figure 5.4: Compressive Strength Cylinders for Mixture # 12 at 28 Days
The author decided that for mixture # 13 the S/Agg would be decreased to 0.44.
The other mixture design constraints did not change from those used in mixture # 12. The
results of the slump flow test yielded a spread of 23 in. (584.2 mm). The spread had no
evidence of segregation or bleed water, so a VSI value of 0 was granted. The T-20 (T-50)
measurement was 6.57 seconds. This mixture was flowable; however, since the spread
failed to reach the desired diameter of at least 23.5 in. (596.9 mm), the mixture failed. For
that reason, the mixture was discarded and no further tests were performed.
The only modification that was made in mixture # 14 was that 7 fl. oz. ADVA
170/cwt (456.39 mL/100 kg) was incorporated. This increase in HRWR increased the
slump flow spread to 28.5 in. (723.9 mm). However, upon viewing the spread, it was
apparent that the mixture had segregated; an aggregate pile was present in the center of
the spread and a large mortar halo had formed around the perimeter. Therefore, a VSI
value of 3 was issued. The recorded T-20 (T-50) time was 11.44 seconds. The author
107
expects that the extended spread time occurred due to the same incident (segregation) that
transpired in mixture # 12.
The height difference between concrete inside and outside the J-Ring was 1.5 in.
(38.1 mm), and the difference between the slump flow spread and the J-Ring spread was
3.5 in. (88.9 mm). Due to severe segregation, it was clear that this mixture was
susceptible to blockage problems.
The average 28-day compressive strength for mixture # 14 was 7130 psi (49.18
MPa). Although segregation had reduced the strength of the concrete, the cylinders were
still able to acquire strengths that exceeded the minimum by more than 203%.
Nevertheless, due to the blockage concerns associated with the fresh concrete properties,
this mixture failed to classify as an acceptable SCC.
The nine aforementioned mixtures complete Phase 2 of the trial batching process.
The mix designs for these mixtures along with the subsequent slump flow, J-Ring, and
compressive strength data are displayed in Table 5.2.

108
Table 5.2: Phase 2 Mix Designs and Test Results
Materials Mixtures 6 7 8 9 10 11 12 13 14
Total Cementitious Materials (lb/yd3) 811 811 811 811 811 811 811 811 811
Fly Ash (%) --- --- --- --- --- --- --- --- --- Coarse Aggregate
(lb/yd3) 1332 1277 1222 1388 1443 1499 1499 1554 1554 Fine Aggregate
(lb/yd3) 1402 1455 1509 1347 1294 1240 1240 1186 1186 Water (lb/yd3) 357 357 357 357 357 357 357 357 357 Water/Binder 0.44 0.44 0.44 0.44 0.44 0.44 0.44 0.44 0.44
Sand/Aggregate 0.52 0.54 0.56 0.5 0.48 0.46 0.46 0.44 0.44 ADVA CAST 530
(fl oz./cwt) --- --- --- --- --- --- --- --- --- ADVA 170 (fl
oz./cwt) 5 5 5 5 5 5 6 6 7 ADVA CAST 575
(fl oz./cwt) --- --- --- --- --- --- --- --- --- Fresh Concrete Properties
Slump Flow (in.) 25 26 27.5 25.5 23.5 22 26.5 23 28.5 Segregation Observed no no yes no no no yes no yes
VSI 0 1 2 0 1 1.5 3 0 3 Bleed Water no yes yes no yes yes yes no yes
T-20 (sec) 5.37 5.16 4.53 6.03 4.89 7.64 9.07 6.57 11.4
4 Δh* (in.) 0 0.5 1 0.5 0.75 --- 1.25 --- 1.5
Slump Flow Spread - J-Ring Spread (in.) 1 2.5 4 2 2.5 --- 1 --- 3.5
Compressive Strength 1-day strength (psi) 2940 3020 2190 2660 2720 --- 2010 --- 1860 7-day strength (psi) 7310 7360 5910 6940 7010 --- 5920 --- 5350 28-day strength (psi) 9490 9680 7880 9380 9610 --- 7490 --- 7130 Δh*: height difference between concrete inside and outside the J-Ring
Several acceptable SCC mixtures were developed in Phase 2. However, it is
important to note that mixtures having S/Agg of 0.44, 0.46, and 0.56 were not able to
classify as SCC. Therefore, these S/Agg values were no longer utilized during trial

109
batching. For the next phase of mixtures, the objective was to successfully develop SCC
mixtures with lower binder contents. This process is explained more clearly in the
following section.
5.3.3 Phase 3 – Reducing Binder Content to 761 lb/yd3
In Phase 3 of the trial batching process the author began to narrow the search for
the minimum binder content at which SCC can be developed. Specifically, the binder
content was reduced to 761 lb/yd3 (451.48 kg/m3). This value was selected because it was
midway between the two binder contents that were previously implemented (711 lb/yd3
(421.82kg/m3) and 811 lb/yd3 (481.15 kg/m3)).
In mixture # 15, an S/Agg value equal to 0.48 was used. Additionally, 5 fl. oz.
ADVA 170 /cwt (326 mL/100 kg) was added during batching. When tested the concrete
attained a slump flow of 19.5 in. (495.3 mm). The spread was uniform and stable.
However, since the concrete did not acquire sufficient flowability, the mixture was
proven to be inadequate. No further tests were performed on this mixture. The slump
flow spread for this mixture can be viewed in Figure 5.5.

110
Figure 5.5: Slump Flow of Mixture # 15
For the next mixture it was desired for the concrete to have more flowability. To
accomplish this, the ADVA 170 dosage rate was increased to 6 fl. oz. /cwt (391.19
mL/100 kg). The other mixture constituents were held constant. This mixture developed a
slump flow of 22 in. (558.8 mm). A slight amount of bleed water was observed as sheen
on the concrete spread, so a VSI value of 1 was issued. The measured T-20 (T-50) time
was 5.49 seconds. When compared with the previous mixture it was evident that the
concrete was more flowable, but it still did not reach the minimum specified slump flow
spread diameter of 23.5 in. (596.9 mm). Hence, this mixture failed to qualify as an
adequate SCC mixture and no additional tests were conducted.

111
It was apparent that the concrete needed to be more flowable, so in mixture # 17
the addition rate of ADVA 170 was further increased to 7 fl. oz. /cwt (456.39 mL/100
kg). After batching, fresh concrete tests were performed. The slump flow was 27.5 in.
(698.5 mm), but the spread was elliptical in shape rather than circular. The two
perpendicular measurements recorded were 25.5 in. (647.7 mm) and 29.5 in. (749.3
mm).Upon assessing the spread for uniformity and stability, segregation was observed. A
small aggregate mound was present in the center of the concrete mass, and bleed water
surrounded the entire circumference of the spread. Therefore, the mixture was assigned a
VSI value equal to 2. The T-20 (T-50) time was 4.68 seconds.
Unlike the irregular elliptical shape of the slump flow spread, the J-Ring flow
spread was circular as expected. After comparing the two spreads, the author attributes
the asymmetry of the slump flow spread to operator error. It is expected that the slump
cone was lifted at a slight angle, which caused the concrete to flow through the outlet at
an uneven rate. The height difference between concrete inside and outside the J-Ring was
1.25 in. (31.75 mm), and the difference between the slump flow spread and the J-Ring
spread was 2.5 in. (63.5 mm). These results indicated that the mixture had moderate
blockage potential.
The average 28-day compressive strength was 7010 psi (48.34 MPa). However, as
a result of the segregation that occurred, this mixture did not qualify as an acceptable
SCC mixture.
In mixture # 18, the only alteration made to the mix design was to increase the
S/Agg to 0.50. After mixing, fresh concrete tests were performed on the concrete. This

112
mixture acquired an acceptable slump flow of 24.5 in. (622.3 mm), but severe
segregation was observed. As a result, a VSI value of 3 was assigned to the mixture. The
author found it perplexing that a concrete mixture with such a low slump flow could
experience such excessive segregation. The concrete appeared dry, so a possible reason
as to why this incident occurred was that the mixture was not given enough time to mix
properly. An extended mixing time would have diminished the amount of flocculated
cement particles by enabling the HRWR to be dispersed in a more uniform manner.
Additionally, a T-20 (T-50) time of 3.58 seconds was recorded for the mixture.
The height difference between concrete inside and outside the J-Ring was 1.50 in.
(38.1 mm), and the difference between the slump flow spread and the J-Ring spread was
4.5 in. (114.3 mm). These measurements indicate that blockage is likely to occur for this
mix design.
The average 28-day compressive strength yielded a satisfactory value of 7830 psi
(54 MPa). Yet since the mixture had segregated, it did not qualify as an SCC mixture.
For the 19th mixture, the author elected to make the following changes to the
previous mix design: increase the S/Agg to 0.52 and decrease the ADVA 170 dosage rate
to 5 fl. oz. /cwt (326 mL/100 kg). These changes resulted in a reduced slump flow of 19
in. (482.6 mm), but the slump flow patty showed no evidence of segregation.
Nevertheless, the concrete could not be classified as an SCC mixture due to its limited
flowability, and no supplementary concrete tests were conducted on this mixture.
An increase in flowability was desired for the next mixture. To accomplish this,
the addition rate of ADVA 170 was increased to 7 fl. oz. /cwt (456.39 mL/100 kg). This
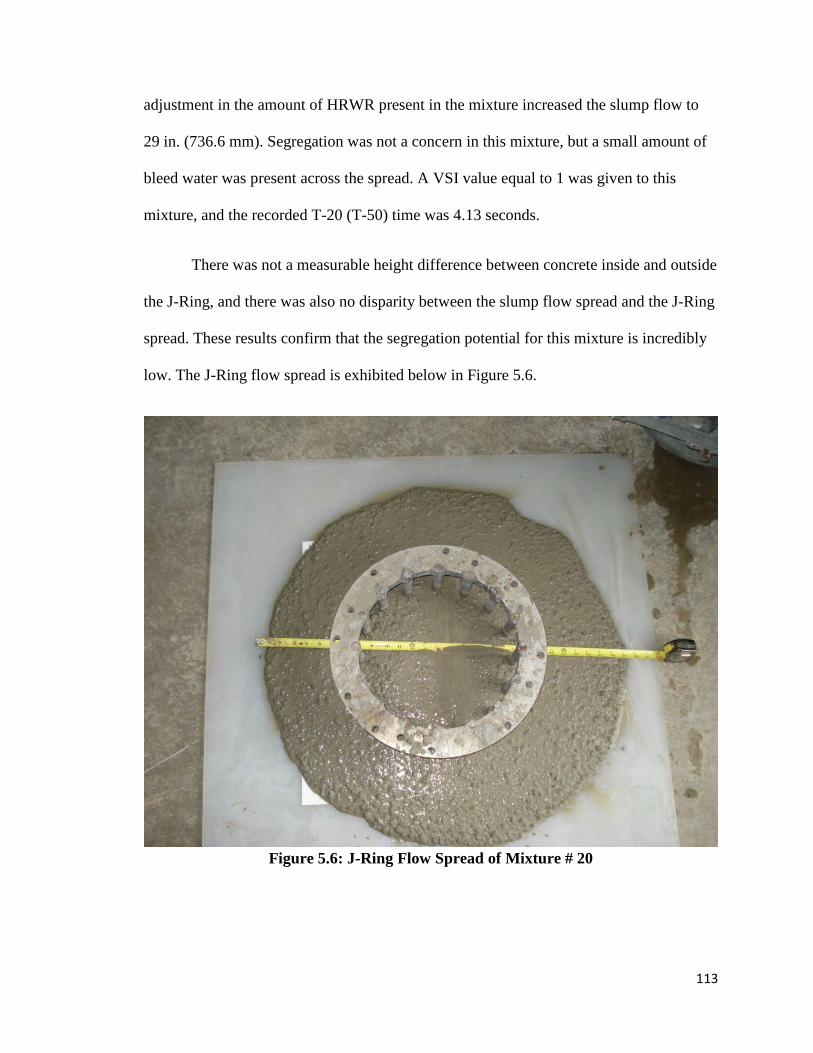
113
adjustment in the amount of HRWR present in the mixture increased the slump flow to
29 in. (736.6 mm). Segregation was not a concern in this mixture, but a small amount of
bleed water was present across the spread. A VSI value equal to 1 was given to this
mixture, and the recorded T-20 (T-50) time was 4.13 seconds.
There was not a measurable height difference between concrete inside and outside
the J-Ring, and there was also no disparity between the slump flow spread and the J-Ring
spread. These results confirm that the segregation potential for this mixture is incredibly
low. The J-Ring flow spread is exhibited below in Figure 5.6.
Figure 5.6: J-Ring Flow Spread of Mixture # 20
114
An average 28-day compressive strength of 8330 psi (57.43 MPa) verified that the
hardened properties of this mixture were adequate. As a result, mixture # 20 qualified as
an acceptable SCC mixture.
One final mixture was batched in Phase 3. For this mixture, the S/Agg was further
increased to 0.54. All the other mixture components remained unchanged. Increasing the
S/Agg value yielded a slump flow of 29 in. (736.6 mm), although segregation did occur.
An aggregate pile was present in the center of the spread, and a considerable mortar halo
had developed around the perimeter. Seeing this justified a VSI designation equal to 2.
Also, the measured T-20 (T-50) time was 4.04 seconds.
After the slump flow test was completed, the J-Ring test was performed. The
height difference between concrete inside and outside the J-Ring was 0.25 in. (6.35 mm),
and the difference between the slump flow spread and the J-Ring spread was 1.75 in.
(44.45 mm). These results suggest that even though segregation had occurred, blockage
problems would likely not be a concern due to the excessive fluidity of the mixture.
Mixture # 21 acquired an average 28-day compressive strength of 7190 psi (49.59
MPa). Despite the fact that this value exceeded the minimum specified compressive
strength with ease, the unsatisfactory fresh concrete properties (segregation) kept this
mixture from being classified as a sufficient SCC mixture.
The seven abovementioned mixtures complete Phase 3 of trial batching. The
detailed mix designs along with the corresponding slump flow, J-Ring, and compressive
strength test results are presented in tabular form in Table 5.3.

115
Table 5.3: Phase 3 Mix Designs and Test Results
Materials Mixtures 15 16 17 18 19 20 21
Total Cementitious Materials (lb/yd3) 761 761 761 761 761 761 761
Fly Ash (%) --- --- --- --- --- --- ---
Coarse Aggregate (lb/yd3) 1496 1496 1496 1439 1380 1380 1324
Fine Aggregate (lb/yd3) 1341 1341 1341 1397 1454 1454 1509
Water (lb/yd3) 335 335 335 335 335 335 335 Water/Binder 0.44 0.44 0.44 0.44 0.44 0.44 0.44
Sand/Aggregate 0.48 0.48 0.48 0.5 0.52 0.52 0.54 ADVA CAST 530 (fl oz./cwt) --- --- --- --- --- --- ---
ADVA 170 (fl oz./cwt) 5 6 7 7 5 7 7 ADVA CAST 575 (fl oz./cwt) --- --- --- --- --- --- ---
Fresh Concrete Properties Slump Flow (in.) 19.5 22 27.5 24.5 19 29 29
Segregation Observed no no yes yes no no yes VSI 0 1 2 3 1 1 2
Bleed Water no yes yes yes no yes yes
T-20 (sec) --- 5.49 4.68 3.58 --- 4.13 4.04
Δh* (in.) --- --- 1.25 1.5 --- 0 0.25 Slump Flow Spread - J-Ring Spread
(in.) --- --- 2.5 4.5 --- 0 1.75 Compressive Strength
1-day strength (psi) --- --- 1870 1900 --- 2510 1800 7-day strength (psi) --- --- 5260 5780 --- 6160 5470 28-day strength (psi) --- --- 7010 7830 --- 8330 7190
Δh*: height difference between concrete inside and outside the J-Ring
In Phase 3 of trial batching only one mixture was established as a suitable SCC
mixture. Mixture # 21 contained an S/Agg equal to 0.54, but it did not have desirable
fresh concrete properties. Consequently, the author elected to not implement this ratio in

116
future mixtures. Previous research conducted at the University of Arkansas77 concluded
that SCC mixtures were able to be batched with S/Agg values varying from 0.44 to 0.56.
However, due to unsatisfactory fresh concrete properties, only the central portion of this
range was implemented for the remaining mixtures (0.48 – 0.52).
With the exception of one mixture, Phase 4 of trial batching focused on
developing SCC mixtures at even lower binder contents. A new type of HRWR was also
introduced during this phase. The reasoning for this is explained in greater detail in the
following section.
5.3.4 Phase 4 – Further Reducing Binder Content to 750 lb/yd3
The first mixture batched in Phase 4 was the outlier of the group. A binder content
of 786 lb/yd3 (466.32 kg/m3) was utilized. This value was chosen because Phase 3 proved
to be futile as a whole, and the binder content was halfway between the previous binder
content (761 lb/yd3 (451.48 kg/m3)) and the highest overall binder content that was used
(811 lb/yd3 (481.15 kg/m3)). When compared with mixture # 20, the coarse and fine
aggregate proportions were decreased and the water content was increased to account for
the increase in binder content. This mixture was batched with an S/Agg equal to 0.52 and
5 fl. oz. ADVA 170 /cwt (326 mL/100 kg) was incorporated to promote flowability.
The mixture was observed during the break period. It flowed well, but it appeared
and felt viscous. The author elected not to add any additional ADVA 170 at this time
because it was believed that the concrete would become susceptible to segregation.

117
Batching continued for a few more minutes and then the fresh concrete properties were
evaluated.
A slump flow of 22 in. (558.8 mm) was measured. The mixture did not segregate,
and only negligible bleed water was present so a VSI value of 0.5 was issued. The
recorded T-20 (T-50) time was an acceptable 4.37 seconds; however, mixture # 22 was
rejected because it did not acquire the desired flowability.
For mixture # 23 and all of the remaining mixtures in Phase 4, a binder content of
750 lb/yd3 (444.96 kg/m3) was used, an S/Agg equal to 0.52 was utilized, and ADVA
Cast 575 was introduced as the HRWR source. ADVA Cast 575 replaced ADVA 170
because it can be used to produce concrete mixtures with low w/cm while preserving
desirable workability characteristics. Also, ADVA Cast 575 is better formulated to
combat segregation.
Mixture # 23 was batched with an ADVA Cast 575 dosage rate of 7 fl. oz. /cwt
(456.39 mL/100 kg) as a starting point. This resulted in a measured slump flow of 23 in.
(584.2 mm). Since the mixture did not achieve the required flowability, it was rejected.
However, the concrete appeared stable; it did not segregate and minimal bleed water was
present. It was apparent that in order to enhance the flowability of the next mixture, more
HRWR would need to be added.
For the next mixture, the addition rate of ADVA Cast 575 was increased to 9 fl.
oz. /cwt (586.79 mL/100 kg). All the other mixture proportions were held constant. The
extra HRWR did not, however, result in an increase in slump flow. A value of 23 in.
(584.2 mm) was recorded. As was the case in the previous mixture, no segregation was

118
observed and only a small amount of bleed water was present. Nevertheless, since the
mixture failed to attain the desired flow, it was unable to qualify as SCC.
In mixture # 25, the author decided to decrease the ADVA Cast 575 dosage rate to
3 fl. oz. /cwt (195.60 mL/100 kg). This change was made to assess how sensitive the
concrete would be to this polycarboxylate-based HRWR. A smaller amount of HRWR
was expected to make the concrete more viscous; however, severe segregation was
observed when the slump flow test was performed. The recorded slump flow
measurement was 25 in. (635 mm), but the T-20 (T-50) test took 12.50 seconds to
complete. The author attributes such a lengthy T-20 (T-50) time to the blockage that
occurred at the outlet of the inverted slump cone.
In addition to the segregation that was observed while performing the slump flow
test, the J-Ring test also displayed segregation. The two recorded J-Ring measurements
indicated that the blockage potential for this mixture was extremely high as well. Figure
5.7 illustrates the blockage that occurred.
Figure 5.7: J-Ring Flow Spread of Mixture # 25

119
The cylinders acquired an average 28-day compressive strength of 6840 psi
(47.19 MPa). This was the lowest value computed for any of the trial batches so far in
this research program. The author believes that this occurred for two reasons. First,
compressive strength data had not been determined for concrete mixtures containing
lower binder contents than 750 lb/yd3 (444.96 kg/m3). Also, the segregation experienced
by the concrete reduced the compressive strength. As a result of the segregation and
blockage that occurred, the mixture did not meet the criteria to qualify as an SCC
mixture.
The results of the fresh concrete tests performed on the previous mixture did not
make sense to the author given the amount of HRWR that was present in the mixture. So
for the next mixture, the opposite end of the HRWR dosage range was selected to analyze
the effect on the concrete. In this mixture, 12 fl. oz. /cwt (782.38 mL/100 kg) was utilized
during batching. It was anticipated that adding such a large quantity of HRWR would
cause segregation. Segregation did occur, but the slump flow spread only reached an
average diameter of 23 in. (584.2 mm). The author predicted that the slump flow
measurement would exceed 30 in. (762 mm) due to such a high dosage rate of ADVA
Cast 575. When compared with the previous mixture, it was evident that mixture # 26
was more viscous even though 9 more fl. oz. /cwt (586.79 mL/100 kg) was added. There
were no logical explanations. Regardless, the fresh concrete properties did not meet the
essential requirements so the mixture was eliminated from consideration. Compressive
strength testing was not conducted on this mixture because of the limited flowability.
At this point, the author began to suspect that the binder content might be the
problem. A mixture that contains a binder content that is too low will not flow well

120
without segregating. For mixture # 27, the ADVA Cast 575 dosage rate was reduced to
10.5 fl. oz. /cwt (684.58 mL/100 kg) to see what the effect would be. After mixing had
concluded, the slump flow test was performed. A T-20 (T-50) time of 11.25 seconds was
recorded along with a maximum spread of 28.5 in. (723.9 mm). As was the case with the
previous two mixtures, this mixture also experienced segregation. Therefore, a VSI value
of 3 was assigned.
After the slump flow test was concluded, the J-Ring test was executed. The height
difference between concrete inside and outside the J-Ring was 1.0 in. (25.4 mm), and the
difference between the slump flow spread and the J-Ring spread was 2.50 in. (63.5 mm).
These measurements suggested that the mixture had moderate blockage potential.
Even though the fresh concrete properties of this mixture were already proven to
be inadequate, compressive strength testing was still performed to assess if the hardened
properties were sufficient. The average 28-day compressive strength of 8170 psi (56.32
MPa) was acceptable.
The author chose to batch one more mixture in this phase. For this final mixture,
the addition rate of HRWR was slightly reduced to 10 fl. oz. /cwt (651.98 mL/100 kg).
The other mixture proportions did not change. Once mixing was finished, the concrete
was poured into a wheelbarrow and the fresh concrete properties were evaluated.
The slump flow test yielded a T-20 (T-50) of 8.18 seconds, a maximum spread of
23 in. (584.2 mm), and a VSI designation equal to 2. Segregation did occur, but it was not
as severe a case as had been viewed in the previous three mixtures. At any rate, the
mixture was still rejected from consideration because the concrete did not acquire

121
adequate flowability, and the mixture experienced segregation. In addition, compressive
strength testing was not performed due to the inability of the concrete to flow effectively.
The seven mixtures that were previously described complete Phase 4 of trial
batching. The mix designs for these mixtures are exhibited along with the related slump
flow, J-Ring, and compressive strength data in Table 5.4 below.
Table 5.4: Phase 4 Mix Designs and Test Results
Materials Mixtures 22 23 24 25 26 27 28
Total Cementitious Materials (lb/yd3) 786 750 750 750 750 750 750
Fly Ash (%) --- --- --- --- --- --- --- Coarse Aggregate (lb/yd3) 1357 1392 1392 1392 1392 1392 1392 Fine Aggregate (lb/yd3) 1428 1465 1465 1465 1465 1465 1465
Water (lb/yd3) 346 330 330 330 330 330 330 Water/Binder 0.44 0.44 0.44 0.44 0.44 0.44 0.44
Sand/Aggregate 0.52 0.52 0.52 0.52 0.52 0.52 0.52 ADVA CAST 530 (fl oz./cwt) --- --- --- --- --- --- ---
ADVA 170 (fl oz./cwt) 5 --- --- --- --- --- --- ADVA CAST 575 (fl oz./cwt) --- 7 9 3 12 10.5 10
Fresh Concrete Properties Slump Flow (in.) 22 23 23 25 23 28.5 23
Segregation Observed no no no yes yes yes no VSI 0.5 0.5 0.5 3 3 3 2
Bleed Water no no no yes yes yes no T-20 (sec) 4.37 3.1 3.89 12.5 15.23 11.25 8.18 Δh* (in.) --- 0.5 1.5 1.5 1.25 1 1.25
Slump Flow Spread - J-Ring Spread (in.) --- --- --- 3.5 --- 2.5 ---
Compressive Strength 1-day strength (psi) --- --- --- 1710 --- 1960 --- 7-day strength (psi) --- --- --- 5270 --- 5960 --- 28-day strength (psi) --- --- --- 6840 --- 8170 ---
Δh*: height difference between concrete inside and outside the J-Ring

122
In Phase 4 of trial batching, none of the mixtures satisfied the necessary criteria to
qualify for an SCC mixture. The author believes that this trend transpired because the
binder content was too low. Regardless of the HRWR dosage rate, every mixture was
either too viscous and did not acquire enough flowability, or it experienced segregation.
For the next set of mixtures, the binder content was increased. This adjustment was made
for two reasons. An increase in binder content would promote flowability by elevating
the amount of fine particles within each mixture. Also, an increase in binder content
would allow for more water to be utilized during mixing; this in turn, would also
encourage the concrete to flow. A thorough discussion of each mixture is presented in the
following section.
5.3.5 Phase 5 – Increasing Binder Content to 775 lb/yd3 and Setting S/Agg Equal to 0.52
In this phase of mixing, the binder content was increased to 775 lb/yd3 (459.79
kg/m3), and the S/Agg was set at a value of 0.52. Four mixtures were batched, and the
only variance between them is that they were batched with different dosage rates of
ADVA Cast 575.
For mixture # 29, 7 fl. oz. HRWR /cwt (456.39 mL/100 kg) was added during
mixing. The concrete appeared uniform and it possessed a high degree of fluidity when it
was evaluated during the break period. After mixing was concluded, the slump flow test
was performed.

123
A T-20 (T-50) time of 5.07 seconds was measured along with a maximum slump
flow spread of 28.5 in. (723.9 mm). The spread did not show any signs of segregation,
and only a slight amount of bleed water was present. Hence, a VSI value of 1 was given
for this mixture.
The measurements related to the J-Ring test were desirable as well; a height
difference between concrete inside and outside the J-Ring was recorded to be 0.25 in.
(6.35 mm), and the difference between the slump flow spread and the J-Ring spread was
2.0 in. (50.8 mm). These results signified that the concrete could flow through and around
obstructions with ease.
Since the fresh concrete properties were satisfactory, the hardened concrete
properties were also tested for adequacy. The average 1, 7, and 28-day compressive
strengths were reported to be 2590, 6470, and 8620 psi (17.84, 44.60, 59.45 MPa),
respectively. As the 28-day compressive strength exceeded the value stipulated in the
Standard Specifications5 (3500 psi, 24.13 MPa) by more than 246%, mixture # 29 was
recommended for use as an SCC mixture. Figure 5.8 shows a cylinder that was cast from
this mixture and tested in compression at twenty-eight days of age.

124
Figure 5.8: 28-Day Compressive Strength Testing on Cylinder Cast from Mixture #
29
In mixture # 30, the ADVA Cast 575 addition rate was reduced to 6 fl. oz. /cwt
(391.19 mL/100 kg). The author decided to decrease the amount of HRWR incrementally
so that the fresh concrete results obtained could be compared with those of the previous
mixture. When the mixture was assessed during the break period, evidence of segregation
was present. The final mixing segment was extended in an attempt to make the concrete
more homogeneous. However, once the slump flow test was operated, it was obvious that
segregation was still present.
A T-20 (T-50) time of 1.37 seconds was measured. By looking at the concrete, it
was evident that the cement paste had almost completely separated from the aggregates.
The aggregates created a pile in the center of the spread, and the excess paste took shape

125
as a disproportionate mortar halo. The maximum slump flow spread was 32.5 in. (825.5
mm); this was the largest value measured thus far in this research program.
The results of the J-Ring test suggested that the probability that blockage would
occur for the mixture was low. However, these findings were deceiving. The cement
paste was able to flow around the simulated rebar effortlessly because it was extremely
fluid, but the aggregates created a massive mound that did not spread out so far as to
reach the inside circumference of the J-Ring. This is why the height difference between
concrete inside and outside the J-Ring was recorded to be 0 in. (0 mm).
Mixture # 30 failed to qualify as an SCC mixture due to its undesirable fresh
concrete properties. Regardless, the author decided to conduct compressive strength
testing. Twenty-eight days after batching, the compressive strength was 7210 psi (49.73
MPa).
When the fresh concrete properties of this mixture were compared with those of
the previous mixture, the findings did not follow a logical trend. A decrease in the
quantity of HRWR was expected to lower the slump flow spread, not enlarge it by 4 in.
(101.6 mm). Also, if segregation were to occur, the mixture was anticipated to be
exceptionally viscous rather than remarkably fluid. The author considers that this
disparity among the results is due to an extreme difference in aggregate moisture. Prior to
batching mixture # 29, the weather was clear for the previous two days and no
precipitation had accumulated. On the other hand, the day before mixture # 30 was
batched, it had rained heavily. Therefore, when the aggregates were shoveled into
buckets and placed inside overnight, excess water had coated the aggregates. This type of

126
occurrence is routinely accounted for by decreasing the amount of water added during
mixing. However, it is possible that a significant portion of the excess water that
encompassed the aggregates could have collected at the bottom of the bucket and was
included during mixing.
For the next mixture, the dosage rate of ADVA Cast 575 was further reduced to 5
fl. oz. /cwt (326 mL/100 kg). It was expected that this mixture would produce desirable
or at least analogous results to those of mixture # 29. When the concrete was viewed
during the break period, it flowed well but felt slightly viscous to the touch.
After the slump flow test was performed, a T-20 (T-50) time of 6.19 seconds was
recorded along with an average maximum spread of 21.5 in. (546.1 mm). The concrete
was fluid, but it did not acquire the necessary flowability to be classified as SCC. The
consistency of the spread was uniform though; it showed no signs of segregation or bleed
water, so a VSI value of 0 was granted. The slump flow for this mixture is presented in
Figure 5.9.
Figure 5.9: Slump Flow of Mixture # 31

127
Although the results of the slump flow test were adverse, they did make sense. A
reduction in the amount of HRWR increased the T-20 (T-50) time and decreased the
average slump flow spread by making the mixture more viscous.
Given the previous trend that was established, it was palpable that the addition
rate of HRWR needed to increase. In mixture # 32, the ADVA Cast 575 dosage rate was
increased to 5.5 fl. oz. /cwt (358.59 mL/100 kg). When the mixture was evaluated inside
the mixer, the concrete appeared to be fluid but it felt thick. The decision was made to not
add any more HRWR to the mixture at this time, because it was believed that doing so
would cause the concrete to segregate.
When the slump flow test was run, a T-20 (T-50) time of 5.71 seconds was
measured. Also, the maximum spread was 21 in. (533.4 mm). Since the slump flow
diameter did not reach the minimum established value of 23.5 in. (596.9 mm), mixture #
32 did not meet the criteria to qualify for SCC. Due to such a low recorded slump flow
measurement, compressive strength testing was not performed.
The four preceding mixtures conclude Phase 5 of trial batching. The mix designs
for these mixtures combined with the appropriate slump flow, J-Ring, and compressive
strength information are presented in Table 5.5.

128
Table 5.5: Phase 5 Mix Designs and Test Results
Materials Mixtures 29 30 31 32
Total Cementitious Materials (lb/yd3) 775 775 775 775 Fly Ash (%) --- --- --- ---
Coarse Aggregate (lb/yd3) 1367 1367 1367 1367 Fine Aggregate (lb/yd3) 1439 1439 1439 1439
Water (lb/yd3) 341 341 341 341 Water/Binder 0.44 0.44 0.44 0.44
Sand/Aggregate 0.52 0.52 0.52 0.52 ADVA CAST 530 (fl oz./cwt) --- --- --- ---
ADVA 170 (fl oz./cwt) --- --- --- --- ADVA CAST 575 (fl oz./cwt) 7 6 5 5.5
Fresh Concrete Properties Slump Flow (in.) 28.5 32.5 21.5 21
Segregation Observed no yes no no VSI 1 3 0 0
Bleed Water no yes no no T-20 (sec) 5.07 1.37 6.19 5.71 Δh* (in.) 0.25 0 0.75 1.25
Slump Flow Spread - J-Ring Spread (in.) 2 1.5 --- --- Compressive Strength
1-day strength (psi) 2590 1840 --- --- 7-day strength (psi) 6470 5520 --- --- 28-day strength (psi) 8620 7210 --- ---
Δh*: height difference between concrete inside and outside the J-Ring
One SCC mixture was successfully batched in Phase 5. The author believes that
more mixtures would have passed if the HRWR dosage rate was higher. In Phase 6, the
minimum addition rate of ADVA Cast 575 that was to be utilized was set at 7 fl. oz. /cwt
(456.39 mL/100 kg). The mixtures entailed in Phase 6 are covered more scrupulously in
the next section.

129
5.3.6 Phase 6 – Reducing S/Agg to 0.50
In this phase of mixing, the S/Agg was 0.50 for all mixtures. To account for this,
the coarse aggregate proportion was increased to 1425 lb/yd3 (845.42 kg/m3), and the
quantity of fine aggregate was decreased to 1384 lb/yd3 (821.09 kg/m3). The other
mixture design parameters were held constant. When compared with the other mixtures
in the phase, the only variation (if any) was the quantity of HRWR that was added.
For mixture # 33, 7 fl. oz. ADVA Cast 575 /cwt (456.39 mL/100 kg) was used.
When the mixture was observed in the mixer, the concrete flowed well and it did not feel
viscous. The results of the slump flow test presented a T-20 (T-50) time of 7.49 seconds
and a maximum spread equal to 25 in. (635 mm). Also, a VSI designation of 0 was given
because the spread was almost perfectly round, and it was free of segregation and bleed
water.
The findings related to the J-Ring test indicated that the mixture had moderate
blockage potential; a height difference between concrete inside and outside the J-Ring
was 1.25 in. (31.75 mm), and the difference between the slump flow spread and the J-
Ring spread was 3.0 in. (76.2 mm).
Compressive strength testing was performed at 1, 7, and 28 days after batching.
The final three-cylinder average at 28 days of age was 9120 psi (62.87 MPa). Overall,
this mixture was confirmed to be an adequate SCC mixture. However, there were some
issues that needed to be addressed. The T-20 (T-50) time of 7.49 seconds was longer than
desired. Also, the height difference between concrete inside and outside the J-Ring (1.25
in., 31.75 mm) would have been more advantageous had it been less than or equal to 0.7

130
in. (17.78 mm). For this trial batch, these concerns were not extreme and were
acceptable. Nonetheless, if this mixture were to be employed in the field, those involved
in batching and testing the concrete should be aware of the risks.
In the next mixture, the ADVA Cast 575 dosage rate was increased to 8 fl. oz.
/cwt (521.59 mL/100 kg). This was done to improve the flowability concerns that were
witnessed while performing fresh concrete tests on mixture # 33. A more flowable
mixture would not only acquire a shorter T-20 (T-50) measurement, but it would also
reduce the blockage potential of the mixture. When the concrete was evaluated during the
break period, it appeared extremely fluid and more importantly, stable.
The slump flow test demonstrated an improved T-20 (T-50) time of 3.88 seconds.
Also, the slump flow spread was 29 in. (736.6 mm). As was expected, the concrete was
able to remain stable throughout the final mixing segment. Segregation and bleed water
were not observed, thus a VSI value of 0 was specified.
The J-Ring test results were slightly better when compared with the previous
mixture. The height difference between concrete inside and outside the J-Ring did not
change, but the difference between the slump flow spread and the J-Ring spread was
reduced by 0.5 in. (12.7 mm). These findings showed that the flowability of the mixture
was enhanced; consequently, the blockage potential was not as significant.
The fresh concrete test results met the criteria for mixture # 34 to be
recommended as a satisfactory SCC mixture. Compressive strength testing was
performed to ensure that the hardened properties were adequate as well. An average 28-
day compressive strength of 8590 psi (59.20 MPa) corroborated that the mixture was

131
indeed sufficient. The cylinders that were tested at twenty-eight days of age are displayed
below in Figure 5.10. Upon viewing the photograph it can be seen that the cylinders had
minimal bug holes. The author attributes the lack of surface blemishes to the stability of
the mixture.
Figure 5.10: Compressive Strength Cylinders for Mixture # 34 at 28 Days
Since mixture # 34 had performed so well, none of the design constraints were
adjusted for the next mixture. The author decided to do this in an attempt to duplicate the
previous results. When the slump flow test was operated, the T-20 (T-50) measurement
took considerably longer to complete; a time of 6.53 seconds was recorded. The slump
flow spread was smaller in diameter, but it was still comparable; an average length of 27

132
in. (685.8 mm) was computed. Also, the spread was of a similar consistency. It was
stable, but a small amount of bleed water was present. This justified a VSI value of 1.
When compared with the preceding mixture, the J-Ring test results were less
desirable. The height difference between concrete inside and outside the J-Ring was
invariable; however, the difference between the slump flow spread and the J-Ring spread
was 3.5 in. (88.9 mm). These results were in agreement with those of the slump flow test;
the flowability of the mixture was worse. Therefore, the blockage potential was more
considerable.
As a whole, the fresh concrete properties were poorer for mixture # 35. However,
the results obtained still met the necessary requirements for the mixture to be classified as
an acceptable SCC mixture. Additionally, the average compressive strength was 9010 psi
(62.11 MPa) at 28 days of age.
For mixture # 36, the addition rate of ADVA Cast 575 was increased to 9 fl. oz.
/cwt (586.79 mL/100 kg). It was anticipated that the additional quantity of HRWR would
either improve the fresh concrete properties by making the mixture more flowable, or the
mixture would become excessively fluid and experience segregation. Once the concrete
was poured into the wheel barrow, it became obvious that the latter event had occurred.
Figure 5.11 shows the segregation that was observed before fresh concrete testing was
performed.

133
Figure 5.11: Evidence of Segregation in Mixture # 36
The T-20 (T-50) measurement was completed in 1.92 seconds. Such a short time
span proposed that the aggregates had separated from the cement paste. When the spread
was observed, it was unmistakable that this incident had indeed occurred. A VSI
description of 2 was given, and the average slump flow was measured to be 32 in. (812.8
mm).
The results of the J-Ring test were similar to those recorded in mixture # 30. On
paper, the findings appear to be desirable. Yet, this was not the case. Due to the excessive
fluidity of the cement paste, it flowed readily around the metal pegs. However, the
aggregates created a substantial pile that barely spread out far enough to reach the inside

134
circumference of the J-Ring apparatus. This is why the height difference between
concrete inside and outside the J-Ring was measured as only 0.25 in. (6.35 mm).
As a result of the segregation that transpired, mixture # 36 was rejected.
Nevertheless, even though the mixture had failed, a valuable piece of information was
learned. It was validated that 9 fl. oz. ADVA Cast 575 /cwt (586.79 mL/100 kg) was too
high of a dosage rate for a binder content of 775 lb/yd3 (459.79 kg/m3). Therefore, said
dosage rate was not employed nor exceeded in the future mixtures that contained a binder
content of 775 lb/yd3 (459.79 kg/m3).
The four mixtures discussed above complete Phase 6 of trial batching. The proper
mix designs coupled with the supplementary slump flow, J-Ring, and compressive
strength data are displayed in Table 5.6.

135
Table 5.6: Phase 6 Mix Designs and Test Results
Materials Mixtures 33 34 35 36
Total Cementitious Materials (lb/yd3) 775 775 775 775 Fly Ash (%) --- --- --- ---
Coarse Aggregate (lb/yd3) 1425 1425 1425 1425
Fine Aggregate (lb/yd3) 1384 1384 1384 1384
Water (lb/yd3) 341 341 341 341 Water/Binder 0.44 0.44 0.44 0.44
Sand/Aggregate 0.5 0.5 0.5 0.5 ADVA CAST 530 (fl oz./cwt) --- --- --- ---
ADVA 170 (fl oz./cwt) --- --- --- --- ADVA CAST 575 (fl oz./cwt) 7 8 8 9
Fresh Concrete Properties Slump Flow (in.) 25 29 27 32
Segregation Observed no no no yes VSI 0 0 1 2
Bleed Water no no no yes
T-20 (sec) 7.49 3.88 6.53 1.92
Δh* (in.) 1.25 1.25 1.25 0.25 Slump Flow Spread - J-Ring Spread (in.) 3 2.5 3.5 2
Compressive Strength 1-day strength (psi) 2750 2540 2700 2210 7-day strength (psi) 6840 6360 6740 5750 28-day strength (psi) 9120 8590 9010 7780
Δh*: height difference between concrete inside and outside the J-Ring
In general, Phase 6 was a success because three out of the four mixtures that were
batched were classified as adequate SCC mixtures. For phase 7 of trial batching, the
S/Agg was further decreased to see what effect this would have on the fresh concrete

136
properties. An in-depth discussion of the findings of this research is exhibited in the
subsequent section.
5.3.7 Phase 7 - Further Reducing S/Agg to 0.48
In this phase of the study, the only noteworthy alteration that took place was
decreasing the S/Agg to 0.48. The author elected to do this so that the low end of the
S/Agg range (0.48 – 0.52) could be evaluated. As a result, the volume of coarse aggregate
increased to 1482 lb/yd3 (879.24 kg/m3) and the volume of fine aggregate decreased to
1327 lb/yd3 (787.28 kg/m3) for all the mixtures.
In mixture # 37, 7 fl. oz. ADVA Cast 575 /cwt (456.39 mL/100 kg) was added
during mixing. After batching had concluded, the slump flow test was performed. A T-20
(T-50) time of 5.69 seconds was measured along with a slump flow of 27 in. (685.8 mm).
Segregation was not observed, but a small aggregate pile was situated in the center of the
spread; therefore, a VSI value of 1 was specified.
The results of the J-Ring test were also favorable. A height difference between
concrete inside and outside the J-Ring was 1.0 in. (25.4 mm), and the difference between
the slump flow spread and the J-Ring spread was 2.5 in. (63.5 mm). These findings
signified that the blockage potential for the mixture was low.
All of the fresh concrete test results were adequate. An average 28-day
compressive strength of 9510 psi (65.57 MPa) confirmed that mixture # 37 could be
categorized as a sufficient SCC mixture.

137
For the next mixture, all of the mixture design constraints were held constant to
see if similar results could be achieved. When the mixture was observed during the break
period, the concrete appeared to be more viscous than the previous mixture (# 37).
However, additional HRWR was not added at this time because segregation was likely to
occur.
When the slump flow test was performed, a T-20 (T-50) time of 5.97 seconds was
recorded. After the concrete stopped flowing it was evident that segregation had not
occurred, yet a larger aggregate pile was located in the middle of the spread.
Consequently, the concrete was labeled with a VSI designation equal to 1.5. Additionally,
since this concrete sample was more viscous, it acquired a lower slump flow of 24 in.
(609.6 mm). In general, the slump flow test results were not as good as those recorded for
mixture # 37.
The findings of the J-Ring test were also worse. While there was not a measurable
difference between the slump flow spread and the J-Ring spread, the height difference
between concrete inside and outside the J-Ring increased to 1.5 in. (38.1 mm). It was
clearly identifiable that the concrete had difficulty flowing around the metal pegs of the J-
Ring apparatus. The blockage experienced by this mixture can be seen in Figure 5.12.
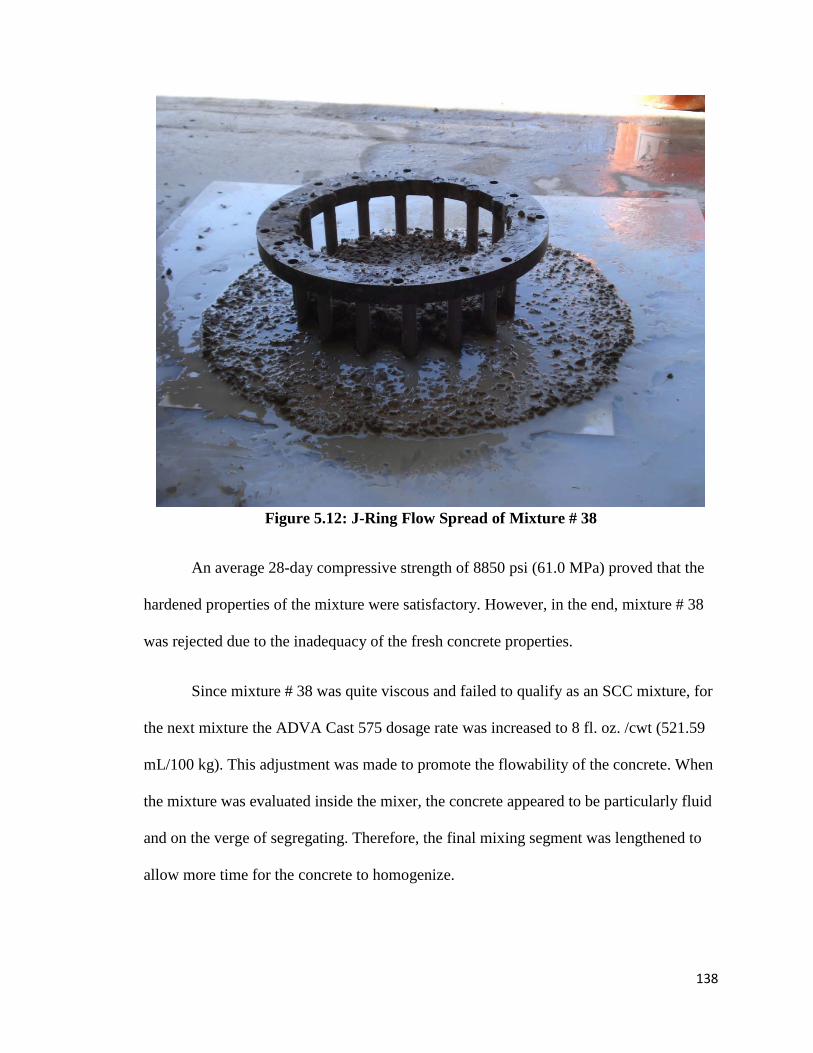
138
Figure 5.12: J-Ring Flow Spread of Mixture # 38
An average 28-day compressive strength of 8850 psi (61.0 MPa) proved that the
hardened properties of the mixture were satisfactory. However, in the end, mixture # 38
was rejected due to the inadequacy of the fresh concrete properties.
Since mixture # 38 was quite viscous and failed to qualify as an SCC mixture, for
the next mixture the ADVA Cast 575 dosage rate was increased to 8 fl. oz. /cwt (521.59
mL/100 kg). This adjustment was made to promote the flowability of the concrete. When
the mixture was evaluated inside the mixer, the concrete appeared to be particularly fluid
and on the verge of segregating. Therefore, the final mixing segment was lengthened to
allow more time for the concrete to homogenize.

139
Promptly after mixing, the concrete was poured into a wheelbarrow and the slump
flow test was conducted. When compared to mixture # 38, an improved T-20 (T-50)
measurement of 5.14 seconds was recorded, and the average slump flow diameter was 29
in. (736.6 mm). The VSI value remained the same, although a considerable aggregate pile
was not the problem. Instead, the designation of 1.5 was given due to excessive bleed
water that had formed a large mortar halo around the entire circumference of the spread.
The mixture was rejected because of its instability. However, more tests were operated to
assess the blockage potential and strength of the mixture. The abovementioned mortar
halo is illustrated in Figure 5.13.
Figure 5.13: Slump Flow of Mixture # 39

140
As was expected, the results of the J-Ring test turned out to be better than the
previous mixture. The difference between the slump flow spread and the J-Ring spread
did increase to 3.0 in. (76.2 mm), but more importantly, the height difference between
concrete inside and outside the J-Ring was decreased to 1.25 in. (31.75 mm). The author
attributes the latter decrease in measurable height to an improvement in the fluidity of the
mixture. The average 28-day compressive strength was 8320 psi (57.37 MPa).
Mixture # 40 was the final trial batch that was mixed during Phase 7. In this
mixture, the author elected to incrementally decrease the addition rate of ADVA Cast 575
to 7.5 fl. oz. /cwt (489.0 mL/100 kg). This decrease in HRWR was intended to improve
the stability of the concrete and promote more desirable fresh concrete properties.
When the slump flow test was operated, the T-20 (T-50) assessment took 6.83
seconds to complete. Once the concrete came to rest, it was noticeable that a large
amount of bleed water had collected on the spread. The central portion of the slump flow
patty appeared to be stable, but the same statement did not hold true for the outer
segment. Hence, a VSI value of 2 was specified. The average slump flow diameter was
27 in. (685.8 mm); however, since the stability of the concrete was questionable, the
mixture could not be classified as SCC.
The two measurements taken during the J-Ring test matched the findings of
mixture # 39. Also, the average 28-day compressive strength was 8760 psi (60.40 MPa).
It is important to note that through mixture # 40 in this research program, all of the
mixtures acquired adequate strength in compression.

141
This concludes Phase 7 of trial batching. The mix designs that were discussed
above are tabularized along with the pertinent slump flow, J-Ring, and compressive
strength data in Table 5.7.
Table 5.7: Phase 7 Mix Designs and Test Results
Materials Mixtures 37 38 39 40
Total Cementitious Materials (lb/yd3) 775 775 775 775 Fly Ash (%) --- --- --- ---
Coarse Aggregate (lb/yd3) 1482 1482 1482 1482
Fine Aggregate (lb/yd3) 1327 1327 1327 1327
Water (lb/yd3) 341 341 341 341 Water/Binder 0.44 0.44 0.44 0.44
Sand/Aggregate 0.48 0.48 0.48 0.48 ADVA CAST 530 (fl oz./cwt) --- --- --- ---
ADVA 170 (fl oz./cwt) --- --- --- --- ADVA CAST 575 (fl oz./cwt) 7 7 8 7.5
Fresh Concrete Properties Slump Flow (in.) 27 24 29 27
Segregation Observed no no no no VSI 1 1.5 1.5 2
Bleed Water no no yes yes
T-20 (sec) 5.69 5.97 5.14 6.83
Δh* (in.) 1 1.5 1.25 1.25 Slump Flow Spread - J-Ring Spread (in.) 2.5 2.5 3 3
Compressive Strength 1-day strength (psi) 2820 2690 2480 2640 7-day strength (psi) 7020 6720 6490 6570 28-day strength (psi) 9510 8850 8320 8760
Δh*: height difference between concrete inside and outside the J-Ring
142
As a whole, Phase 7 was unsuccessful since only one of the four mixtures was
SCC. Mixture # 40 was the last mixture that was batched that contained only portland
Type I cement as the binder constituent. All of the future mixtures also contained varying
replacement rates of Class C FA. A comprehensive discussion of these mixtures and the
accompanying results are presented in Phase 8 of the following section.
5.4 DEVELOPING SCC USING TYPE I PORTLAND CEMENT AND CLASS C FA
5.4.1 Phase 8 – FA Replacement Rates of 5, 10, and 15%
This phase consists of trial mixtures that contained FA replacement rates of 5, 10,
and 15% of the total cementitious material. It is important to note that the FA substitution
rate was incrementally increased by a value of 5% to develop a consistent trend. As was
stated earlier, the third “combination” method of mixture proportioning was employed to
batch every FA mixture. The particle size distribution of the binder was improved by
adding FA to the mixtures because FA particles contain finer constituents than cement.
Subsequently, the flowability of each mixture was then modified by using HRWR to
obtain SCC. The mixture design analysis for the FA SCC mixtures was similar to the
procedure demonstrated in Appendix A; however, these mixtures required additional
steps because the binder content now included a specific replacement rate of FA. For this
reason, it was relevant to illustrate another example so the reader would have a better
understanding of how the mixture proportions were calculated. An example mixture
design analysis that was performed for mixture # 41 is shown in Appendix B.

143
For this mixture, an ADVA Cast 575 dosage rate of 7 fl. oz. /cwt (456.39 mL/100
kg) was chosen. The mixture was assessed during the break period, and at that time the
concrete was fluid and stable. When the slump flow test was conducted, a T-20 (T-50)
measurement of 4.37 seconds was recorded. The concrete was free of segregation, but
bleed water was observed as a sheen over the spread. This authenticated a VSI
designation equal to 1. Also, the average slump flow was 26 in. (660.4 mm).
The results of the J-Ring test suggested that the blockage potential for the mixture
was moderate. A height difference between concrete inside and outside the J-Ring was
1.25 in. (31.75 mm), and the difference between the slump flow spread and the J-Ring
spread was 3.5 in. (88.9 mm).
The average 28-day compressive strength was 9980 psi (68.81 MPa); this was the
strongest mixture developed so far in the research program. The author attributes the
superior later-age strength to the addition of FA. When FA is added to a concrete
mixture, its size and shape improves the particle size distribution of the entire quantity of
binder. Furthermore, since FA is also pozzolanic, more Calcium Silicate Hydrate (C-S-H)
is produced. As a result, there is a better bond between the aggregates and the cement
paste within the ITZ. This, in turn, enables the concrete mixture to acquire enhanced
strength in compression. Since the fresh and hardened concrete properties were suitable,
mixture # 41 was accepted as an adequate SCC mixture. Figure 5.14 shows a shear-type
failure in one of the cylinders that was tested in compression at twenty-eight days of age.

144
Figure 5.14: Shear-Type Compression Failure
In mixture # 42, the FA replacement rate was increased to 10%. The author
decided to do this because of its inexpensive nature when compared to cement. To
account for the extra FA, the quantities of coarse and fine aggregate were reduced.
However, the other mixture proportions did not change.
When the slump flow test was performed, a suitable T-20 (T-50) time of 4.64
seconds was measured. The spread did not show any evidence of segregation or bleed
water, so a VSI value equal to 0.5 was given. Furthermore, the concrete flowed well; a
slump flow of 27 in. (685.8 mm) was recorded.
The results of the J-Ring test were not advantageous. When compared with the
preceding mixture, the height difference between concrete inside and outside the J-Ring
was constant. However, the difference between the slump flow spread and the J-Ring

145
spread increased to 5 in. (127 mm). This disparity in flow measurements suggested that
the mixture was subject to blockage problems.
The average 28-day compressive strength was 10780 psi (74.32 MPa). This value
exceeded the required minimum compressive strength by approximately 308%.
Nonetheless, even though the slump flow and compressive strength test results were
desirable, the blockage issues associated with the mixture prevented it from qualifying as
SCC.
For the next mixture, the S/Agg was increased to 0.50. All the other mixture
design parameters were held constant. When tested, the T-20 (T-50) time was 5.93
seconds; this measurement took roughly one second longer than the author would have
liked, but it was still satisfactory. The slump flow spread was stable and uniform, so a
VSI depiction equal to 0 was specified. Also, the average slump flow diameter was 27.5
in. (698.5 mm).
Concerning the J-Ring test, the relevant findings signified that the concrete had
only slight to temperate blockage concerns. When compared with the foregoing mixture
(# 42), the height difference between concrete inside and outside the J-Ring did not show
a measurable change. On the other hand, the difference between the slump flow spread
and the J-Ring spread was 1.5 in. (38.1 mm).
After 28 days of age, the concrete had a compressive strength of 10140 psi (69.93
MPa). This end result combined with the sufficient fresh concrete properties permitted
mixture # 43 to be categorized as an SCC mixture.

146
In mixture # 44, the S/Agg was further increased to a value of 0.52. When the
concrete was examined during the break period, it appeared that the mixture was
beginning to segregate. In an attempt to counteract this, the final mixing segment was
extended five additional minutes so that the concrete would have more time to become
uniform.
After mixing had concluded, the slump flow test was operated. A T-20 (T-50)
time of 3.89 seconds was measured. It seemed that the extended mixing time had little
effect on homogenizing the concrete because the slump flow spread was unstable and on
the verge of segregating. Bleed water was present and took shape as a large mortar halo
around the entire perimeter of the spread; therefore, a VSI value of 1.5 was issued. In
addition, the average slump flow diameter was 28.5 in. (723.9 mm). At this point, the
mixture had already failed to qualify as SCC due to its instability. However, J-Ring and
compressive strength testing were still performed to evaluate the blockage potential and
hardened properties of the mixture. Figure 5.15 shows the mixture on the brink of
segregation before the J-Ring test was initiated.
Figure 5.15: Instability Observed in Mixture # 44

147
The height difference between concrete inside and outside the J-Ring was 0.5 in.
(12.7 mm), and the difference between the slump flow spread and the J-Ring spread was
1.0 in. (25.4 mm). These results implied that the mixture was not at risk to experience
blockage problems. The author believes that the excessive fluidity of the mixture aided in
obtaining this desirable result. When compressive strength testing was performed at 28
days of age, mixture # 44 had a strength of 9720 psi (67.0 MPa).
Having batched three mixtures with a FA replacement rate of 10%, in mixture #
45 the substitution rate was incrementally increased to 15%. Additionally, the S/Agg was
lowered to 0.48, but all the other mixture quantities did not vary. When the concrete was
inspected inside the mixer, it looked and felt viscous. However, additional HRWR was
not added because it was believed that segregation would likely occur.
Once batching was complete, the slump flow test was conducted. The recorded T-
20 (T-50) time was sufficient at 4.86 seconds. Segregation and bleed water did not occur,
so a satisfactory VSI designation of 0.5 was granted. However, the slump flow
measurement was 22 in. (558.8 mm) which was too low.
When the J-Ring test was performed, the findings proposed that the blockage
potential for the mixture was high. The height difference between concrete inside and
outside the J-Ring was 1.25 in. (31.75 mm). However, the author measured a difference
in diameter between the slump flow spread and the J-Ring spread of 5.0 in. (127 mm).
Lastly, the average 28-day compressive strength for mixture # 45 was 10270 psi (70.79
MPa).

148
Since the previous batch had limited flowability, in mixture # 46 the S/Agg was
increased to 0.50 and the ADVA Cast 575 dosage rate was 8 fl. oz. /cwt (521.59 mL/100
kg). The concrete did not appear to be uniform when it was evaluated during the break
period; bleed water was seen seeping out of the concrete whenever the mixer came to
rest. For this reason, the concluding mixing segment was lengthened so the concrete
would have more time to become homogeneous.
After mixing was complete, the concrete was poured into a wheel barrow and the
slump flow test was conducted without delay. The T-20 (T-50) time was 4.22 seconds.
Next, the spread was assessed for stability. Segregation did not occur, but the presence of
bleed water formed a large mortar halo around the circumference of the spread.
Therefore, the VSI was 1.5. To finish, the average slump flow diameter was 26 in. (660.4
mm).
Subsequently, the J-Ring test was performed. There was a measurable height
difference between concrete inside and outside the J-Ring of 1.25 in. (31.75 mm), and the
variation between the slump flow spread and the J-Ring spread was 2.5 in. (63.5 mm).
These results suggest that the mixture had moderate blockage potential. Also, the
cylinders that were cast from the mixture showed desirable gains in compressive strength
through 28 days after batching. An average 28-day compressive strength of 9910 psi
(68.34 MPa) verified that the hardened properties of the mixture were sufficient.
However, due to the blockage concerns associated with the fresh properties, mixture # 46
was rejected from consideration as an SCC mixture.

149
For mixture # 47, the S/Agg was increased to 0.52. When the concrete was
observed in the mixer, it was evident that segregation had occurred. The author attributes
this incident to the increased quantity of fine aggregate coupled with the already high
HRWR dosage rate. It was anticipated that the fresh concrete properties would be
inadequate, but testing was still performed to verify this.
Upon operating the slump flow test, a T-20 (T-50) measurement of 1.88 seconds
was recorded. As was predicted, segregation had transpired; the aggregates were
separated from the cement paste, so a VSI value of 3 was specified. Also, the average
slump flow was 29.5 in. (749.3 mm).
The findings of the J-Ring test implied that the mixture would not be subject to
blockage problems. However, the results were analogous to those recorded in mixture #
30 and mixture # 36. Indeed, the mixture was prone to experience blockage because the
cement paste had disbanded from the aggregates. If this mixture were utilized in the field,
the cement paste would readily flow around any confined rebar with ease, but the
aggregates would pile up and need to be vibrated. Additionally, due to the severe
segregation, the recorded compressive strengths were smaller in magnitude than was
expected. The 28-day compressive strength was 8810 psi (60.76 MPa). Since the effects
of segregation were detrimental to the fresh concrete properties, mixture # 47 did not
qualify as an acceptable SCC mixture.
The seven aforementioned mixtures complete Phase 8 of trial batching. The mix
designs, fresh concrete properties, and compressive strength data are shown in Table 5.8.

150
Table 5.8: Phase 8 Mix Designs and Test Results
Materials Mixtures 41 42 43 44 45 46 47
Total Cementitious Materials (lb/yd3) 775 775 775 775 775 775 775
Fly Ash (%) 5 10 10 10 15 15 15 Coarse Aggregate (lb/yd3) 1475 1468 1411 1355 1460 1404 1348 Fine Aggregate (lb/yd3) 1322 1315 1370 1425 1308 1363 1417
Water (lb/yd3) 341 341 341 341 341 341 341 Water/Binder 0.44 0.44 0.44 0.44 0.44 0.44 0.44
Sand/Aggregate 0.48 0.48 0.5 0.52 0.48 0.5 0.52 ADVA CAST 530 (fl oz./cwt) --- --- --- --- --- --- ---
ADVA 170 (fl oz./cwt) --- --- --- --- --- --- --- ADVA CAST 575 (fl oz./cwt) 7 7 7 7 7 8 8
Fresh Concrete Properties Slump Flow (in.) 26 27 27.5 28.5 22 26 29.5
Segregation Observed no no no no no no yes VSI 1 0.5 0 1.5 0.5 1.5 3
Bleed Water yes no no yes no yes yes T-20 (sec) 4.37 4.64 5.93 3.89 4.86 4.22 1.88 Δh* (in.) 1.25 1.25 1.25 0.5 1.25 1.25 0
Slump Flow Spread - J-Ring Spread (in.) 3.5 5 1.5 1 5 2.5 1
Compressive Strength 1-day strength (psi) 2400 2440 2220 2160 2050 2350 1960 7-day strength (psi) 7690 8270 7610 7480 8040 7240 5860 28-day strength (psi) 9980 10780 10140 9720 10270 9910 8810
Δh*: height difference between concrete inside and outside the J-Ring
As a group, Phase 8 was unproductive in developing SCC mixtures; only two out
of the seven mixtures exhibited acceptable fresh concrete properties. In Phase 9 of the
experimental program, mixtures with higher replacement rates of FA were batched.
Specifically, these mixtures contained 20 and 25% FA by volume of the total quantity of
binder. A complete investigation of these mixtures is presented along with the associated
results in the subsequent section.

151
5.4.2 Phase 9 – FA Replacement Rates of 20 and 25%
Mixture # 48 contained a FA replacement rate of 20% and an S/Agg equal to 0.48.
Also, since segregation had occurred in the previous mixture, the addition rate of ADVA
Cast 575 was reduced to 7 fl. oz. /cwt (456.39 mL/100 kg). When the concrete was
viewed during the break period, segregation was observed. For that reason, the final
mixing segment was lengthened by five minutes or until the mixture appeared stable.
After mixing was complete, the concrete was poured into a wheel barrow. Upon
assessing the mixture in the wheel barrow, there was still evidence of segregation. The
author predicted that the mixture would fail because of this, but to make certain, fresh
and hardened concrete testing was performed on the mixture.
When the slump flow test was conducted, a surprisingly lengthy T-20 (T-50) time
of 7.30 seconds was measured. The author believes that this arose due to the same
blockage issues that had occurred at the outlet of the slump cone in mixtures #12, 14, 25,
26, and 27. The VSI was 2.5 because of the segregation, and the average slump flow was
28 in. (711.2 mm).
The results of the J-Ring test indicated that the mixture had moderate blockage
potential. A height difference between concrete inside and outside the J-Ring was 1.25 in.
(31.75 mm), but there was no difference between the slump flow spread and the J-Ring
spread. The findings of the compressive strength testing regimen were desirable; the 28-
day compressive strength was 8730 psi (60.16 MPa). However, mixture # 48 was unable
to qualify as an SCC mixture.

152
In the next mixture, the dosage rate of ADVA Cast 575 was reduced to 3 fl. oz.
/cwt (195.60 mL/100 kg). This was done to decrease the probability of segregation. The
other mixture proportions were held constant. Upon evaluating the concrete inside the
mixer, it appeared to be and felt quite viscous. However, no further HRWR was added at
this time. If the results of the fresh concrete tests validated that the mixture acquired
limited flowability, then the dosage rate of HRWR would be elevated in the next trial
mixture.
When the slump flow test was operated, the mixture was confirmed to have
inadequate flowability. The slump flow had a diameter of only 19 in. (482.6 mm). Since
the concrete failed to acquire a slump flow of at least 20 in. (508 mm), a T-20 (T-50)
measurement could not be recorded. Also, due to a considerable aggregate pile that was
positioned in the center of the spread, the VSI value was 2.5. Hence, the mixture failed to
qualify as SCC. Figure 5.16 shows the spread of this mixture immediately after the slump
flow test had been conducted.
Figure 5.16: Slump Flow of Mixture # 49

153
The J-Ring test was not conducted on this concrete sample because it was simply
too viscous. However, the compressive strength was 7380 psi (50.87 MPa) at 28 days.
While this value met the criterion listed in the Standard Specifications5, it was the lowest
average of any of the preceding mixtures that contained a quantity of FA. The author
believes that this occurred for one particular reason. The cement that was used in this
mixture was produced by a different manufacturer. It is likely that this cement had a
different fineness, which affected viscosity and compressive strength.
Due to the undesirable fresh and hardened concrete properties of the prior
mixture, for mixture # 50 (and all of the remaining mixtures) the author switched back to
the original cement brand. Additionally, the S/Agg was increased to 0.50, and the dosage
rate of ADVA Cast 575 was increased to 6 fl. oz. /cwt (391.19 mL/100 kg) so as to
increase the mixture’s flowability. These adjustments resulted in satisfactory slump flow
measurements. A T-20 (T-50) time of 3.71 seconds was recorded. Since the concrete did
not segregate and bleed water was not present, the VSI designation was 0. Also, the
average slump flow was 24.5 in. (622.3 mm).
The results of the J-Ring test were adequate as well. The height difference
between concrete inside and outside the J-Ring was 0.5 in. (12.7 mm), and the deviation
between the slump flow spread and the J-Ring spread was only 1.5 in. (38.1 mm). The
mixture developed an average 28-day compressive strength of 11240 psi (77.46 MPa).
For mixture # 51, the S/Agg was further increased to a value of 0.52. This resulted
in more fine aggregate by volume than coarse aggregate. The other mixture design
parameters were held constant. When the concrete was assessed inside the mixer, it

154
appeared to be flowable and stable. Since additional HRWR was not needed, the
concluding mixing segment was run and fresh concrete testing followed.
Upon operating the slump flow test, the T-20 (T-50) was 2.98 seconds. The
concrete did not exhibit any segregation, but some bleed water was present as a sheen
over the spread. Therefore, the VSI was 1. The slump flow was sufficient as well; a
measurement of 26 in. (660.4 mm) was recorded. The results of the J-Ring test were
desirable also because the spread did not display a differentiation in height between
concrete inside and outside the J-Ring. Furthermore, when the second measurement was
taken, the difference between the slump flow spread and the J-Ring spread was only 1.0
in. (25.4 mm). The fresh concrete properties were proven to be adequate, and the average
28-day compressive strength was 10730 psi (74.0 MPa).
In the final mixture, the replacement rate of FA was increased to 25% and the
S/Agg was lowered to 0.48. These amendments to the mix design resulted in a coarse and
fine aggregate content of 1445 lb/yd3 (857.28 kg/m3) and 1295 lb/yd3 (768.29 kg/m3),
respectively. The other design constraints did not change. The T-20 (T-50) was 4.56
seconds. The concrete did not segregate, though a small aggregate pile was observed in
the center of the spread. The VSI was 0.5. Lastly, the average slump flow diameter was
24 in. (609.6 mm). These results proved that the mixture had satisfactory flowability and
stability. A view of this slump flow spread can be seen in Figure 5.17.

155
Figure 5.17: Slump Flow of the Final Mixture
Next, the J-Ring test was performed to evaluate the blockage potential of the
mixture. A height difference between concrete inside and outside the J-Ring was 0.25 in.
(6.35 mm), and the variation between the slump flow spread and the J-Ring spread was
0.75 in. (19.05 mm). These findings indicated that blockage would not be a concern.
Finally, the hardened properties of the mixture were evaluated at 1, 7, and 28 days
after batching. The compressive strength results at these days were 2730 psi (18.84 MPa),
8250 psi (56.91 MPa), and 11010 psi (75.88 MPa), correspondingly. These results
combined with the suitable findings from fresh concrete testing validated that mixture #
52 was acceptable. Also, it is important to note that throughout the duration of this
research program, every mixture that was tested for compressive strength was adequate

156
(f’c ≥ 3500 psi (24.13 MPa) at 28 days) in that regard. All of the mixtures that did not
meet the requirements to qualify as SCC did so due to unsatisfactory fresh concrete
properties.
Overall, Phase 9 was a success. Three out of the five mixtures had satisfactory
fresh concrete properties. Thus, it was established that SCC could be developed with
replacement rates of FA of 5 to 25%. The completion of Phase 9 concluded trial batching
in this research program. The five mix designs entailed in this phase are presented along
with the pertinent slump flow, J-Ring, and compressive strength results in Table 5.9.
Table 5.9: Phase 9 Mix Designs and Test Results
Materials Mixtures 48 49 50 51 52
Total Cementitious Materials (lb/yd3) 775 775 775 775 775 Fly Ash (%) 20 20 20 20 25
Coarse Aggregate (lb/yd3) 1453 1453 1397 1341 1445 Fine Aggregate (lb/yd3) 1302 1302 1356 1411 1295
Water (lb/yd3) 341 341 341 341 341 Water/Binder 0.44 0.44 0.44 0.44 0.44
Sand/Aggregate 0.48 0.48 0.5 0.52 0.48 ADVA CAST 530 (fl oz./cwt) --- --- --- --- ---
ADVA 170 (fl oz./cwt) --- --- --- --- --- ADVA CAST 575 (fl oz./cwt) 7 3 6 6 6
Fresh Concrete Properties Slump Flow (in.) 28 19 24.5 28 24
Segregation Observed yes no no no no VSI 2.5 2.5 0 1 0.5
Bleed Water yes no no yes no T-20 (sec) 7.3 --- 3.71 2.98 4.56 Δh* (in.) 1.25 --- 0.5 0 0.25
Slump Flow Spread - J-Ring Spread (in.) 0 --- 1.5 1 0.75 Compressive Strength
1-day strength (psi) 2090 1850 2850 2560 2730 7-day strength (psi) 6720 5160 8540 7940 8250 28-day strength (psi) 8730 7380 11240 10730 11010
Δh*: height difference between concrete inside and outside the J-Ring

157
5.5 METHODOLOGY FOR DEVELOPING SCC MIXTURES
In order for an SCC mixture to be deemed satisfactory, four workability
categories (deformability, passing ability, filling capacity, and static stability) must be
satisfied. The major difficulty is being able to develop a mixture that possesses a high
degree of flowability but does not segregate. For example, in conventional-slump
concrete mixtures, incrementally increasing the w/b will improve the workability
characteristics. Be that as it may, a certain limit is present where an increase in w/b will
no longer improve workability without causing instability within the mixture. The same
trend is true with respect to SCC mixtures. However, in SCC, this effect is amplified
because flowability (not workability) is being modified, and mixtures that have high
flowability are extremely sensitive to changes in the mix design. This is why the
methodology utilized in selecting SCC mixture proportions is critical and can require
numerous considerations.
Through trial batching in this research program, steps were developed to
successfully achieve SCC. The elements associated with each step are discussed by
degree of importance in the subsequent section. It is important to note that for this
investigation, AHTD recommended that the w/b should be held constant at a value of
0.44 since the concrete was classified as Class S (structural) and did not have any
substantial compressive strength requirements. Therefore, from the beginning the most
significant element (selecting a w/b) had already been established.

158
5.5.1 Binder Content
5.5.1.1 Binder Content and Flowability
When compared with conventional-slump concrete, SCC mixtures will typically
have higher binder contents. The reason for this is that SCC mixtures are highly flowable.
The addition of water is the mechanism that promotes flowability, and in some instances
the w/b may be increased to account for this. However, in this research program the w/b
was set at 0.44. Therefore, the author determined that the only way to acquire more water
in any given mixture was to increase the binder content. The effect an increase in binder
content had on the slump flows of specific trial mixtures is presented below in Table
5.10.
Table 5.10: Effect of Increasing Binder Content on Slump Flow
Materials Mixtures 3 4 6 19 22 23 29
Total Cementitious Materials (lb/yd3) 611 711 811 761 786 750 775
Coarse Aggregate (lb/yd3) 1527 1429 1332 1380 1357 1392 1367
Fine Aggregate (lb/yd3) 1606 1506 1402 1454 1428 1465 1439
Water (lb/yd3) 269 313 357 335 346 330 341 Water/Binder 0.44 0.44 0.44 0.44 0.44 0.44 0.44
Sand/Aggregate 0.52 0.52 0.52 0.52 0.52 0.52 0.52 ADVA CAST 530 (fl oz./cwt) --- --- --- --- --- --- ---
ADVA 170 (fl oz./cwt) 5 5 5 5 5 --- --- ADVA CAST 575 (fl oz./cwt) --- --- --- --- --- 7 7
Fresh Concrete Properties Slump Flow (in.) --- 14 25 19 22 23 28.5

159
In mixture # 3, a binder content of 611 lb/yd3 (362.49 kg/m3) was employed. At
this binder content, the concrete did not acquire any flowability; in fact, it still had a
slump. So for mixture # 4, the binder content was increased to 711 lb/yd3 (421.82 kg/m3).
When the slump flow test was performed, the concrete did spread out. However, it had
attained limited flowability; a slump flow of 14 in. (355.6 mm) was recorded. To allow
for more water to be utilized during mixing, in mixture # 6 the binder content was further
increased to 811 lb/yd3 (481.15 kg/m3). This resulted in an adequate slump flow of 25 in.
(635 mm). This progression in mixing shows that slump flows will improve as binder
contents are elevated and the w/b held constant.
For the next two mixtures displayed in Table 5.10, the goal was to optimize the
binder content. Mixture # 19 was batched at a binder content of 761 lb/yd3 (451.48
kg/m3). When tested, an insufficient slump flow of 19 in. (482.6 mm) was measured. In
mixture # 22, the binder content was increased to 786 lb/yd3 (466.32 kg/m3). This
resulted in a recorded slump flow of 22 in. (558.8 mm). It is important to note that neither
of these mixtures qualified as SCC due to limited flowability. However, the trend is still
evident that an increase in binder content will improve concrete flowability for a constant
w/b.
In the last two mixtures exhibited in Table 4.10, the HRWR source and dosage
rate incorporated during mixing were different than in previous mixtures. However, these
parameters were invariable in mixtures # 23 and # 29. In mixture # 23, the binder content
was 750 lb/yd3 (444.96 kg/m3). When fresh concrete testing was conducted, an average
slump flow of 23 in. (584.2 mm) was measured. For mixture # 29, a binder content of
775 lb/yd3 (459.79 kg/m3) resulted in a slump flow of 28.5 in. (723.9 mm). These
160
findings verify that an increase in binder content will improve slump flow regardless of
the HRWR source or dosage rate.
5.5.1.2 Binder Content and Stability
An adequate binder content is essential in producing SCC. The higher the binder
content, the more water that is allotted for mixing, which results in enhanced flowability.
This tendency has already been established. However, as binder content increases the
potential for segregation increases as well. This occurs because the density of the mixture
is decreased; water is accounting for volume that was previously occupied by coarse and
fine aggregate particles. As a result, this increased water content can lead to segregation.
The effect an increase in binder content had on the density and segregation potential of
certain mixtures is shown in Table 5.11.

161
Table 5.11: Effect of Increasing Binder Content on Concrete Density and Segregation Potential
Materials Mixtures 23 21 30
Total Cementitious Materials (lb/yd3) 750 761 775
Coarse Aggregate (lb/yd3) 1392 1324 1367
Fine Aggregate (lb/yd3) 1465 1509 1439
Water (lb/yd3) 330 335 341 Water/Binder 0.44 0.44 0.44
Sand/Aggregate 0.52 0.54 0.52
Concrete Density (lb/ft3) 145.8 145.5 145.1 ADVA CAST 530 (fl oz./cwt) --- --- ---
ADVA 170 (fl oz./cwt) --- 7 --- ADVA CAST 575 (fl oz./cwt) 7 --- 6
Fresh Concrete Properties Slump Flow (in.) 23 29 32.5
Segregation Observed no yes yes VSI 0.5 2 3
Bleed Water no yes yes
For the three mixtures listed above in Table 5.11, as binder content increased the
concrete densities decreased. Subsequently, these mixtures progressively became more
unstable. Mixture # 23 was batched with a binder content equal to 750 lb/yd3 (445
kg/m3). The density was calculated to be 145.8 lb/ft3 (2335 kg/m3), and the concrete did
not show any signs of segregation or bleed water. Conversely, the slump flow for mixture
# 21 showed evidence of bleed water as well as segregation. In this mixture, the only
significant change made to the mix design was that the binder content was increased to
761 lb/yd3 (451.48 kg/m3). This caused the density to decrease to a value of 145.5 lb/ft3
(2330.69 kg/m3) as well. Moreover, in mixture # 30 the binder content was further

162
increased to 775 lb/yd3 (459.79 kg/m3). The slump flow of this mixture was highly
unstable; severe segregation and a large quantity of bleed water justified a VSI
designation equal to 3. Also, the density was reduced even more; a value of 145.1 lb/ft3
(2324.28 kg/m3) was computed. These results prove two effects. First of all, as binder
content is elevated, the density will decrease. Secondly, a decrease in density will
ultimately increase the segregation potential for SCC mixtures. This does not necessarily
mean that segregation will occur, but the concrete is definitely put at a greater risk.
5.5.1.3 High Binder Content (with Class C FA Replacement) and Stability
It is imperative for SCC mixtures to have high binder contents. High binder
contents have the capacity to improve flowability, but they can also lead to instability.
The latter case is intensified more whenever Class C FA is utilized as cement
replacement. The basis for this is that FA has a lower specific gravity than portland Type
I cement (2.20 vs. 3.15). Therefore, whenever a percentage of cement is replaced by FA,
the FA takes up more volume than that same equivalent amount of cement. As a result,
the volumes of coarse and fine aggregates are further reduced to account for the increase
in binder volume. Ultimately, this decreases the density of SCC. With such a high
volume of binder utilized during mixing, excess cement paste can occur and lead to
segregation. The effect an increase in FA replacement had on the density and segregation
potential of particular mixtures is exhibited in Table 5.12.

163
Table 5.12: Effect of an Increase in FA Replacement on Concrete Density and Segregation Potential
Materials Mixtures 37 41 44 47 48
Total Cementitious Materials (lb/yd3) 775 775 775 775 775 Fly Ash (%) --- 5 10 15 20
Coarse Aggregate (lb/yd3) 1482 1475 1355 1348 1453
Fine Aggregate (lb/yd3) 1327 1322 1425 1417 1302
Water (lb/yd3) 341 341 341 341 341 Water/Binder 0.44 0.44 0.44 0.44 0.44
Sand/Aggregate 0.48 0.48 0.52 0.52 0.48
Concrete Density (lb/ft3) 145.4 144.9 144.3 143.7 143.4 ADVA CAST 530 (fl oz./cwt) --- --- --- --- ---
ADVA 170 (fl oz./cwt) --- --- --- --- --- ADVA CAST 575 (fl oz./cwt) 7 7 7 8 7
Fresh Concrete Properties Slump Flow (in.) 27 26 28.5 29.5 28
Segregation Observed no no no yes yes VSI 1 1 1.5 3 2.5
Bleed Water no yes yes yes yes
The five mixtures included above contained a binder content of 775 lb/yd3
(459.79 kg/m3). As FA was added and the replacement rate was incrementally increased,
the concrete densities decreased accordingly. As a result, the stability of the mixtures
declined as well. For mixture # 37, a density of 145.4 lb/ft3 (2329.08 kg/m3) was
measured. Also, the slump flow spread did not show any indication of bleed water or
segregation. In mixture # 41, a FA replacement rate of 5% was employed. The density
decreased to a value of 144.9 lb/ft3 (2321.08 kg/m3), and bleed water was present after
the slump flow test was operated. However, segregation did not occur. A FA substitution

164
rate of 10% was used in mixture # 44. This decreased the density to 144.3 lb/ft3 (2311.46
kg/m3). Additionally, when fresh concrete testing was conducted, the concrete was on the
verge of segregating. For mixture # 47, the FA replacement rate was set at 15%. This
reduced the density further; a value of 143.7 lb/ft3 (2301.85 kg/m3) was calculated.
Moreover, severe segregation occurred during fresh concrete testing. In mixture # 48, the
substitution rate of FA was further increased to 20%. This modification reduced the
density to 143.4 lb/ft3 (2297.05 kg/m3). In addition, the concrete segregated even though
it was batched with less HRWR than the previous mixture. These findings confirm that as
FA is added and incrementally increased in SCC mixtures, the concrete density will
decrease. Furthermore, this decrease in density will increase the segregation potential of
each mixture. As stated earlier, this does not automatically denote that segregation will
indeed occur. However, the concrete will be more susceptible to the effects of
segregation.
5.5.1.4 Conclusion
It has been demonstrated that increasing binder content will enhance the
flowability of SCC. However, as binder content is increased, the density of the mixture
will decrease. This decrease in density can lead to instability. Also, at already high binder
contents, replacing a portion of the cement with FA results in SCC mixtures having lower
densities. Therefore, SCC mixtures containing high percentages of FA are at an even
greater risk for developing segregation. An agenda to combat the effects of segregation is
presented in the following section.

165
5.5.2 HRWRs
HRWRs are an essential element in developing SCC mixtures. When utilized,
these admixtures significantly impact the rheological properties of SCC. Many different
kinds of HRWRs are available for use in various applications. However, any single
HRWR will not be compatible in every circumstance. Most HRWRs are formulated to
enhance flowability while also combating the onset of segregation. For this reason, it
would be difficult to produce flowable yet stable SCC mixtures without implementing at
least one HRWR in the mixing regimen. In this research program, three different types of
HRWRs were employed during trial batching. Table 5.13 shows the effects of HRWR
type and dosage rate on the rheological properties of selected trial mixtures.
Table 5.13: Effects of HRWR Type and Dosage Rate on Rheological Properties
Materials Mixtures 1 2 19 20 33 34
Total Cementitious Materials (lb/yd3) 611 611 761 761 775 775 Coarse Aggregate (lb/yd3) 1550 1527 1380 1380 1425 1425 Fine Aggregate (lb/yd3) 1631 1606 1454 1454 1384 1384
Water (lb/yd3) 251 269 335 335 341 341 Water/Binder 0.41 0.44 0.44 0.44 0.44 0.44
Sand/Aggregate 0.52 0.52 0.52 0.52 0.5 0.5 ADVA CAST 530 (fl oz./cwt) 3 2.5 --- --- --- ---
ADVA 170 (fl oz./cwt) --- 2.5 5 7 --- --- ADVA CAST 575 (fl oz./cwt) --- --- --- --- 7 8
Fresh Concrete Properties Slump Flow (in.) --- --- 19 28 25 29
Segregation Observed --- --- no no no no VSI --- --- 1 1 0 0
Bleed Water --- --- no no no no T-20 (sec) --- --- --- 4.13 7.49 3.88
166
Initially, ADVA Cast 530 was used because this type of HRWR improves concrete
flowability without causing segregation. ADVA Cast 530 was only utilized in the first two
trial mixtures, and neither of these mixtures was able to acquire any degree of flowability.
However, the author attributes this occurrence to the low binder content (611 lb/yd3,
362.49 kg/m3).
The next HRWR that was used in trial batching was ADVA 170. ADVA 170 was
selected because it has the ability to produce concrete mixtures that are extremely
workable, and it also improves the slump life of concrete without lengthening the setting
time. Twenty-one trial mixtures were batched with this HRWR. In Table 4.13 above,
when mixtures # 19 and 20 are compared it is evident that an increase in the ADVA 170
dosage rate reduced the yield stress of the concrete. The slump flow measurement
improved (28 in. (711.2 mm) vs. 19 in. (482.6 mm)), but perhaps more importantly, the
stability did not change.
The final HRWR that was utilized was ADVA Cast 575. This HRWR was used
throughout the remainder of trial batching because it is designed to produce concrete
mixtures that are particularly workable without segregating. ADVA Cast 575 was
employed in thirty trial mixtures. If mixtures # 33 and 34 are compared (Table 5.13), it
can be seen that an increase in the addition rate of ADVA Cast 575 decreased the yield
stress of the concrete. The results show that the average slump flow diameter was
increased (29 in. (736.6 mm) vs. 25 in. (635 mm)), and the T-20 (T-50) time decreased
significantly (3.88 seconds vs. 7.49 seconds). Also, the stability of the mixture was
constant.

167
From these results, the mixtures that were batched with ADVA 170 and ADVA
Cast 575 demonstrated an improvement in flowability while preserving the stability of
the mixtures. Therefore, both of these HRWRs are recommended for use in producing
SCC.
5.5.3 S/Agg
The S/Agg is another element that affects the flowability of SCC. In general, as
the S/Agg increases so does flowability. The reason for this is that an increase in the
S/Agg reduces the coarse aggregate content. This, in turn, reduces the overall viscosity of
the mixture. For instance, consider the slump flow test. When the S/Agg is increased, the
decreased quantity of coarse aggregate particles does not collide at the outlet of the slump
cone as frequently whenever the test is being performed. This results in improved slump
flows and decreased T-20 (T-50) times. This effect is displayed in Table 5.14.

168
Table 5.14: Effect of Increasing S/Agg on Slump Flow and T-20 (T-50)
Materials Mixtures 6 7 8 20 21 33 29 50 51
Total Cementitious Materials (lb/yd3) 811 811 811 761 761 775 775 775 775
Fly Ash (%) --- --- --- --- --- --- --- 20 20 Coarse Aggregate
(lb/yd3) 1332 1277 1222 1380 1324 1425 1367 1397 1341 Fine Aggregate
(lb/yd3) 1402 1455 1509 1454 1509 1384 1439 1356 1411 Water (lb/yd3) 357 357 357 335 335 341 341 341 341 Water/Binder 0.44 0.44 0.44 0.44 0.44 0.44 0.44 0.44 0.44
Sand/Aggregate 0.52 0.54 0.56 0.52 0.54 0.5 0.52 0.5 0.52 ADVA CAST 530
(fl oz./cwt) --- --- --- --- --- --- --- --- --- ADVA 170 (fl
oz./cwt) 5 5 5 7 7 --- --- --- --- ADVA CAST 575
(fl oz./cwt) --- --- --- --- --- 7 7 6 6 Fresh Concrete Properties
Slump Flow (in.) 25 26 27.5 28 29 25 28.5 24.5 28 T-20 (sec) 5.37 5.16 4.53 4.13 4.04 7.49 5.07 3.71 2.98
The first set of mixtures detailed in Table 5.14 consists of mixtures # 6, 7, and 8.
These mixtures were batched with a binder content of 811 lb/yd3 (481.15 kg/m3). As the
S/Agg was increased (0.52, 0.54, 0.56), the slump flows increased (25, 26, 27.5 in. (635,
660.4, 698.5 mm)). This also decreased the T-20 (T-50) times (5.37, 5.16, 4.53 seconds).
The second array included mixtures # 20 and 21. For these mixtures, the binder content
was 761 lb/yd3 (451.48 kg/m3). When the S/Agg increased from 0.52 to 0.54, the average
slump flow diameters also increased (29 in. vs. 28 in. (736.6 mm vs. 711.2 mm)). In
addition, the T-20 (T-50) measurements decreased from 4.13 to 4.04 seconds. The third
selection was comprised of mixtures # 33 and 39. These mixtures had a binder content
equal to 775 lb/yd3 (459.79 kg/m3). The results show that whenever the S/Agg increased

169
from 0.50 to 0.52, the slump flows also increased from 25 in. (635 mm) to 28.5 in. (723.9
mm). This modification to the mix design produced a less viscous mixture, thus the T-20
(T-50) time decreased from 7.49 to 5.07 seconds. The final assortment contained
mixtures # 50 and 51. These mixtures were batched with the same binder content as the
previous range. However, a cement replacement of 20% FA was utilized. The findings
display that when the S/Agg increased from 0.50 to 0.52, the corresponding slump flows
expanded from 24.5 in. (622.3 mm) to 28 in. (711.2 mm). Furthermore, the T-20 (T-50)
times were faster (2.98 vs. 3.71 seconds).
Overall, these results verify that (regardless of binder content) an increase in
S/Agg will improve the flowability and decrease the viscosity of SCC.
5.5.4 Steps to Develop SCC
Through trial batching in this research program, a methodology was followed to
develop SCC mixtures. The steps associated with this methodology are presented below.
Step 1: Achieve adequate flowability
I. Select a w/b based on literature. *NOTE: For this research program, the
w/b was recommended to be a constant value of 0.44. The concrete was
classified as Class S “structural”, and it did not have any significant
compressive strength requirements. In this study, fifteen SCC mixtures
were developed with a w/b equal to 0.44. For that reason, (w/b = 0.44) is
recommended for use in the field.

170
II. Select an initial binder (water) content based on literature. *NOTE: For
this research program, the Standard Specifications5 mandated that the
minimum allowable binder content was 611 lb/yd3 (362.49 kg/m3).
Therefore, this was the initial binder content that was used. However, SCC
was unable to be batched at this binder content because an insufficient
amount of water was provided. In this study, the lowest binder content at
which SCC was able to be batched consistently was 775 lb/yd3 (459.79
kg/m3). As a result, 775 lb/yd3 (459.79 kg/m3) is the minimum binder
content that is recommended for use when batching SCC.
III. Select an initial S/Agg value based on literature. Previous research
conducted at the University of Arkansas77 recommends S/Agg values
ranging from 0.44 to 0.56 for batching SCC. However, in this research
program, only the central portion of the specified range (0.48 – 0.52)
produced SCC mixtures consistently. Thus, S/Agg values of 0.48, 0.50,
and 0.52 are recommended for use.
IV. Batch trial mixtures to establish an adequate HRWR dosage rate. *NOTE:
If the HRWR dosage rate exceeds the maximum value listed by the
manufacturer and the mixture still does not classify as SCC, the binder
content should be increased.
V. The S/Agg value can be incrementally increased to enhance flowability (if
needed).
VI. Slump flow spreads ranging from 23.5 to 30.0 in. (596.9 – 762 mm) are an
indication of adequate flowability. Any measurement that falls within this

171
specified range is recommended. Slump flows that are less than 23.5 in.
(596.9 mm) in diameter are susceptible to blockage problems, and slump
flows that exceed 30.0 in. (762 mm) have high segregation potential
Step 2: Achieve adequate blockage resistance
I. T-20 (T-50) measurements that take longer than 6 seconds indicate that
the mixture is viscous. As a result, blockage may occur.
II. Reducing the size of coarse aggregate can improve T-20 (T-50)
measurements and decrease blockage potential.
III. Increasing the S/Agg can improve T-20 (T-50) measurements and decrease
blockage potential.
IV. The height difference between SCC inside and outside the J-Ring is
recommended to be less than or equal to 0.5 in. (12.7 mm); a measurement
that exceeds this stipulation is an indication that the concrete does not
have sufficient passing ability.
V. The difference between the slump flow spread and the J-Ring spread is
recommended to be less than 4.0 in. (101.6 mm); a measurement that
exceeds this specification suggests that the SCC is not adequate to
permeate the reinforcement.
Step 3: Achieve adequate segregation resistance
I. T-20 (T-50) times less than 2 seconds indicate that the mixture is
extremely flowable. As a result, segregation may occur.

172
II. Do not exceed the manufacturer’s maximum recommended dosage rate of
HRWR. This can lead to segregation because the HRWR may surpass its
saturation point.
III. VSI designations that are less than or equal to 1.5 are recommended.
IV. Decreasing binder (water) content can improve concrete stability by
increasing the density.
V. In this research program, SCC was developed with FA replacement rates
that varied from 5 to 25%. Thus, this provision (5 – 25%) is recommended
for use.
VI. If FA is included as a percentage replacement of cement and the mixture
experiences segregation, the FA replacement rate can be reduced. This
will improve concrete stability by increasing the density.
Step 4: Batch additional trial mixtures to ensure consistent results

173
CHAPTER 6
CASTING REINFORCED BOX CULVERTS USING THE DEVELOPED SCC MIXTURES
6.1 INTRODUCTION
This chapter reviews the casting of two reinforced box culverts using the
developed SCC mixtures. The first box culvert was cast with mixture #29 (5.3.5), and the
second box culvert was cast with mixture # 52 (5.4.2). The corresponding mixture
designs are displayed below in Table 6.1. This chapter also presents difficulties that the
author experienced during this procedure combined with an explanation of how the
problems were resolved.
Table 6.1: Mixture Designs used in Culvert Casting
Materials Mixtures 29 52
Total Cementitious Materials (lb/yd3) 775 775 Fly Ash (%) --- 25
Coarse Aggregate (lb/yd3) 1367 1445
Fine Aggregate (lb/yd3) 1439 1295
Water (lb/yd3) 341 341 Water/Binder 0.44 0.44
Sand/Aggregate 0.52 0.48 ADVA CAST 530 (fl oz./cwt) --- ---
ADVA 170 (fl oz./cwt) --- --- ADVA CAST 575 (fl oz./cwt) 7 6

174
6.2 REINFORCED BOX CULVERT DESIGN
The culverts were designed using two of the Arkansas State Highway
Commission’s standard drawings78, 79 as a reference. Preliminary dimensions were
chosen. The author selected a clear span of 4 ft. (1.22 m), a clear height of 4 ft. (1.22 m),
and an overall width of 5 ft. (1.52 m) for each culvert. For these dimensions, the
thickness of the top slab was set at 7 in. (177.8 mm), the thickness of each sidewall was 6
in. (152.4 mm), and the thickness of the bottom slab was 6.5 in. (165.1 mm).This resulted
in an overall height of 5 ft. 1.5 in. (1.56 m). Also, the culverts were cast vertically to a
depth of 5 ft. (1.52 m). This resulted in a total required concrete volume of approximately
1.78 yd3 (1.36 m3) for each culvert.
After the clear span, clear height, and depth of the culverts were chosen, the
reinforcing steel was designed. In the top and bottom slabs of each barrel, five # 5 rebar
that were 57 in. (1.45 m) in length were spaced at 12 in. (304.8 mm). In addition, five # 6
bent rebar that were 70 in. (1.78 m) in length (7 in. (177.8 mm) per 180 degree hook)
were alternated every 12 in. (304.8 mm). The longitudinal steel located in the top slab of
each barrel consisted of six # 5 rebar that were 57.5 in. (1.46 m) in length and spaced at
10.5 in. (266.7 mm). Eight # 4 rebar were included longitudinally in the sidewalls of both
culverts. These rebar were 57.5 in. (1.46 m) long and spaced at 8 in. (203.2 mm). The
longitudinal steel positioned in the bottom slab of the barrels was comprised of five # 4
rebar that were 57.5 in. (1.46 m) in length and spaced at 12 in. (304.8 mm). Lastly, six #
4 rebar that were 59 in. (1.50 m) long and spaced at 11.5 in. (292.1 mm) were
incorporated vertically in the sidewalls of each culvert. This resulted in 59 total rebar that
was required for each culvert. The cross-section of each culvert including rebar

175
placement is presented in Figure 6.1. Additionally, Figure 6.2 shows the steel-ply
formwork and bundles of rebar before the culverts were assembled.
Figure 6.1: Culvert Cross-Section Including Rebar Placement
Five # 5 rebar at 12 in. and 57 in. in length alternated with five # 6 hooked rebar at 12 in. and 70 in. in
length
Five # 5 rebar at 12 in. and 57 in. in length alternated with five # 6 hooked rebar at 12 in. and 70 in. in
length
Six # 5 rebar at 10.5 in. and 57.5 in. in length
Five # 4 rebar at 12 in. and 57.5 in. in length
Six # 4 rebar at 11.5 in. and 59 in. in length
Six # 4 rebar at 11.5 in. and 59 in. in length
Eight # 4 rebar at 8 in. and 57.5 in. in length
Eight # 4 rebar at 8 in. and 57.5 in. in length

176
Figure 6.2: Steel-ply Formwork and Rebar
6.3 ASSEMBLY
The culverts were cast on a concrete pad behind the ERC. The culverts were
spaced several feet apart and free from obstructions so that a ready-mix truck could back
up and dispense the concrete without any interference. To make the base of each culvert,
the author cut multiple sheets of 5/8 in. (15.88 mm) plywood to size and stapled them
together. The formwork used for the culverts consisted of a set of steel-ply pieces that
were rented from Darragh Company in Lowell, Arkansas.

177
6.3.1 Erection
6.3.1.1 Inner Wall
The first goal was to construct the inner wall of each culvert. To accomplish this,
the steel-ply pieces were put together by pushing steel keys through adjoining members
which created a tight lock. Each side of the wall consisted of one 1 ft. (304.8 mm) wide
steel-ply section, one 2 ft. (609.6 mm) wide steel-ply section, and two 6 in. (152.4 mm)
wide corner pieces. For the middle section of each wall, steel wall ties were inserted
between the neighboring steel-ply sections before they were locked; the steel wall ties
provided lateral reinforcement and spanned from the inner wall to the outer wall of each
culvert. When one side of the wall was completed, it was picked up and situated on top of
the plywood base. The next step was to combine the other three wall sections in the same
manner. Once this was done, the inner wall was completely assembled. Lastly, the author
secured the formwork to the base with wood screws. The steel key locking system can be
seen in Figure 6.3, and the completed inner wall of the first culvert is displayed in Figure
6.4.
Figure 6.3: Steel Key Locking System
Steel Key Locking System
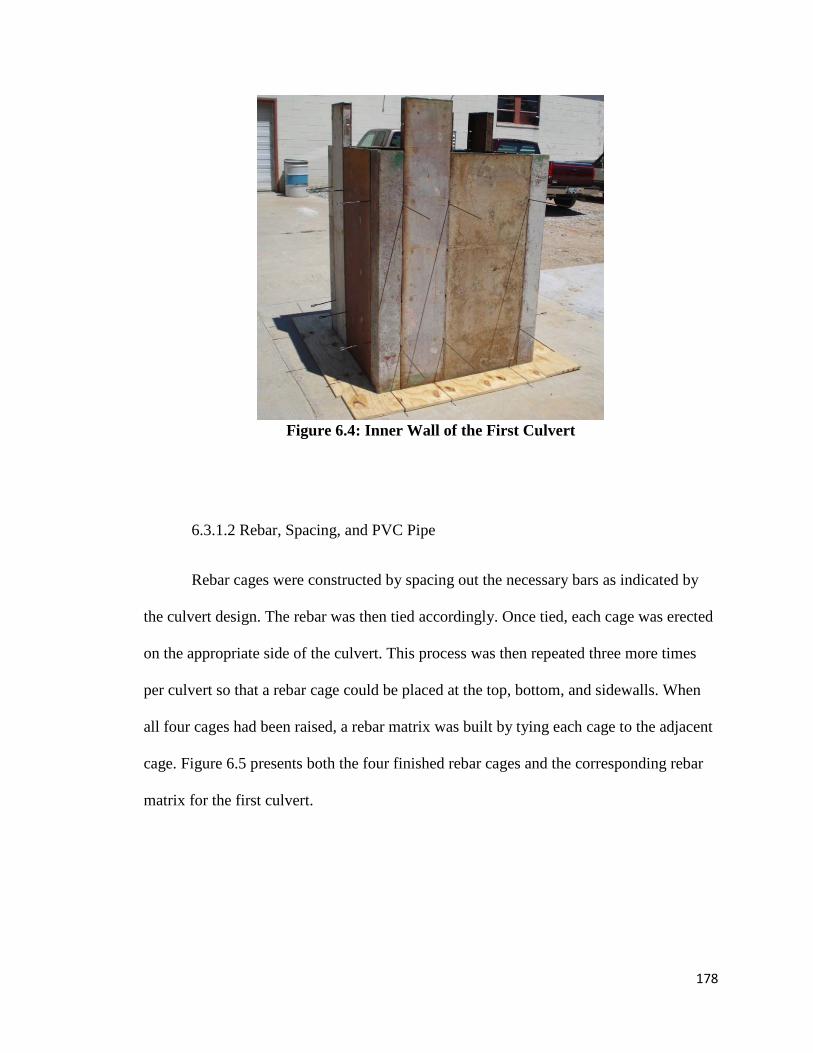
178
Figure 6.4: Inner Wall of the First Culvert
6.3.1.2 Rebar, Spacing, and PVC Pipe
Rebar cages were constructed by spacing out the necessary bars as indicated by
the culvert design. The rebar was then tied accordingly. Once tied, each cage was erected
on the appropriate side of the culvert. This process was then repeated three more times
per culvert so that a rebar cage could be placed at the top, bottom, and sidewalls. When
all four cages had been raised, a rebar matrix was built by tying each cage to the adjacent
cage. Figure 6.5 presents both the four finished rebar cages and the corresponding rebar
matrix for the first culvert.

179
Figure 6.5: Rebar Cages and the Corresponding Rebar Matrix
Each rebar matrix was tied with 40 ought wire and was then suspended from a
series of crossing rebar that was laid across the top of the formwork; this guaranteed that
the vertical spacing requirements were satisfied. To ensure that the horizontal spacing
requirements were met, rebar chairs were placed between the inner wall and the sides of
the rebar matrix. After that, the rebar chairs were tied to the matrix so that the spacing
would remain constant whenever the SCC was poured.
Subsequently, PVC pipe that had an outside diameter of 1.5 in. (38.1 mm) was cut
to size and positioned around the steel wall ties. In the field, this would simulate
drainage. However, it also served an additional purpose. The PVC pipe along with the
rebar chairs and the congested rebar matrix would test the flowability of the SCC. A view
of the first culvert at this stage of erection is exhibited in Figure 6.6.

180
Figure 6.6: Completed Inner Structure of the First Box Culvert
6.3.1.3 Outer Wall
Once the inner structure of each box culvert was finished, the outer wall was
connected by the same method as the inner wall. The top and bottom sides of each wall
consisted of three 1 ft. (304.8 mm) wide steel-ply sections, and one 2 ft. (609.6 mm) wide
steel-ply section. To account for the additional 1.5 in. (38.1 mm) that was necessary on
each sidewall, a 1 in. (25.4 mm) steel spacer was inserted at the top of each wall. At the
bottom of the wall, a 0.5 in. (12.7 mm) spacer was needed on either side. The spacer was
made by cutting a sheet of ½ in. (12.7 mm) plywood to size. To secure the spacer to the

181
formwork, several holes were bored along the length of the plywood so the steel keys
could fit through it and be locked.
The aforementioned steel wall ties were provided by Darragh Company and came
in two sizes. The ties in the sidewalls of each culvert had a clear span of 6 in. (152.4
mm). These ties fit securely without being altered. However, the steel ties used in the top
and bottom slabs of the culverts were required to be unusual sizes (7 and 6.5 in. (177.8,
165.1 mm)). Therefore, these ties were made by using # 2 straight rebar. The rebar was
cut in 24 in. (609.6 mm) sections to make certain that adequate length would be provided
to properly secure it. To lock the rebar tightly in place between the inner and outer
formwork, a series of clamps were placed around the rebar and firmly fastened. Once this
task was completed, the outer formwork was secured to the plywood base with wood
screws. Figure 6.7 shows the two culverts near completion.
Figure 6.7: Reinforced Box Culverts near Completion

182
6.4 TRIAL BATCHING
Even though a rotating drum mixer was located on site at the ERC, the research
team elected to have a ready-mix company mix, deliver, and pour the concrete for the
culverts. For this research program, Arkhola Sand & Gravel Company was used. The
culverts required a much larger volume of concrete than was utilized whenever the SCC
mixtures were being developed (1.78 yd3 vs. 2 ft3, (1.36 m3 vs. 0.06 m3)). Also, it was
expected that the friction and shearing rates were different from a rotating drum mixer to
a ready-mix concrete truck. For these two reasons, trial batching was conducted at
Arkhola Sand & Gravel Company’s plant in Johnson, Arkansas so the mixtures could be
modified (if necessary) prior to the culverts being cast.
6.4.1 SCC Mixture # 1
6.4.1.1 Trial Batch # 1a
The first culvert was cast using mixture # 29, which was developed during the
laboratory phase of the study. For the first batch, all of the constituent materials except
the HRWR were added to the ready-mix truck. The HRWR was not included at this time
so the workability of the concrete could be assessed by performing a traditional slump
test. The slump would give the research team a better understanding of how workable the
concrete actually was. From this measurement, a HRWR dosage could be determined. To
simulate the time it would take for the concrete to be delivered to the ERC, the initial
mixing time was 20 minutes. After this time had elapsed, a sample of concrete was
poured into a wheel barrow (Figure 6.8) and the slump test was conducted. The mixture

183
had an initial slump of 2.75 in. (69.85 mm) (Figure 6.9). The HRWR dosage rate was
decreased from 7 to 6 fl. oz. /cwt (391.19 mL/100 kg). Once the HRWR was added
(Figure 6.10), the concrete was mixed for 5 minutes. When that time had passed, a
sample of concrete was placed into the wheel barrow and the slump flow test was
performed. Before the test was initiated, it was apparent that segregation had already
occurred (Figure 6.11). The test was still performed regardless (Figure 6.12). Severe
segregation was observed (VSI = 3), so the mixture was discarded.
Figure 6.8: Sample of Trial Batch # 1a Before HRWR was Added
Figure 6.9: Conducting Slump Test on Sample of Trial Batch # 1a

184
Figure 6.10: Adding HRWR to Trial Batch # 1a
Figure 6.11: Segregation Observed in Trial Batch # 1a

185
Figure 6.12: View of Slump Flow Spread for Trial Batch # 1a
6.4.1.2 Trial Batch # 1b
Since trial batch # 1a had undesirable fresh concrete properties, a second trial
batch was mixed. Batching for this mixture began approximately 40 minutes after the
first. The volume of concrete, mixture proportions, and batching sequences were identical
to trial batch # 1a. After the initial batching sequence was completed, the concrete sample
had a slump of 3.25 in. (82.55 mm). This value was larger than the slump of trial batch #
1a which experienced segregation. For these reasons, the initial HRWR dosage rate was
reduced to 3 fl. oz. /cwt (195.60 mL/100 kg). After 5 minutes of batching, the slump flow
was 14.5 in. (368.3 mm). Since the concrete had limited flowability, an additional 1 fl.
oz. /cwt (65.20 mL/100 kg) was added at this time. Once this 5 minute batching sequence
was complete, the slump flow was 20 in. (508 mm). A small aggregate pile was present
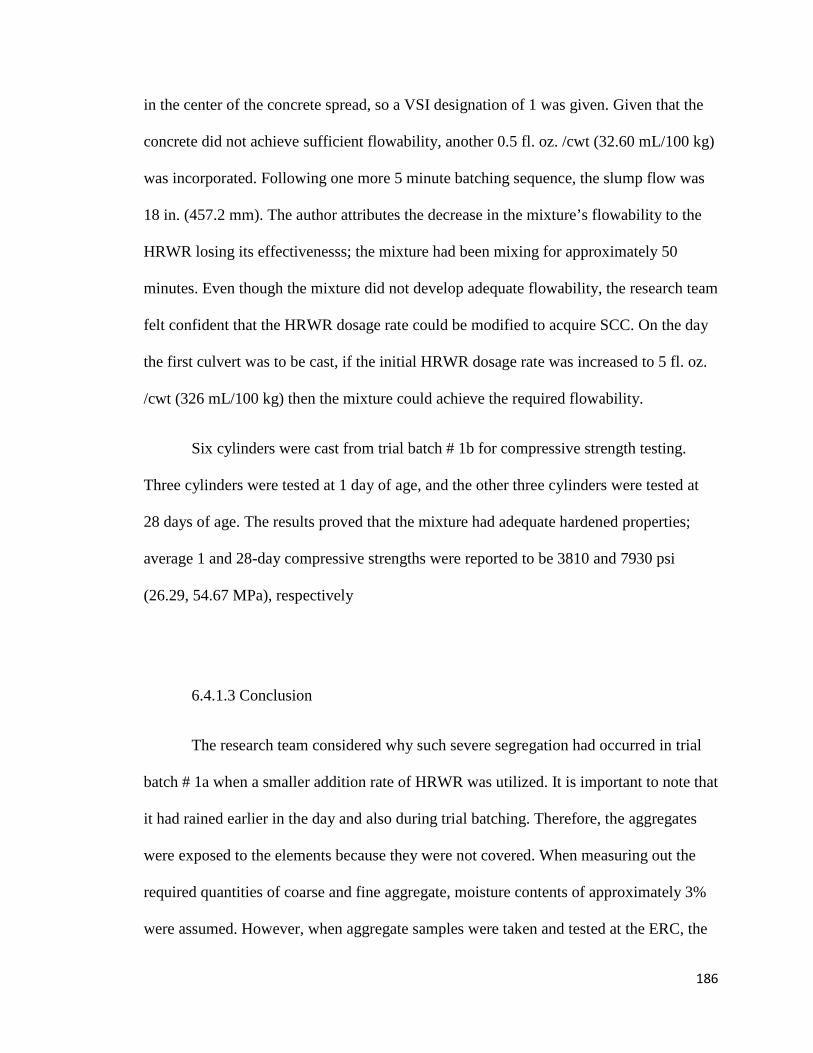
186
in the center of the concrete spread, so a VSI designation of 1 was given. Given that the
concrete did not achieve sufficient flowability, another 0.5 fl. oz. /cwt (32.60 mL/100 kg)
was incorporated. Following one more 5 minute batching sequence, the slump flow was
18 in. (457.2 mm). The author attributes the decrease in the mixture’s flowability to the
HRWR losing its effectivenesss; the mixture had been mixing for approximately 50
minutes. Even though the mixture did not develop adequate flowability, the research team
felt confident that the HRWR dosage rate could be modified to acquire SCC. On the day
the first culvert was to be cast, if the initial HRWR dosage rate was increased to 5 fl. oz.
/cwt (326 mL/100 kg) then the mixture could achieve the required flowability.
Six cylinders were cast from trial batch # 1b for compressive strength testing.
Three cylinders were tested at 1 day of age, and the other three cylinders were tested at
28 days of age. The results proved that the mixture had adequate hardened properties;
average 1 and 28-day compressive strengths were reported to be 3810 and 7930 psi
(26.29, 54.67 MPa), respectively
6.4.1.3 Conclusion
The research team considered why such severe segregation had occurred in trial
batch # 1a when a smaller addition rate of HRWR was utilized. It is important to note that
it had rained earlier in the day and also during trial batching. Therefore, the aggregates
were exposed to the elements because they were not covered. When measuring out the
required quantities of coarse and fine aggregate, moisture contents of approximately 3%
were assumed. However, when aggregate samples were taken and tested at the ERC, the

187
actual moisture contents of the coarse and fine aggregates were reported to be 4.39 and
12.03%, respectively. These results showed that a larger quantity of water was included
during mixing than was required by the mix design. This explains why the initial slump
measurements were so high. The batch time, batch size, HRWR dosage rate, and fresh
and hardened concrete properties for the two trial batches conducted on the first SCC
mixture are located below in Table 6.2.
Table 6.2: Trial Batch # 1a and Trial Batch # 1b Details
Culvert SCC Mixture # 1 Trial Batch # 1a Trial Batch # 1b
Batch Time 1:00 P.M. 1:40 P.M.
Batch Size (yd3) 2.0 2.0
Initial Slump (in.) 2.75 3.25
ADVA CAST 575 (fl oz./cwt) 6 4 Slump Flow (in.) --- 20
Segregation Observed yes no VSI 3 1
Bleed Water yes no
T-20 (sec) --- --- 1-day Compressive Strength (psi) --- 3810 7-day Compressive Strength (psi) --- --- 28-day Compressive Strength (psi) --- 7930
6.4.2 SCC Mixture # 2
For the second trial mixture, 25% of the cement was replaced with FA (mixture #
52). This mix design was sent to Arkhola Sand & Gravel Company and a batching date

188
was set. The batching sequence and progression of tests did not change from those
utilized in the first SCC mixture (trial batch # 1a and # 1b). The initial slump was 0.5 in.
(12.7 mm). The preliminary HRWR dosage rate was 4 fl. oz. /cwt (260.79 mL/100 kg);
the research team decided to employ a lower dosage of HRWR in an attempt to promote
concrete flowability without causing segregation such that occurred in trial batch # 1a.
Following the 5 minute mixing sequence, the slump was 1.5 in. (38.1 mm). To advance
the flowability, an additional 2 fl. oz. HRWR /cwt (130.40 mL/100 kg) was added. After
another 5 minute mixing sequence, the slump flow was 18 in. (457.2 mm). The concrete
was flowable, but it was too viscous. For this reason, a supplementary 1 fl. oz. HRWR
/cwt (65.20 mL/100 kg) was incorporated to increase flowability. At this point a total of
118.35 fl. oz. (3500 mL) HRWR had been used. Following one more 5 minute mixing
sequence, the slump flow increased to 21 in. (533.4 mm). Also, a small aggregate pile
had settled in the middle of the spread; consequently, a VSI value of 1 was issued.
Although the concrete did not acquire the necessary flowability, no further HRWR was
added to the mixer. The research team elected to conclude batching because it was
believed that the HRWR was beginning to lose its effectiveness. SCC was not obtained,
but the concrete was still quite flowable. This result was promising. On the day of
batching, if the initial HRWR dosage rate was increased to 5 fl. oz. /cwt (326 mL/100 kg)
then the flowability would likely improve as well.
Nine cylinders were cast from this mixture for compressive strength testing. A set
of three cylinders were tested at 1, 7, and 28 days of age. The average 28-day
compressive strength was 11720 psi (80.83 MPa). The moisture contents of the coarse
and fine aggregates were also tested. The moisture contents of the coarse and fine
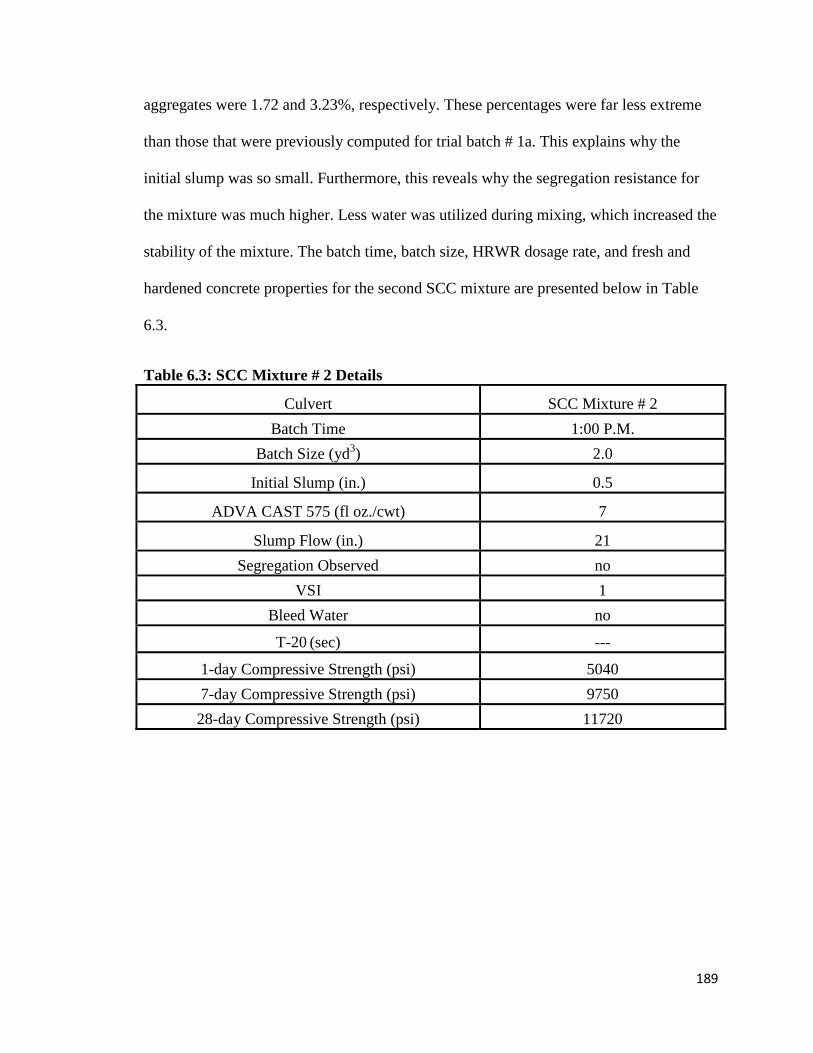
189
aggregates were 1.72 and 3.23%, respectively. These percentages were far less extreme
than those that were previously computed for trial batch # 1a. This explains why the
initial slump was so small. Furthermore, this reveals why the segregation resistance for
the mixture was much higher. Less water was utilized during mixing, which increased the
stability of the mixture. The batch time, batch size, HRWR dosage rate, and fresh and
hardened concrete properties for the second SCC mixture are presented below in Table
6.3.
Table 6.3: SCC Mixture # 2 Details
Culvert SCC Mixture # 2 Batch Time 1:00 P.M.
Batch Size (yd3) 2.0
Initial Slump (in.) 0.5
ADVA CAST 575 (fl oz./cwt) 7
Slump Flow (in.) 21 Segregation Observed no
VSI 1 Bleed Water no
T-20 (sec) ---
1-day Compressive Strength (psi) 5040 7-day Compressive Strength (psi) 9750 28-day Compressive Strength (psi) 11720

190
6.5 CASTING PROCEDURE
For both culverts, on the day prior to casting, a form-releasing agent was applied
to the forms to ensure easy formwork removal 24 hours after casting. The casting
procedure of both culverts is discussed in detail below.
6.5.1 Box Culvert # 1a
The first box culvert was cast with the original SCC mixture (mixture # 29)
containing only portland Type I cement as the binder constituent. For this culvert, 3 yd3
(2.29 m3) of concrete was batched. On the day of casting, the ready-mix truck arrived at
the ERC at 1:38 P.M. The batching sequence and series of tests were identical to those
performed during trial batching. The mixture had an initial slump of 1 in. (25.4 mm). To
improve workability, 5 fl. oz. /cwt (326 mL/100 kg) was used as the preliminary dosage
rate. After the 5 minute batching sequence, the slump flow was 18 in. (457.2 mm). At this
time, an additional 0.5 fl. oz. of HRWR /cwt (32.60 mL/100 kg) was added to improve
the flowability. Following another 5 minutes of mixing, the slump flow increased to 19
in. (482.6 mm). The mixture was stable, but a small aggregate pile was located in the
central portion of the spread. As a result, the VSI was 0.5. To further increase the
flowability, an additional 1 fl. oz. /cwt (65.20 mL/100 kg) was incorporated. Once the
next concrete sample was dispensed into the wheel barrow for testing, it was apparent
that the HRWR had lost its effectiveness (Figure 6.13). As soon as the slump flow test
was performed, the mixture was only able to develop a 5 in. (127 mm) slump.
Consequently, the mixture was rejected because the concrete did not acquire adequate
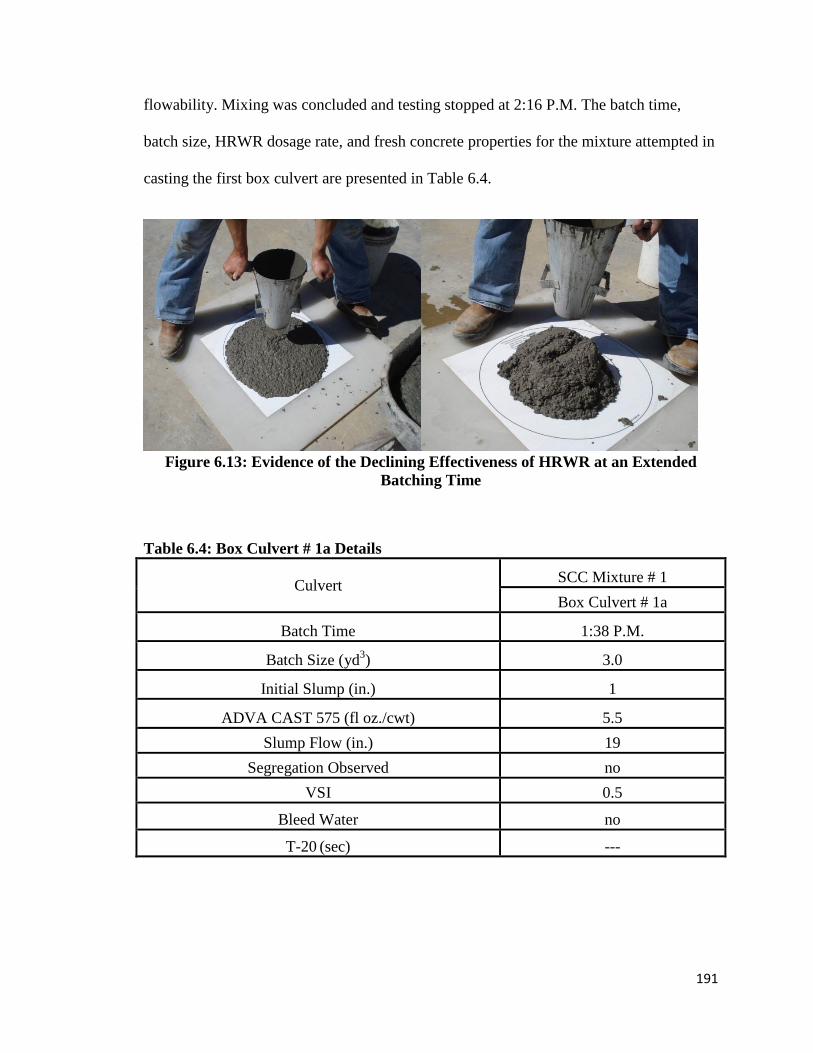
191
flowability. Mixing was concluded and testing stopped at 2:16 P.M. The batch time,
batch size, HRWR dosage rate, and fresh concrete properties for the mixture attempted in
casting the first box culvert are presented in Table 6.4.
Figure 6.13: Evidence of the Declining Effectiveness of HRWR at an Extended
Batching Time
Table 6.4: Box Culvert # 1a Details
Culvert SCC Mixture # 1 Box Culvert # 1a
Batch Time 1:38 P.M.
Batch Size (yd3) 3.0
Initial Slump (in.) 1
ADVA CAST 575 (fl oz./cwt) 5.5 Slump Flow (in.) 19
Segregation Observed no VSI 0.5
Bleed Water no
T-20 (sec) ---

192
6.5.2 Box Culvert # 1b
Since the preceding attempt at casting the first box culvert was unsuccessful, a
second batch was scheduled for the following day. The concrete arrived at 9:58 A.M, and
it had an initial slump of 1.5 in. (38.1 mm). At 10:00 A.M., 4 fl. oz. HRWR /cwt (260.79
mL/100 kg) was added. When tested at 10:10 A.M., the concrete had a slump of 3 in.
(76.2 mm). Two minutes later at 10:12 A.M., an additional 2 fl. oz. HRWR /cwt (130.40
mL/100 kg) was added. This increased the flowability; the slump flow spread was 19.5
in. (495.3 mm) at 10:19 A.M. To further improve flowability, 1 more fl. oz. HRWR /cwt
(65.20 mL/100 kg) was added at 10:20 A.M. The final series of fresh concrete tests was
conducted at 10:25 A.M. The T-20 (T-50) was 2.25 seconds, and the spread was 25.5 in.
(647.7 mm). The VSI was 0.5 due to the slight amount of bleed water that was present.
Upon operating the J-Ring test, a height difference between concrete inside and outside
the J-Ring was 0.25 in. (6.35 mm). Moreover, the J-Ring flow spread was larger in
diameter when compared with the slump flow spread; an average measurement of 27.25
in. (692.15 mm) was documented. This yielded a variation between the slump flow
spread and the J-Ring spread that was 1.75 in. (44.45 mm) in magnitude. Once all of the
fresh concrete properties were established as sufficient, the culvert was cast.
Once fresh concrete testing was complete, the ready-mix truck was able to back
up to the culvert. The author stood inside the formwork and held a section of 5/8 in.
(15.88 mm) plywood to guide the SCC into the culvert. This was done to prevent any
concrete from spilling over the edges of the culvert. The culvert was filled in one lift
from a single location. The SCC remained homogenous and stable and flowed around the
congested rebar and other obstructions with ease. However, when the concrete was at
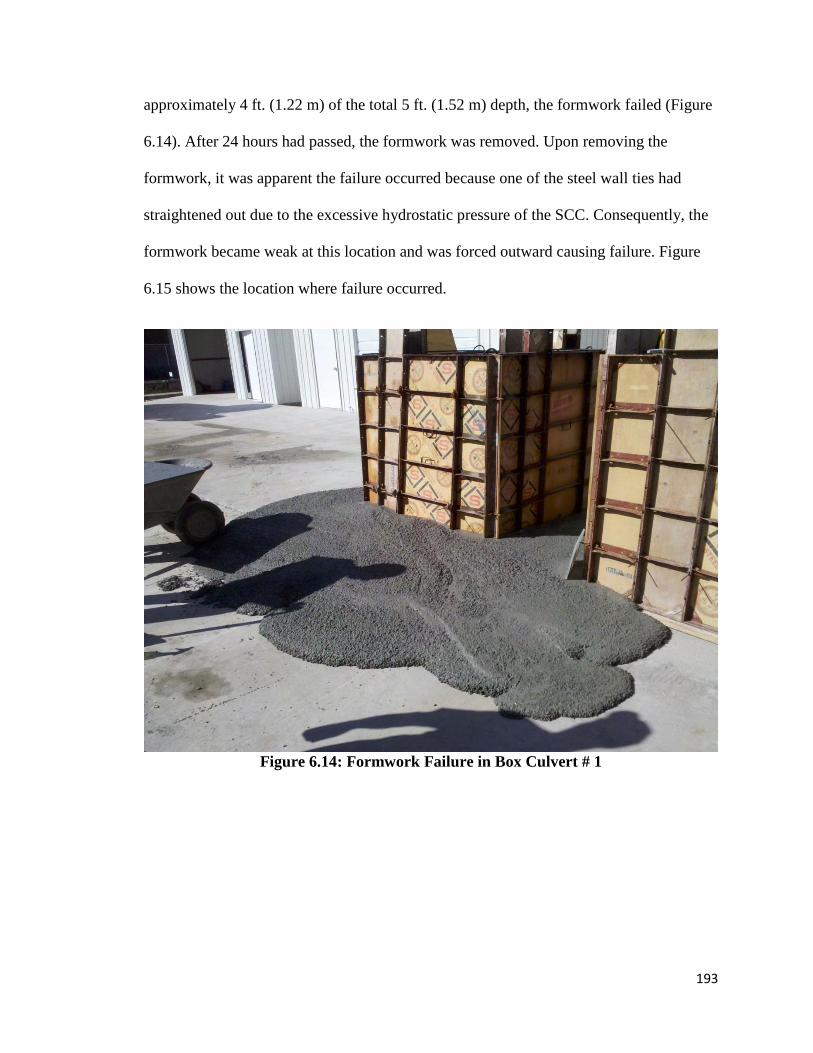
193
approximately 4 ft. (1.22 m) of the total 5 ft. (1.52 m) depth, the formwork failed (Figure
6.14). After 24 hours had passed, the formwork was removed. Upon removing the
formwork, it was apparent the failure occurred because one of the steel wall ties had
straightened out due to the excessive hydrostatic pressure of the SCC. Consequently, the
formwork became weak at this location and was forced outward causing failure. Figure
6.15 shows the location where failure occurred.
Figure 6.14: Formwork Failure in Box Culvert # 1

194
Figure 6.15: Critical Location Where Failure Occurred in Box Culvert # 1
Approximately one-third of the total quantity of SCC remained within the
formwork. There was no evidence of segregation as aggregates were seen at the top of
what was left of the culvert. Also, the culvert had a smooth finish (Figure 6.16). The
interior and exterior corners finished smoothly as well (Figure 6.17). In fact, the only
visible defect was some localized surface blemishes that had occurred due to the
entrapment of air voids (Figure 6.18).

195
Figure 6.16: Smooth Finish of Box Culvert # 1
Figure 6.17: Smooth Finish of Interior and Exterior Corners of Box Culvert # 1
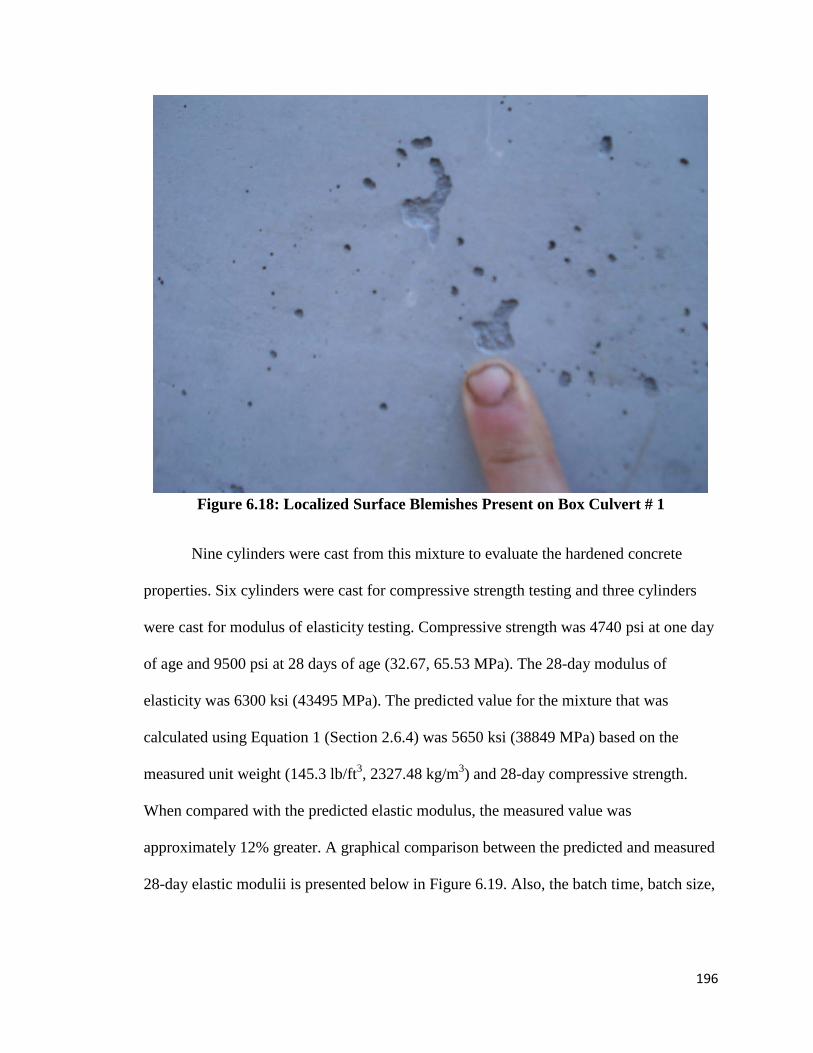
196
Figure 6.18: Localized Surface Blemishes Present on Box Culvert # 1
Nine cylinders were cast from this mixture to evaluate the hardened concrete
properties. Six cylinders were cast for compressive strength testing and three cylinders
were cast for modulus of elasticity testing. Compressive strength was 4740 psi at one day
of age and 9500 psi at 28 days of age (32.67, 65.53 MPa). The 28-day modulus of
elasticity was 6300 ksi (43495 MPa). The predicted value for the mixture that was
calculated using Equation 1 (Section 2.6.4) was 5650 ksi (38849 MPa) based on the
measured unit weight (145.3 lb/ft3, 2327.48 kg/m3) and 28-day compressive strength.
When compared with the predicted elastic modulus, the measured value was
approximately 12% greater. A graphical comparison between the predicted and measured
28-day elastic modulii is presented below in Figure 6.19. Also, the batch time, batch size,
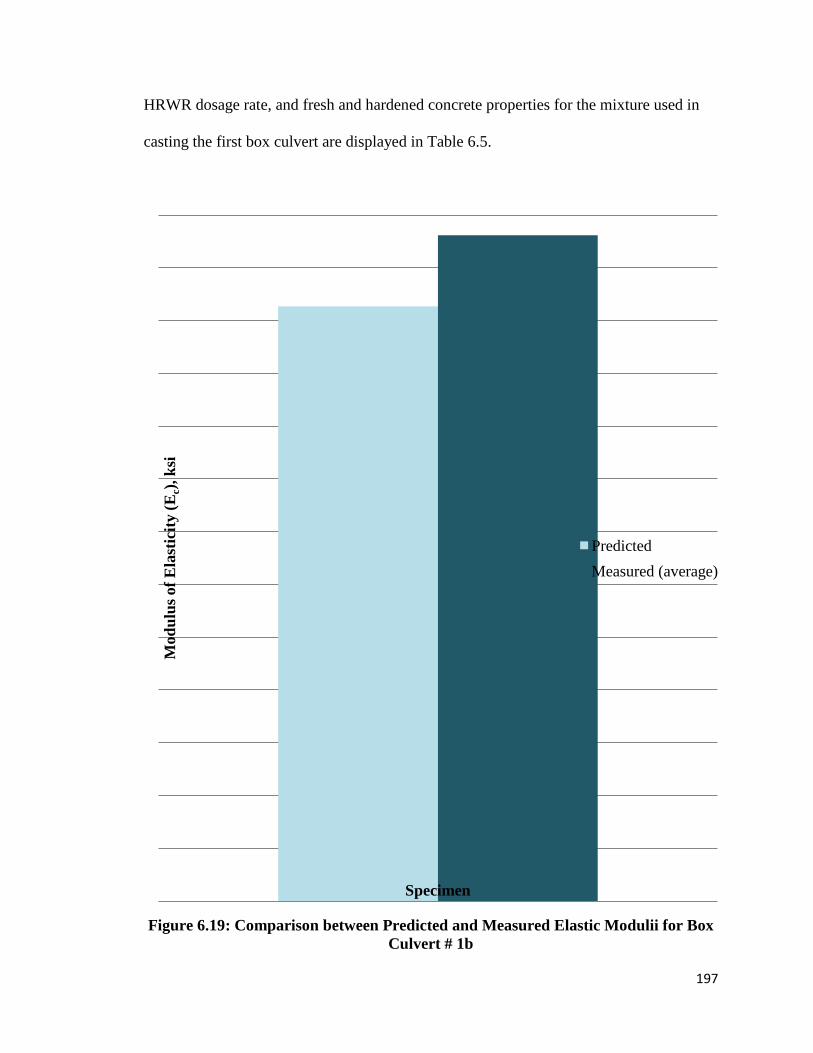
197
HRWR dosage rate, and fresh and hardened concrete properties for the mixture used in
casting the first box culvert are displayed in Table 6.5.
Figure 6.19: Comparison between Predicted and Measured Elastic Modulii for Box Culvert # 1b
Mod
ulus
of E
last
icity
(Ec),
ksi
Specimen
PredictedMeasured (average)

198
Table 6.5: Box Culvert # 1b Details
Culvert SCC Mixture # 1 Box Culvert # 1b
Batch Time 9:58 A.M.
Batch Size (yd3) 3.0
Initial Slump (in.) 1.5
ADVA CAST 575 (fl oz./cwt) 7 Slump Flow (in.) 25.5
Segregation Observed no VSI 0.5
Bleed Water yes
T-20 (sec) 2.25
Δh* (in.) 0.25 Slump Flow Spread - J-Ring Spread (in.) 1.75
Unit Weight (lb/ft3) 145.3 1-day Compressive Strength (psi) 4740 7-day Compressive Strength (psi) ---
28-day Compressive Strength (psi) 9500
28-day Modulus of Elasticity (ksi) 6300 Δh*: height difference between concrete inside and outside the J-Ring
6.5.3 Box Culvert # 2
Since the SCC exerted substantial hydrostatic pressure on the first box culvert
(ultimately causing failure), additional lateral reinforcement was provided for the second
box culvert. The formwork was braced with 2 in. (50.8 mm) by 8 in. (203.2 mm) lumber
along its base. Figure 6.20 shows the external lateral reinforcement that was furnished.

199
Figure 6.20: External Lateral Reinforcement that was provided for Box Culvert # 2
The second box culvert was cast with mixture # 52 which included a FA content
of 25%. On the day of casting, the ready-mix truck arrived at the ERC at 1:35 P.M with 3
yd3 (2.29 m3) of concrete. The initial slump was 2.5 in. (63.5 mm) at 1:43 P.M. At 1:44
P.M., 5 fl. oz. /cwt (326 mL/100 kg) of HRWR was added to the mixture to increase
flowability. The concrete was mixed for 5 minutes before testing. When the concrete was
poured into the wheel barrow at 1:49 P.M., it was evident that the mixture was not
homogeneous; the concrete was too wet and too dry in sections. So the concrete was
allowed to mix for 12 more minutes. At 2:01 P.M., the T-20 (T-50) was 2.1 seconds, and
the slump flow was 30 in. (762 mm). Upon viewing the spread it was apparent that

200
segregation had occurred (VSI = 2). The concrete was mixed for another 8 minutes in an
attempt for the excess bleed water to be absorbed. Following this mixing sequence, a
second slump flow test was conducted at 2:09 P.M. The T-20 (T-50) was 1.41 seconds,
and the slump flow was 27 in. (685.8 mm). When the concrete was evaluated for
stability, moderate bleed water was present but the sample showed no evidence of
segregation (VSI = 1). As a result, the mixture was deemed acceptable. The SCC was
placed inside the culvert at 2:10 P.M by implementing the same procedure that was
utilized in casting the first box culvert (Section 5.5.2) (Figure 5.21). Two minutes later,
the culvert had been filled to the full depth of 5 ft. (1.52 m) and the top surface was
finished (Figure 5.22). At 2:12 P.M., the J-Ring test was performed. There was not a
measurable height difference between concrete inside and outside the J-Ring.
Additionally, the J-Ring flow spread of 30.25 in. (768.35 mm) was larger in diameter
when compared with the slump flow spread. One final slump flow test was performed at
2:15 P.M. The ensuing T-20 (T-50) measurement was 1.78 seconds, and the slump flow
spread had an average diameter of 29 in. (736.6 mm). A VSI designation of 1 was issued
because a slight mortar halo was present around the perimeter of the spread (Figure 6.23).

201
Figure 6.21: Ready-Mix Truck Casting Box Culvert # 2
Figure 6.22: Top Surface of Box Culvert # 2 after Finishing

202
Figure 6.23: Bleed Water Observed in Mixture Used for Casting Box Culvert # 2
Twenty-four hours after casting, the formwork was removed. Upon viewing the
box culvert, it was apparent that the mixture had performed well. Segregation had not
occurred because aggregates were visible at the top surface of the culvert. Also, the
culvert had a smooth finish along each wall and at each interior and exterior corner.
Furthermore, the author only observed a few surface defects that were caused by air
voids. Figure 6.24 displays the second box culvert after the formwork had been removed.

203
Figure 6.24: Completed Box Culvert # 2 after Removal of Formwork
Twelve cylinders were cast from this mixture to assess the hardened concrete
properties. Nine cylinders were cast for compressive strength testing at 1, 7, and 28 days
and three cylinders were cast for modulus of elasticity testing at 28 days. Compressive
strength and modulus of elasticity values are shown in Table 5.6. When compared to the
predicted value, the measured elastic modulus was approximately 12 % greater in
magnitude than the predicted elastic modulus. Figure 6.25 exhibits a comparison between
the predicted and measured 28-day elastic modulii. Furthermore, the batch time, batch
size, HRWR dosage rate, and fresh and hardened concrete properties for the mixture
utilized in casting the second box culvert are shown in Table 6.6.

204
Figure 6.25: Comparison between Predicted and Measured Elastic Modulii for Box
Culvert # 2
Table 6.6: Box Culvert # 2 Details
Culvert SCC Mixture # 2 Box Culvert # 2
Batch Time 1:35 P.M. Batch Size (yd3) 3.0
Initial Slump (in.) 2.5 ADVA CAST 575 (fl oz./cwt) 5
Slump Flow (in.) 29 Segregation Observed no
VSI 1 Bleed Water yes T-20 (sec) 1.78 Δh* (in.) 0
Slump Flow Spread - J-Ring Spread (in.) 1.25 Unit Weight (lb/ft3) 148.24
1-day Compressive Strength (psi) 3280 7-day Compressive Strength (psi) 7670 28-day Compressive Strength (psi) 9780 28-day Modulus of Elasticity (ksi) 6600
Δh*: height difference between concrete inside and outside the J-Ring
Mod
ulus
of E
last
icity
(Ec),
ksi
Specimen
PredictedMeasured (average)

205
6.6 CONCLUSIONS
After the trial batching and casting of the two aforementioned reinforced box
culverts, several conclusions can be made and are listed below.
• SCC can be successfully batched with a ready-mix truck.
• Trial batching is essential to ensure that SCC mixtures will perform as expected
once applied.
• The original HRWR dosage rate should be based upon the initial slump of the
concrete.
• The moisture contents of the aggregates can significantly influence the flowability
of SCC. If aggregate moisture is not accurately accounted for, excess mixing
water can be incorporated during mixing; this can lead to segregation.
• The author recommends that the total mixing time should not exceed 30 minutes.
With extended mixing times, the HRWR can lose its desired effectiveness. An
indicator of this effect can be observed whenever an SCC mixture exhibits a
decrease in flowability after additional HRWR has been added. If this occurs, then
the mixture should be discarded.
• The formwork associated with any SCC application must provide sufficient
reinforcement to withstand the additional lateral hydrostatic forces that the
concrete exerts.
• SCC does not require any internal or external vibration and less time is needed to
finish the concrete. For these reasons, construction times can be reduced
whenever SCC is implemented. In this research program, the second box culvert
was cast and finished in two minutes.

206
CHAPTER 7
CONCLUSIONS AND RECOMMENDATIONS
7.1 CONCLUSIONS
When compared with conventional-slump concrete, SCC can be a beneficial
alternative because of its enhanced rheological properties. However, developing SCC can
be a complex and lengthy process due to the sensitivity of these properties to changes
with the mix design. In this research program, 52 trial mixtures were batched. After
conducting an array of fresh and hardened concrete tests, performing trial batching inside
of a ready-mix truck, and casting two full-size reinforced box culverts the following
conclusions were made.
• The w/b is the most significant parameter that affects the flowability of SCC.
Therefore, it should be the first factor that is selected when developing SCC.
• In this study, SCC was unable to be batched at the minimum binder content of 6.5
bags per cubic yard (611 lb/yd3, 362.49 kg/m3) that was stated in Table 802-1 of
the Standard Specifications5. The lowest binder content at which SCC was
consistently batched was 775 lb/yd3 (459.79 kg/m3).
• Trial mixtures that were batched with S/Agg values of 0.48, 0.50, or 0.52
frequently acquired desirable fresh concrete properties.
• An adequate HRWR dosage rate was established through trial batching. If the
HRWR dosage rate exceeds the maximum value listed by the manufacturer and

207
the mixture still does not acquire sufficient flowability, the binder (water) content
must be increased.
• The S/Agg value can be incrementally increased to improve flowability (if
necessary).
• Slump flow spreads that range from 24 to 30.0 in. (596.9 – 762 mm) indicate that
an SCC mixture has adequate flowability. Slump flows that are less than 24 in.
(610 mm) in diameter are prone to experience blockage problems, and slump
flows that surpass 30.0 in. (762 mm) are at a high risk for segregation.
• The T-20 (T-50) test was important in evaluating the blockage and segregation
potential of all the trial mixtures. In this study, mixtures that had T-20 (T-50)
times varying from 2 to 6 seconds performed well. Many of the mixtures that had
T-20 (T-50) times that surpassed 6 seconds were viscous and experienced
blockage. Conversely, the mixtures with T-20 (T-50) times of less than 2 seconds
were extremely flowable and experienced segregation.
• Reducing the size of coarse aggregate (NMSA ≤ 3/8 in., 9.53 mm) can improve
T-20 (T-50) times and decrease blockage potential. Additionally, a smaller coarse
aggregate can decrease the segregation potential because the sedimentation rate of
coarse aggregate particles will be reduced.
• Increasing the S/Agg can improve T-20 (T-50) times and decrease blockage
potential.
• In this study, mixtures that had a height difference between SCC inside and
outside the J-Ring that was less than or equal to 0.5 in. (12.7 mm) and a
difference between the slump flow spread and the J-Ring spread that was less than

208
4.0 in. (101.6 mm) performed well. In certain mixtures where these conditions
were not met, oftentimes blockage occurred.
• If at all possible, do not exceed the manufacturer’s maximum recommended
dosage rate of HRWR. This can lead to segregation because the HRWR may
exceed its saturation point. Additionally, an overdose of HRWR can increase the
setting time.
• Trial mixtures that had VSI designations that were less than or equal to 1.5 had
sufficient stability. Any mixture that had a VSI which surpassed this limitation
was either too viscous or was unstable due to excessive bleed water or
segregation.
• Decreasing binder (water) content can improve concrete stability by increasing
the density.
• In this study, SCC was developed with FA replacement rates that varied from 5 to
25%.
• If FA is included as a percentage replacement of cement and the mixture
experiences segregation, the FA replacement rate can be reduced. This will
improve concrete stability by increasing the density.
• Additional trial mixtures should be batched to ensure consistent results.
• SCC can be successfully batched inside a ready-mix truck. If this method of
mixing is selected then driving time must be accounted for during trial batching.
Also, since the concrete cannot be seen while it is mixing, the preliminary HRWR
dosage rate must be based upon the initial slump of the concrete.

209
• The moisture contents of the aggregates can significantly influence the flowability
of SCC. If aggregate moisture is not accurately accounted for, excess mixing
water can be incorporated during mixing; this can lead to segregation.
• With extended batching times, the HRWR can lose its desired effectiveness. An
indicator of this effect can be observed whenever an SCC mixture exhibits a
decrease in flowability after additional HRWR has been added. If this occurs, then
the mixture should be discarded.
• The formwork associated with SCC applications must provide adequate
reinforcement to resist the additional lateral hydrostatic pressure that the concrete
exerts.
• SCC does not require any internal or external vibration and less time is needed to
finish the concrete. For these reasons, construction times can be reduced
whenever SCC is implemented. In this study, the second box culvert was cast and
completely finished in two minutes.
7.2 RECOMMENDATIONS
The results of this research program confirm that AHTD would benefit from an
amendment to the Standard Specifications5. Since the fresh concrete properties and tests
associated with SCC are different than those related to conventional-slump concrete, the
author proposes that the following table (Table 7.1) should be included as an addition to
Table 802-1. The criteria and fresh concrete specifications that were developed in this
study are highlighted in yellow.

210
Table 7.1: Proposed Addition to Table 802-1 of the Standard Specifications5
Table 802-1a Class of Concrete
Characteristic S(SCC)
Minimum Compressive Strength (psi [Mpa] at 28 days) 3500 [24.0]*
Minimum Cement Factor (bags per cubic yard) [kg/cu m] 8.25 [460] Maximum Water/Cement Ratio (gal. per bag) [kg/kg] 5.0 [0.44]
Sand/Total Aggregate Ratio (lb/lb) [kg/kg] 0.48 - 0.52 T-20 [T-50] (seconds) 2 - 6
Slump Flow Range (inches) [mm] 24" - 30.0" [597 - 762]
Visual Stability Index ≤ 1.5
Δh (inches) [mm] ≤ 0.5" [13]** Slump Flow Spread - J-Ring Spread (inches) [mm] < 4.0" [100]
Range of Cement Replacement by Fly Ash (%) 5 - 25 High Range Water-Reducer Dosage Rate (fl oz./cwt) ***
Air Content Range (%) --
* Class S(SCC) for use in prestressed concrete members shall have a minimum compressive strength of 5000 psi (35.0 Mpa) at 28 days unless otherwise shown on the plans. The maximum size of coarse aggregate shall be 1" (25 mm).
** Δh: height difference between concrete inside and outside the J-Ring
*** As determined by trial batch. High Range Water-Reducer dosage rates should not exceed those specified by the manufacturer.
The primary focus of this research program was to develop fresh concrete
specifications for SCC. However, the author proposes that additional research should be
conducted to evaluate the fresh and hardened concrete properties of SCC and also to
assess how SCC performs in various applications. These recommendations include, but
are not limited to, the following:

211
• Evaluating the fresh and hardened concrete properties of SCC whenever entrained
air is added at different percentages.
• Evaluating the fresh and hardened concrete properties of SCC whenever different
types of cement are used.
• Evaluating the fresh and hardened concrete properties of SCC whenever different
types and sizes of aggregates are used.
• Evaluating the fresh and hardened concrete properties of SCC whenever different
types and quantities of chemical and mineral admixtures are used.
• Assessing the hardened concrete creep, durability, freeze – thaw resistance, rapid
chloride permeability, and shrinkage of SCC mixtures.
• Predicting the modulus of elasticity of SCC mixtures.
• Casting SCC in vertical PVC pipes and measuring the variations of strength and
modulus of elasticity with depth.
• Casting a full-scale SCC bridge girder.
• Field casting a reinforced SCC culvert.
• Assessing the flowability, blockage potential, and segregation resistance of SCC
mixtures cast at different temperatures and with varying aggregate moisture
contents.

212
REFERENCES
1. Bonen, D.; Shah, S., “Fresh and hardened properties of self-consolidating concrete,” Progress in Structural Engineering Materials Journal, V. 7, No. 1, 2005, pp. 14-26.
2. Do, Nam Hoang, “Developing High-Strength Self-Consolidating Concrete Mixtures For Use In Bridge Girders,” Thesis submitted to the University of Arkansas, U.S.A., for Master’s, University of Arkansas, 2007.
3. Shi, Caijun; Wu, Yanzhong, “Mixture Proportioning and Properties of Self-Consolidating Lightweight Concrete Containing Glass Powder,” ACI Materials Journal, V. 102, No. 5, September-October 2005, pp. 355-363.
4. Okamura, H., “Self-Compacting High Performance Concrete,” Concrete International, V. 9, No. 7, 1997, pp. 50-54.
5. Arkansas State Highway and Transportation Department. Standard Specifications for Highway Construction. Little Rock: Arkansas State Highway and Transportation Department, 2003.
6. Khayat, Kamal H.; Paultre, Patrick; Tremblay, Stephan, “Structural Performance and In-Place Properties of Self-Consolidating Concrete Used for Casting Highly Reinforced Columns,” ACI Materials Journal, V. 98, No. 5, September-October 2001, pp. 371-378.
7. Paultre, Patrick; Khayat, Kamal H.; Cusson, Daniel; Tremblay, Stephan, “Structural Performance of Self-Consolidating Concrete Used in Confined Concrete Columns,” ACI Materials Journal, V. 102, No. 4, July-August 2005, pp. 560-568.
8. ACI Committee 237, “Self-Consolidating Concrete (ACI 237R-04),” American Concrete Institute, Farmington Hills, Mich., 2007.
9. Khayat, K. H.; Ghezal, A.; Hadriche, M. S., “Utility of statistical models in proportioning self-consolidating concrete,” Materials and Structures, V. 33, June 2000, pp.338-344.
10. Bonen, D.; Shah, S., “The Effects of Formulation on the Properties of Self-Consolidating Concrete,” Concrete Science and Engineering: A Tribute to Arnon Bentur, Proceedings of the International RILEM Symposium, K. Kovler, J. Marchand, S. Mindess, and J. Weiss, eds., RILEM Publications, France, 2004, pp. 43-56.
11. Cannon, Robert W., “Proportioning Workable Concrete Mixtures with Specific Gravity of Cement-Water Paste,” ACI Materials Journal, V. 102, No. 5, September-October 2005, pp. 338-346.

213
12. Vengala, Jagadish; Ranganath, R.V., “Mixture proportioning procedures for self-compacting concrete,” The Indian Concrete Journal, V. 78, No. 8, August 2004, pp. 13-21.
13. Hossain, K. M. A; Lachemi, M., “Bond Behavior of Self-Consolidating Concrete with Mineral and Chemical Admixtures,” Journal of Materials in Civil Engineering, V. 20, No. 9, September 2008, pp. 608-616.
14. Schindler, Anton K.; Barnes, Robert W.; Roberts, James B.; Rodriguez, Sergio, “Properties of Self-Consolidating Concrete for Prestressed Members,” ACI Materials Journal, V. 104, No. 1, January-February 2007, pp. 53-61.
15. Lachemi, M.; Hossain, K. M. A.; Patel, R.; Shehata, M.; Bouzoubaậ, N., “Influence of paste/mortar rheology on the flow characteristics of high-volume fly ash self-consolidating concrete,” Magazine of Concrete Research, V. 59, No. 7, September 2007, pp. 517-528.
16. Okamura, H.; Ozawa, K.; Ouchi, M., “Self-compacting concrete,” Structural Concrete, March 2001, No. 1, pp. 5-17.
17. Okamura, H.; Ozawa, K., “Mix design for self-compacting concrete,” Concrete Library of JSCE, June 1995, No. 25, pp. 107-120.
18. European Federation of National Trade Associations (EFNARC), “Specification and Guidelines for Self-Compacting Concrete,” November 2001, 32 pp., http://www.efnarc.org.
19. Walraven, Joost, “Self compacting concrete: Development and applications,” Proceedings of Fib (CEB-FIP) work shops, November 2003, Chennai.
20. ACI 211.1-91, “Standard Practice for Selecting Proportions for Normal, Heavyweight, and Mass Concrete,” ACI Committee 211, American Concrete Institute, Farmington Hills, Mich., 1991.
21. Sedran, T.; De Larrard, F.; Hourst, F.; Contamines, C., “Mix design of self-compacting concrete,” Proceedings of a conference on Production Methods and Workability of Concrete, P.J.M. Bartos, D.L. Marrs and D.J. Cleand (editors), E & FN Spon, 1996, London, pp. 439-450.
22. Sedran, T.; De Larrard, F., “A software to optimize the mix design of high performance concrete, BHP 96, RENE-LCPC,” Fourth International Symposium on the utilization of high strength / high performance concrete, Paris, 29-31 May 1996.
23. Gomes, Paulo C. C.; Gettu, Ravindra; Agullo, Luis; Bernad, Camilo, “Experimental optimization of high-strength self-compacting concrete,” Proceedings of the second international symposium on self-compacting concrete, Eds K. Ozawa and M. Onchi, COMS Engineering Corp, Kochi, Japan, pp. 337-386.

214
24. ASTM Standard C 29/C 29M, 2009, "Standard Test Method for Bulk Density (“Unit Weight”) and Voids in Aggregate," ASTM International, West Conshohocken, PA, 2009, DOI: 10.1520/C0029_C0029M-09, http://www.astm.org.
25. Vengala, Jagadish; Sudarshan, M.S.; Ranganath, R.V., “Experimental study for obtaining self-compacting concrete,” The Indian Concrete Journal, August 2003, V. 77, No. 8, pp. 1261-1266.
26. ACI 318-08, Building Code Requirements for Structural Concrete and Commentary, American Concrete Institute, Farmington Hills, Mich., 2008.
27. Skarendahl, A.; Petersson, Ö., “State-of-the-Art Report of RILEM Technical Committee 174-SCC, Self-Compacting Concrete,” Report No. 23, 2001, 141 pp.
28. Khayat, K. H., “Workability, Testing, and Performance of Self-Consolidating Concrete,” ACI Materials Journal, V. 96, No. 3, May-June 1999, pp. 346-353.
29. ASTM Standard C 1611/C 1611M, 2009, "Standard Test Method for Slump Flow of Self-Consolidating Concrete," ASTM International, West Conshohocken, PA, 2009, DOI: 10.1520/C1611_C1611M-09BE01, http://www.astm.org.
30. ASTM Standard C 1621/C 1621M, 2009, "Standard Test Method for Passing Ability of Self-Consolidating Concrete by J-Ring," ASTM International, West Conshohocken, PA, 2009, DOI: 10.1520/C1621_C1621M-09B, http://www.astm.org.
31. Khayat, Kamal H.; Assaad, Joseph; Daczko, Joseph, “Comparison of Field-Oriented Test Methods to Assess Dynamic Stability of Self-Consolidating Concrete,” ACI Materials Journal, V. 101, No. 2, March-April 2004.
32. Nehdi, Moncef; El-Chabib, Hassan; El Naggar, Hesham, “Cost-Effective SCC for Deep Foundations,” Concrete International, March 2003, pp. 95-103.
33. Khayat, Kamal Henri; Mitchell, Denis, “Self-Consolidating Concrete for Precast, Prestressed Concrete Bridge Elements,” National Cooperative Highway Research Program, (NCHRP) Report 628, Transportation Research Board, Washington, D. C., 2009, http://www.TRB.org.
34. Japan Society of Civil Engineers, “Recommendations for Self-Compacting Concrete,” JSCE Concrete Engineering Series 31, T. Omoto and K. Ozawa, eds., 1999, 77 pp.
35. PCI Interim SCC Guidelines TR-6-03, “Interim Guidelines for the Use of Self-Consolidating Concrete in Precast/Prestressed Concrete Institute Member Plants,” April 2003, 148 pp.
36. Sonebi, Mohammed, “Applications of Statistical Models in Proportioning Medium-Strength Self-Consolidating Concrete,” ACI Materials Journal, V. 101, No. 5, September-October 2004, pp. 339-346.

215
37. Bartos, P. J. M., “An Appraisal of the Orimet Test as a Method for On-site Assessment of Fresh SCC Concrete,” International Workshop on Self-Compacting Concrete, Japan, 1998, pp. 121-135.
38. Brameshuber, W.; Uebachs, S., “Practical Experience with the Application of Self-Compacting Concrete in Germany,” Proceedings of the Second International Symposium on Self-Compacting Concrete, Tokyo, Japan, 2001, pp. 687-696.
39. Petersson, Ö.; Billberg, P.;Van, B.K., “A Model for Self-Compacting Concrete,” Proceedings of the International RILEM Conference on Production Methods and Workability of Concrete, P. J. M. Bartos et al., eds., Chapman and Hall, Paisley, 1996, pp.483-490.
40. Khayat, Kamal H.; Assaad, Joseph J., “Effect of w/cm and High-Range Water-Reducing Admixture on Formwork Pressure and Thixotropy of Self-Consolidating Concrete,” ACI Materials Journal, V. 103, No. 3, May-June 2006, pp.186-193.
41. Swedish Concrete Association, “Self-Compacting Concrete, Recommendations for Use,” Concrete Report No. 10(E), 2002, 84 pp.
42. Hwang, Soo-Duck; Khayat, Kamal H.; Bonneau, Olivier, “Performance-Based Specifications of Self-Consolidating Concrete Used in Structural Applications,” ACI Materials Journal, V. 103, No. 2, March-April 2006, pp. 121 -129.
43. Japan Society of Civil Engineers, “Recommendation for Construction of Self-Compacting Concrete,” Technical Session: Recommendations and Materials, pp. 417-437.
44. ASTM Standard C 39/C 39M, 2009, "Standard Test Method for Compressive Strength of Cylindrical Concrete Specimens," ASTM International, West Conshohocken, PA, 2009, DOI: 10.1520/C0039_C0039M-09A, http://www.astm.org.
45. Klug, Y.; Holschemacher, K., “Comparison of the Hardened Properties of Self-Compacting and Normal Vibrated Concrete,” Third International Symposium on Self-Compacting Concrete: Reykjavik, Iceland, 17-20 August 2003, 2003, pp. 596-605.
46. Chan, Y.; Chen, Y.; Liu, Y., “Development of Bond Strength of Reinforcement Steel in Self-Consolidating Concrete, ACI Structural Journal, V. 100, No. 4, July-August 2003, pp. 490-498.
47. Attiogbe, E. K.; See, H. T.; Daczko, J. A., “Engineering Properties of Self-Consolidating Concrete,” Conference Proceedings: First North American Conference on the Design and Use of Self-Consolidating Concrete, November 12-13, 2002.
48. Turcry, P.; Loukili, A.; Haidar, K.; Ajaudier-Cabot, “Cracking Tendency of Self-Compacting Concrete Subjected to Restrained Shrinkage: Experimental Study and Modeling,” Journal of Materials in Civil Engineering, January-February 2006, pp. 46-54.

216
49. Kim, Y.H., “Characterization of Self-Consolidating Concrete for the Design of Precast, Pretensioned Bridge Superstructure Elements,” Dissertation submitted to Texas A&M University, U.S.A., for PhD, Texas A&M University, 2005.
50. Cattaneo, S.; Rosati, G., “Bond between Steel and Self-Consolidating Concrete: Experiments and Modeling, ACI Structural Journal, July 1, 2009, V. 106, No. 4, pp. 540-550.
51. Khayat, K. H.; Manai, K.; Trudel, A., “In-Situ Mechanical Properties of Wall Elements Cast Using Self-Consolidating Concrete,” ACI Materials Journal, V. 94, No. 6, November-December 1997, pp. 491-500.
52. Sonebi, M.; Bartos, P. J. M.; Zhu, W.; Gibbs, J.; Tamimi, A., “Final Report Task 4 on the SCC Project; Project No. BE 96-3801; Self-Compacting Concrete: Properties of Hardened Concrete,” Advanced Concrete Masonry Center, University of Paisley, Scotland, UK, May 2000.
53. Peterman, Robert J., “The Effect of As-Cast Depth and Concrete Fluidity on Strand Bond,” PCI Journal, V. 52, No. 3, May-June 2007, pp. 72-101.
54. Wan, B.; Petrou, M. F.; Harries, K. A.; Hussein, A. A., “Top Bar Effects in Prestressed Concrete Piles,” ACI Structural Journal, V. 99, No. 2, March-April 2002, pp. 208-214.
55. ACI 408, “Bond and Development of Straight Reinforcing Bars in Tension (ACI 408R-03),” American Concrete Institute, Farmington Hills, Mich., 2003.
56. Lin, C.; Hwang, C.; Lin, S.; Liu, C., “Self-Consolidating Concrete Columns Under Concentric Compression,” ACI Structural Journal, V. 105, No. 4, July-August 2008, pp. 425-432.
57. Neville, A. M., Properties of Concrete, 4th Edition, John Wiley and Sons, Inc., New York, 1996, 844 pp.
58. ACI Committee 318, “Building Code Requirements for Structural Concrete (ACI 318-08),” American Concrete Institute, Farmington Hills, Mich., 2008, 430 pp.
59. AASHTO, AASHTO LRFD Bridge Design Specification, 3rd Edition, American Association of State Highway and Transportation Officials, Washington, D.C., 2004, 360 pp.
60. Su, J. K.; Cho, S. W.; Yang, C. C.; Huang, R., “Effect of Sand Ratio on the Elastic Modulus of Self-Compacting Concrete,” Journal of Marine Science and Technology, V. 10, No. 1, 2002, pp. 8-13.
61. Huo, X. S.; Al-Omaishi, N.; Tadros, M. K., “Creep, Shrinkage, and Modulus of Elasticity of High-Performance Concrete,” ACI Materials Journal, V. 98, No. 6, 2001, pp. 440-449.

217
62. Mindess, S.; Young, J. F., Darwin, D., Concrete, 2nd Edition, Prentice Hall, Upper Saddle River, New Jersey, 2003, 644 pp.
63. Mehta, P. K.; Monteiro, P. J. M., Concrete: Microstructure, Properties, and Materials, 3rd Edition, McGraw-Hill, New York, 2006, 659 pp.
64. Kovler, K.; Jensen, O. M., “Novel Techniques for Concrete Curing: New methods for low w/cm mixtures,” Concrete International, September 1, 2005, V. 27, No. 9, pp. 39-42.
65. Kovler, K.; Bentur, A.; Lange, D. A.; Bentz, D.; Van Breugel, K.; Lura, P.; Zhutovsky, S.; Souslikov, A., “Autogenous Curing of High-Strength Cementitious Materials by Fine Uniformly Distributed Lightweight Aggregate Water Reservoirs,” Research Report to U.S.-Israel Binational Science Foundation, Technion, Haifa, Israel, 2004, 78 pp.
66. De Jesus Cano Barrita, F.; Bremner, T. W.; Balcom, B. J., “Use of Magnetic Resonance Imaging to Study Internal Moist Curing in Concrete Containing Saturated Lightweight Aggregate,” ACI SP218-10, 2004, pp. 155-176.
67. Naik, Tarun R.; Canpolat, Fethullah, “Self-Curing Concrete,” Report No. CBU-2006-11, REP-610, April 2006.
68. Mazzotti, C.; Savoia, M.; Ceccoli, C., “A Comparison between Long-Term Properties of Self-Compacting Concretes and Normal Vibrated Concretes with Same Strength,” Creep, Shrinkage and Durability of Concrete and Concrete Structures; CONCREEP 7, September 2005, pp. 523-528.
69. Ozyildirim, C.; Lane, D. S., “Evaluation of Self-Consolidating Concrete,” Final Report, Virginia Transportation Research Council, Charlottesville, Virginia, June 2003, 15 pp.
70. ACI Committee 209, “Prediction of Creep, Shrinkage, and Temperature Effects in Concrete Structures (ACI 209R-92),” American Concrete Institute, Farmington Hills, Mich., 1992, 47 pp.
71. Turcry, P.; Loukili, A., “Evaluation of Plastic Shrinkage Cracking of Self-Consolidating Concrete,” ACI Materials Journal, V. 103, No. 4, July-August 2006, pp. 272-279.
72. El-Chabib, H.; Nehdi, M., “Effect of Mixture Design Parameters on Segregation of Self-Consolidating Concrete,” ACI Materials Journal, V. 103, No. 5, September-October 2006, pp. 374-383.
73. Zia, P.; Nunez, R. A.; Mata, L. A.; Dwairi, H. M., "Implementation of Self-Consolidating Concrete for Prestressed Concrete Girders," Proceedings of 7th International Symposium on Utilization of High-Strength/ High Performance Concrete,

218
June 20-24, Washington, D. C., SP 228, Volume I, American Concrete Institute, Farmington Hills, Mich., 2005, pp. 297-315.
74. Khayat, K.; Bickley, J.; Lessard, M., “Performance of Self-Consolidating Concrete for Casting Basement and Foundation Walls,” ACI Materials Journal, V. 97, No. 3, May-June 2000, pp. 374-380.
75. Building Materials and Specialty Construction Products by Grace Construction Products. Website. October 1, 2010. <http://www.na.graceconstruction.com/>.
76. Chopin, D.; de Larrard, F.; Cazacliu, B., “Why do HPC and SCC require a longer mixing time?,” Cement and Concrete Research, V. 34, No. 12, 2004, pp. 2237-2243.
77. Do, N.; Staton, B.; Hale, W., “Developing High Strength SCC Mixtures,” PCI/NABC Conference, Fall 2006.
78. Arkansas State Highway Commission. Details of Standard Barrel Sections for Reinforced Concrete Box Culverts. Standard Drawing No. R-100X-0. May 1, 2010.
79. Arkansas State Highway Commission. Reinforced Concrete Box Culvert Details. Standard Drawing RCB-1. May 1, 2010.

219
APPENDIX A
MIXTURE DESIGN ANALYSIS FOR MIXTURE # 1
Step 1: Binder Content = 611 lb/yd3
Specific Gravity Binder = 3.15
Step 2: Volume Binder = (Binder Content)/(Specific Gravity Binder x 62.4 lb/ft3)
Volume Binder = (611 lb)/(3.15 x 62.4 lb/ft3) = 3.108 ft3
Step 3: w/b = 0.41
Step 4: Water Content = (w/b) x (Binder Content) = (0.41) x (611 lb/yd3)
= 250.51 lb/yd3
Specific Gravity Water = 1.00
Step 5: Volume Water = (Water Content)/(Specific Gravity Water x 62.4 lb/ft3)
Volume Water = (250.51 lb)/(1.00 x 62.4 lb/ft3) = 4.015 ft3
Step 6: Air = 2%
Step 7: Volume Air = (% Air) x (27 ft3) = (0.02) x (27 ft3) = 0.54 ft3
Step 8: Volume Total Aggregate = (27 ft3) - (Volume Binder) – (Volume Water) –
(Volume Air)

220
Volume Total Aggregate = (27 ft3) - (3.108 ft3) – (4.015 ft3) – (0.54 ft3)
= 19.337 ft3
Step 9: S/Agg = 0.52
Step 10: Volume Fine Aggregate = (S/Agg) x (Volume Total Aggregate)
Volume Fine Aggregate = (0.52) x (19.337 ft3) = 10.055 ft3
Specific Gravity Fine Aggregate = 2.60
Step 11: Fine Aggregate Content = (Volume Fine Aggregate) x
(Specific Gravity Fine Aggregate) x (62.4 lb/ft3) = (10.055 ft3) x (2.60) x
(62.4 lb/ft3) = 1631 lb/yd3
Step 12: Volume Coarse Aggregate = (Volume Total Aggregate) – (Volume Fine Aggregate)
Volume Coarse Aggregate = (19.337 ft3) – (10.055 ft3) = 9.282 ft3
Specific Gravity Coarse Aggregate = 2.68
Step 13: Coarse Aggregate Content = (Volume Coarse Aggregate) x
(Specific Gravity Coarse Aggregate) x (62.4 lb/ft3) = (9.282 ft3) x (2.68) x
(62.4 lb/ft3) = 1550 lb/yd3

221
APPENDIX B
MIXTURE DESIGN ANALYSIS FOR MIXTURE # 41
Step 1: Binder Content = 775 lb/yd3
Step 2: % FA = 5%
Step 3: FA Content = (% FA) x (Binder Content) = (5%) x (775lb/yd3)
= 38.75 lb/yd3
Step 4: Cement Content = (Binder Content) – (FA Content) = 775lb/yd3 –
38.75 lb/yd3 = 736.25 lb/yd3
Specific Gravity FA = 2.20
Specific Gravity Cement = 3.15
Step 5: Volume FA = (FA Content)/(Specific Gravity FA x 62.4 lb/ft3)
Volume FA = (38.75 lb)/(2.20 x 62.4 lb/ft3) = 0.282 ft3
Step 6: Volume Cement = (Cement Content)/(Specific Gravity Cement x 62.4 lb/ft3)
Volume Cement = (736.25 lb)/(3.15 x 62.4 lb/ft3) = 3.746 ft3
Step 7: w/b = 0.44
Step 8: Water Content = (w/b) x (Binder Content) = (0.44) x (775 lb/yd3)

222
= 341 lb/yd3
Specific Gravity Water = 1.00
Step 9: Volume Water = (Water Content)/(Specific Gravity Water x 62.4 lb/ft3)
Volume Water = (341 lb)/(1.00 x 62.4 lb/ft3) = 5.465 ft3
Step 10: Air = 2%
Step 11: Volume Air = (% Air) x (27 ft3) = (0.02) x (27 ft3) = 0.54 ft3
Step 12: Volume Total Aggregate = (27 ft3) - (Volume FA) – (Volume Cement) –
(Volume Water) – (Volume Air)
Volume Total Aggregate = (27 ft3) – (0.282 ft3) - (3.746 ft3) – (5.465 ft3) –
(0.54 ft3) = 16.967 ft3
Step 13: S/Agg = 0.48
Step 14: Volume Fine Aggregate = (S/Agg) x (Volume Total Aggregate)
Volume Fine Aggregate = (0.48) x (16.967 ft3) = 8.144 ft3
Specific Gravity Fine Aggregate = 2.60
Step 15: Fine Aggregate Content = (Volume Fine Aggregate) x
(Specific Gravity Fine Aggregate) x (62.4 lb/ft3) = (8.144 ft3) x (2.60) x
(62.4 lb/ft3) = 1322 lb/yd3

223
Step 16: Volume Coarse Aggregate = (Volume Total Aggregate) – (Volume Fine Aggregate)
Volume Coarse Aggregate = (16.967 ft3) – (8.144 ft3) = 8.823 ft3
Specific Gravity Coarse Aggregate = 2.68
Step 17: Coarse Aggregate Content = (Volume Coarse Aggregate) x
(Specific Gravity Coarse Aggregate) x (62.4 lb/ft3) = (8.823 ft3) x (2.68) x
(62.4 lb/ft3) = 1475 lb/yd3