Embed Size (px)
Citation preview
DIAdemTM
Data AcquisitionGetting Started and User Manual
DIAdem: Data Acquisition
National Instruments Ireland Resources Limited
December 2005373078D-01

Support
Worldwide Technical Support and Product Information
ni.com
National Instruments Corporate Headquarters
11500 North Mopac Expressway Austin, Texas 78759-3504 USA Tel: 512 683 0100
Worldwide Offices
Australia 1800 300 800, Austria 43 0 662 45 79 90 0, Belgium 32 0 2 757 00 20, Brazil 55 11 3262 3599, Canada 800 433 3488, China 86 21 6555 7838, Czech Republic 420 224 235 774, Denmark 45 45 76 26 00, Finland 385 0 9 725 725 11, France 33 0 1 48 14 24 24, Germany 49 0 89 741 31 30, India 91 80 51190000, Israel 972 0 3 6393737, Italy 39 02 413091, Japan 81 3 5472 2970, Korea 82 02 3451 3400, Lebanon 961 0 1 33 28 28, Malaysia 1800 887710, Mexico 01 800 010 0793, Netherlands 31 0 348 433 466, New Zealand 0800 553 322, Norway 47 0 66 90 76 60, Poland 48 22 3390150, Portugal 351 210 311 210, Russia 7 095 783 68 51, Singapore 1800 226 5886, Slovenia 386 3 425 4200, South Africa 27 0 11 805 8197, Spain 34 91 640 0085, Sweden 46 0 8 587 895 00, Switzerland 41 56 200 51 51, Taiwan 886 02 2377 2222, Thailand 662 278 6777, United Kingdom 44 0 1635 523545
For further support information, refer to the Technical Support and Professional Services appendix. To comment on National Instruments documentation, refer to the National Instruments Web site at ni.com/info and enter the info code feedback.
© 2003–2005 National Instruments Ireland Resources Limited. All rights reserved.

Important Information
WarrantyThe DIAdem is warranted against defects in materials and workmanship for a period of 90 days from the date of shipment, as evidenced by receipts or other documentation. National Instruments will, at its option, repair or replace equipment that proves to be defective during the warranty period. This warranty includes parts and labor.
The media on which you receive National Instruments software are warranted not to fail to execute programming instructions, due to defects in materials and workmanship, for a period of 90 days from date of shipment, as evidenced by receipts or other documentation. National Instruments will, at its option, repair or replace software media that do not execute programming instructions if National Instruments receives notice of such defects during the warranty period. National Instruments does not warrant that the operation of the software shall be uninterrupted or error free.
A Return Material Authorization (RMA) number must be obtained from the factory and clearly marked on the outside of the package before any equipment will be accepted for warranty work. National Instruments will pay the shipping costs of returning to the owner parts which are covered by warranty.
National Instruments believes that the information in this document is accurate. The document has been carefully reviewed for technical accuracy. In the event that technical or typographical errors exist, National Instruments reserves the right to make changes to subsequent editions of this document without prior notice to holders of this edition. The reader should consult National Instruments if errors are suspected. In no event shall National Instruments be liable for any damages arising out of or related to this document or the information contained in it.
EXCEPT AS SPECIFIED HEREIN, NATIONAL INSTRUMENTS MAKES NO WARRANTIES, EXPRESS OR IMPLIED, AND SPECIFICALLY DISCLAIMS ANY WARRANTY OF MERCHANTABILITY OR FITNESS FOR A PARTICULAR PURPOSE. CUSTOMER’S RIGHT TO RECOVER DAMAGES CAUSED BY FAULT OR NEGLIGENCE ON THE PART OF NATIONAL INSTRUMENTS SHALL BE LIMITED TO THE AMOUNT THERETOFORE PAID BY THE CUSTOMER. NATIONAL INSTRUMENTS WILL NOT BE LIABLE FOR DAMAGES RESULTING FROM LOSS OF DATA, PROFITS, USE OF PRODUCTS, OR INCIDENTAL OR CONSEQUENTIAL DAMAGES, EVEN IF ADVISED OF THE POSSIBILITY THEREOF. This limitation of the liability of National Instruments will apply regardless of the form of action, whether in contract or tort, including negligence. Any action against National Instruments must be brought within one year after the cause of action accrues. National Instruments shall not be liable for any delay in performance due to causes beyond its reasonable control. The warranty provided herein does not cover damages, defects, malfunctions, or service failures caused by owner’s failure to follow the National Instruments installation, operation, or maintenance instructions; owner’s modification of the product; owner’s abuse, misuse, or negligent acts; and power failure or surges, fire, flood, accident, actions of third parties, or other events outside reasonable control.
CopyrightUnder the copyright laws, this publication may not be reproduced or transmitted in any form, electronic or mechanical, including photocopying, recording, storing in an information retrieval system, or translating, in whole or in part, without the prior written consent of National Instruments Corporation.
In regards to components used in USI (Xerces C++, ICU, and HDF5), the following copyrights apply. For a listing of the conditions and disclaimers, refer to the USICopyrights.chm.
This product includes software developed by the Apache Software Foundation (http:/www.apache.org/). Copyright © 1999 The Apache Software Foundation. All rights reserved.
Copyright © 1995–2003 International Business Machines Corporation and others. All rights reserved.
NCSA HDF5 (Hierarchical Data Format 5) Software Library and UtilitiesCopyright 1998, 1999, 2000, 2001, 2003 by the Board of Trustees of the University of Illinois. All rights reserved.
TrademarksNational Instruments, NI, ni.com, and LabVIEW are trademarks of National Instruments Corporation. Refer to the Terms of Use section on ni.com/legal for more information about National Instruments trademarks.
Other product and company names mentioned herein are trademarks or trade names of their respective companies.
Members of the National Instruments Alliance Partner Program are business entities independent from National Instruments and have no agency, partnership, or joint-venture relationship with National Instruments.
PatentsFor patents covering National Instruments products, refer to the appropriate location: Help»Patents in your software, the patents.txt file on your CD, or ni.com/patents.
WARNING REGARDING USE OF NATIONAL INSTRUMENTS PRODUCTS(1) NATIONAL INSTRUMENTS PRODUCTS ARE NOT DESIGNED WITH COMPONENTS AND TESTING FOR A LEVEL OF RELIABILITY SUITABLE FOR USE IN OR IN CONNECTION WITH SURGICAL IMPLANTS OR AS CRITICAL COMPONENTS IN ANY LIFE SUPPORT SYSTEMS WHOSE FAILURE TO PERFORM CAN REASONABLY BE EXPECTED TO CAUSE SIGNIFICANT INJURY TO A HUMAN.
(2) IN ANY APPLICATION, INCLUDING THE ABOVE, RELIABILITY OF OPERATION OF THE SOFTWARE PRODUCTS CAN BE IMPAIRED BY ADVERSE FACTORS, INCLUDING BUT NOT LIMITED TO FLUCTUATIONS IN ELECTRICAL POWER SUPPLY, COMPUTER HARDWARE MALFUNCTIONS, COMPUTER OPERATING SYSTEM SOFTWARE FITNESS, FITNESS OF COMPILERS AND DEVELOPMENT SOFTWARE USED TO DEVELOP AN APPLICATION, INSTALLATION ERRORS, SOFTWARE AND HARDWARE COMPATIBILITY PROBLEMS, MALFUNCTIONS OR FAILURES OF ELECTRONIC MONITORING OR CONTROL DEVICES, TRANSIENT FAILURES OF ELECTRONIC SYSTEMS (HARDWARE AND/OR SOFTWARE), UNANTICIPATED USES OR MISUSES, OR ERRORS ON THE PART OF THE USER OR APPLICATIONS DESIGNER (ADVERSE FACTORS SUCH AS THESE ARE HEREAFTER COLLECTIVELY TERMED “SYSTEM FAILURES”). ANY APPLICATION WHERE A SYSTEM FAILURE WOULD CREATE A RISK OF HARM TO PROPERTY OR PERSONS (INCLUDING THE RISK OF BODILY INJURY AND DEATH) SHOULD NOT BE RELIANT SOLELY UPON ONE FORM OF ELECTRONIC SYSTEM DUE TO THE RISK OF SYSTEM FAILURE. TO AVOID DAMAGE, INJURY, OR DEATH, THE USER OR APPLICATION DESIGNER MUST TAKE REASONABLY PRUDENT STEPS TO

PROTECT AGAINST SYSTEM FAILURES, INCLUDING BUT NOT LIMITED TO BACK-UP OR SHUT DOWN MECHANISMS. BECAUSE EACH END-USER SYSTEM IS CUSTOMIZED AND DIFFERS FROM NATIONAL INSTRUMENTS' TESTING PLATFORMS AND BECAUSE A USER OR APPLICATION DESIGNER MAY USE NATIONAL INSTRUMENTS PRODUCTS IN COMBINATION WITH OTHER PRODUCTS IN A MANNER NOT EVALUATED OR CONTEMPLATED BY NATIONAL INSTRUMENTS, THE USER OR APPLICATION DESIGNER IS ULTIMATELY RESPONSIBLE FOR VERIFYING AND VALIDATING THE SUITABILITY OF NATIONAL INSTRUMENTS PRODUCTS WHENEVER NATIONAL INSTRUMENTS PRODUCTS ARE INCORPORATED IN A SYSTEM OR APPLICATION, INCLUDING, WITHOUT LIMITATION, THE APPROPRIATE DESIGN, PROCESS AND SAFETY LEVEL OF SUCH SYSTEM OR APPLICATION.
© National Instruments Ireland Resources Limited v DIAdem: Data Acquisition
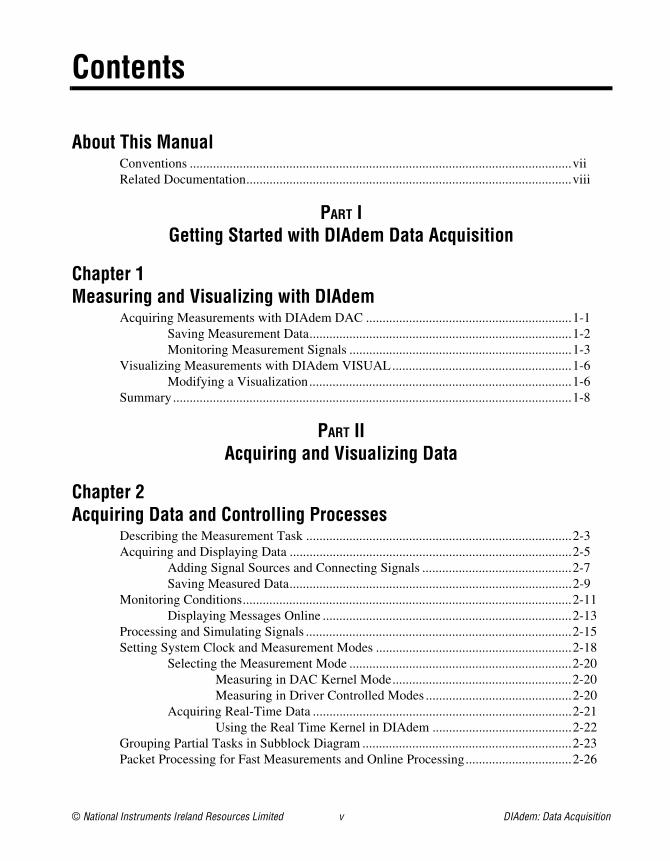
Contents
About This ManualConventions ...................................................................................................................viiRelated Documentation..................................................................................................viii
PART IGetting Started with DIAdem Data Acquisition
Chapter 1Measuring and Visualizing with DIAdem
Acquiring Measurements with DIAdem DAC ..............................................................1-1Saving Measurement Data...............................................................................1-2Monitoring Measurement Signals ...................................................................1-3
Visualizing Measurements with DIAdem VISUAL......................................................1-6Modifying a Visualization...............................................................................1-6
Summary........................................................................................................................1-8
PART IIAcquiring and Visualizing Data
Chapter 2Acquiring Data and Controlling Processes
Describing the Measurement Task ................................................................................2-3Acquiring and Displaying Data .....................................................................................2-5
Adding Signal Sources and Connecting Signals .............................................2-7Saving Measured Data.....................................................................................2-9
Monitoring Conditions...................................................................................................2-11Displaying Messages Online ...........................................................................2-13
Processing and Simulating Signals ................................................................................2-15Setting System Clock and Measurement Modes ...........................................................2-18
Selecting the Measurement Mode ...................................................................2-20Measuring in DAC Kernel Mode......................................................2-20Measuring in Driver Controlled Modes ............................................2-20
Acquiring Real-Time Data ..............................................................................2-21Using the Real Time Kernel in DIAdem ..........................................2-22
Grouping Partial Tasks in Subblock Diagram ...............................................................2-23Packet Processing for Fast Measurements and Online Processing................................2-26

Contents
DIAdem: Data Acquisition vi ni.com
Using the Alarm and Protocol System .......................................................................... 2-29Defining Alarms.............................................................................................. 2-29Setting Up the User Management ................................................................... 2-32
Chapter 3Visualizing and Operating
Opening a Block Diagram, Starting a Measurement..................................................... 3-2Designing the Visualization .......................................................................................... 3-2
Positioning Instruments................................................................................... 3-2Setting Instruments ......................................................................................... 3-4Grouping Instruments ..................................................................................... 3-5
Striking Visualization.................................................................................................... 3-5
Chapter 4Using Hardware
Registering and Configuring Drivers ............................................................................ 4-1Installing Hardware Drivers............................................................................ 4-1Assigning DIAdem Drivers ............................................................................ 4-1Assigning and Configuring Inputs/Outputs .................................................... 4-2
Configuring Single Point Processing Drivers................................... 4-2Configuring Packet Drivers .............................................................. 4-3
Using, Interchanging, and Setting Parameters for Hardware Blocks ............. 4-3Communicating through Interfaces ............................................................................... 4-4
Using Online DDE .......................................................................................... 4-4Using OLE for Process Control ...................................................................... 4-5Data Exchange in the Internet/Intranet through TCP/IP................................. 4-5Using Control File Driver ............................................................................... 4-6Using Script DAC Driver................................................................................ 4-7Testing Communication with the Interface Monitor ...................................... 4-9
Appendix ATechnical Support and Professional Services
Index

© National Instruments Ireland Resources Limited vii DIAdem: Data Acquisition
About This Manual
The DIAdem: Data Acquisition manual describes measurement, control, and visualization with DIAdem. The DIAdem: Data Acquisition manual is based on the DIAdem Data Analysis and Report Generation manual.
Complete DIAdem documentation is available as PDF files (Portable Document Format) on the DIAdem CD.
The DIAdem: Data Acquisition manual consists of two parts:
• Part I, Getting Started with DIAdem Data Acquisition, explains how to generate your first block diagram for data acquisition and visualization.
• Part II, Acquiring and Visualizing Data, explains the functions of DIAdem DAC and DIAdem VISUAL in more detail.
ConventionsThe following conventions appear in this manual:
<> Angle brackets indicate a key you press to perform a function, for example, <Ctrl>.
» The » symbol leads you through nested menu items and dialog box options to a final action. The sequence File»Page Setup»Options directs you to pull down the File menu, select the Page Setup item, and select Options from the last dialog box.
This icon denotes a tip, which alerts you to advisory information.
This icon denotes a note, which alerts you to important information.
This icon denotes a caution, which advises you of precautions to take to avoid injury, data loss, or a system crash.
bold Bold text denotes items that you must select or click in the software, such as menu items and dialog box options.
italic Italic text denotes emphasis, a cross reference, or an introduction to a key concept.

About This Manual
DIAdem: Data Acquisition viii ni.com
monospace Text in this font denotes text or characters that you should enter from the keyboard, formulas, sections of code, programming examples, and syntax examples. This font is also used for the proper names of disk drives, paths, directories, programs, subprograms, subroutines, device names, functions, operations, commands, variables, filenames and extensions, and code excerpts.
monospace bold Bold text in this font denotes the messages and responses that the computer automatically prints to the screen. This font also emphasizes lines of code that are different from the other examples.
right-click (Mac OS) Press <Command>-click to perform the same action as a right-click.
Related DocumentationThe following documents contain information that you may find helpful as you read this manual:
• Getting Started with DIAdem
• DIAdem: Data Analysis and Report Generation
• DIAdem Help, available by selecting Help»Contents

© National Instruments Ireland Resources Limited I-1 DIAdem: Data Acquisition
Part I
Getting Started with DIAdem Data Acquisition
Part I explains how to generate your first block diagram in DIAdem, for data acquisition and visualization.

© National Instruments Ireland Resources Limited 1-1 DIAdem: Data Acquisition
1Measuring and Visualizing with DIAdem
With the DIAdem DAC and DIAdem VISUAL panels you can acquire data, control processes, and visualize online data.
Acquiring Measurements with DIAdem DACWith DIAdem DAC, you develop measurement and control solutions in a block diagram. You select necessary functions from an extensive function library and place function blocks into the workspace. You connect blocks logically by dragging wires with the mouse.
Measurement data come from data sources and go to processing blocks, display instruments, and output blocks. To create a block diagram with a simulated signal, complete the following steps:
Note You can substitute simulation signals later with real data sources.
1. Select the DIAdem DAC panel.
2. Click Delete Block Diagram.
3. Click Simulation Input Blocks in the group bar.
4. Click Generator in the function bar. The block appears in the DIAdem DAC workspace. You can move a function block anywhere in the workspace with the mouse.
5. Click Display in the group bar.
6. Click Digits in the function bar.
Chapter 1 Measuring and Visualizing with DIAdem
DIAdem: Data Acquisition 1-2 ni.com
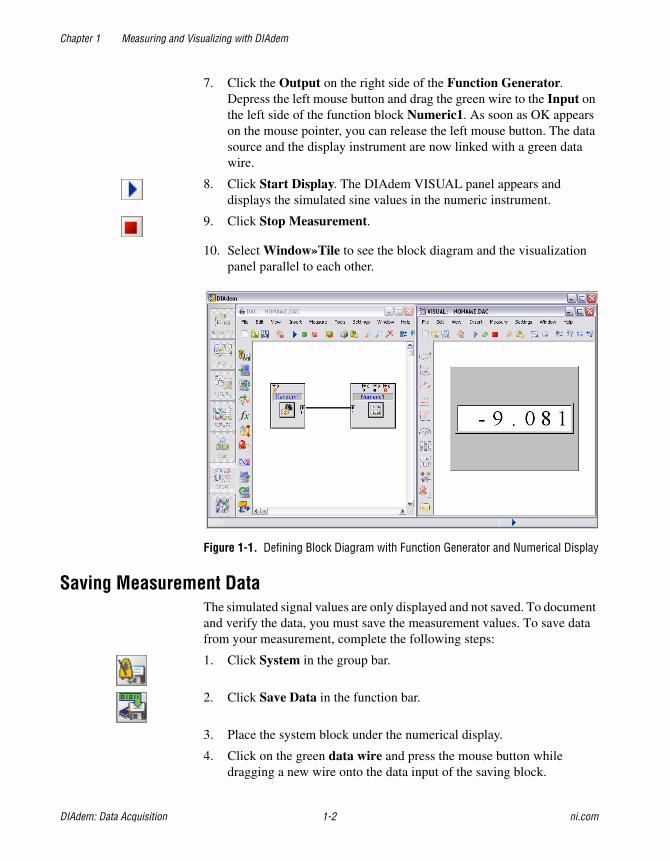
7. Click the Output on the right side of the Function Generator. Depress the left mouse button and drag the green wire to the Input on the left side of the function block Numeric1. As soon as OK appears on the mouse pointer, you can release the left mouse button. The data source and the display instrument are now linked with a green data wire.
8. Click Start Display. The DIAdem VISUAL panel appears and displays the simulated sine values in the numeric instrument.
9. Click Stop Measurement.
10. Select Window»Tile to see the block diagram and the visualization panel parallel to each other.
Figure 1-1. Defining Block Diagram with Function Generator and Numerical Display
Saving Measurement DataThe simulated signal values are only displayed and not saved. To document and verify the data, you must save the measurement values. To save data from your measurement, complete the following steps:
1. Click System in the group bar.
2. Click Save Data in the function bar.
3. Place the system block under the numerical display.
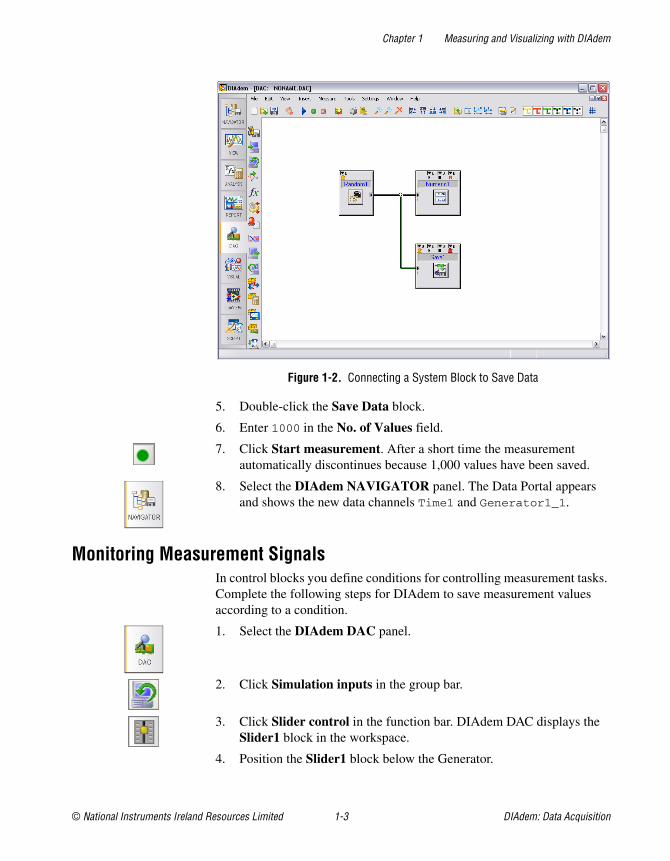
4. Click on the green data wire and press the mouse button while dragging a new wire onto the data input of the saving block.
Chapter 1 Measuring and Visualizing with DIAdem
© National Instruments Ireland Resources Limited 1-3 DIAdem: Data Acquisition
Figure 1-2. Connecting a System Block to Save Data
5. Double-click the Save Data block.
6. Enter 1000 in the No. of Values field.
7. Click Start measurement. After a short time the measurement automatically discontinues because 1,000 values have been saved.
8. Select the DIAdem NAVIGATOR panel. The Data Portal appears and shows the new data channels Time1 and Generator1_1.
Monitoring Measurement SignalsIn control blocks you define conditions for controlling measurement tasks. Complete the following steps for DIAdem to save measurement values according to a condition.
1. Select the DIAdem DAC panel.
2. Click Simulation inputs in the group bar.
3. Click Slider control in the function bar. DIAdem DAC displays the Slider1 block in the workspace.
4. Position the Slider1 block below the Generator.
Chapter 1 Measuring and Visualizing with DIAdem
DIAdem: Data Acquisition 1-4 ni.com
5. Click Control in the group bar.
6. Click Window condition in the function bar. DIAdem DAC displays the Window1 block in the workspace.
7. Position the Window1 block next to the Slider control.
8. Drag a green bus from the output on the Slider control to the input on the Window condition.
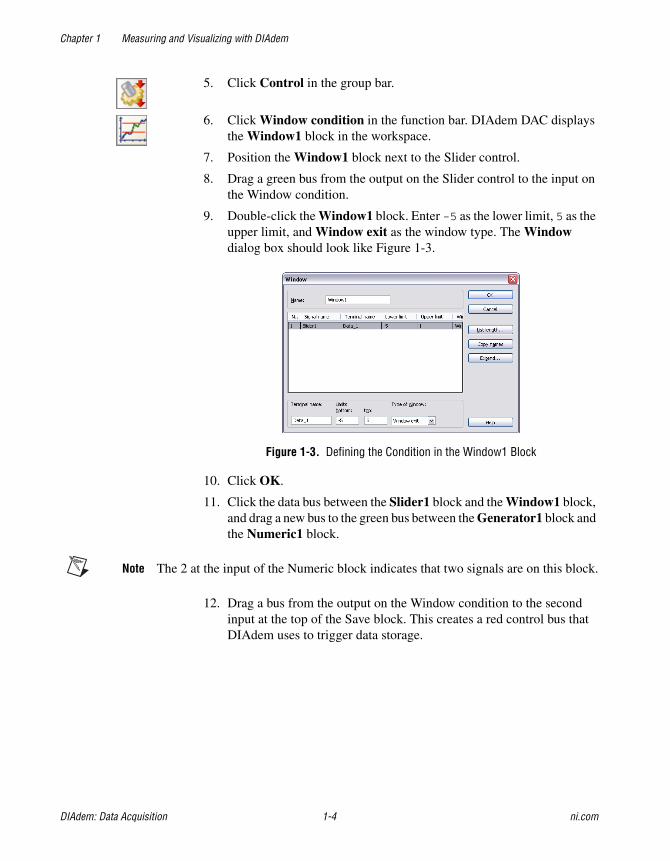
9. Double-click the Window1 block. Enter -5 as the lower limit, 5 as the upper limit, and Window exit as the window type. The Window dialog box should look like Figure 1-3.
Figure 1-3. Defining the Condition in the Window1 Block
10. Click OK.
11. Click the data bus between the Slider1 block and the Window1 block, and drag a new bus to the green bus between the Generator1 block and the Numeric1 block.
Note The 2 at the input of the Numeric block indicates that two signals are on this block.
12. Drag a bus from the output on the Window condition to the second input at the top of the Save block. This creates a red control bus that DIAdem uses to trigger data storage.

Chapter 1 Measuring and Visualizing with DIAdem
© National Instruments Ireland Resources Limited 1-5 DIAdem: Data Acquisition
The block diagram should look like Figure 1-4.
Figure 1-4. Extended Block Diagram with Slider Control and Window Condition
Note DIAdem displays control buses in red. You connect control buses at the top or at the bottom of a block.
13. Click Start measurement. The DIAdem VISUAL panel appears with the Slider control and the Numeric display.
14. Drag the Slider control. If you move the Slider control above the value 5 or below the value –5, DIAdem starts to save the measurement values.
15. Click Stop measurement. DIAdem stores the values of the measured signals to new channels in the Data Portal.

Chapter 1 Measuring and Visualizing with DIAdem
DIAdem: Data Acquisition 1-6 ni.com
Visualizing Measurements with DIAdem VISUALDIAdem VISUAL is the visualization screen for DIAdem DAC. You can influence the actions of a measurement with control instruments. In DIAdem VISUAL, you can arrange and configure operation and display instruments during a measurement.
To load a block diagram created in DIAdem DAC and start the measurement, complete the following steps:
1. Select the DIAdem VISUAL panel.
2. Click Load Block Diagram.
3. Select the file example.dac and click Open.
4. Click Start Display.
5. Allow the measurement to run for a short period.
6. Click Stop Measurement.
Modifying a VisualizationTo modify a visualization, you can insert new instruments and configure existing instruments.
Note The logical wiring of instruments takes place in DIAdem DAC.
To add a company logo to a visualization, complete the following steps:
1. Click Graphics in the group bar.
2. Click Graphic1 in the function bar. A logo is inserted in the upper left corner of the workspace.
3. Place the logo under the building display.
4. Size the logo by dragging the small square blocks at the edges of the graphic.
5. Click the building graphic and size the graphic by dragging the square blocks at the edges of the graphic.
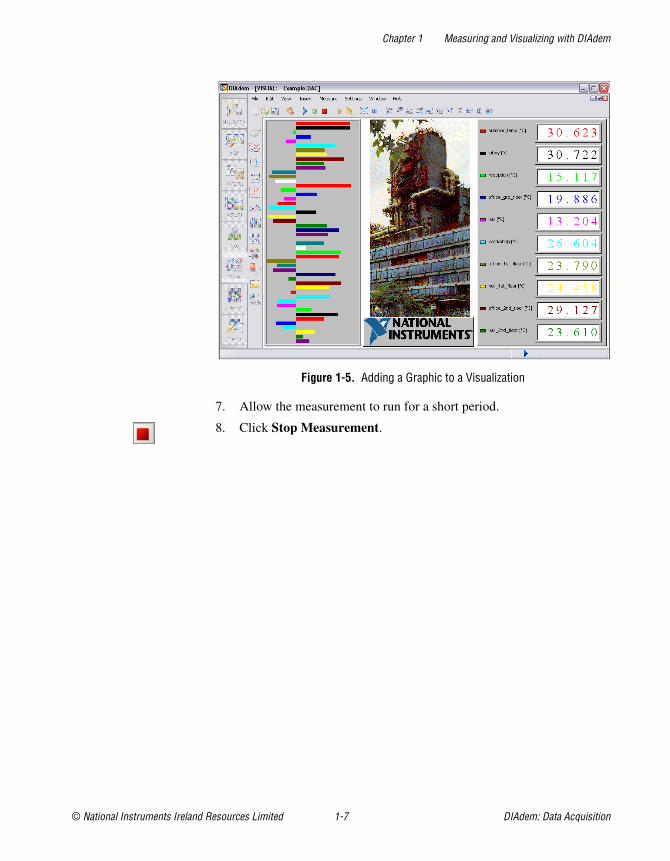
6. Click Start Display.
Chapter 1 Measuring and Visualizing with DIAdem
© National Instruments Ireland Resources Limited 1-7 DIAdem: Data Acquisition
Figure 1-5. Adding a Graphic to a Visualization
7. Allow the measurement to run for a short period.
8. Click Stop Measurement.
Chapter 1 Measuring and Visualizing with DIAdem
DIAdem: Data Acquisition 1-8 ni.com
SummaryThe following topics are a summary of the main concepts that you learned in this chapter.
DIAdem DACUsing DIAdem DAC, you describe the measurement and operation assignments with a block diagram. From the large function library, select necessary functions that you place as function blocks in the workspace. The logical connection of the blocks occurs using connections that you draw as lines.
Data AcquisitionBlocks represent data sources such as A/D converter boards, front end devices, and other external measurement devices. You register the corresponding drivers in DIAdem DAC and configure the available signal inputs and outputs. Additional data sources can be input instruments, data files, and calculation results.
DIAdem VISUALSelect instruments such as pointer, number, bar display, writer, or wiper displays for measurement values from the DIAdem VISUAL library. With control instruments such as switches, knobs, or slider controls, you can trigger and control during a measurement function. When designing a visualization, you can align and configure instruments as you like.
When you start a measurement, DIAdem automatically switches to the DIAdem VISUAL panel and starts the visualization.

© National Instruments Ireland Resources Limited II-1 DIAdem: Data Acquisition
Part II
Acquiring and Visualizing Data
Part II describes the functions for defining your block diagrams:
• Chapter 2, Acquiring Data and Controlling Processes, decribes the basic elements of a block diagram. You connect simulation inputs to visualization instruments and control data storage with conditions.
• Chapter 3, Visualizing and Operating, describes the visualization and control elements, and explains how to set them.
• Chapter 4, Using Hardware, describes how to register and configure driver software for measurement hardware in DIAdem.
© National Instruments Ireland Resources Limited 2-1 DIAdem: Data Acquisition
2Acquiring Data and Controlling Processes
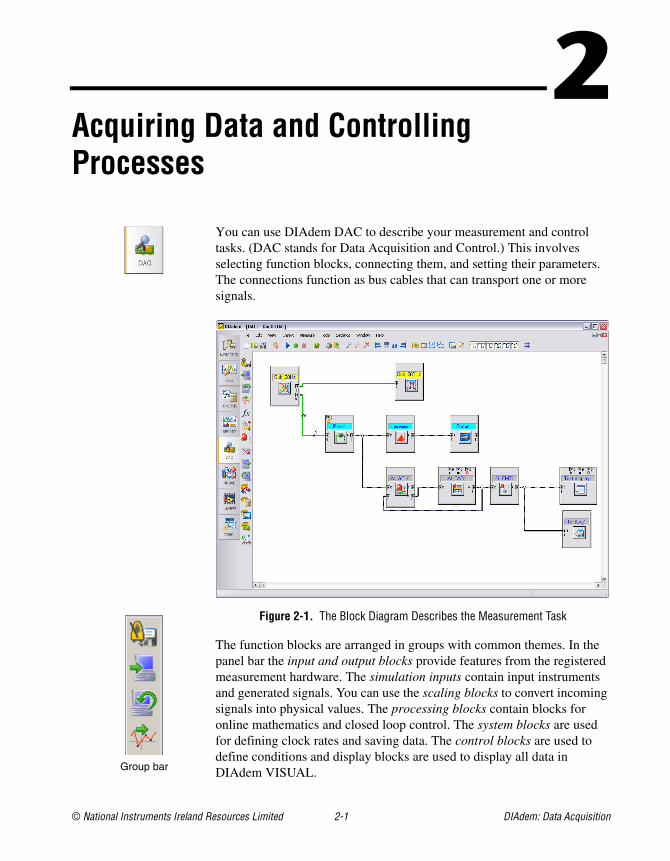
You can use DIAdem DAC to describe your measurement and control tasks. (DAC stands for Data Acquisition and Control.) This involves selecting function blocks, connecting them, and setting their parameters. The connections function as bus cables that can transport one or more signals.
Figure 2-1. The Block Diagram Describes the Measurement Task
The function blocks are arranged in groups with common themes. In the panel bar the input and output blocks provide features from the registered measurement hardware. The simulation inputs contain input instruments and generated signals. You can use the scaling blocks to convert incoming signals into physical values. The processing blocks contain blocks for online mathematics and closed loop control. The system blocks are used for defining clock rates and saving data. The control blocks are used to define conditions and display blocks are used to display all data in DIAdem VISUAL.Group bar
Chapter 2 Acquiring Data and Controlling Processes
DIAdem: Data Acquisition 2-2 ni.com
In DIAdem, the measured values are acquired, processed and visualized value by value. This is called single point processing. With packet processing, the data is grouped into packets for performing online classification or online FFT, for example. Single point and packet processing blocks can be combined in one block diagram.
The alarm and protocol system monitors signals for limit values. Alarm messages with different priorities can be generated, displayed, recorded, and sent over the Internet. The user administration enables authorized users to confirm alarms.
You get function blocks from the function bars, place them in the workspace, and define parameters for them. You can copy, exchange and delete blocks, and connect them using the signal inputs and outputs. You can connect blocks to blocks, blocks to cables, and cables to cables.
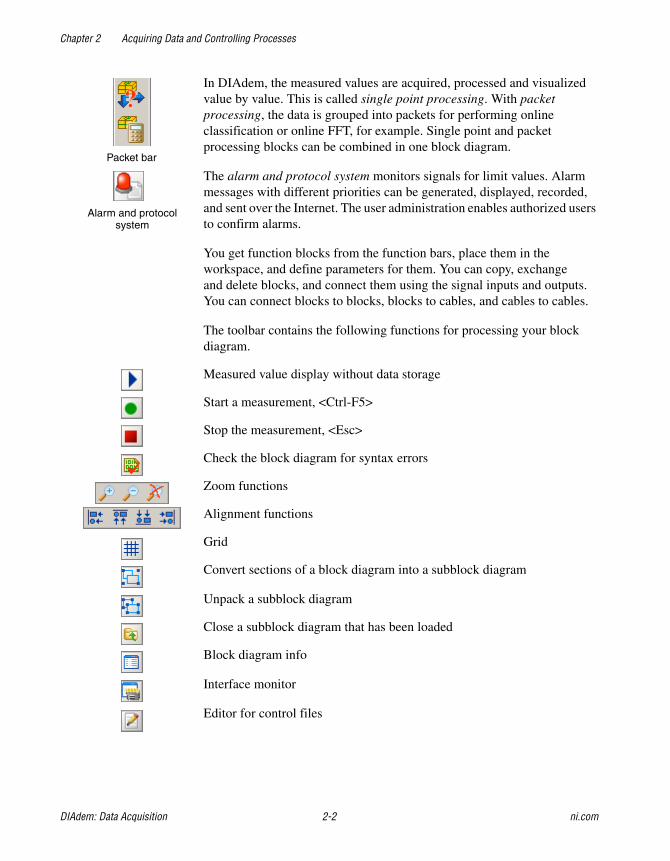
The toolbar contains the following functions for processing your block diagram.
Measured value display without data storage
Start a measurement, <Ctrl-F5>
Stop the measurement, <Esc>
Check the block diagram for syntax errors
Zoom functions
Alignment functions
Grid
Convert sections of a block diagram into a subblock diagram
Unpack a subblock diagram
Close a subblock diagram that has been loaded
Block diagram info
Interface monitor
Editor for control files
Packet bar
Alarm and protocol system
Chapter 2 Acquiring Data and Controlling Processes
© National Instruments Ireland Resources Limited 2-3 DIAdem: Data Acquisition
Describing the Measurement TaskYou describe the measurement task as a graphic block diagram, as shown in Figure 2-1, which is saved as a .DAC file. Block diagrams have a clear structure—you select the function blocks you need from the function bar, place them in the workspace, and connect them.
DIAdem distinguishes between different cable connection types that transport different types of signals. You can delete each of the cable types in the toolbar.
• Yellow system cables transport the clock rate.
• Red control cables transport control signals, for starting and stopping actions, for example.
• Green data cables transport measured values.
• Green-black data cables transport packet processing values.
• Blue-black alarm cables transport alarms.
• Gray-black text cables transport message texts.
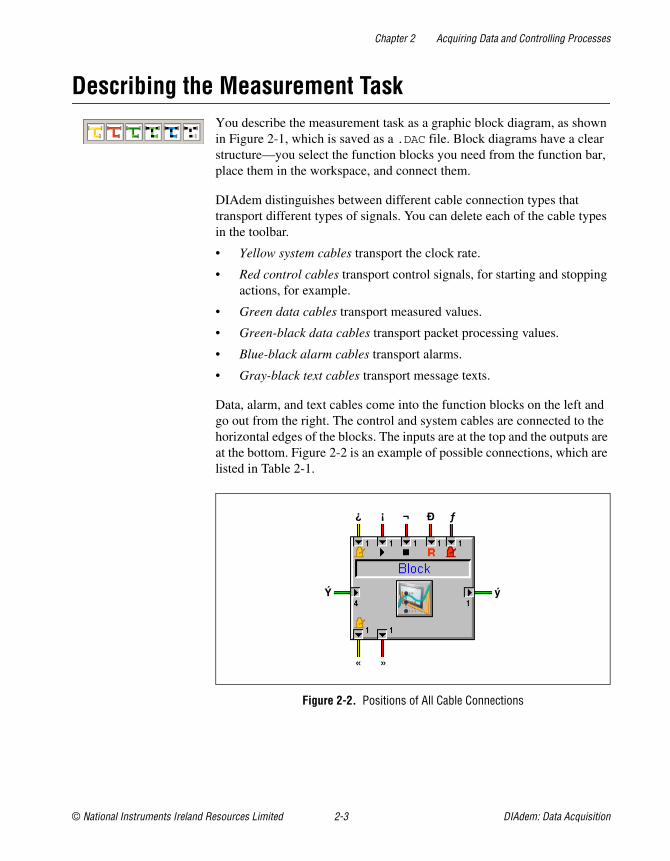
Data, alarm, and text cables come into the function blocks on the left and go out from the right. The control and system cables are connected to the horizontal edges of the blocks. The inputs are at the top and the outputs are at the bottom. Figure 2-2 is an example of possible connections, which are listed in Table 2-1.
Figure 2-2. Positions of All Cable Connections
«
ƒ
ý
Ь¡¿
Ý
»

Chapter 2 Acquiring Data and Controlling Processes
DIAdem: Data Acquisition 2-4 ni.com
To connect function blocks, click on an output and drag the crosshair to the target input. You can only connect the same kinds of terminals and cables. An OK at the mouse cursor indicates that a connection can be made and a cross indicates the opposite. If a cable is already connected at a block terminal, no other cables can be connected. Click on the cable and create a branch instead.
A branch is displayed as a circle. All the connected cables contain the same signals.
An input point is displayed as a square. To input additional signals into a bus cable, place the end of a cable on an existing cable. The black triangles indicate which cables input signals.
Branches and input points can be shifted. Keeping the left mouse button pressed, pull a rubber band around the node. You can delete the marked cables and nodes with <Del>.
The cables can contain more than one signal. The number of transported signals is displayed by a black slash.
If you mark a cable, a signal list symbol appears at the mouse pointer. Double-click on the cable to open the signal list with the connected block outputs and all the signals contained. Click on the workspace to undo the marking.
Table 2-1. List of Cable Connection Types
Cable Type Number in Figure 2-2 Connector
Yellow system cables 1 Clock input
8 Clock output
Red control cables 2 Control input start
3 Control input stop
4 Reset control input
5 Clock release
9 Control output
Green data cables 6 Data input
7 Data output
Branch
Input point
Number of signals
Signal list
Chapter 2 Acquiring Data and Controlling Processes
© National Instruments Ireland Resources Limited 2-5 DIAdem: Data Acquisition
In complex block diagrams, cables may be continued in the background. The interrupt ends are indicated by a black point and the DIAdem cable designation, for example, D9.
The block diagram can be barred from modifications with Edit»Block parameterization. With Edit»Find, you can search for a function block in an extensive block diagram and request its properties and connections. Click Measure»Measurement (without display) for data acquisition without visualization.
Use Settings»Options»DAC to define basic properties of the measurement kernel and the block diagram editor. Specify the maximum number of blocks and signals for one block diagram in the measurement kernel. In the Editor, you can change the colors and labels for the appearance of the block diagram.
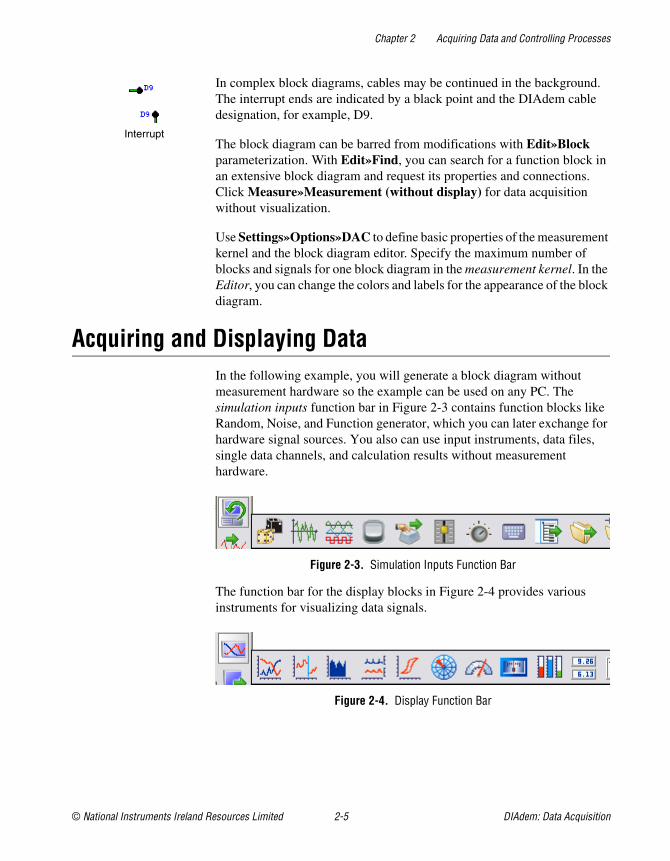
Acquiring and Displaying DataIn the following example, you will generate a block diagram without measurement hardware so the example can be used on any PC. The simulation inputs function bar in Figure 2-3 contains function blocks like Random, Noise, and Function generator, which you can later exchange for hardware signal sources. You also can use input instruments, data files, single data channels, and calculation results without measurement hardware.
Figure 2-3. Simulation Inputs Function Bar
The function bar for the display blocks in Figure 2-4 provides various instruments for visualizing data signals.
Figure 2-4. Display Function Bar
Interrupt
Chapter 2 Acquiring Data and Controlling Processes
DIAdem: Data Acquisition 2-6 ni.com
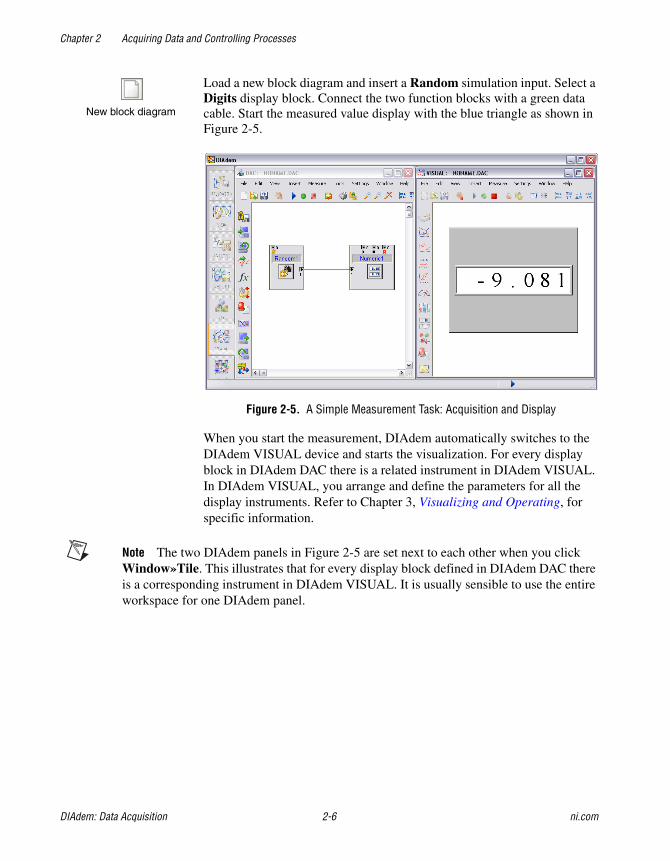
Load a new block diagram and insert a Random simulation input. Select a Digits display block. Connect the two function blocks with a green data cable. Start the measured value display with the blue triangle as shown in Figure 2-5.
Figure 2-5. A Simple Measurement Task: Acquisition and Display
When you start the measurement, DIAdem automatically switches to the DIAdem VISUAL device and starts the visualization. For every display block in DIAdem DAC there is a related instrument in DIAdem VISUAL. In DIAdem VISUAL, you arrange and define the parameters for all the display instruments. Refer to Chapter 3, Visualizing and Operating, for specific information.
Note The two DIAdem panels in Figure 2-5 are set next to each other when you click Window»Tile. This illustrates that for every display block defined in DIAdem DAC there is a corresponding instrument in DIAdem VISUAL. It is usually sensible to use the entire workspace for one DIAdem panel.
New block diagram

Chapter 2 Acquiring Data and Controlling Processes
© National Instruments Ireland Resources Limited 2-7 DIAdem: Data Acquisition
Adding Signal Sources and Connecting SignalsAdd a Noise simulation input to the block diagram in the example. Connect its data output to the existing green data cable. Select Graph display as the second display instrument. Connect the data cable to the Graph block data input.
Add the diagram of the measurement object as an illustration. Select the Graphic display block and enter DAC.wmf in the block dialog as Graphic»File name. This graphic shows gears in a machine.
Enter the settings from Table 2-2 in the Random block dialog.
Figure 2-6. Signals Can Be Deactivated in Input Blocks
In the Active column in Figure 2-6, you can deactivate single signals without having to disconnect them. These signals are retained in the signal list without transporting data.
Signals can be connected and disconnected at the block inputs, the same as for cable terminal panels. In the example, Noise is only to be displayed as a graph and the temperature only as a number. You have to disconnect the Noise signal from the numeric display and connect it as the only signal to the Graph display.
Table 2-2. Configuring the Function Block Random1
Parameters Settings
List length 8
Block name Temperature
Noise
Graphic
Chapter 2 Acquiring Data and Controlling Processes
DIAdem: Data Acquisition 2-8 ni.com
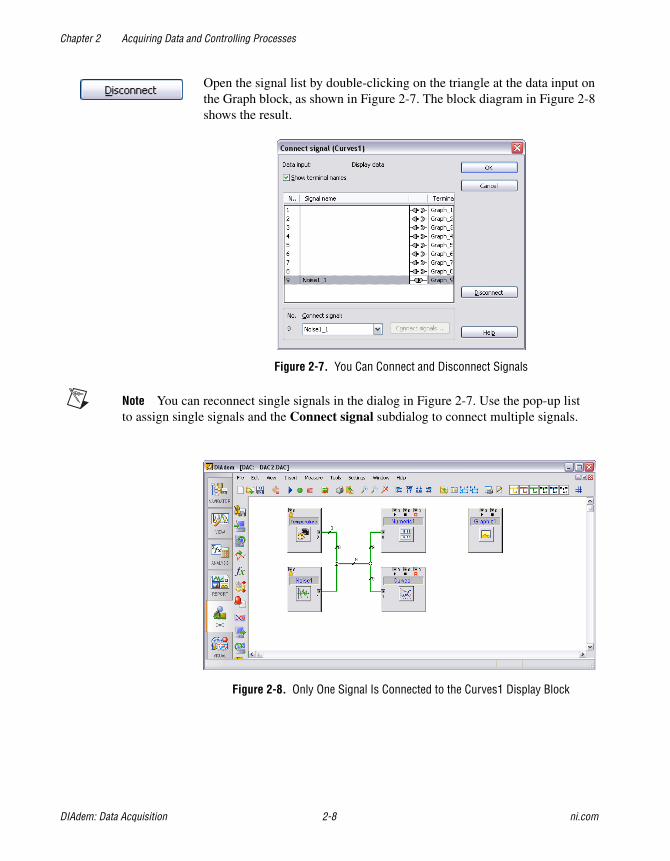
Open the signal list by double-clicking on the triangle at the data input on the Graph block, as shown in Figure 2-7. The block diagram in Figure 2-8 shows the result.
Figure 2-7. You Can Connect and Disconnect Signals
Note You can reconnect single signals in the dialog in Figure 2-7. Use the pop-up list to assign single signals and the Connect signal subdialog to connect multiple signals.
Figure 2-8. Only One Signal Is Connected to the Curves1 Display Block

Chapter 2 Acquiring Data and Controlling Processes
© National Instruments Ireland Resources Limited 2-9 DIAdem: Data Acquisition
After you have reassigned the display instruments in DIAdem VISUAL, start the Measured value display. The eight temperatures are displayed as numbers and the noise as a graph, as shown in Figure 2-9. The signal names are also activated as a legend.
Figure 2-9. The Extended Visualization Includes a Graphic and the Signal Names
Saving Measured DataSo far measured signals have been simulated and displayed. To document and check processes, the measured values have to be stored. The Save block, for storing measured data, is in the System function bar.
Click on the Save data with trigger system block and connect it to the data cable, as shown in Figure 2-10.
Saving data

Chapter 2 Acquiring Data and Controlling Processes
DIAdem: Data Acquisition 2-10 ni.com
Figure 2-10. You Can Write Data in the Data Portal or in a File
Start a measurement with the green start button this time, so the measured values are also saved.
The measurement ends when the number of values to be saved, which is specified in the Save block, has been attained. The measured values are stored in the Data Portal, where you can use them for other calculations.
Tip You also can write measured values straight into a data file. The file is created in the DEMO\DAT directory and you can specify the file name in the Save block.

Chapter 2 Acquiring Data and Controlling Processes
© National Instruments Ireland Resources Limited 2-11 DIAdem: Data Acquisition
Monitoring ConditionsFor the generation of control signals, the function bar for the control blocks in Figure 2-11 includes window, slope and time conditions, buttons, free formulas, and various links. The control signals are transported by red control cables, which are connected at the top and bottom of the function blocks.
Figure 2-11. Control Function Bar
In the example, the data will be saved when a limit value is exceeded, then it will be displayed on the screen. A slider control is monitored for limit values that have been defined in a window condition.
Click on the Window condition control block and open the block dialog, then enter the settings from Table 2-3.
Select a Slider control simulation input and position the slider control exactly above the Noise 1 block. Answer the question about exchanging the blocks with OK, then run a cable between the slider control and the window condition. Connect the bottom control output on the Window condition to the Start control inputs on the Save and Numeric blocks, as shown in Figure 2-12.
Table 2-3. Configuring the Window Condition Block
Parameters Settings
Lower limit –5
Upper limit +5
Type of window Window exit
Window condition
Slider control

Chapter 2 Acquiring Data and Controlling Processes
DIAdem: Data Acquisition 2-12 ni.com
Figure 2-12. The Window Condition Starts Numeric Display and Data Storage
In DIAdem VISUAL, position the slider control to the left of the Graph display and start a measurement. As soon as you move the slider above or below the specified limit values of ±5, the numeric display appears, as shown in Figure 2-13, and storage begins.

Chapter 2 Acquiring Data and Controlling Processes
© National Instruments Ireland Resources Limited 2-13 DIAdem: Data Acquisition
Figure 2-13. The Slider Controls Visualization and Data Storage
Displaying Messages OnlineYou can use the Message display block to display warnings or information during the measurement. In the block dialog box, enter the message file to be read out by the block. Instead of texts, you also can display diagrams or play wave (.WAV) files. If you want to use combinations, for example, graphics and sound together, you should use two message blocks with different message files.
Click on the Message display block and enter the settings from Table 2-4 in the dialog.
Message
Chapter 2 Acquiring Data and Controlling Processes
DIAdem: Data Acquisition 2-14 ni.com
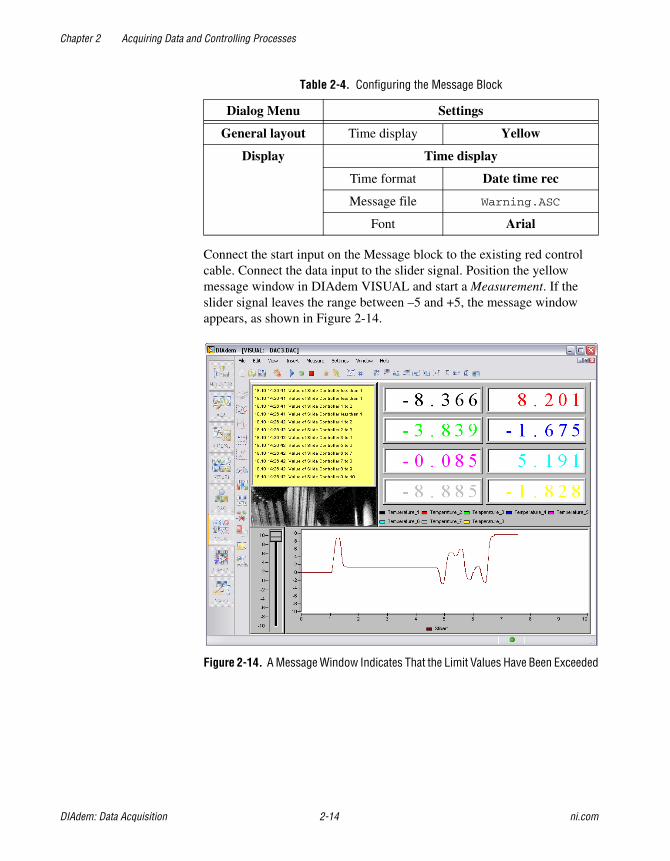
Connect the start input on the Message block to the existing red control cable. Connect the data input to the slider signal. Position the yellow message window in DIAdem VISUAL and start a Measurement. If the slider signal leaves the range between –5 and +5, the message window appears, as shown in Figure 2-14.
Figure 2-14. A Message Window Indicates That the Limit Values Have Been Exceeded
Table 2-4. Configuring the Message Block
Dialog Menu Settings
General layout Time display Yellow
Display Time display
Time format Date time rec
Message file Warning.ASC
Font Arial

Chapter 2 Acquiring Data and Controlling Processes
© National Instruments Ireland Resources Limited 2-15 DIAdem: Data Acquisition
Processing and Simulating SignalsScaling blocks convert electric signals into the original physical values, for example, a voltage into a temperature in degrees Fahrenheit.
The function bar for the scaling blocks in Figure 2-15 provides various scalings and thermolinearizations. With Multi-point scaling, you can define data points for any non-linear scaling in two data channels. The thermolinearizations (J, K, T, etc.) and the Pt100 linearization calculate the temperature from the measured voltage, and an external preamplification can be taken into account.
Figure 2-15. Scaling Function Bar
The function bar for the processing blocks in Figure 2-16 provides formula blocks for defining your own formulas, various closed-loop control algorithms, the script block for defining sequential runs, and help functions for copying or converting signals. Register the Script DAC driver with Settings»GPI-DLL Registration»Add»GFSVBSDR.DLL to obtain functions for determining the mean and bundling bits. Refer to Chapter 4, Using Hardware, for specific information.
Figure 2-16. Processing Function Bar
With the formula block, you can perform calculations during a measurement. The formula interpreter functions connect data and control signals, providing a new output signal. For example, you can calculate the power during the measurement using the current and voltage signals.
Note There is another formula block with the control blocks. This block has a control output instead of the data output. For the control signal, define a formula that has a result of 0 or 1.
If your measurement hardware has outputs, you can output DIAdem DAC signals. You can access the PC loudspeaker for testing purposes.
Chapter 2 Acquiring Data and Controlling Processes
DIAdem: Data Acquisition 2-16 ni.com
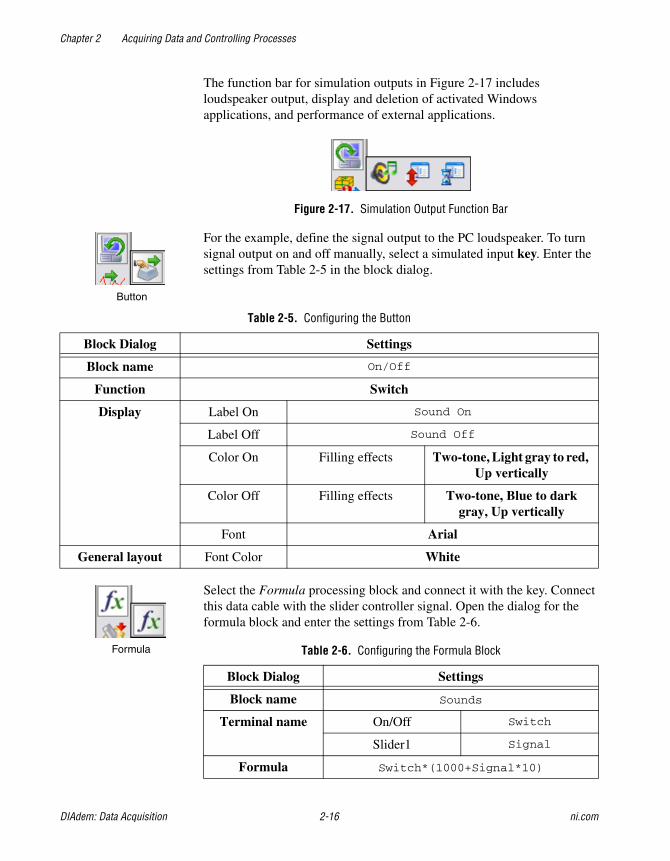
The function bar for simulation outputs in Figure 2-17 includes loudspeaker output, display and deletion of activated Windows applications, and performance of external applications.
Figure 2-17. Simulation Output Function Bar
For the example, define the signal output to the PC loudspeaker. To turn signal output on and off manually, select a simulated input key. Enter the settings from Table 2-5 in the block dialog.
Select the Formula processing block and connect it with the key. Connect this data cable with the slider controller signal. Open the dialog for the formula block and enter the settings from Table 2-6.
Table 2-5. Configuring the Button
Block Dialog Settings
Block name On/Off
Function Switch
Display Label On Sound On
Label Off Sound Off
Color On Filling effects Two-tone, Light gray to red, Up vertically
Color Off Filling effects Two-tone, Blue to dark gray, Up vertically
Font Arial
General layout Font Color White
Table 2-6. Configuring the Formula Block
Block Dialog Settings
Block name Sounds
Terminal name On/Off Switch
Slider1 Signal
Formula Switch*(1000+Signal*10)
Button
Formula

Chapter 2 Acquiring Data and Controlling Processes
© National Instruments Ireland Resources Limited 2-17 DIAdem: Data Acquisition
The switch returns 1 or 0 and forwards the signal.
Select the PC Loudspeaker simulation output block, change the block name to Speaker, and connect the input to the Sound formula block, as shown in Figure 2-18.
Figure 2-18. You Control the Loudspeaker Output by a Switch
In DIAdem VISUAL, position the switch below the yellow message window, as shown in Figure 2-19. Start a measurement. As soon as you activate a switch, you can modify the sound from the loudspeakers by moving the slider control.
Figure 2-19. The Slider Control Specifies the Frequency for the Sound Output
Loudspeakers
Chapter 2 Acquiring Data and Controlling Processes
DIAdem: Data Acquisition 2-18 ni.com
Note It is not always necessary to use formula blocks to realize a condition, and using formula blocks slows performance. Requests can often be defined more simply with fixed condition blocks. They also can be processed much faster during a measurement than with formula blocks.
Setting System Clock and Measurement ModesYou are now familiar with the green data cables and the red control cables. The yellow system cables define the system clock and the measurement mode.
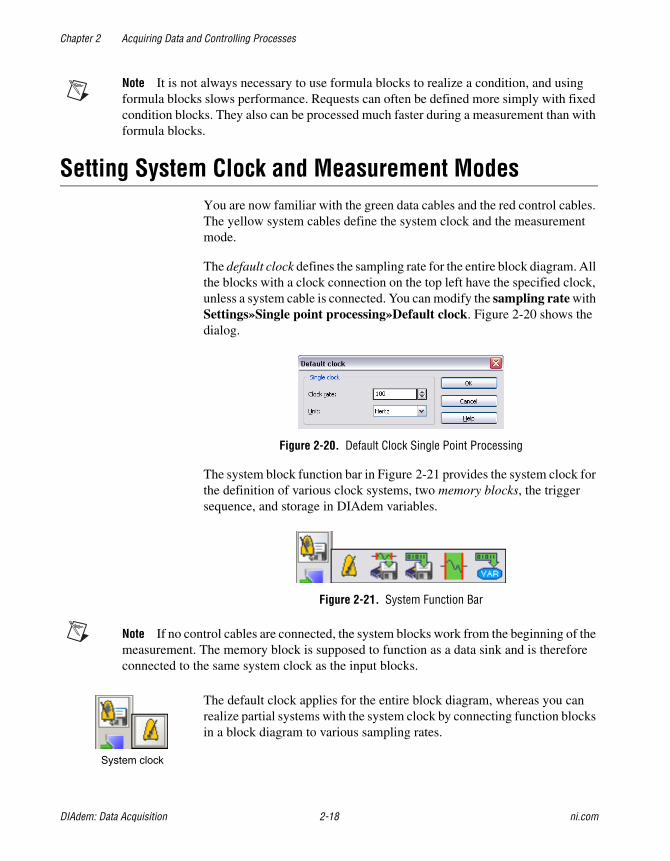
The default clock defines the sampling rate for the entire block diagram. All the blocks with a clock connection on the top left have the specified clock, unless a system cable is connected. You can modify the sampling rate with Settings»Single point processing»Default clock. Figure 2-20 shows the dialog.
Figure 2-20. Default Clock Single Point Processing
The system block function bar in Figure 2-21 provides the system clock for the definition of various clock systems, two memory blocks, the trigger sequence, and storage in DIAdem variables.
Figure 2-21. System Function Bar
Note If no control cables are connected, the system blocks work from the beginning of the measurement. The memory block is supposed to function as a data sink and is therefore connected to the same system clock as the input blocks.
The default clock applies for the entire block diagram, whereas you can realize partial systems with the system clock by connecting function blocks in a block diagram to various sampling rates.
System clock
Chapter 2 Acquiring Data and Controlling Processes
© National Instruments Ireland Resources Limited 2-19 DIAdem: Data Acquisition
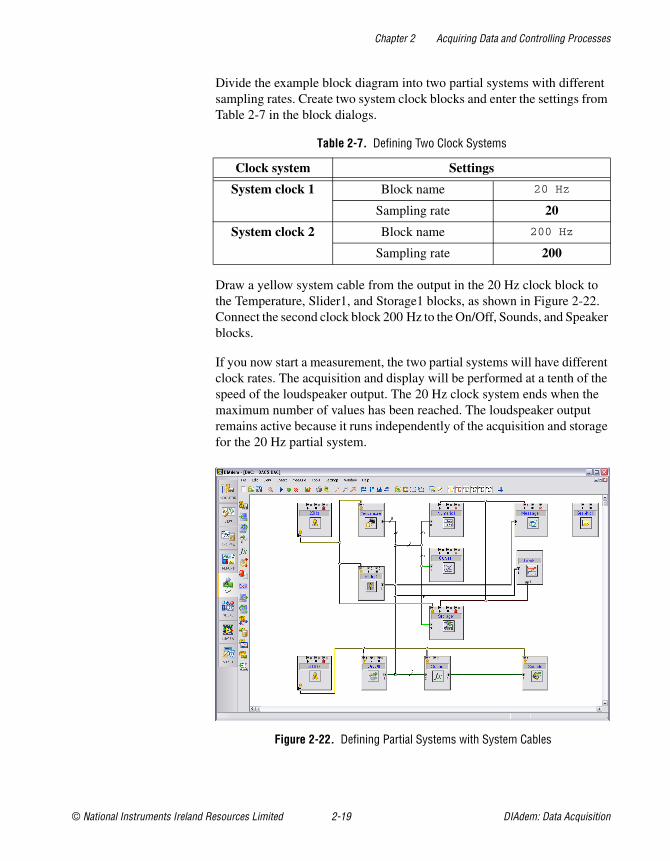
Divide the example block diagram into two partial systems with different sampling rates. Create two system clock blocks and enter the settings from Table 2-7 in the block dialogs.
Draw a yellow system cable from the output in the 20 Hz clock block to the Temperature, Slider1, and Storage1 blocks, as shown in Figure 2-22. Connect the second clock block 200 Hz to the On/Off, Sounds, and Speaker blocks.
If you now start a measurement, the two partial systems will have different clock rates. The acquisition and display will be performed at a tenth of the speed of the loudspeaker output. The 20 Hz clock system ends when the maximum number of values has been reached. The loudspeaker output remains active because it runs independently of the acquisition and storage for the 20 Hz partial system.
Figure 2-22. Defining Partial Systems with System Cables
Table 2-7. Defining Two Clock Systems
Clock system Settings
System clock 1 Block name 20 Hz
Sampling rate 20
System clock 2 Block name 200 Hz
Sampling rate 200
Chapter 2 Acquiring Data and Controlling Processes
DIAdem: Data Acquisition 2-20 ni.com
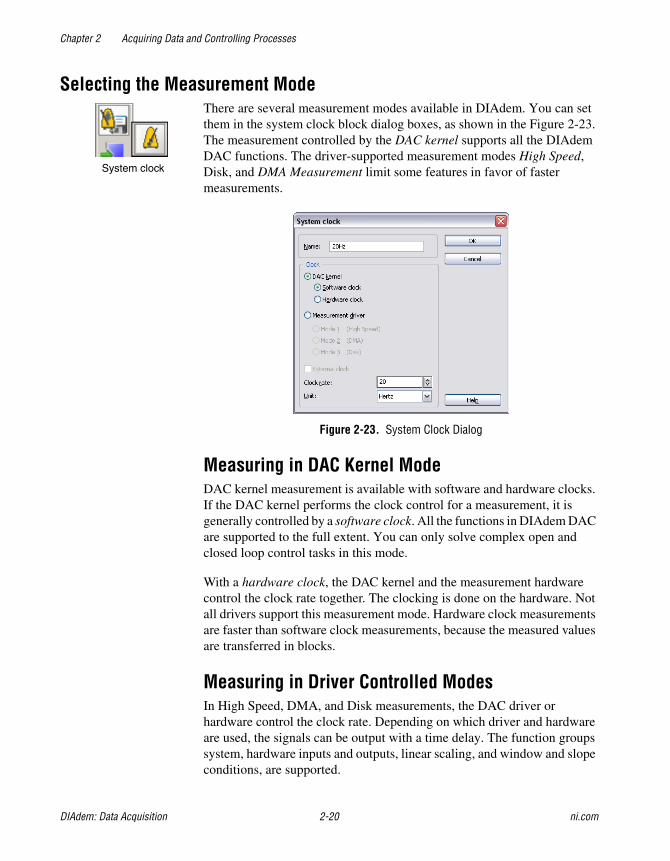
Selecting the Measurement ModeThere are several measurement modes available in DIAdem. You can set them in the system clock block dialog boxes, as shown in the Figure 2-23. The measurement controlled by the DAC kernel supports all the DIAdem DAC functions. The driver-supported measurement modes High Speed, Disk, and DMA Measurement limit some features in favor of faster measurements.
Figure 2-23. System Clock Dialog
Measuring in DAC Kernel ModeDAC kernel measurement is available with software and hardware clocks. If the DAC kernel performs the clock control for a measurement, it is generally controlled by a software clock. All the functions in DIAdem DAC are supported to the full extent. You can only solve complex open and closed loop control tasks in this mode.
With a hardware clock, the DAC kernel and the measurement hardware control the clock rate together. The clocking is done on the hardware. Not all drivers support this measurement mode. Hardware clock measurements are faster than software clock measurements, because the measured values are transferred in blocks.
Measuring in Driver Controlled ModesIn High Speed, DMA, and Disk measurements, the DAC driver or hardware control the clock rate. Depending on which driver and hardware are used, the signals can be output with a time delay. The function groups system, hardware inputs and outputs, linear scaling, and window and slope conditions, are supported.
System clock
Chapter 2 Acquiring Data and Controlling Processes
© National Instruments Ireland Resources Limited 2-21 DIAdem: Data Acquisition
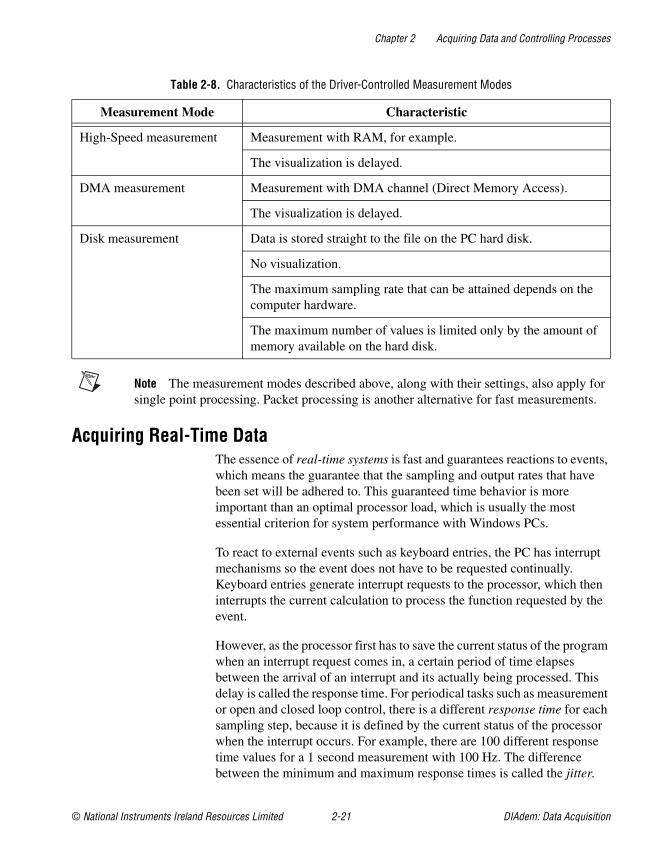
Note The measurement modes described above, along with their settings, also apply for single point processing. Packet processing is another alternative for fast measurements.
Acquiring Real-Time DataThe essence of real-time systems is fast and guarantees reactions to events, which means the guarantee that the sampling and output rates that have been set will be adhered to. This guaranteed time behavior is more important than an optimal processor load, which is usually the most essential criterion for system performance with Windows PCs.
To react to external events such as keyboard entries, the PC has interrupt mechanisms so the event does not have to be requested continually. Keyboard entries generate interrupt requests to the processor, which then interrupts the current calculation to process the function requested by the event.
However, as the processor first has to save the current status of the program when an interrupt request comes in, a certain period of time elapses between the arrival of an interrupt and its actually being processed. This delay is called the response time. For periodical tasks such as measurement or open and closed loop control, there is a different response time for each sampling step, because it is defined by the current status of the processor when the interrupt occurs. For example, there are 100 different response time values for a 1 second measurement with 100 Hz. The difference between the minimum and maximum response times is called the jitter.
Table 2-8. Characteristics of the Driver-Controlled Measurement Modes
Measurement Mode Characteristic
High-Speed measurement Measurement with RAM, for example.
The visualization is delayed.
DMA measurement Measurement with DMA channel (Direct Memory Access).
The visualization is delayed.
Disk measurement Data is stored straight to the file on the PC hard disk.
No visualization.
The maximum sampling rate that can be attained depends on the computer hardware.
The maximum number of values is limited only by the amount of memory available on the hard disk.
Chapter 2 Acquiring Data and Controlling Processes
DIAdem: Data Acquisition 2-22 ni.com
Therefore, the jitter indicates the degree of precision of the periodicity of the clock times.
The acceptable jitter size and response time depends on the particular task at hand. In visualization tasks, tests have shown that for humans, delays of up to 100 ms are still experienced as “immediate.” On the other hand, the periods between the output times have to be precise in digital closed loop control. If the controller output is to be made with 1 kHz and the periodicity error of the output time is less than 5%, the maximum valid jitter is 100 ms.
Windows is not a real-time operating system and does not enable the user to set specific reaction times for separate programs (real-time reactions).
For measurement tasks, these requirements can be met by using PC plug-in boards or external devices with their own timer components. The task is controlled by the measurement hardware, which ensures that the sampling rate is adhered to.
For open and closed loop control tasks, the acquired values have to be processed immediately, and after a specific response time, the calculated values have to be output to the process. We recommend the use of intelligent process connection hardware here. DIAdem can remove time-critical sections of control tasks to the PC plug-in board or to external systems with their own processors, so they can be processed independently of Windows.
Using the Real Time Kernel in DIAdemThe DIAdem real time kernel enables you to perform complex automation tasks using simple process connection hardware without its own processor and operating system. Sampling rate generation by DIAdem also has the advantage that several boards can be used simultaneously and synchronously. In the hardware-clocked solutions, this can only be achieved with a synchronization cable between the various hardware components.
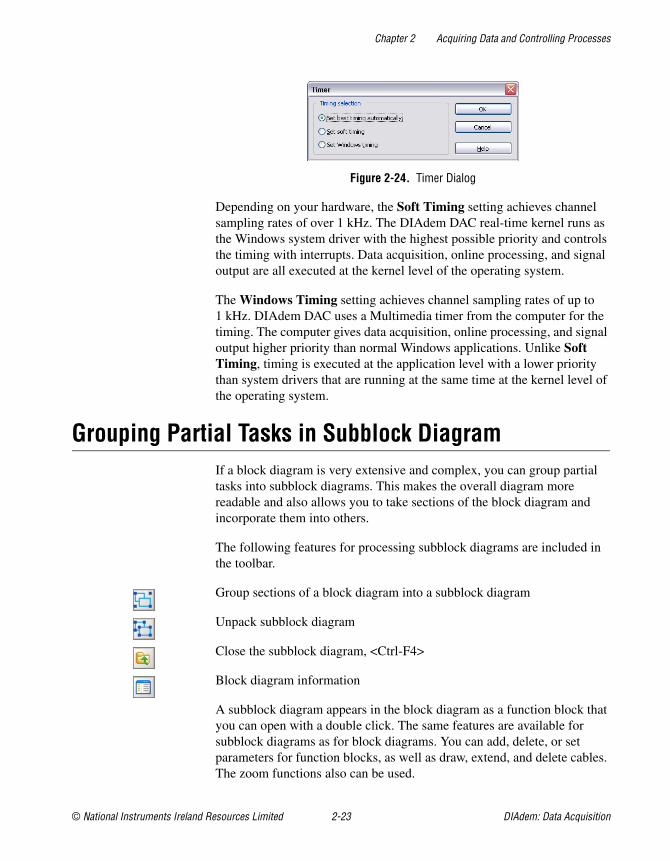
The DIAdem real time kernel can operate in different modes. You open the dialog of Figure 2-24 with Settings»Single point processing»Measurement parameters»Timer.
Chapter 2 Acquiring Data and Controlling Processes
© National Instruments Ireland Resources Limited 2-23 DIAdem: Data Acquisition
Figure 2-24. Timer Dialog
Depending on your hardware, the Soft Timing setting achieves channel sampling rates of over 1 kHz. The DIAdem DAC real-time kernel runs as the Windows system driver with the highest possible priority and controls the timing with interrupts. Data acquisition, online processing, and signal output are all executed at the kernel level of the operating system.
The Windows Timing setting achieves channel sampling rates of up to 1 kHz. DIAdem DAC uses a Multimedia timer from the computer for the timing. The computer gives data acquisition, online processing, and signal output higher priority than normal Windows applications. Unlike Soft Timing, timing is executed at the application level with a lower priority than system drivers that are running at the same time at the kernel level of the operating system.
Grouping Partial Tasks in Subblock DiagramIf a block diagram is very extensive and complex, you can group partial tasks into subblock diagrams. This makes the overall diagram more readable and also allows you to take sections of the block diagram and incorporate them into others.
The following features for processing subblock diagrams are included in the toolbar.
Group sections of a block diagram into a subblock diagram
Unpack subblock diagram
Close the subblock diagram, <Ctrl-F4>
Block diagram information
A subblock diagram appears in the block diagram as a function block that you can open with a double click. The same features are available for subblock diagrams as for block diagrams. You can add, delete, or set parameters for function blocks, as well as draw, extend, and delete cables. The zoom functions also can be used.
Chapter 2 Acquiring Data and Controlling Processes
DIAdem: Data Acquisition 2-24 ni.com
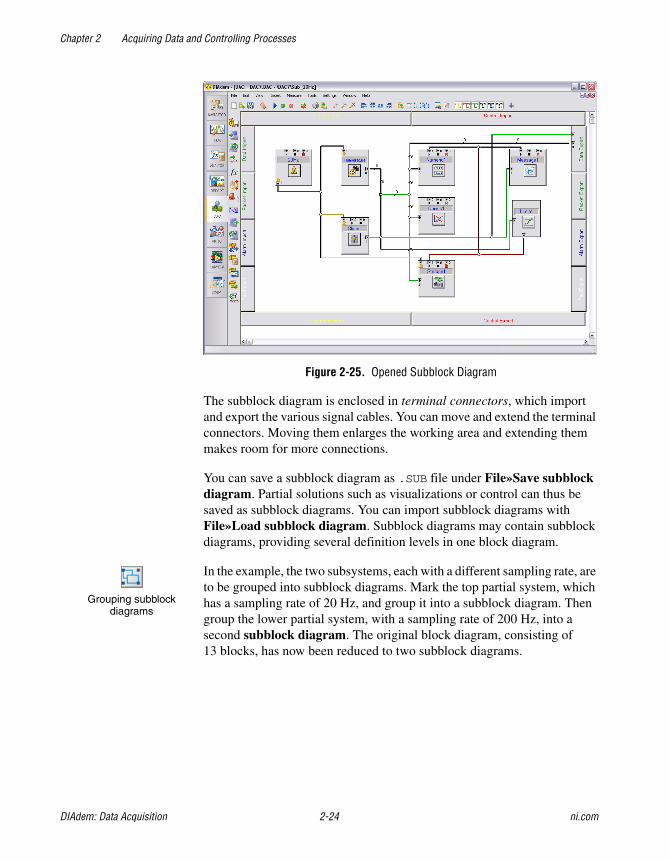
Figure 2-25. Opened Subblock Diagram
The subblock diagram is enclosed in terminal connectors, which import and export the various signal cables. You can move and extend the terminal connectors. Moving them enlarges the working area and extending them makes room for more connections.
You can save a subblock diagram as .SUB file under File»Save subblock diagram. Partial solutions such as visualizations or control can thus be saved as subblock diagrams. You can import subblock diagrams with File»Load subblock diagram. Subblock diagrams may contain subblock diagrams, providing several definition levels in one block diagram.
In the example, the two subsystems, each with a different sampling rate, are to be grouped into subblock diagrams. Mark the top partial system, which has a sampling rate of 20 Hz, and group it into a subblock diagram. Then group the lower partial system, with a sampling rate of 200 Hz, into a second subblock diagram. The original block diagram, consisting of 13 blocks, has now been reduced to two subblock diagrams.
Grouping subblock diagrams
Chapter 2 Acquiring Data and Controlling Processes
© National Instruments Ireland Resources Limited 2-25 DIAdem: Data Acquisition
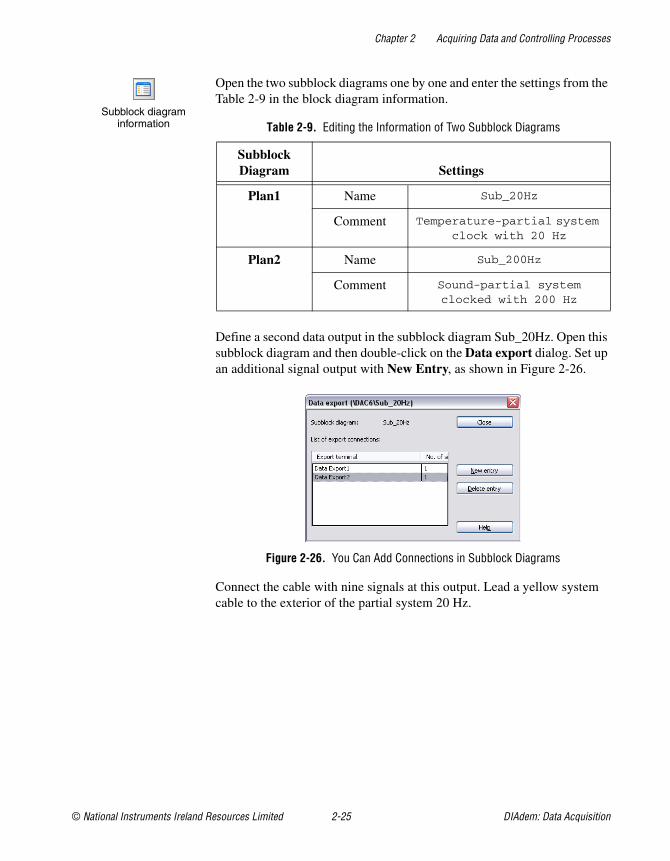
Open the two subblock diagrams one by one and enter the settings from the Table 2-9 in the block diagram information.
Define a second data output in the subblock diagram Sub_20Hz. Open this subblock diagram and then double-click on the Data export dialog. Set up an additional signal output with New Entry, as shown in Figure 2-26.
Figure 2-26. You Can Add Connections in Subblock Diagrams
Connect the cable with nine signals at this output. Lead a yellow system cable to the exterior of the partial system 20 Hz.
Table 2-9. Editing the Information of Two Subblock Diagrams
Subblock Diagram Settings
Plan1 Name Sub_20Hz
Comment Temperature-partial system clock with 20 Hz
Plan2 Name Sub_200Hz
Comment Sound-partial system clocked with 200 Hz
Subblock diagram information
Chapter 2 Acquiring Data and Controlling Processes
DIAdem: Data Acquisition 2-26 ni.com
Packet Processing for Fast Measurements and Online Processing
There are two data processing concepts in DIAdem DAC—single point processing and packet processing.
In single point processing, the data is acquired value by value. At every point in the block diagram, each value can be accessed, processed, and visualized. This allows you to combine all kinds of sampling rates easily and provides a great degree of flexibility for control tasks.
Packet processing groups values into data packets, which are forwarded to the next function block when they have attained the specified size. This is the concept of packet-oriented processing—functions only work with data packets. It decreases the amount of administration required and increases the throughput.
You can combine packet processing and single point processing in one block diagram. Decide which type of processing you use depending on your measurement task. Single point processing provides real-time features and a great degree of flexibility, and packet processing provides features for online calculation, fast data acquisition, and intelligent hardware.
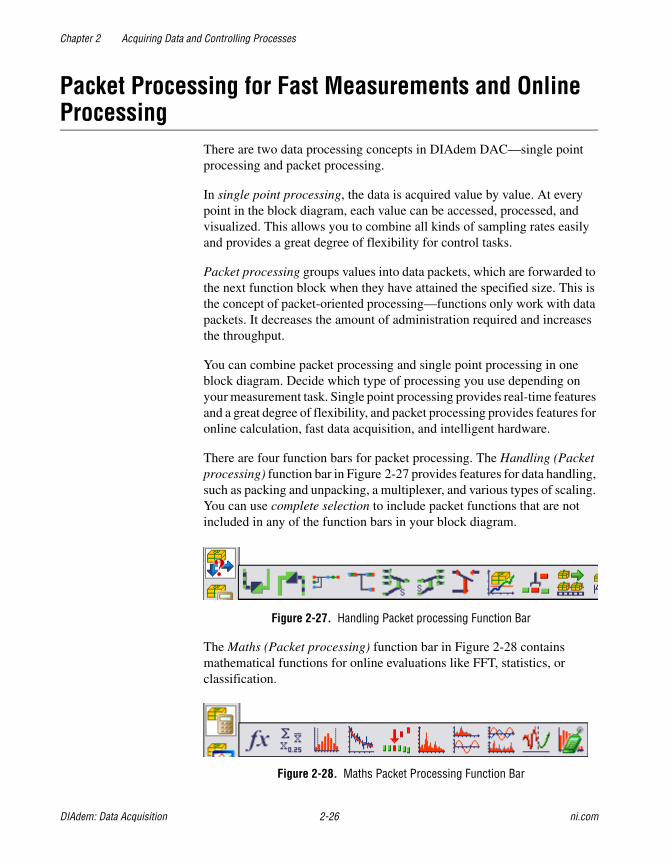
There are four function bars for packet processing. The Handling (Packet processing) function bar in Figure 2-27 provides features for data handling, such as packing and unpacking, a multiplexer, and various types of scaling. You can use complete selection to include packet functions that are not included in any of the function bars in your block diagram.
Figure 2-27. Handling Packet processing Function Bar
The Maths (Packet processing) function bar in Figure 2-28 contains mathematical functions for online evaluations like FFT, statistics, or classification.
Figure 2-28. Maths Packet Processing Function Bar
Chapter 2 Acquiring Data and Controlling Processes
© National Instruments Ireland Resources Limited 2-27 DIAdem: Data Acquisition
The Display and I/O (Packet processing) function bar in Figure 2-29 provides input and display instruments such as the oscilloscope and the voltmeter. As opposed to the instruments in single point processing, they appear as separate windows.
Figure 2-29. Display and I/O Packet processing Function Bar
The Driver (Packet processing) function bar in Figure 2-30 provides packet hardware features that you configured when you registered the hardware. Apart from intelligent hardware functions, you also can assign frequently required processing functions to the function bar in this way. Refer to Chapter 4, Using Hardware, for specific information.
Figure 2-30. Driver Packet processing Function Bar
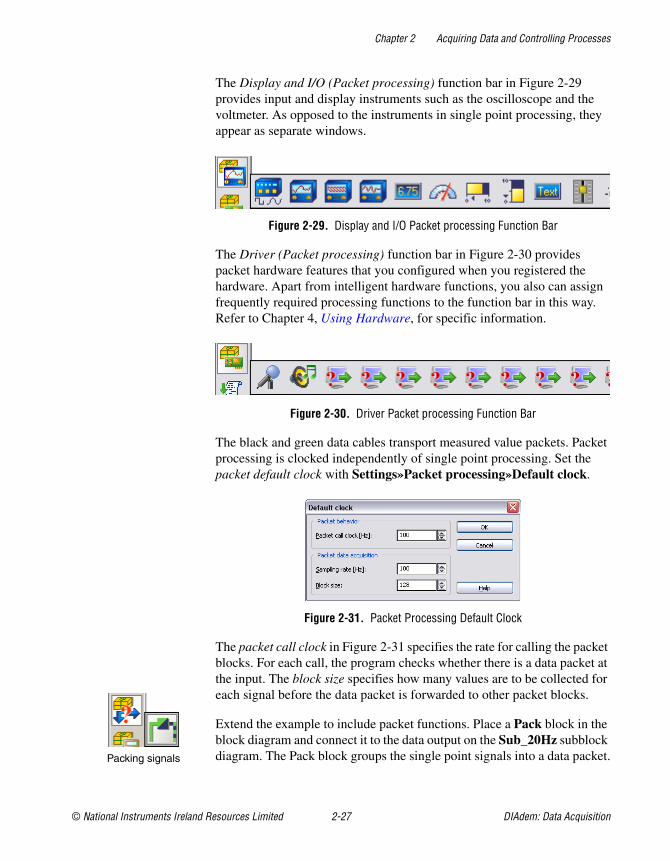
The black and green data cables transport measured value packets. Packet processing is clocked independently of single point processing. Set the packet default clock with Settings»Packet processing»Default clock.
Figure 2-31. Packet Processing Default Clock
The packet call clock in Figure 2-31 specifies the rate for calling the packet blocks. For each call, the program checks whether there is a data packet at the input. The block size specifies how many values are to be collected for each signal before the data packet is forwarded to other packet blocks.
Extend the example to include packet functions. Place a Pack block in the block diagram and connect it to the data output on the Sub_20Hz subblock diagram. The Pack block groups the single point signals into a data packet.Packing signals

Chapter 2 Acquiring Data and Controlling Processes
DIAdem: Data Acquisition 2-28 ni.com
For online classification, select a Classification mathematics block and connect it to the Pack block.
To display the classification results, select an Oscilloscope display block and connect it to the classification block. Enter the settings from Table 2-10 in the oscilloscope window menus.
Connect the clock output in the subblock diagram Sub_20Hz to the clock input of the Pack block. When you start the measurement, the oscilloscope window will appear in addition to the usual DIAdem VISUAL display, as shown in Figure 2-32. You can move the window during the measurement.
Figure 2-32. The Oscilloscope Shows the Classification as Histogram
Table 2-10. Configuring the Oscilloscope Window
Dialog Menu Settings
Diagram Normal Display Bars
Settings X-axis-scale Range Setting
0 to 20
Title Text Online classification
Options Display Options Activate title
Online classification
Oscilloscope

Chapter 2 Acquiring Data and Controlling Processes
© National Instruments Ireland Resources Limited 2-29 DIAdem: Data Acquisition
Using the Alarm and Protocol SystemWith the alarm and log system you can monitor signals for exceeding limit values. Limit values can be defined in two levels to trigger alarms with differing levels. The alarms are displayed continuously on the screen and can also be recorded and commented online. The alarm log can function as an operation report that is sent to responsible parties informing them about alarms that occur.
The alarm and protocol system uses special cables to transport alarms and protocols—alarms are transported on the blue-black alarm cables and protocols on the gray-black text cables. Signals on the green-black packet cables are monitored.
Defining AlarmsThe alarm and protocol system also allows you to confirm the exceeding of limit values. Alarms can only be confirmed by authorized users that have been granted the appropriate rights by the administrator in the DIAdem user management.
In the alarm definition, there is a distinction between static attributes, which the user specifies offline when the alarm system is configured, and dynamic attributes, which are defined during runtime. Global attributes are managed above the block level, as shown in Figure 2-33.
Figure 2-33. Alarm Definitions Contain Static and Dynamic Attributes
Alarm cables

Chapter 2 Acquiring Data and Controlling Processes
DIAdem: Data Acquisition 2-30 ni.com
The function bar for the alarm and protocol system includes the following function blocks.
Alarm generator defines alarms for each input signal
Alarm table displays current alarms and alarm confirmation
Format for the protocolled alarms
Key entry for comments
Display all alarms during monitoring, with review
Save protocol in file (.TXT, .HTM)
Transfer protocol through DDE or email (MS Outlook as OLE application)
Protocol transfer in a network
Multiplexer for alarms and texts
Log in for activated user management
Extend the example to include alarm functions. Select the Alarm generator and connect the green-black packet cable to the E input on the alarm generator. Enter the settings from Table 2-11 in the alarm generator dialog. The attributes for the marked row are edited beneath the alarm table.
Table 2-11. Configuring Conditions for Alarms
Dialog Menu Settings
New entry Channel number 1
HIHI alarm 5
LOLO alarm –5
Channel name Slider1
Alarm generator

Chapter 2 Acquiring Data and Controlling Processes
© National Instruments Ireland Resources Limited 2-31 DIAdem: Data Acquisition
Adjust the block size of the data packets to be monitored to the acquisition rate. For the alarm generator to monitor one data packet per second, reduce the packet size in the Pack block to 20.
Note If the packet size is much larger than the acquisition rate in Hertz, the alarm generator will have a considerable wait for the data packet to be monitored. If, on the other hand, the packet size is much smaller than the acquisition rate, the alarm generator will have to monitor many small data packets.
Select an alarm table and connect Input E to Output A on the alarm generator. Enter the settings from Table 2-12 in the alarm table dialog.
Select an Alarms→Texts converter block and connect it to the alarm table.
The alarms are to be recorded in two ways—displayed on the screen and stored in files.
Add a text display and a log file and connect them both to the Converter block. The gray color of the connecting cables indicates that the text level of the protocols is in use. Open the log file and enter manual.txt as the file name.
In DIAdem VISUAL, position the alarm table, the text display, and the oscilloscope one below the other on the right of the display, as shown in Figure 2-34. During the measurement you can click on the heading of the alarm table to select the attribute for sorting the alarms. If this attribute is the same for several alarms, they will be sorted in accordance with the time stamp.
Table 2-12. Configuring Column 2 of the Alarm Table
Dialog Menu Settings
Column 2 Channel name
Line related background color Priority
Alarm table
Alarm convertor
Alarm protocols

Chapter 2 Acquiring Data and Controlling Processes
DIAdem: Data Acquisition 2-32 ni.com
Figure 2-34. The Alarm Table Shows the Current Alarms and the Online Text Output for the Entire Measurement
Setting Up the User ManagementTo prevent all users from being able to confirm and perhaps oversee alarms, the administrator sets up user accounts with various rights in the user management. These user accounts are saved in the .ADM file and coded. The access rights are stored with the block diagram. When the measurement starts, DIAdem checks whether the user that is logged in has the rights required to execute the block diagram.
Only the DIAdem administrator has the rights for opening the user management by selecting Settings»User management. Table 2-13 lists the standard settings for logging. DIAdem makes no distinction between upper and lower-case letters.
Table 2-13. Administrator Login
Questions Entries
User name administrator
Password diadem
Chapter 2 Acquiring Data and Controlling Processes
© National Instruments Ireland Resources Limited 2-33 DIAdem: Data Acquisition
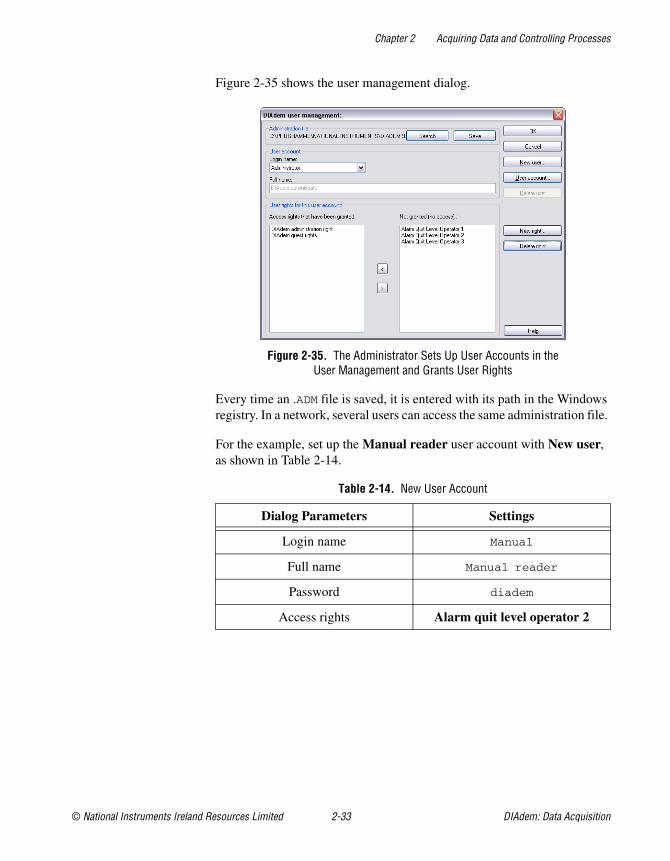
Figure 2-35 shows the user management dialog.
Figure 2-35. The Administrator Sets Up User Accounts in the User Management and Grants User Rights
Every time an .ADM file is saved, it is entered with its path in the Windows registry. In a network, several users can access the same administration file.
For the example, set up the Manual reader user account with New user, as shown in Table 2-14.
Table 2-14. New User Account
Dialog Parameters Settings
Login name Manual
Full name Manual reader
Password diadem
Access rights Alarm quit level operator 2
Chapter 2 Acquiring Data and Controlling Processes
DIAdem: Data Acquisition 2-34 ni.com
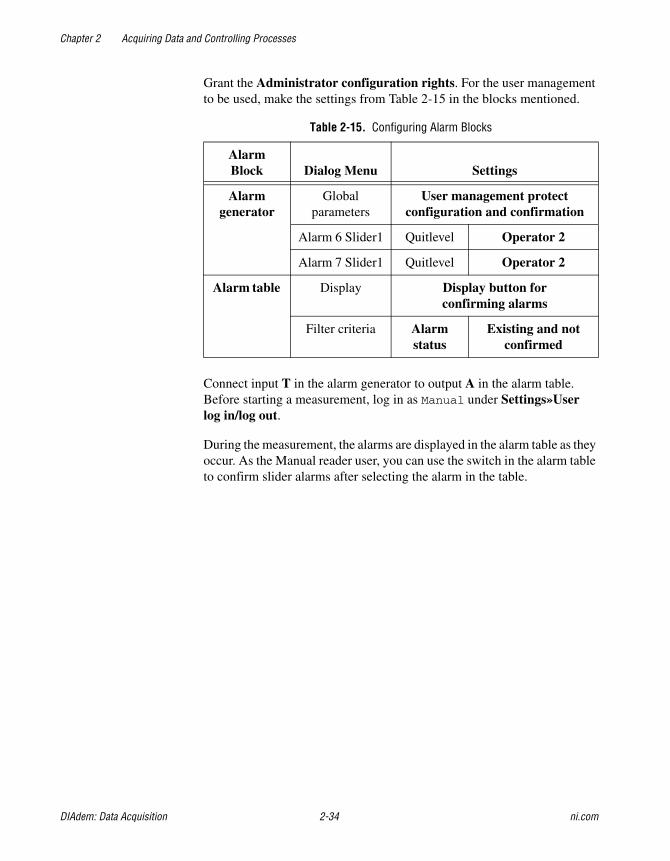
Grant the Administrator configuration rights. For the user management to be used, make the settings from Table 2-15 in the blocks mentioned.
Connect input T in the alarm generator to output A in the alarm table. Before starting a measurement, log in as Manual under Settings»User log in/log out.
During the measurement, the alarms are displayed in the alarm table as they occur. As the Manual reader user, you can use the switch in the alarm table to confirm slider alarms after selecting the alarm in the table.
Table 2-15. Configuring Alarm Blocks
Alarm Block Dialog Menu Settings
Alarm generator
Global parameters
User management protect configuration and confirmation
Alarm 6 Slider1 Quitlevel Operator 2
Alarm 7 Slider1 Quitlevel Operator 2
Alarm table Display Display button for confirming alarms
Filter criteria Alarm status
Existing and not confirmed

© National Instruments Ireland Resources Limited 3-1 DIAdem: Data Acquisition
3Visualizing and Operating
In DIAdem VISUAL, you load and run a block diagram that you have created in DIAdem DAC. In DIAdem DAC, you have defined the measurement, the control, the monitoring, and the controls and indicators. The visualization takes place in DIAdem VISUAL.
Figure 3-1. In DIAdem VISUAL, the Visualization for a Block Diagram Takes Place
The controls and indicators you have chosen in DIAdem DAC are placed into the DIAdem VISUAL workspace and adjusted in size. The grid and other alignment features in the toolbar help you to align the instruments. Alignment
Chapter 3 Visualizing and Operating
DIAdem: Data Acquisition 3-2 ni.com
Opening a Block Diagram, Starting a MeasurementIn DIAdem DAC, you choose and wire visualization blocks like all other function blocks. In DIAdem VISUAL, you design the instruments that are displayed during a measurement. All instruments in the workspace are stored in the block diagram.
This exercise assumes that the actual measurement task has been prepared and tested in DIAdem DAC. Opening DIAdem VISUAL loads the block diagram, example.dac, by default. You can modify the default settings in Settings»Options»VISUAL.
There are three icons for performing a measurement in the toolbar. The blue triangle starts a display only, the green dot starts a measurement with data storage, and the red square stops a display or a measurement.
Caution You can connect and disconnect signals only in DIAdem DAC. Do not modify the number of terminals in List length in DIAdem VISUAL. If you reduce the number of terminals, the terminals are disconnected. You can increase the number of terminals, but to rewire the terminals you have to change to the block diagram in DIAdem DAC.
Designing the VisualizationThe design of the visualization is closely related to the set-up of the block diagram. You have to decide which signals to show with which instrument, and which time frame and events are to be used. If the instruments are to be visible at the same time, position them next to each other. If they are to replace each other so the occurrence of an event can be illustrated, place them on top of each other.
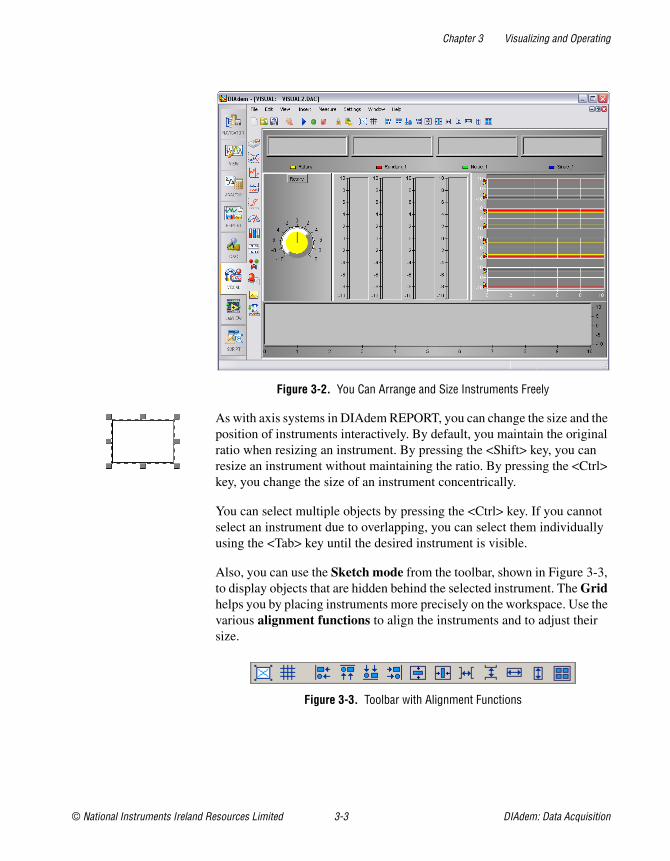
Positioning InstrumentsOpen the block diagram, visual1.dac. The necessary instruments have already been selected and wired to indicators. The instruments are placed in the workspace randomly. Delete the graphic that contains the text. Position the individual instruments as displayed in Figure 3-2 and adjust their size as needed. Do not bother with the design of the individual instruments yet.
Start and stop
Chapter 3 Visualizing and Operating
© National Instruments Ireland Resources Limited 3-3 DIAdem: Data Acquisition
Figure 3-2. You Can Arrange and Size Instruments Freely
As with axis systems in DIAdem REPORT, you can change the size and the position of instruments interactively. By default, you maintain the original ratio when resizing an instrument. By pressing the <Shift> key, you can resize an instrument without maintaining the ratio. By pressing the <Ctrl> key, you change the size of an instrument concentrically.
You can select multiple objects by pressing the <Ctrl> key. If you cannot select an instrument due to overlapping, you can select them individually using the <Tab> key until the desired instrument is visible.
Also, you can use the Sketch mode from the toolbar, shown in Figure 3-3, to display objects that are hidden behind the selected instrument. The Grid helps you by placing instruments more precisely on the workspace. Use the various alignment functions to align the instruments and to adjust their size.
Figure 3-3. Toolbar with Alignment Functions
Chapter 3 Visualizing and Operating
DIAdem: Data Acquisition 3-4 ni.com
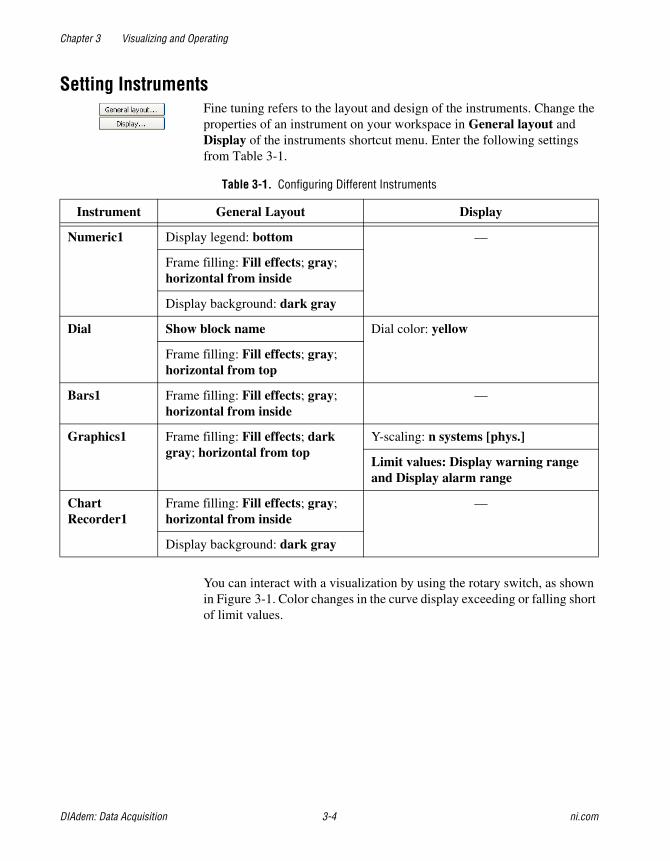
Setting InstrumentsFine tuning refers to the layout and design of the instruments. Change the properties of an instrument on your workspace in General layout and Display of the instruments shortcut menu. Enter the following settings from Table 3-1.
You can interact with a visualization by using the rotary switch, as shown in Figure 3-1. Color changes in the curve display exceeding or falling short of limit values.
Table 3-1. Configuring Different Instruments
Instrument General Layout Display
Numeric1 Display legend: bottom —
Frame filling: Fill effects; gray; horizontal from inside
Display background: dark gray
Dial Show block name Dial color: yellow
Frame filling: Fill effects; gray; horizontal from top
Bars1 Frame filling: Fill effects; gray; horizontal from inside
—
Graphics1 Frame filling: Fill effects; dark gray; horizontal from top
Y-scaling: n systems [phys.]
Limit values: Display warning range and Display alarm range
Chart Recorder1
Frame filling: Fill effects; gray; horizontal from inside
—
Display background: dark gray

Chapter 3 Visualizing and Operating
© National Instruments Ireland Resources Limited 3-5 DIAdem: Data Acquisition
Grouping InstrumentsSelecting overlapping instruments is rather difficult. To avoid this, instruments can be grouped into VISUAL pages.
Load the block diagram dac7.dac. This block diagram contains overlapping instruments and two subblock diagrams. Click the View menu. You will find 10 VISUAL pages, of which the first three are assigned. 1st page:Standard contains all instruments of a block diagram. For the two subblock diagrams, DIAdem automatically creates the VISUAL pages, Sub_20Hz and Sub_200Hz.
Uncheck 3rd page: Sub_200Hz. None of the instruments from this subblock diagram are displayed anymore. The push button for sound is no longer visible.
You can create more VISUAL pages in View»Page management. To allocate an instrument to a page, choose the page from the Page menu in General layout.
Striking VisualizationThis section briefly describes some of the tools for visualization.
Within the group Binary instruments, the Status instruments provide an important means of indicating certain conditions. In the simplest case, a binary instrument could be a lamp that changes its color depending on a given condition. When a particular status has been reached, a sound file also can be played as an acoustic warning signal.
A color matrix can be used to display the temperature distribution on a workpiece if the sensors/measurement points are arranged in a regular, rectangular grid network. The color palette defined for the range of values differentiates the size of the measured data in corresponding colors.
Containers display the filling level in the form of a bar. You can change the look of a container by choosing a different container graphic in the display menu. The clipart directory on the DIAdem CD contains various default container graphics. The containers can be used with the tubes and valves also available on the CD, along with the status display and any alarm displays for process visualization.
Status instruments
Color matrix
Container
Chapter 3 Visualizing and Operating
DIAdem: Data Acquisition 3-6 ni.com
By default, the area that represents the filling level in containers is purple (RGB values: 255,0,255). DIAdem VISUAL displays this area as transparent. You can change the settings so that a different color represents transparency.
In the Cylinder tachometer, the scale moves instead of the pointer. The 3D effect can be highlighted by using shading for the background of the display in General layout.
You can load background graphics in General layout as well as in Display. In General layout, a background graphic is used for filling. In Display, it is used for the object on top, for example, a status instrument or a container.
Tip Starting a measurement, DIAdem VISUAL displays all control elements; for example, elements like toolbar and function bar. Press <Ctrl-U> to view only the workspace. Press <Ctrl-F5> to start the measurement and press <Esc> to stop the measurement. Press <Ctrl-U> again to change the screen mode to normal view pressing. You can write a script in DIAdem SCRIPT to automate the process.
Cylinder tachometer
© National Instruments Ireland Resources Limited 4-1 DIAdem: Data Acquisition
4Using Hardware
The block diagrams that you have generated consist of simulated signals. These block diagrams are hardware-independent and can be prepared and tested on any PC.
You can use hardware in a variety of ways in DIAdem DAC. The direct way is to register a DIAdem driver for the hardware. The indirect way is to use a DIAdem interface, such as the serial interface, or to register an OPC server.
Registering and Configuring DriversThe function bars for inputs and outputs are not assigned. Measurement hardware is registered in the same way for single point processing and packet processing:
1. Installing hardware drivers
2. Registering DIAdem drivers
3. Configuring function bars for inputs and outputs
The hardware registration is saved automatically, with all the settings, in a parameter file that has the extension .par and has the same name as the desktop file.
Installing Hardware DriversHardware manufacturers provide driver libraries with their hardware. These additional files are to be installed and configured before DIAdem is started. Refer to the manufacturer’s instructions.
Assigning DIAdem DriversThe DIAdem driver links the hardware driver to DIAdem DAC. DIAdem drivers include standard drivers, which are supplied with standard DIAdem and additional drivers from the hardware manufacturer.
Unassigned Input
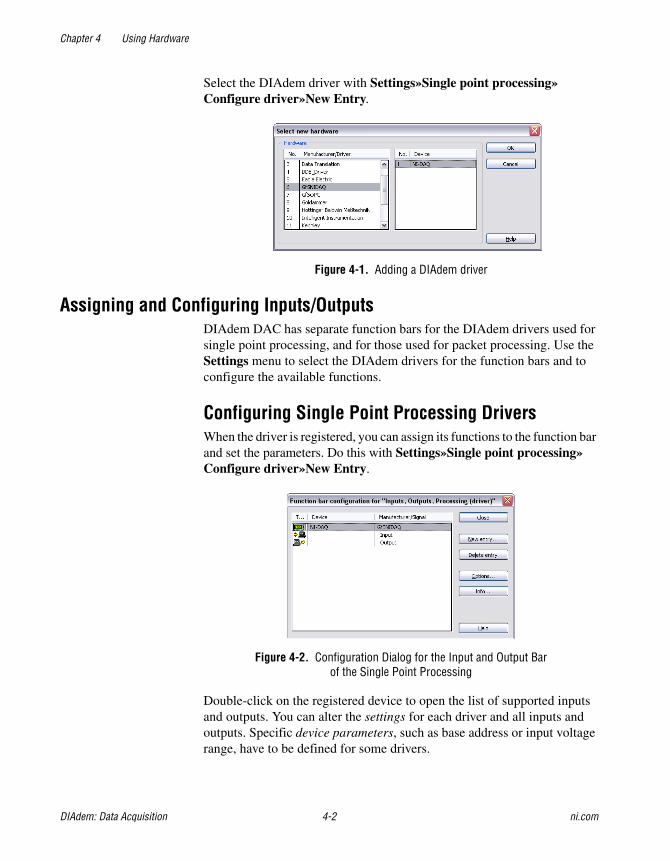
Chapter 4 Using Hardware
DIAdem: Data Acquisition 4-2 ni.com
Select the DIAdem driver with Settings»Single point processing»Configure driver»New Entry.
Figure 4-1. Adding a DIAdem driver
Assigning and Configuring Inputs/OutputsDIAdem DAC has separate function bars for the DIAdem drivers used for single point processing, and for those used for packet processing. Use the Settings menu to select the DIAdem drivers for the function bars and to configure the available functions.
Configuring Single Point Processing DriversWhen the driver is registered, you can assign its functions to the function bar and set the parameters. Do this with Settings»Single point processing»Configure driver»New Entry.
Figure 4-2. Configuration Dialog for the Input and Output Bar of the Single Point Processing
Double-click on the registered device to open the list of supported inputs and outputs. You can alter the settings for each driver and all inputs and outputs. Specific device parameters, such as base address or input voltage range, have to be defined for some drivers.
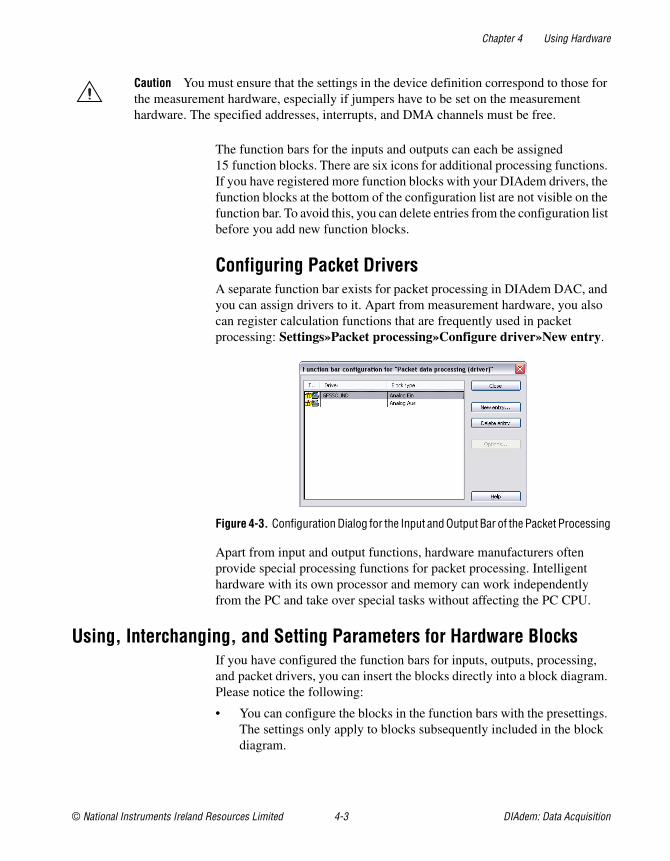
Chapter 4 Using Hardware
© National Instruments Ireland Resources Limited 4-3 DIAdem: Data Acquisition
Caution You must ensure that the settings in the device definition correspond to those for the measurement hardware, especially if jumpers have to be set on the measurement hardware. The specified addresses, interrupts, and DMA channels must be free.
The function bars for the inputs and outputs can each be assigned 15 function blocks. There are six icons for additional processing functions. If you have registered more function blocks with your DIAdem drivers, the function blocks at the bottom of the configuration list are not visible on the function bar. To avoid this, you can delete entries from the configuration list before you add new function blocks.
Configuring Packet DriversA separate function bar exists for packet processing in DIAdem DAC, and you can assign drivers to it. Apart from measurement hardware, you also can register calculation functions that are frequently used in packet processing: Settings»Packet processing»Configure driver»New entry.
Figure 4-3. Configuration Dialog for the Input and Output Bar of the Packet Processing
Apart from input and output functions, hardware manufacturers often provide special processing functions for packet processing. Intelligent hardware with its own processor and memory can work independently from the PC and take over special tasks without affecting the PC CPU.
Using, Interchanging, and Setting Parameters for Hardware BlocksIf you have configured the function bars for inputs, outputs, processing, and packet drivers, you can insert the blocks directly into a block diagram. Please notice the following:
• You can configure the blocks in the function bars with the presettings. The settings only apply to blocks subsequently included in the block diagram.
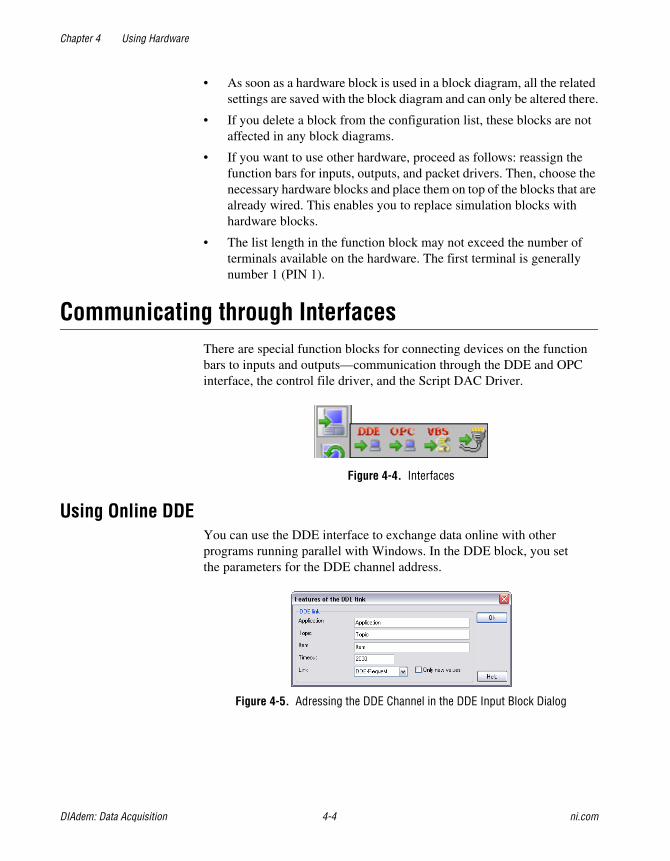
Chapter 4 Using Hardware
DIAdem: Data Acquisition 4-4 ni.com
• As soon as a hardware block is used in a block diagram, all the related settings are saved with the block diagram and can only be altered there.
• If you delete a block from the configuration list, these blocks are not affected in any block diagrams.
• If you want to use other hardware, proceed as follows: reassign the function bars for inputs, outputs, and packet drivers. Then, choose the necessary hardware blocks and place them on top of the blocks that are already wired. This enables you to replace simulation blocks with hardware blocks.
• The list length in the function block may not exceed the number of terminals available on the hardware. The first terminal is generally number 1 (PIN 1).
Communicating through InterfacesThere are special function blocks for connecting devices on the function bars to inputs and outputs—communication through the DDE and OPC interface, the control file driver, and the Script DAC Driver.
Figure 4-4. Interfaces
Using Online DDEYou can use the DDE interface to exchange data online with other programs running parallel with Windows. In the DDE block, you set the parameters for the DDE channel address.
Figure 4-5. Adressing the DDE Channel in the DDE Input Block Dialog
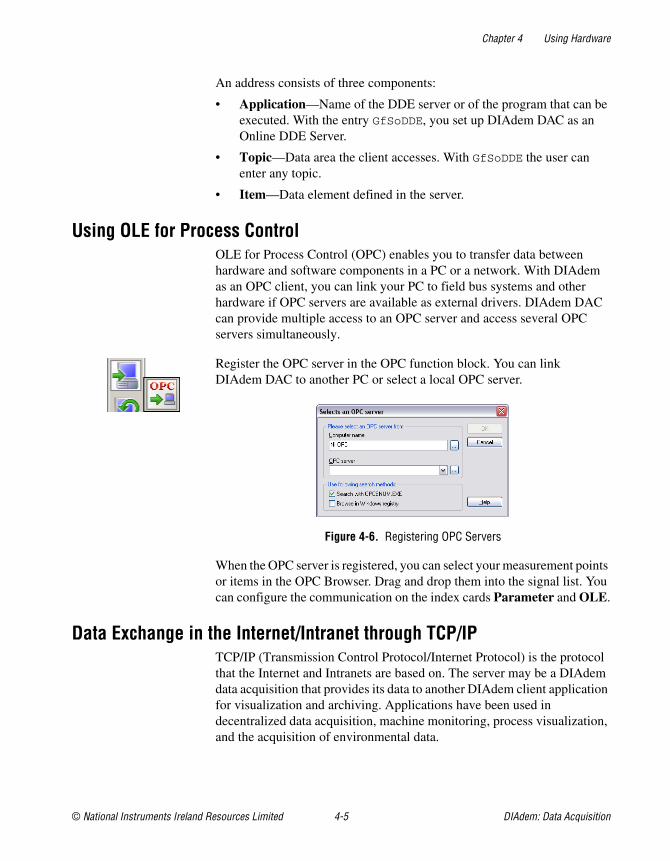
Chapter 4 Using Hardware
© National Instruments Ireland Resources Limited 4-5 DIAdem: Data Acquisition
An address consists of three components:
• Application—Name of the DDE server or of the program that can be executed. With the entry GfSoDDE, you set up DIAdem DAC as an Online DDE Server.
• Topic—Data area the client accesses. With GfSoDDE the user can enter any topic.
• Item—Data element defined in the server.
Using OLE for Process ControlOLE for Process Control (OPC) enables you to transfer data between hardware and software components in a PC or a network. With DIAdem as an OPC client, you can link your PC to field bus systems and other hardware if OPC servers are available as external drivers. DIAdem DAC can provide multiple access to an OPC server and access several OPC servers simultaneously.
Register the OPC server in the OPC function block. You can link DIAdem DAC to another PC or select a local OPC server.
Figure 4-6. Registering OPC Servers
When the OPC server is registered, you can select your measurement points or items in the OPC Browser. Drag and drop them into the signal list. You can configure the communication on the index cards Parameter and OLE.
Data Exchange in the Internet/Intranet through TCP/IPTCP/IP (Transmission Control Protocol/Internet Protocol) is the protocol that the Internet and Intranets are based on. The server may be a DIAdem data acquisition that provides its data to another DIAdem client application for visualization and archiving. Applications have been used in decentralized data acquisition, machine monitoring, process visualization, and the acquisition of environmental data.
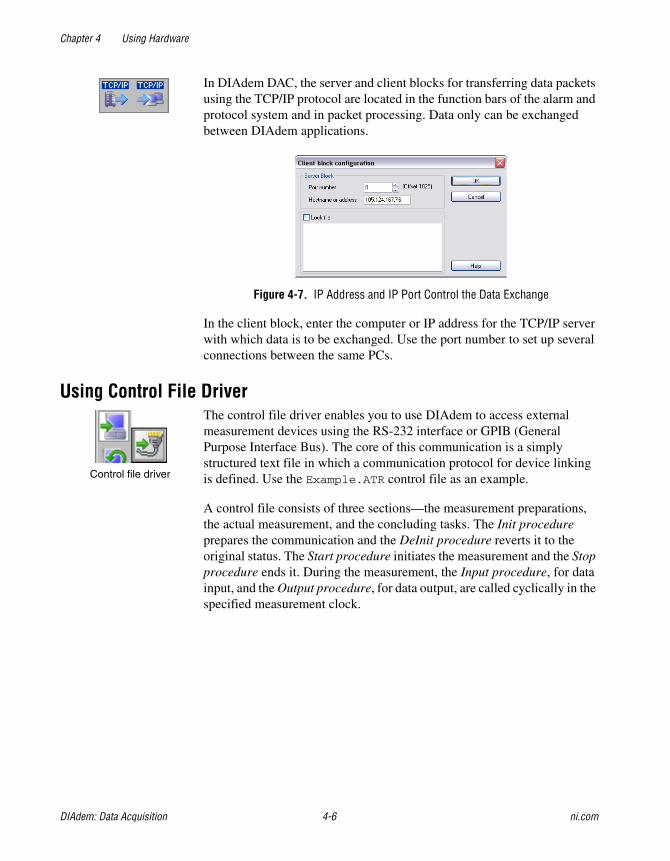
Chapter 4 Using Hardware
DIAdem: Data Acquisition 4-6 ni.com
In DIAdem DAC, the server and client blocks for transferring data packets using the TCP/IP protocol are located in the function bars of the alarm and protocol system and in packet processing. Data only can be exchanged between DIAdem applications.
Figure 4-7. IP Address and IP Port Control the Data Exchange
In the client block, enter the computer or IP address for the TCP/IP server with which data is to be exchanged. Use the port number to set up several connections between the same PCs.
Using Control File DriverThe control file driver enables you to use DIAdem to access external measurement devices using the RS-232 interface or GPIB (General Purpose Interface Bus). The core of this communication is a simply structured text file in which a communication protocol for device linking is defined. Use the Example.ATR control file as an example.
A control file consists of three sections—the measurement preparations, the actual measurement, and the concluding tasks. The Init procedure prepares the communication and the DeInit procedure reverts it to the original status. The Start procedure initiates the measurement and the Stop procedure ends it. During the measurement, the Input procedure, for data input, and the Output procedure, for data output, are called cyclically in the specified measurement clock.
Control file driver
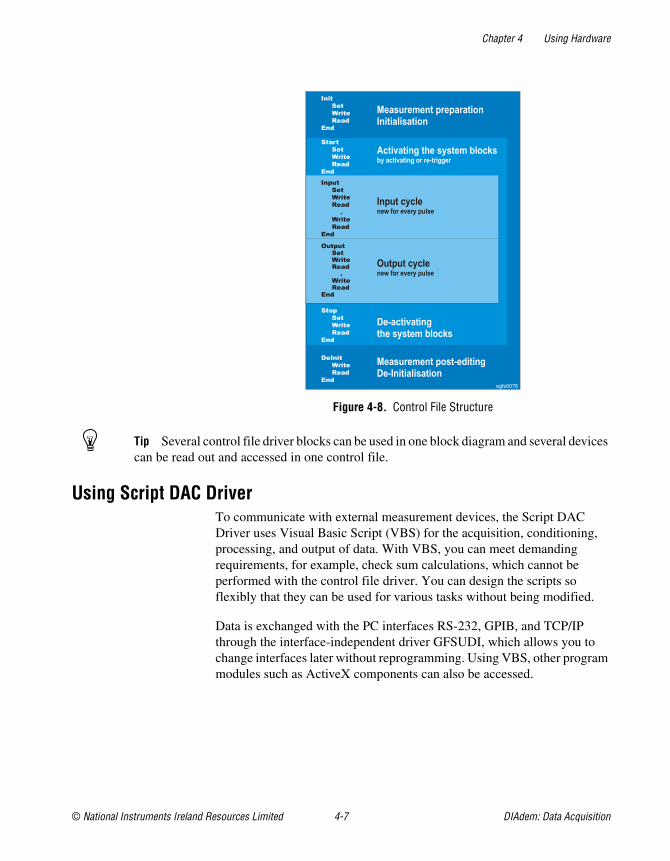
Chapter 4 Using Hardware
© National Instruments Ireland Resources Limited 4-7 DIAdem: Data Acquisition
Figure 4-8. Control File Structure
Tip Several control file driver blocks can be used in one block diagram and several devices can be read out and accessed in one control file.
Using Script DAC DriverTo communicate with external measurement devices, the Script DAC Driver uses Visual Basic Script (VBS) for the acquisition, conditioning, processing, and output of data. With VBS, you can meet demanding requirements, for example, check sum calculations, which cannot be performed with the control file driver. You can design the scripts so flexibly that they can be used for various tasks without being modified.
Data is exchanged with the PC interfaces RS-232, GPIB, and TCP/IP through the interface-independent driver GFSUDI, which allows you to change interfaces later without reprogramming. Using VBS, other program modules such as ActiveX components can also be accessed.
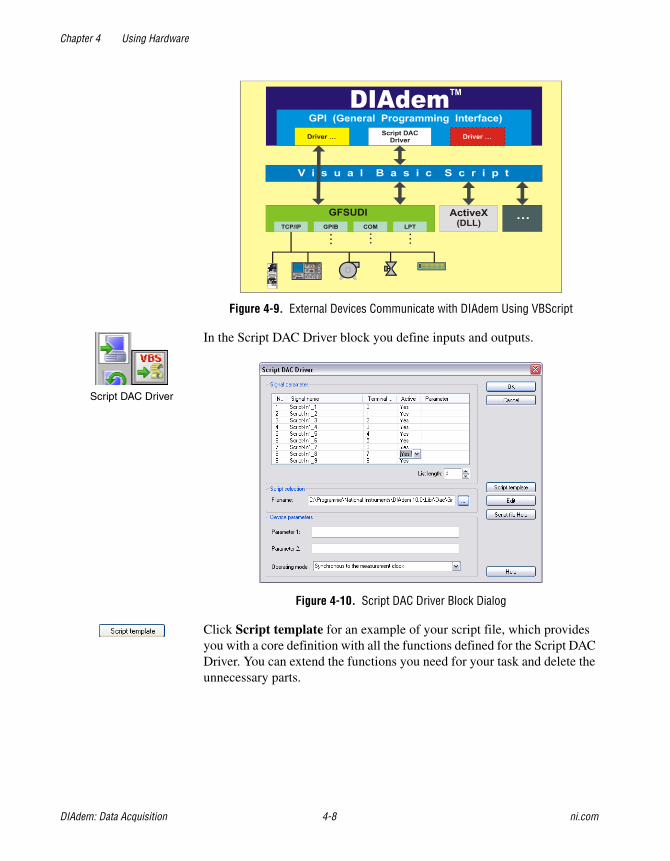
Chapter 4 Using Hardware
DIAdem: Data Acquisition 4-8 ni.com
Figure 4-9. External Devices Communicate with DIAdem Using VBScript
In the Script DAC Driver block you define inputs and outputs.
Figure 4-10. Script DAC Driver Block Dialog
Click Script template for an example of your script file, which provides you with a core definition with all the functions defined for the Script DAC Driver. You can extend the functions you need for your task and delete the unnecessary parts.
Script DAC Driver
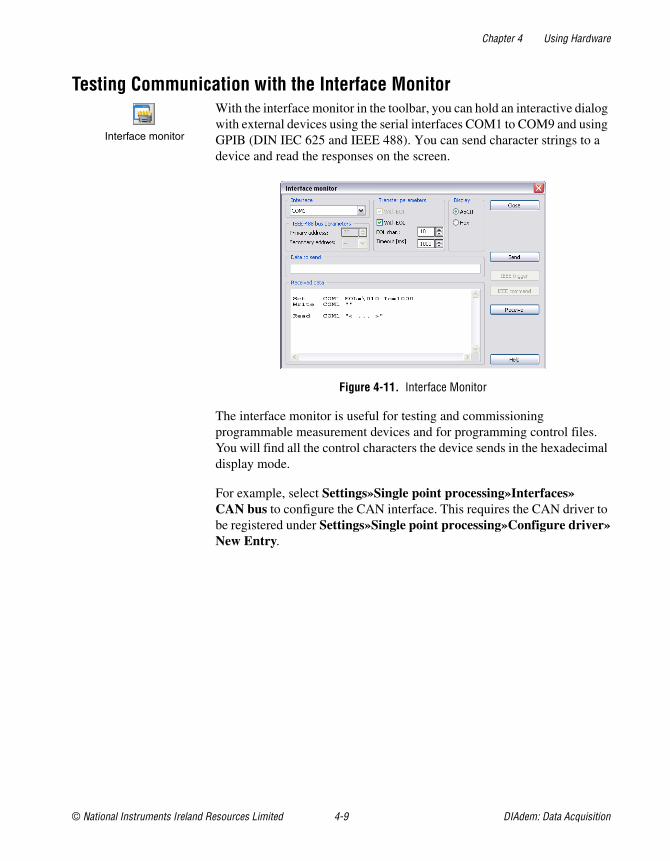
Chapter 4 Using Hardware
© National Instruments Ireland Resources Limited 4-9 DIAdem: Data Acquisition
Testing Communication with the Interface Monitor With the interface monitor in the toolbar, you can hold an interactive dialog with external devices using the serial interfaces COM1 to COM9 and using GPIB (DIN IEC 625 and IEEE 488). You can send character strings to a device and read the responses on the screen.
Figure 4-11. Interface Monitor
The interface monitor is useful for testing and commissioning programmable measurement devices and for programming control files. You will find all the control characters the device sends in the hexadecimal display mode.
For example, select Settings»Single point processing»Interfaces»CAN bus to configure the CAN interface. This requires the CAN driver to be registered under Settings»Single point processing»Configure driver»New Entry.
Interface monitor
© National Instruments Ireland Resources Limited A-1 DIAdem: Data Acquisition
ATechnical Support and Professional Services
Visit the following sections of the National Instruments Web site at ni.com for technical support and professional services:
• Support—Online technical support resources at ni.com/support include the following:
– Self-Help Resources—For answers and solutions, visit the award-winning National Instruments Web site for software drivers and updates, a searchable KnowledgeBase, product manuals, step-by-step troubleshooting wizards, thousands of example programs, tutorials, application notes, instrument drivers, and so on.
– Free Technical Support—All registered users receive free Basic Service, which includes access to hundreds of Application Engineers worldwide in the NI Developer Exchange at ni.com/exchange. National Instruments Application Engineers make sure every question receives an answer.
For information about other technical support options in your area, visit ni.com/services or contact your local office at ni.com/contact.
• Training and Certification—Visit ni.com/training for self-paced training, eLearning virtual classrooms, interactive CDs, and Certification program information. You also can register for instructor-led, hands-on courses at locations around the world.
• System Integration—If you have time constraints, limited in-house technical resources, or other project challenges, National Instruments Alliance Partner members can help. To learn more, call your local NI office or visit ni.com/alliance.
If you searched ni.com and could not find the answers you need, contact your local office or NI corporate headquarters. Phone numbers for our worldwide offices are listed at the front of this manual. You also can visit the Worldwide Offices section of ni.com/niglobal to access the branch office Web sites, which provide up-to-date contact information, support phone numbers, email addresses, and current events.
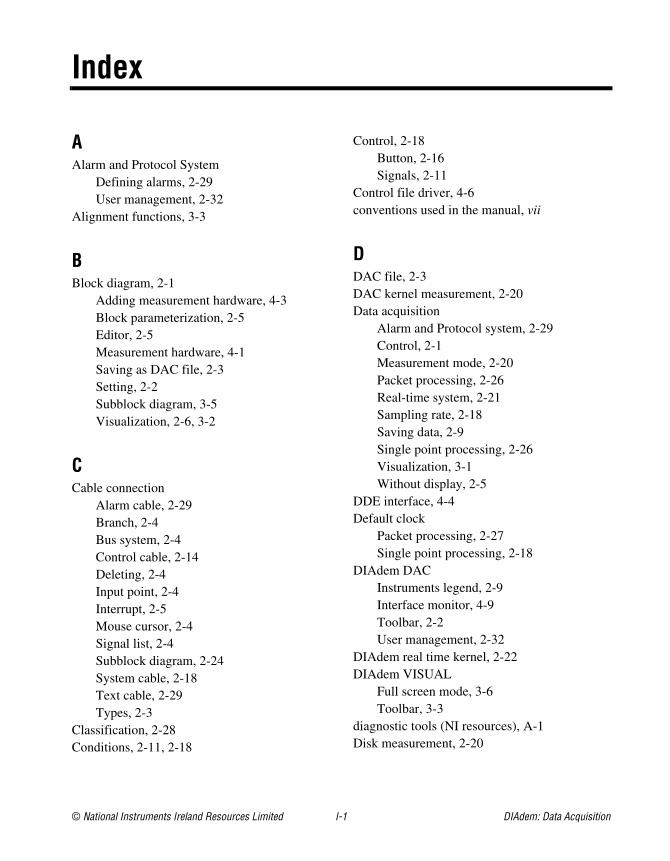
© National Instruments Ireland Resources Limited I-1 DIAdem: Data Acquisition
Index
AAlarm and Protocol System
Defining alarms, 2-29User management, 2-32
Alignment functions, 3-3
BBlock diagram, 2-1
Adding measurement hardware, 4-3Block parameterization, 2-5Editor, 2-5Measurement hardware, 4-1Saving as DAC file, 2-3Setting, 2-2Subblock diagram, 3-5Visualization, 2-6, 3-2
CCable connection
Alarm cable, 2-29Branch, 2-4Bus system, 2-4Control cable, 2-14Deleting, 2-4Input point, 2-4Interrupt, 2-5Mouse cursor, 2-4Signal list, 2-4Subblock diagram, 2-24System cable, 2-18Text cable, 2-29Types, 2-3
Classification, 2-28Conditions, 2-11, 2-18
Control, 2-18Button, 2-16Signals, 2-11
Control file driver, 4-6conventions used in the manual, vii
DDAC file, 2-3DAC kernel measurement, 2-20Data acquisition
Alarm and Protocol system, 2-29Control, 2-1Measurement mode, 2-20Packet processing, 2-26Real-time system, 2-21Sampling rate, 2-18Saving data, 2-9Single point processing, 2-26Visualization, 3-1Without display, 2-5
DDE interface, 4-4Default clock
Packet processing, 2-27Single point processing, 2-18
DIAdem DACInstruments legend, 2-9Interface monitor, 4-9Toolbar, 2-2User management, 2-32
DIAdem real time kernel, 2-22DIAdem VISUAL
Full screen mode, 3-6Toolbar, 3-3
diagnostic tools (NI resources), A-1Disk measurement, 2-20

Index
DIAdem: Data Acquisition I-2 ni.com
Display, 2-5Alarm protocols, 2-31Color matrix, 3-5Containers, 3-5Cylinder tachometer, 3-6DIAdem VISUAL, 3-1Function blocks, 3-2Instruments, 3-2Message, 2-13Packet processing, 2-27Screen mode, 3-6Status instruments, 3-5
DMA measurement, 2-20documentation
conventions used in manual, viiNI resources, A-1related documentation, viii
Driver controlled measurement, 2-20drivers (NI resources), A-1
Eexamples (NI resources), A-1
FFormula, 2-15, 2-18Full-screen mode, 3-6Function blocks, 2-1
Alarm and protocol system, 2-30Cable connection, 2-3Combining single point and packet
blocks, 2-27Connect/disconnect signals, 2-7Control, 2-11DDE, 4-4Deactivating signals, 2-7Display, 2-5, 3-2Graphic, 2-7Input/Output connections, 2-3Interchange, 4-3
Interfaces, 4-4Loudspeaker, 2-17Message, 2-13OPC, 4-5Packet processing, 2-26Processing, 2-15Saving data, 2-9Scaling, 2-15Setting a block diagram, 2-2Simulation input, 2-5Simulation output, 2-15Slider, 2-11Subblock diagram, 2-23System, 2-18TCP/IP, 4-5
GGPIB, 4-6
HHardware
Defining, 4-1DIAdem driver, 4-1GPI DLL registry, 4-1Manufacturer driver, 4-1Packet processing, 4-3Single point processing, 4-2
help, technical support, A-1High Speed measurement, 2-20
IIllustration, 2-7instrument drivers (NI resources), A-1Instruments
Background graphics, 3-6Color matrix, 3-5Container, 3-5Cylinder tachometer, 3-6
Index
© National Instruments Ireland Resources Limited I-3 DIAdem: Data Acquisition
General layout and display, 3-4Settings, 3-2Status, 3-5
InterfacesControl file driver, 4-6DDE, 4-4GPIB, 4-6Interface monitor, 4-9OPC, 4-5Script DAC Driver, 4-7TCP/IP, 4-5
KKnowledgeBase, A-1
LLegend, 2-9Limits monitoring, 2-11Loudspeaker, 2-17
MMeasurement mode
DAC kernel, 2-20Driver controlled, 2-20
Measurement task, 2-3Message display, 2-13
NNational Instruments support
and services, A-1
OOnline DDE, 4-4Online mathematics, 2-28OPC interface, 4-5Oscilloscope, 2-27
PPacket processing, 2-26
Default clock, 2-27Display, 2-27Hardware, 4-3
Partial systems, 2-18, 2-23Processing, 2-15Processing formulas, 2-15programming examples (NI resources), A-1
RReading data files, 2-5Real-time system, 2-21
DIAdem real time kernel, 2-22Jitter, 2-21
related documentation, viiiRS-232, 4-6
SSampling rate, 2-18
Packet processing, 2-27Saving data, 2-9, 2-10Scaling
Multi-point, 2-15Pt100 linearization, 2-15Thermolinearization, 2-15
Screen mode, 3-6Script DAC Driver, 2-15, 4-7Settings
Block diagram editor, 2-5Measurement kernel, 2-5
SignalsConnect/disconnect, 2-7Control, 2-11Enable/Disable, 2-7Hardware, 2-5List, 2-4, 2-7Measurement hardware input, 4-1

Index
DIAdem: Data Acquisition I-4 ni.com
Simulated, 2-5Simulation, 2-5Simulation output, 2-15
Single point processing, 2-26Default clock, 2-18Hardware, 4-2
Slider, 2-11software (NI resources), A-1Subblock diagram, 2-23, 3-5support
technical, A-1System blocks, 2-18System clock
Partial systems, 2-18Selecting measurement mode, 2-20
TTCP/IP interface, 4-5technical support, A-1Timing
Soft Timing, 2-23Windows Timing, 2-23
Timing, DIAdem real time kernel, 2-22Toolbar
DIAdem DAC, 2-2DIAdem VISUAL, 3-3
training and certification (NI resources), A-1troubleshooting (NI resources), A-1
UUser management, 2-32
VVisualization, 2-5, 3-1
Block diagram, 2-6Voltmeter, 2-27
WWeb resources, A-1