Embed Size (px)
Citation preview

ARCHIVE:
PLEASE DO NOT DESTROY
Institute ofHydrology
Natural Environment Research Council

á

Conunission of the European Communities
STORMS, FLOODS AND
RADAR HYDROLOGY
Annual Report January to December 1993
Contract No. EV5V-CT92-0182
Institute of HydrologyMaclean BuildingCrowmarsh GiffordWall ingfordOxon OXIO 8BBUK
Natural Environment Research Council
Tel: +44{0)491-838800Fax: +44-(0)491-832256Telex: 849365 Hydro] G January 1994

á

Contents
Participant Page
01 Institute of Hydrology, UK
02 University of Lancaster. UK
03 University of Salford, UK
04 UMIST, UK
05 Agricultural University, Wageningen, Netherlands
06 DGRN, Portugal
07 University of Padova, Italy
08 National Technical University of Athens, Greece
09 University of Hannover, Germany
12 IMG, France
13 LCPC, France
14 University of Ljublyana, Slovenia

á

Institution: Institute of Hydrology, United Kingdom
Project Leader: Robert J. Moore
Institutions coo eratin : National Rivers AuthorityMinistry of Agriculture, Fisheries and Food
Title of ro'e t: STORMS, FLOODS AND RADAR HYDROLOGY
MAIN OBJECTIVES
The main objectives of the Institute of Hydrology programme are as follows:
Use of a dense raingauge network and radar to quantify the rainfall fieldstructure andto assess the accuracy of point and areal average rainfall estimates;
Exploration of high resolution rainfall estimation and forecasting methods that arephysically-based and incorporate consideration of the vertical profile of radarreflectivity;
Development and assessment of distributed flood forecasting models based on theradar grid and utilising digital terrain, satellite land-use and soil surveydata;
Assessment of Doppler/dual polarisation radar for hydrological use; and
Use of radar data for design flood estimation and sub-grid rainfall parameter-isationfor large-scale hydroclimatological modelsused in flood-impact assessmentof climatechange.
METHODS AND MATERIALS
The Project will develop and use the HYREX (HYdrological Radar EXperiment)infrastructure centred on the Brue catchment in Somerset, South-west England. This willcomprise a network of 52 recording raingauges over the 132 km' catchment gauged atLovington and scanned by 3 radars: a new Doppler C-band radar at Cobbacombe Cross, aconventional C-band radar at Wardon Hill and an experimental Doppler dual-polarisation S-band radar at Chilbolton (Figure 1). A mobile vertical-pointing X-band radii-will also bedeployed by the University of Salford group within the catchment. Climate data from anAutomatic Weather Station in the catchment will be complemented by more wide-rangingdataon climate and upper air soundings from an existing network of synoptic observingstations.Additional data from the Thames basin, north-west England and south Waleswill be used tosupport the distributed flood forecasting model and design/impact assessmentcomponents ofthe project.
RESULTS
HYREX Network Design and Implementation
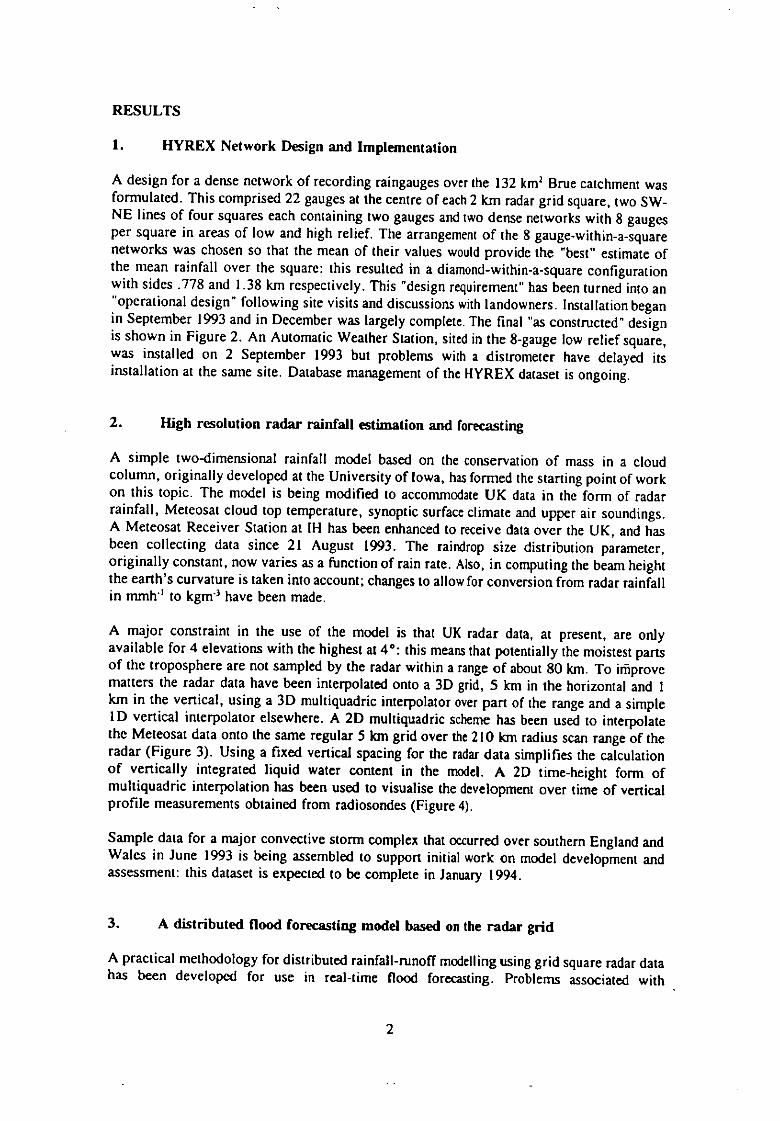
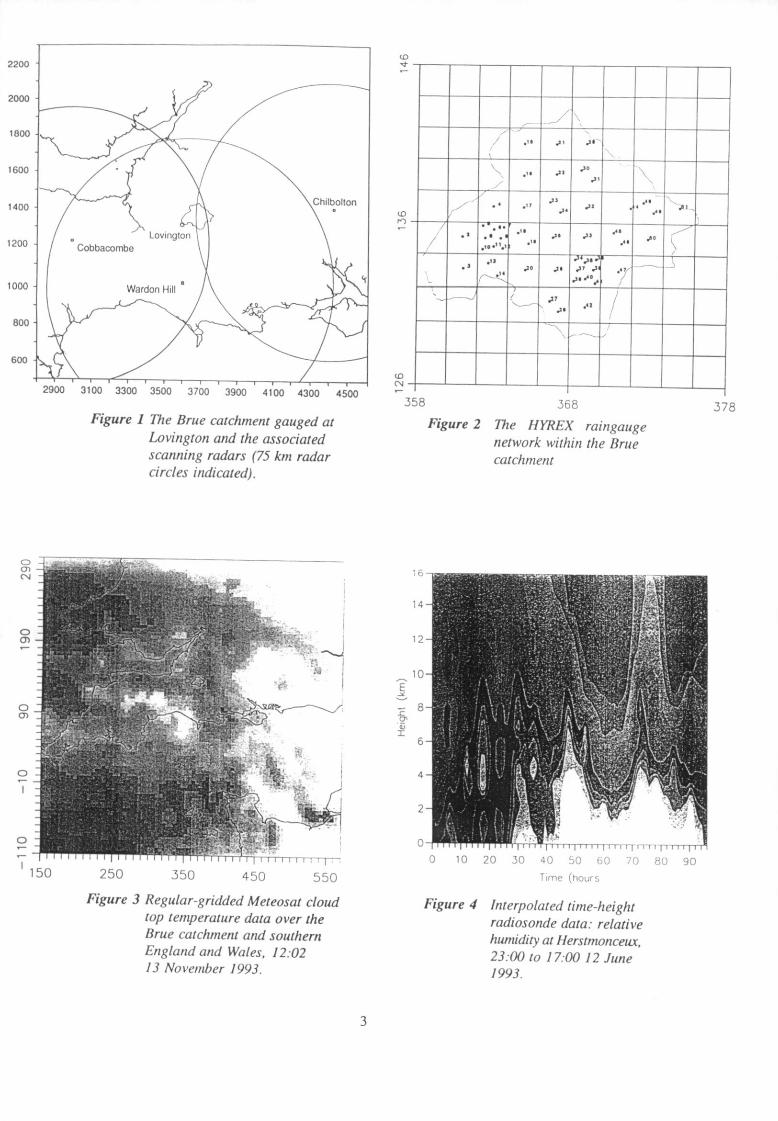
A design for a dense network of recording raingauges over the 132 km1Brue catchment wasformulated. This comprised 22 gauges at the centre of each2 km radar grid square, two SW-NE lines of four squares each containing two gauges and two dense networks with 8 gaugesper square in areas of low and high relief. The arrangement of the 8 gauge-within-a-squarenetworks was chosen so that the mean of their values wouldprovide the "best" estimate ofthe mean rainfall over the square: this resulted in a diamond-within-a-square configurationwith sidcs .778 and 1.38 km respectively. This "design requirement" has been turned into an"operational design" following site visits and discussions withlandowners. Installation beganin September 1993 and in December was largely complete. The final "as constructed" designis shown in Figure 2. An Automatic Weather Station, sited in the 8-gauge low relief square,was installed on 2 September 1993 but problems with a distrometer have delayed itsinstallation at the same site. Database management of the HYREX dataset is ongoing.
High resolution radar rainfall estimation and forecasting
A simple two-dimensional rainfall model based on the conservation of mass in a cloudcolumn, originally developed at the University of Iowa, hasformed the starting point of workon this topic. The model is being modified to accommodateUK data in the form of radarrainfall, Meteosat cloud top temperature, synoptic surface climate and upper air soundings.A Meteosat Receiver Station at IH has been enhanced to receive data over the UK, and hasbeen collecting data since 21 August 1993. The raindrop size distribution parameter,originally constant, now varies as a function of rain rate. Also, in computing the beam heightthe earth's curvature is taken into account; changes to allowfor conversion from radar rainfallin mmli' to kgma have been made.
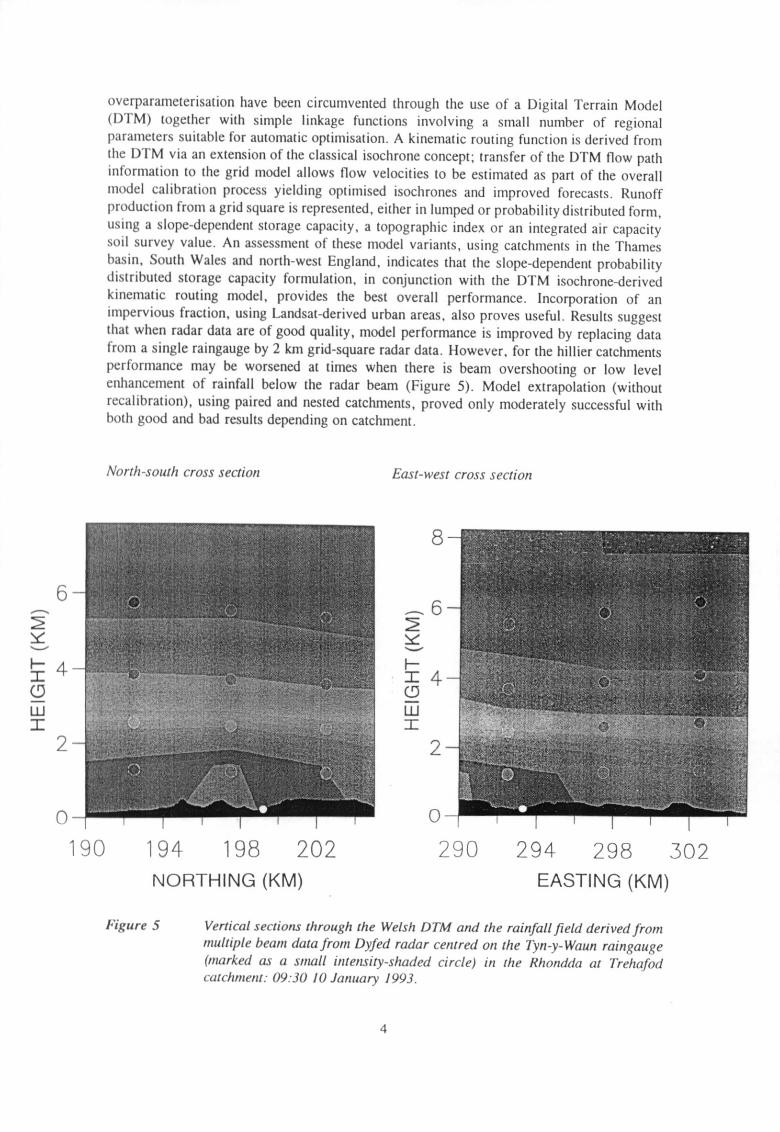
A major constraint in the use of the model is that UK radar data, at present, are onlyavailable for 4 elevations with the highest at 4°: this meansthat potentially the moistest partsof the troposphere are not sampled by the radar within a range of about 80 km. To iriiprovematters the radar data have been interpolated onto a 3D grid, 5 km in the horizontal and 1km in the vertical, using a 3D multiquadric interpolator overpart of the range and a simpleID vertical interpolator elsewhere. A 2D multiquadric scheme has been used to interpolatethe Meteosat data onto the same regular 5 km grid over the210 km radius scan range of theradar (Figure 3). Using a fixed vertical spacing for the radardata simplifies the calculationof vertically integrated liquid water content in the model. A 2D time-height form ofmultiquadric interpolation has been used to visualise the development over time of verticalprofile measurements obtained from radiosondes (Figure 4).
Sample data for a major convective storm complex that occurred over southern England andWales in June 1993 is being assembled to support initial work on model development andassessment: this dataset is expected to be complete in January 1994.
A distributed flood forecasting model based on the radar grid
A practical methodology for distributed rainfall-runoff modellingusing grid square radar data has been developed for use in real-time flood forecasting. Problems associated with
2
11
a '
•. ,;1 '" .31_
3 JO1 .2. .1/ .31." H '421
Figure 2 The IITREX raingauge
network within the Brae
catchment
2200
2000
1800
I 600
Clot Solion1400
5 ,gto„
1200 Cobbacornhe
1000 Wardon 11,11„
'800
600
- 1 -r
2900 3100 3300 3500 3700 3900 4100 4300 4500
Figure 1 The Brue catchment gauged at
Lovington and the associatedsamning radars (75 km radar
circles indicated).
CJI (N
II
2
150 250
Figure 3 Regular-gridded Meteosat cloudtop temperature data over theBrue mtchment and southernEngland and Wales, 12:0213 November 1993.
Figure 4 Interpolated time-height
radiosonde data: relativehumidity at Herstmonceux,
23:00 to 1700 12 June
/ 993.
3
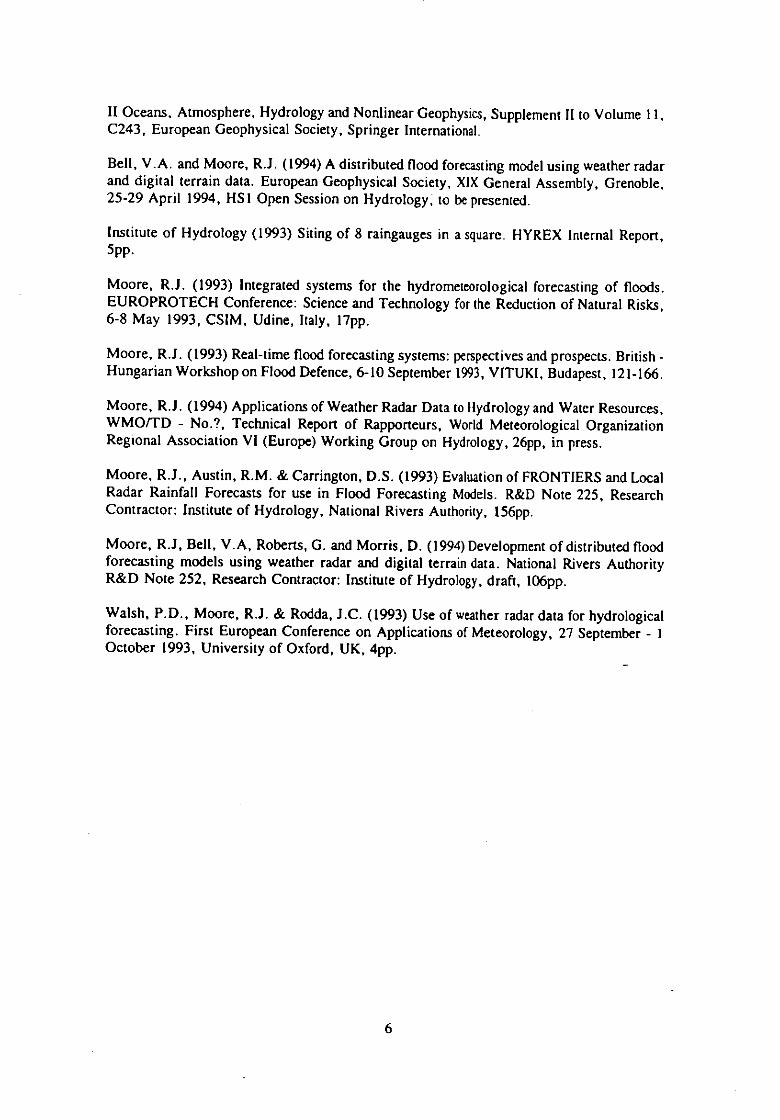
overparameterisation have been circumvented through the use of a Digital Terrain Model(DTM) together with simple linkage functions involving a small number of regionalparameters suitable for automatic optimisation. A kinematic rowing function is derived fromthe DTM via an extension of the classical isochrone concept; transfer of the DTM flow pathinformation to the grid model allows flow velocities to be estimated as part of the overallmodel calibration process yielding optimised isochrones and improved forecasts. Runoffproduction from a grid square is represented, either in lumped or probability distributed form,using a slope-dependent storage capacity, a topographic index or an integrated air capacitysoil survey value. An assessment of these model variants, using catchments in the Thamesbasin, South Wales and north-west England, indicates that the slope-dependent probabilitydistributed storage capacity formulation, in conjunction with the DTM isochrone-derivedkinematic routing model, provides the best overall performance. Incorporation of animpervious fraction, using Landsat-derived urban areas, also proves useful. Results suggestthat when radar data are of good quality, model performance is improved by replacing datafrom a single raingauge by 2 km grid-square radar data. However, for the hillier catchmentsperformance may be worsened at times when there is beam overshooting or low levelenhancement of rainfall below the radar beam (Figure 5). Model extrapolation (withoutrecalibration), using paired and nested catchments, proved only moderately successful withhoth good and bad results depending on catchment.
North-south cross section East-west cross section
8
,62
F-4
CD
2
(-) 0
190 194 198 202 290 294 298 302NORTHING (KM) EASTING (KM)
Figure 5 Vertical sections through the Welsh DTM and the rainfall field derived frommultiple beam data from Dyfed radar centred on the Tyn-y-Waun raingauge(marked as a small intensity-shaded circle) in the Rhondda at Trehafodcatchment: 09:30 10 January 1993.
4

4. Sub-grid rainfall parameterisation for large-scale hydroclimatologicalmodels
A major problem with global climate and continental-scale hydroclimatological models is thechoice of parameterisation of rainfall variability at the sub-grid scale. If a lumpedparameterisation is assumed this suppresses locally more extreme rainfall intensities andresults in less flood runoff being generated within the grid. Radar data, together with satellitedata, may be used to suggest appropriate parameterisations of rainfall at the sub-grid scale.In this project 2 km radar data from the London Weather Radar have been analysed at avariety of aggregation levels, in both space and time, focusing on the form of the probabilitydistribution function (pdf) of rainfall at each level. The following distributions have beenconsidered: exponential, lognormal, gamma, generalised Pareto and normal. The resultssuggest that a generalised Pareto distribution is most appropriate across a range of scales(2.4,8,10,20 km in space; 0,.25,.5,1,2,6,12,24 hours in time), with parameters a and 13inthe pdf
fir) = 1 - —I I fixI
increasing with increasing time and space scales.
CONCLUSIONS AND ADDITIONAL REMARKS
An inaugural meeting of the CEC Radar Hydrology Group was convened atWallingford in March 1994.
The first year of the project has seen the design and implementation of the HYREXraingauge network over the Brue catchment and initiation of the data collection phase.
A model and database infrastructure has been built up to support work on highresolution rainfall forecasting using a physically-based model. The first model resultsshould be obtained in the first quarter of 1994. A Special Interest meeting- of theRadar Hydrology group in Barcelona provided an opportunity to exchange views onthis topic with other CEC partners.
Work on a distributed rainfall-runoff model based on the radar grid and a DTM, hasseen new model variants developed, and assessed using data from three radars. Goodresults are obtained when radar performance is unaffected by beam overshooting orlow level enhancement of rainfall below the radar beam.
Radar data have been used to investigate how rainfall variability within a large-scalemodel grid varies with space and time scale, and can suggest appropriateparameterisations of rainfall to use in global climate and hydroclimatological modelsto obtain improved runoff estimates.
REFERENCES
Austin, R.M., Hotchkiss, D.S. & Moore, R.J. (1993) Improvements in flood warning using radar-derived rainfall forecasts as input to rainfall-runoff models. Annales Geophysicae, Part
a Of
5
II Oceans, Atmosphere, Hydrology and Nonlinear Geophysics,Supplement II to Volume 11,C243, European Geophysical Society, Springer International.
Bell, V.A. and Moore, R.J. (1994) A distributed flood forecastingmodel using weather radarand digital terrain data. European Geophysical Society, XIX General Assembly, Grenoble,25-29 April 1994, HSI Open Session on Hydrology, to bepresented.
Institute of Hydrology (1993) Siting of 8 raingauges in a square. HYREX Internal Report,5PP.
Moore, R.J. (1993) Integrated systems for the hydrometeorological forecasting of floods.EUROPROTECH Conference: Scienceand Technology for the Reduction of Natural Risks,6-8 May 1993, CS1M, Udine, Italy, 17pp.
Moore, R.J. (1993) Real-time flood forecasting systems: perspectivesandprospects. British - Hungarian Workshop on Flood Defence, 6-10 September 1993,VITUKI, Budapest, 121-166.
Moore, R.J. (1994) Applications of Weather Radar Data to Hydrology and Water Resources,WMO/TD - No.?, Technical Report of Rapporteurs, World Meteorological OrganizationRegional Association VI (Europe) Working Group on Hydrology, 26pp, in press.
Moore, R.J., Austin, R.M. & Carrington, D.S. (1993) Evaluationof FRONTIERS and LocalRadar Rainfall Forecasts for use in Flood Forecasting Models. R&D Note 225, ResearchContractor: Institute of Hydrology, National Rivers Authority, 156pp.
Moore, R.J, Bell, V.A, Roberts, G. and Morris, D. (1994) Development of distributed floodforecasting models using weather radar and digital terrain data. National Rivers AuthorityR&D Note 252, Research Contractor: Institute of Hydrology, draft, 106pp.
Walsh, P.D., Moore, R.J. & Rodda, J.C. (1993) Use of weather radar data for hydrologicalforecasting. First European Conference on Applications of Meteorology, 27 September - 1October 1993, University of Oxford, UK, 4pp.
6

Institution: University of Lancaster, United Kingdom
Pro'ect Leader: Professor Peter Young
Institutions c o ratin :
Title of ro'ect: STORMS, FLOODS AND RADAR HYDROLOGY
MAIN OBJECTIVES
The major areas for investigation are:
I. Selection of a number of severe convective storm events from current and very recentyears. Storms from a variety of radar sites will be selected in order to study theeffects of contrasting topography and urban areas on convective storm development.
Investigation of the factors determining the relation between short-term raingauge andthe associated radar data. These factors will include both the spatial and temporalcharacteristics of the storm cells as derived by a storm tracking procedure.
Comparison of the initiation and development of storm cells with descriptive,microphysical and meteorological models of convective storms. The aim is to developa model to forecast the effects of topography and urban areas on the development ofprecipitation cells in convective storm events.
Development of an adaptive and predictive radar correction scheme suitable for useas the input to a distributed hydrological model.
METHODS AND MATERIALS
Preliminary work has involved the study of a number of severe convective storms coveredby the Hameldon Hill radar site situated in northern England. The knowledge in the researchgroup of the area covered by the radar, and experience of using data from this site, has beeninvaluable during this research programme. The factors being investigated, thatmay influenceradar performance when a cell passes over a raingauge, include the direction of cellmovement and also the position of a gauge relative to a storm cell and its motion. Todetermine cell movement, a method of tracking storm cells for the duration of their lifetimeis being developed, both for short-term forecasting and identification of the aforementionedperformance factors. In order to achieve objective results the cell tracking system is fullyautomatic. Preliminary results indicate that it will result in much more consistent sequencesthan the manual system it replaces.
Initial processing of a storm event creates a dataset of all the cells identified in each radar image, along with cell characteristic data, including maximum precipitation rateand cell area.
7
Subsequent processing of these data results in the creation of another data.setwhich indicateshow cells in one frame are physically associated with cells in the next frame. While thissecond dataset is being created, the system keeps a running estimate of the velocity and othercell characteristics of each cell, such as how rapidly the cell area is expanding and the rateof change of total precipitation from the cell. This running estimate can be usedinstantaneously to achieve very short-term forecasting. When used in conjunction with detailsof a cell's behavior due to geographical and meteorological conditions, it provides informationrequired for longer term forecasts.
The identified cell characteristics and cell movement analysis are being compared to thebehaviour of precipitation cells generated in a three dimensional physical cloud model, inorder to clarify the influence of surface properties such as slope, aspect, roughness andthermal properties. The results of this analysis will be used to create a model of cell andstorm behaviour to be used in the longer term forecasting procedures mentioned above.
RESULTS TO DATE (JANUARY TO DECEMBER 1992)
Cell tracking
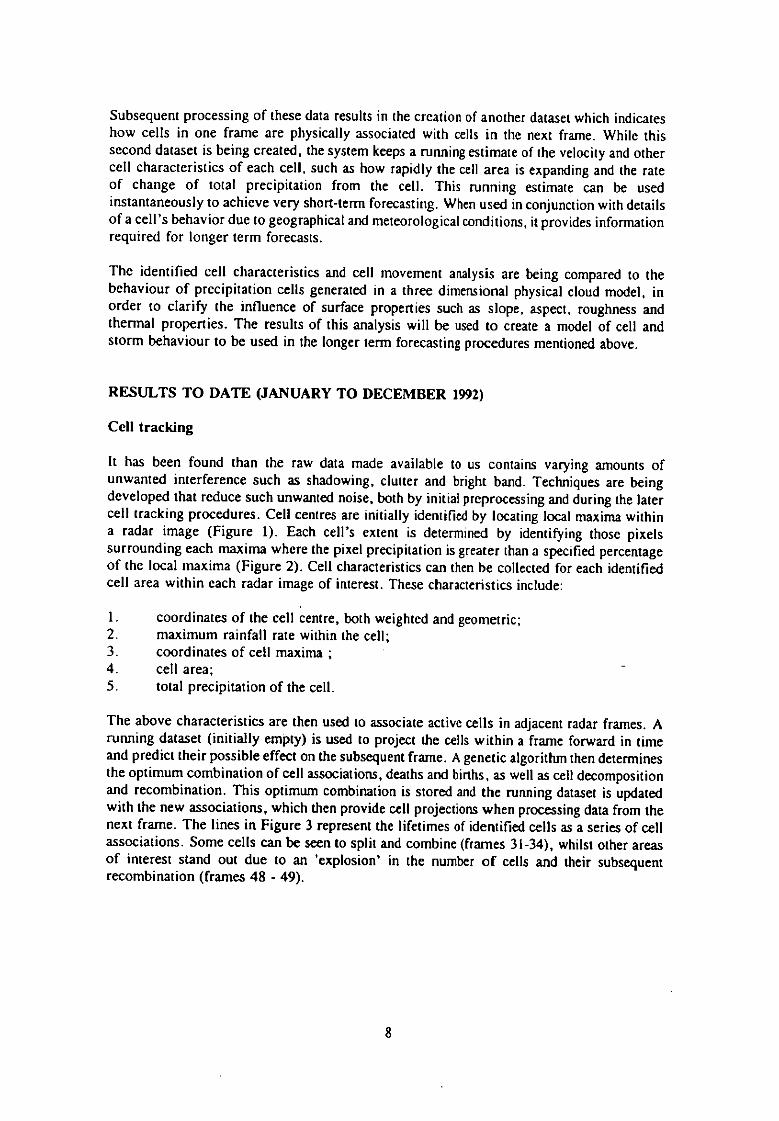
It has been found than the raw data made available to us contains varying amounts ofunwanted interference such as shadowing, clutter and bright band. Techniques are beingdeveloped that reduce such unwanted noise, both by initial preprocessing and during the latercell tracking procedures. Cell centres are initially identified by locating local maxima withina radar image (Figure 1). Each cell's extent is determined by identifying those pixelssurrounding each maxima where the pixel precipitation is greater than a specified percentageof the local maxima (Figure 2). Cell characteristics can then be collected for each identifiedcell area within each radar image of interest. These characteristics include:
coordinates of the cell centre, both weighted and geometric;maximum rainfall rate within the cell;coordinates of cell maxima ;cell area;total precipitation of the cell.
The above characteristics are then used to associate active cells in adjacent radar frames. Arunning dataset (initially empty) is used to project the cells within a frame forward in timeand predict their possible effect on the subsequent frame. A genetic algorithm then determinesthe optimum combination of cell associations, deaths and births, as well as cell decompositionand recombination. This optimum combination is stored and the running dataset is updatedwith the new associations, which then provide cell projections when processing data from thenext frame. The lines in Figure 3 represent the lifetimes of identified cells as a series of cellassociations. Some cells can be seen to split and combine (frames 31-34), whilst other areasof interest stand out due to an 'explosion' in the number of cells and their subsequentrecombination (frames 48 - 49).
8

Identified Cells at 17:10 89/509
350
370
. to
a 390
Z 410
cmSurface plot of frame ai 17:10 89/5/19 (Ilarhddom
o
-5
-10
20
c 430
450
470
4060 490
Pig. North
60 4020
Pixels East310 330 350 370 390 410 430 450
Kilometres East of N.G. Oriein
Figure 1 Figure 2
6•,4100.17 00,17 67017
0- Cfr-EN/0"1-=1:2\ror-0-0-0-a19 o 1-0-C1r• . • , • , . • • •0 1 2. 3 • 6 7 g 9 10 11 17 13 14 15 16 17 IR lv 20 11 22 23 24 71 11 27
Frame NumNer
0
gaalitto-
77701
11 21 39 30 31 32 33 14 13 36 31 38 19 40 41
Fltr.
54 15 /0 57 51 59 60 SI 62 63 64 61 615 67 64 69 70 7I 71 71 74 77 76 77 7a 79 40 /11
Fmme laimerer
°11 12 13 14 SI 86 131 59 90 gl 97 91 94 99 96 91 98 94 11010110710110410110610710R
Frame Numbgr
Plot of Ccil Total Pam:immoralduring Infme
N10 20 30 40 50 60 70 80
Cell age rfrilme9Plot of Coll yscrx-gdinatedurom 1%1nm
3%10 20 30 40 50 60 70 80
Call age (frames)
800
E200
50
= 45
'35
Figure 3 Figure 4
9

Short-term forecasting
Once the history of a cell has been determined, cell characteristics gathered earlier in thetracking process can be plotted with respect to an individual cell's lifetime. Figure 4 showshow the total cell precipitation and the y-coordinate of the cell centre vary throughout thelifetime of the longest lived cell in Figure 3. Also shown in Figure 4 is an estimate of thesmoothed variations in the variables obtained by an optimal recursive Kalman filter. Thederivative of this could be used to forecast the short term (half hour) value of a cellcharacteristic. Recent research has been concentrated on implementing this filter within thereal-time cell tracking method using procedures similar to those developed in another weatherradar project being carried out by the Lancaster group. Also, a recursive, fixed intervalsmoothing version of the Kalman filter is being used for off-line analysis of the resultsobtained from different data sets.
Physical cloud model
Development of a physical cloud model has resulted in the simulation of a number of eventsbased on real convective storms that occurred in the south Pennines during May 1989.Analysis of the simulations has revealed that cell creation was triggered by three basicmechanisms:
forced lifting at windward slopes, assisted by an additional increase in surfacetemperature due to, for example, the presence of urban areas.
cool air descending on the leeward side of a ridge pushing under warmer, morebuoyant air. This mechanism is enhanced by the presence of incoming warm airpossibly caused by a sea breeze.
convergent surface winds, again triggered by the sea breeze effect, but also due tolarger scale synoptic flow.
Cell movement is normally governed by the direction of steering level winds when cells areinitiated by forced lifting. However, when triggered by the other mechanisms, the cells tendto remain stationary for some time before moving away in the direction of the steering levelwinds.
CONCLUSIONS AND ADDITIONAL REMARKS
An automatic cell tracking system has been developed that is capable of trackingprecipitation cells as they mature, decompose or recombine. Short-term cellforecasting appears to be possible with the use of simple algorithms.
A recursive Kalman filter is being used to provide the cell tracking system with anon-line forecasting capability; a fixed interval version of the filter is being used forthe off-line analysis of the results.
A three-dimensional, physical, cloud-based model hasbeen developed, which suggeststhat there is an underlying pattern to the formation and propagation of precipitationcells. This pattern is related to the topography and land use of the area in addition to
10

the current synoptic situation.
REFERENCES
Thielen, J. & Mcllveen, J.F.R. (in press) Topographical Influence on Severe ConvectiveStorms. 2nd Int. Symposium on Hydrological Applications of Weather Radar,University of Hannover, 4-10 September 1992.
Co[tinge, V.K., Archibald, E.J., Brown, K.R. & Lord, M.E. (1990) Radar Observations ofthe Halifax Storm, 19 May 1989. Weather, 45, 345-365.
Thielen, J. (in press) Influence of the Central Pennines, England, on the Initiation andDevelopment of Convective Storms. Rutherford Appleton Laboratory, Internal report.
11
Institution: Telford Institute of Environmental Systems, University of Salford, UnitedKingdom
Pro'ect Leader: Prof. I.D. Cluckie
Institutions coo ratin : North West Water plc., NRANorth West Region, YorkshireWater Services
Title of r Sect: STORMS, FLOODS AND RADAR HYDROLOGY
MAIN OBJECTIVES
Deploy a mobile X-band Vertical Pointing Radar (VPR) system at selected sites inthe UK and possibly Germany in cooperation with EC partners;
Analysis of vertical reflectivity data, with particular attention paid to bright-bandcharacteristics and dynamics;
Relate VPR measurements of rainfall to conventional scanning radar estimates (C-band or X-band as available);
Deploy the mobile system in areas subjected to orographic enhancement to obtaininformation on the rainfall structure and mechanism;
Develop techniques which make use of information about the vertical reflectivityprofile to correct for errors in scanning radar data.
METHODS AND MATERIALS
The project involves deploying a static VPR device, housed on the roof of the TelfordBuilding at Salford University, and two trailer-mounted systems. The radar system is compactwith low power requirements. Its main components are illustrated in Figure 1 and Table 1provides a summary of the technical and operational featuresof the VPR. The high temporaland spatial resolution of the device enables storm characteristics to be studied in great detailfrom near ground level up to 12km altitude.
The static VPR at Salford measures the height-time variationof precipitation as it moves overthe radar site, and therefore represents a point sample only. Deployed in conjunction with theSalford-based radar, the mobile systems enable the spatial variability of the verticalreflectivity profile and orographic effects to be studied. This research will take the form ofselected transect experiments, initially in the North West of England, with the radars staticand strategically positioned in order to monitor the passage and possible enhancement of afrontal rain system across the region.
12

Figure 1 Schematic of the VPR system hardware components
• rid,
-a
,
Table 1 Overview of the VPR technical specification and operational characteristics
General
Radar type Racal Marine Navigation TransmitterFrequency 9380-9440 MHzWavelength approx. 3cm (X-band)
Antenna
Type Parabolic reflectorDiameter 1.2inElevation Zenith pointing
Beam
Elevation
Beamwidth
Power
Azimuth (vertically pointing)1.8° (between half-power 13 dB) points)
Mean power supplied to antenna 12 dBWPeak power " 44 dBW (25 kW)Relative gain of antenna 38 dI3
Radiative
Pulse recurrence frequency I 300'/ 6506 HzPulse width 0.051 0.25'/ I oh msPolarisation Linear
Observation
Observation height rangeMaximum vertical resolutionMaximum temporal resolution
from approx. 100m to 12000m (nominal)7.5 rn
2 seconds (256 pulses averaged over this period)
13
Each radar system is complemented by a ground-based transportable weather station whichprovides a full range of meteorological parameters (wind speed and direction, wet and drybulb temperatures, humidity, barometric pressure, raingauge rainfall amounts). Theinformation provided by the weather stations, along with radiosonde data, will be incorporatedinto case studies of the bright-band and orographic enhancement as well as the broaderanalysis of storm systems observed by the VPR and the recently commissioned Salford C-band scanning radar.
RESULTS
Mobile VPR
The first of the mobile radar systems was deployed at Audenshaw (approx. II km east ofSalford) for a ten-week period during the late summer. The aim of this initial two-pointexperiment was to collect and compare rainfall event data at the two locations, with aparticular interest in the bright - band. The bright-band is a feature observed in radarreflectivity data and represents the layer in the atmosphere where falling ice crystals orsnowflakes melt to form raindrops. The bright-band is associated with high reflectivities(created by the differing backscattering characteristics of dry ice and partly melted ice) andits presence in a scanning radar beam can adversely affect precipitation estimates by causingan overestimate of rain at the ground, particularly at close ranges to the radar. The bright-band may go undetected in scanning radar images due to the resolution of the data and/orvariations in the width of the bright-band. The VPR yields valuable information on thedynamics of bright-band height, width and intensity which will be incorporated into currentcorrection procedures for scanning radar data (section (v)).
One of the mobile systems will be involved in research in the south of England in conjunctionwith the HYREX (Hydrological Radar Experiment) study programme. Initially, the VPR willbe sited close to the Chilbolton weather radar in Berkshire and the vertical profile data willbe related to the scanning data to investigate X-band attenuation. Numerical modelling of thebright-band will also comprise a major part of the research to be undertaken.
Vertical profiles and bright-band climatology
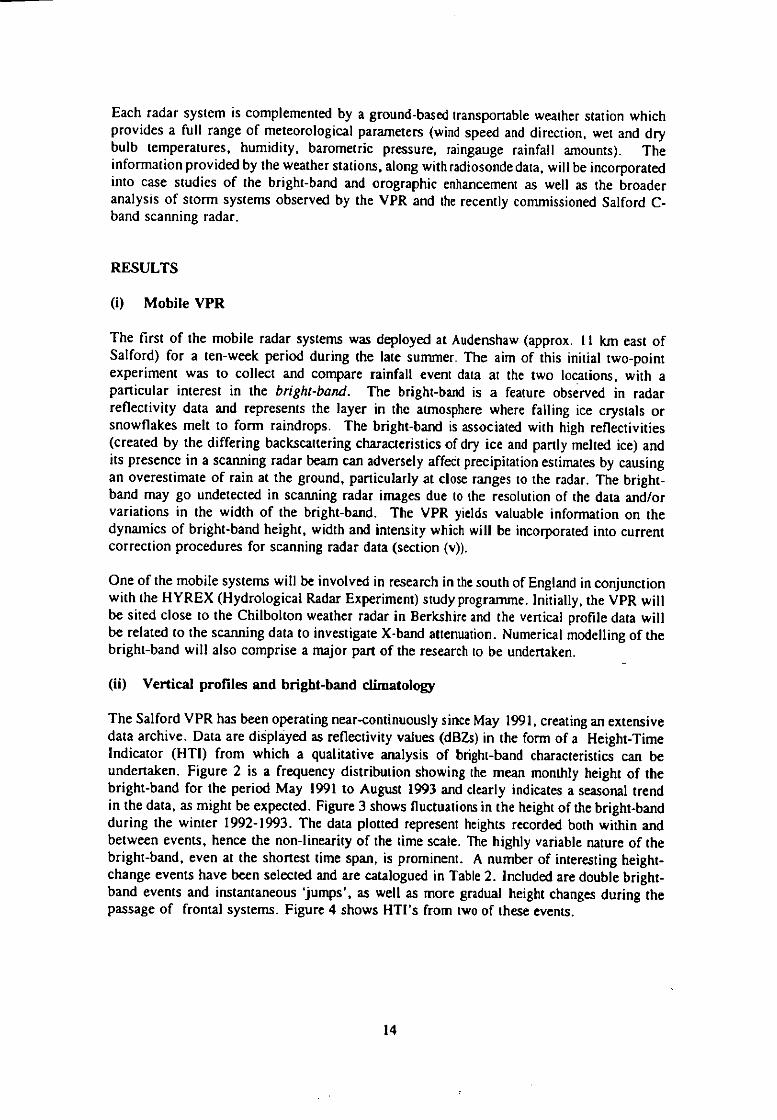
The Salford VPR has been operating near-continuously since May 1991, creating an extensivedata archive. Data are displayed as reflectivity values (dBZs) in the form of a Height-TimeIndicator (HTI) from which a qualitative analysis of bright-band characteristics can beundertaken. Figure 2 is a frequency distribution showing the mean monthly height of thebright-band for the period May 1991 to August 1993 and clearly indicates a seasonal trendin the data, as might be expected. Figure 3 shows fluctuations in the height of the bright-bandduring the winter 1992-1993. The data plotted represent heights recorded both within andbetween events, hence the non-linearity of the time scale. The highly variable nature of thebright-band, even at the shortest time span, is prominent. A number of interesting height-change events have been selected and are catalogued in Table 2. Included are double bright-band events and instantaneous 'jumps', as well as more gradual height changes during thepassage of frontal systems. Figure 4 shows HTI's from two of these events.
14
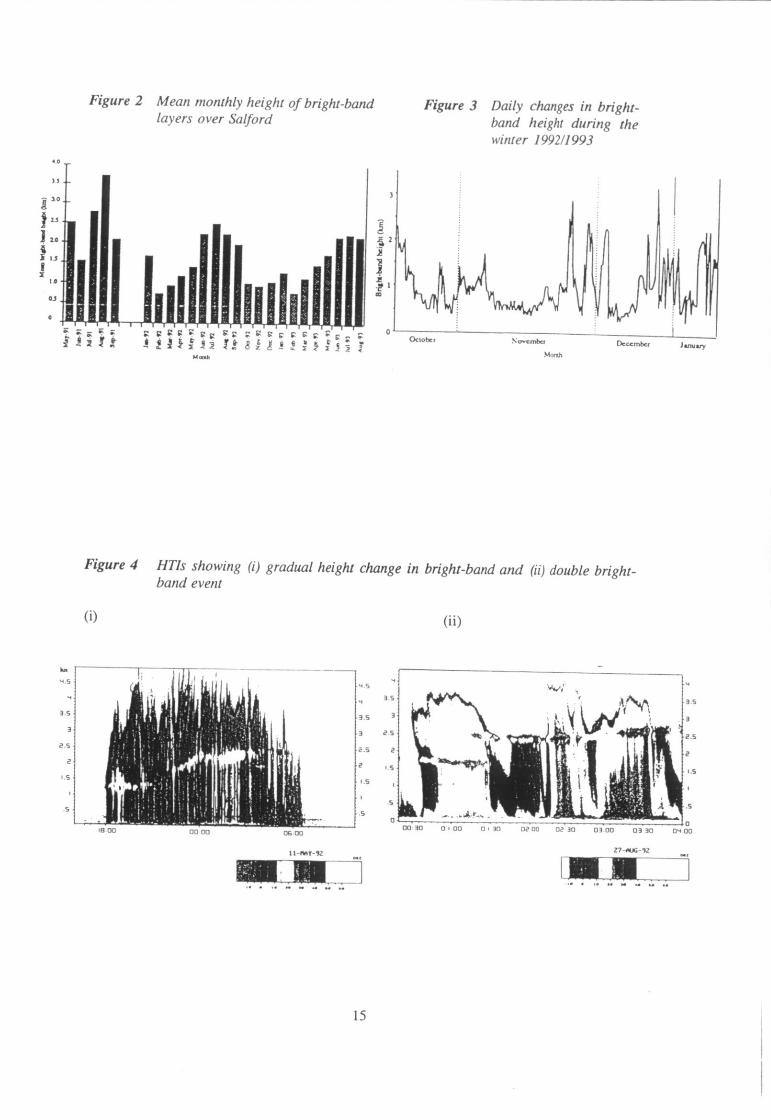
Figure 2 Mean monthly height of bright-band Figure 3 Daily changes in bright-layers ()ler Salford band height during the
winter 1992/1993
i " -I. 6
10
IHRthili2 I
I20 1 2itII I0 R
(ktohc r N ovc mho1 .t11,.W1-5....11' I )€ccmhe-r
Figure 4 HTIs showing (i) gradual height change in bright-band and (ii) double bright-band event
Iof
criu try
4 5
5
RS
15

Table 2Summary of height changes in the bright-band layer
(i)Gradual changes
DateTimeDurationHeight changeVertical(GMT)(hr)(kin)distance (m)
Direction Gradient(rn/mi)
14 Feb 92 1000-1330 3.5 0.85-1.4 550 rising 2.6
21 Mar 92 1900-0730 12.5 0.75-1.7-1.35 950, 350 rises thenfalls
1.6 (up)
I I May 92 1803-0530 11.5 1.25-2.4 1150 rising 1.7
21 Nov 92 1010-1610 6.0 0.95-2.5 1550 rising 4.3
02 Dec 92 1130-1650 5.33 2 25-0 95 1300 falling 4.1
27 May 93 0200-0740 5.67 2.7-2.25 450 falling 1.3
13/14 Nov 93 0800-0700 23 0.7-1.7-0.35 1000, 1350 rises thenfalls
3.2 (down)
Sudden changes
Date Event time Time of heightchange
Vertical distance
(0)
Direction of jump
02 Dec 92 1400-1615 15.30 250 down
23 Jan 93 0900-1330 11.30 1100 up
26 Apr 93 1930-1950 19.38 300 down
13 Sep 93 1325-1515 13.35 300 up
(iii) Double bright-band layer events
Date Event time Lower bright Upper bright band Duration of doubleband height (km) height (km) bright band (min)
02 Jun 91 0900-0945 1.5 135 8
08 Jul 91 1155-1225 2.5 3.0 4
27 Aug 92 0030-0400 1.75 2.5 15
09 Dec 92 0000-0135 0.9 2.0 15
16

(iii) Comparison of VPR and scanning radar rainfall estimates
A prototype scanning C-band weather radar has recently been commissioned and installed atHarrop Edge, approximately 16 km east of Salford. The radar is located close to theManchester/Salford conurbation and provides rainfall estimates of a high spatial and temporalresolution. Rainfall data of this quality are the primary requirement for hydrologicalapplications in the urban environment. Duncan et al (1992) gives a detailed overview of theSalford C-band project and associated hardware and operational specifications.
A mobile VPR will be placed at or near the C-band radar site to provide high resolution(7.5m, 2 secs. ) data on the vertical reflectivity profile. With the availability of this type ofdata, Fabry et al (1992) produced parameterised estimates of the bright-band height andmean reflectivity profile and used them to correct for range dependant biases in scanningradar data that are attributable to variations in the vertical reflectivity profile.
Orographic rainfall
Two west-east transects have been selected across the north of England. One runs fromLiverpool, over the Pennines to the Doncaster region; the more northerly transect runs fromLancaster, over the Forest of Howland and the Pennines, to York. Both traverse areas areknown to be important for orographic enhancement of rainfall (Chuan and Lockwood, 1974).Permission to park the mobile radars and operate at strategic sites is currently being soughtfrom the relevant authorities in order that the experiment can get underway early in 1994.Scanning radar data will be made available in real-time, from Hameldon Hill and from theUK network, for monitoring frontal systems moving in from the Atlantic and to instigatetimely operation of the VPRs.
The aim of the experiment will be to have all three (along the southern transect) VPRs staticand operating as a storm moves across the region from west to east. The first of the mobiledevices will be deployed near the coast, and the second on higher ground to the east, whereit is hoped that some degree of enhancement of near-surface rainfall rates will be observedif meteorological conditions in the lowest levels of the atmosphere are favourable ( Hill et al.,1981; Hill, 1983). The VPR will reveal valuable information on the vertical structure of thestorms and the enhancement process.
Correction of errors in scanning radar data
The development of a fully automatic bright-band correction technique that will workaccurately and reliably whatever the meteorological conditions is still in its early stages. Workhas commenced on a detection algorithm which uses changes in the reflectivity gradient inthe vertical to identify the bright-band. Once a bright-band can be reliably detected, a meansof evaluating the magnitude of and calculating correction factors for any discrepancies in thesurface rainfall rate that might have been introduced by the presence of the bright-band in thescanning beam must be sought.
A prerequisite to this stage of the research has been the development and testing of softwareto facilitate the handling, analysis and display of the VPR data. All event data are nowtransferred to a DEC VAX computer for subsequent processing (a number of computerprograms have been created to decode the data values) and display. A program whichaverages out near-surface reflectivity over one-minute intervals and then converts these to anequivalent rainfall rate (using a standard empirical relationship) and depth has just been
17
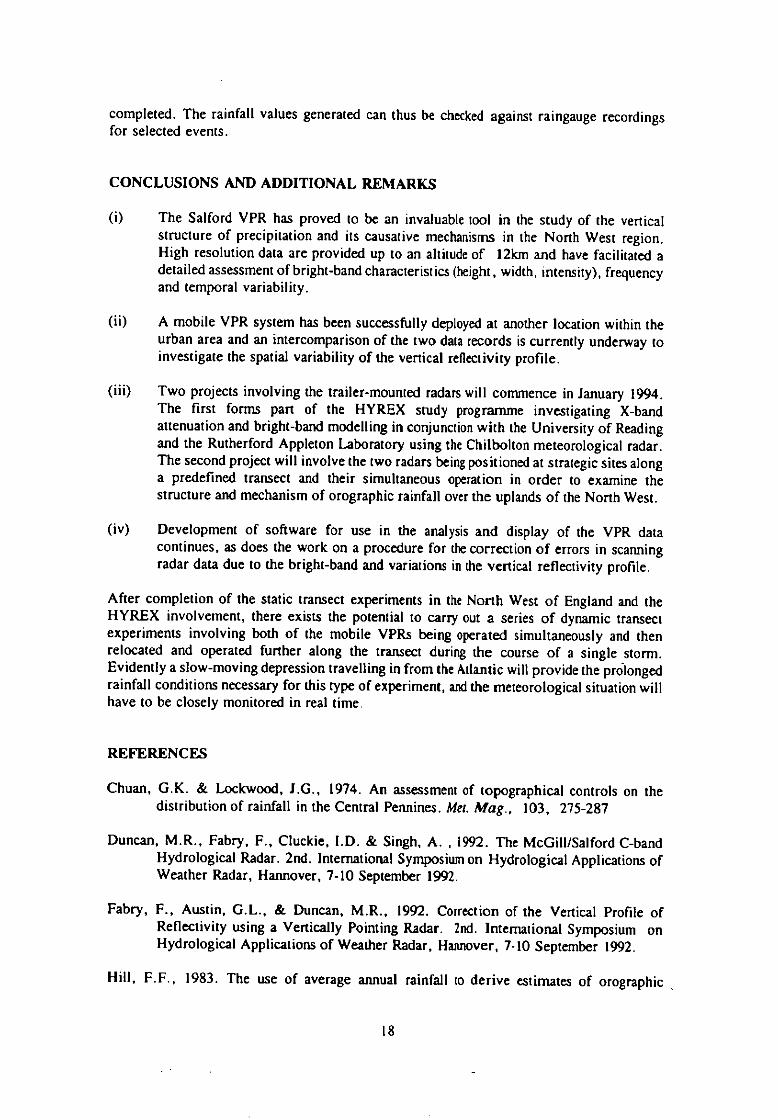
completed. The rainfall values generated can thus be checked against raingauge recordingsfor selected events.
CONCLUSIONS AND ADDITIONAL REMARKS
The Salford VPR has proved to be an invaluable tool in the study of the verticalstructure of precipitation and its causative mechanisms in the North West region.High resolution data are provided up to an altitude of 12km and have facilitated adetailed assessment of bright-band characteristics (height , width, intensity), frequencyand temporal variability.
A mobile VPR system has been successfully deployed at another location within theurban area and an intercomparison of the two data records is currently underway toinvestigate the spatial variability of the vertical reflectivity profile.
Two projects involving the trailer-mounted radars will commence in January 1994.The first forms part of the HYREX study programme investigating X-bandattenuation and bright-band modelling in conjunction with the University of Readingand the Rutherford Appleton Laboratory using the Chilbolton meteorological radar.The second project will involve the two radars being positioned at strategic sites alonga predefined transect and their simultaneous operation in order to examine thestructure and mechanism of orographic rainfall over the uplands of the North West.
Development of software for use in the analysis and display of the VPR datacontinues, as does the work on a procedure for the correction of errors in scanningradar data due to the bright-band and variations in ihe vertical reflectivity profile.
After completion of the static transect experiments in the North West of England and theHYREX involvement, there exists the potential to carry out a series of dynamic transectexperiments involving both of the mobile VPRs being operated simultaneously and thenrelocated and operated further along the transect during the course of a single storm.Evidently a slow-moving depression travelling in from the Atlantic will provide the prolongedrainfall conditions necessary for this type of experiment, andthe meteorological situation willhave to be closely monitored in real time.
REFERENCES
Chun, G.K. & Lockwood, LG., 1974. An assessment of topographical controls on the distribution of rainfall in the Central Pennines. Met. Mag., 103, 275-287
Duncan, M.R., Fabry, F., Cluckie, I.D. & Singh, A. , 1992. The McGill/Salford C-bandHydrological Radar. 2nd. International Symposium on Hydrological Applications ofWeather Radar, Hannover, 7-10 September 1992
Fabry, F., Austin, G.L., & Duncan, M.R., 1992. Correction of the Vertical Profile ofReflectivity using a Vertically Pointing Radar. 2nd. International Symposium onHydrological Applications of Weather Radar, Hannover, 7-10 September 1992.
Hill, F.F., 1983. The use of average annual rainfall to derive estimates of orographic
18

enhancement of frontal rain over England and Wales for different wind directions.J. Clim., 3, 113-129
Hill, F.F., Browning, K.A., & Bader, Mt, 1981. Radar and raingauge observations oforographic rain over South Wales. Q.J.R.Met. Soc., 107, 643-670
19

Institution: Dept of Meteorology, University of Reading, United Kingdom
Pro'ec Leader: Anthony J. Illingworth
Institutions coo ratin : Rutherford Appleton Laboratory
Title of ro'ect: STORMS, FLOODS AND RADAR HYDROLOGY
IMPROVED RADAR ESTIMATES OF RAINFALL USING DIFFERENTIAL PHASETECHNIQUES
MAIN OBJECTIVES:
The scientific goals of the project are:
Gather preliminary differential phase radar data inprecipitation.
Establish algorithms for obtaining the best estimates of differential phase shift overvarious distances.
Make additional observations of differential phase for a large range of meteorologicalsituations.
Investigate the efficiency of the differential phase shift for measuring rainfall, itsapplicability for measuring rainfall over hydrological basins, and compare itsefficiency with estimates of rainfall made from conventional measurements of radarreflectivity.
METHODS AND MATERIALS
This study involves gathering data with the RAL dual polarisation radar situated in SouthernEngland. The radar has recently been Dopplerised and is also able to transmit (and receive)pulses which are alternately horizontally and vertically polarised. This project concentrateson the measurement of a new radar parameter - the differential phase shift - which is apropagation effect.
Raindrops are oblate and dielectrically lossy. As a result thephase of a horizontally polarisedwave progressing through a medium containing rain is delayed by more than the verticallypolarised radiation. This differential phase shift, Opp, is detected on backscatter from theprecipitation . The phase difference Opp, increases monotonically with range, and theorypredicts that the gradient of Opp with range, called ICDP, and measured in °/km, should bealmost linearly proportional to the rain rate.
20

RESULTS TO DATE (JANUARY TO DECEMBER 1993)
In the first year our task was to complete objectives (i) and (ii). This has been achieved asdescribed below.
Data gathering
The Opp data have been gathered in raw timc series form. In other words the phase of thereturn at each gate is recorded for each transmitted pulse. After the event this phaseinformation from the individual pulses can be analysed and the performance of the variousalgorithms for estimating Opp evaluated.
The data flow is very high. Typically the data are recorded at 512 gates, separated by 75m,at a pulse repetition rate of 610Hz. The phase is obtained by an eight bit digitisation of theI and Q outputs of the IF phase comparator. To improve the dynamic range, a limiting IFamplifier is used ahead of the phase comparator, and the intensity (Z) magnitude is derivedfrom a separate IF amplifier with 96dB range. Each data point is 4 bytes, so the flow rate is4*512*610 = 1.2MBytes per second.
Data have been recorded on six separate occasions and has included both RBIs and PPIs andalso a series of long dwells. The long dwells of up to 15 seconds have been particularlyuseful for comparing the various algorithms for estimating Oar.
Algorithms for estimating differential phase shift
The differential phase concept is fairly straightforward, but in practice the horizontal andvertical phases have to be measured using sequentially transmitted pulses. If the targets hada constant Doppler velocity, then the phase between successive H (or V) returns at a givengate would change linearly with time (for example, a phase shift of 180° would correspondto a displacement of one quarter of a wavelength), and the interpolation to correct for thestaggered sampling would be straightforward. In practice the spread of velocities (finite widthof the Doppler spectrum) places a fundamental restriction on the accuracy of the Opp estimate.Two algorithms have been proposed (Sachidananda and Zrnic, 1986). We have found thatthe second of these algorithms is much the better (Blackman and Illingworth, 1993). In thisalgorithm y6Dpis computed by taking the phase difference (Ov - OH) for each triplet oftransmitted pulses, adding all the real and imaginary parts, and then taking the phase of theaveraged vector sum.
The standard deviation of the Oppestimate increases for larger Doppler widths. Various semi-analytic expressions have been suggested for this relationship and at present we are carryingout an empirical study for targets with a large range of Doppler widths to confirm and refinethese expressions.
Comparison of rainfall from phase shift and reflectivity
Two examples are illustrated in Figures 1 and 2. The first is a case for heavy rain, with Zexceeding 50dBZ recorded on 11 June 1993. The second is for a case of widespread lightrain on 9 July 1993.
21

0Ray Profile of Phi DP vs. nage
11/ 6/1993 13:20:58 an 361.0 eL 1.0
Average Rain Rate betacen Stan-5 Ft (Kdp) a 10 mm/hr
Ft (int Z) a 12 mmAir
• Average Rain Rate betvcen Circles
R (Kdp) 51 rnm/hr
R (int Z) 57 mm/hr
-15 -
11nivricr-'
62 66 63
Differential
Phase
(dcg)
-20 1 43 50 52 54 56 58
range (km)
Ray Profile nl Z vs range60 -,
11/ 6/1993 13:20:53 a' 361.0 el: 1.050
40
r17co
30
20 -
52 54i 56 58 60 62 64 (,6 63
range (km)
Figure 1 Ray profiles of Oroand Z versus range. heavy rain case on 11 June 1993
so
Ray Profile ol Phi_DP vs. range.
9/ 76 993 10:. 9.20 ar 353.0 a 0.3
40
Average Rain Rate tetween Stars
Ft (Kdp) =1 mra/br
Ft (int Z.) =3 mmAm
20
Average Rain Rate hetvicen Circles
R (Kdp) =1 mmAir
R (int 1) =3 majhr
-20 •
A01020 3041050
range (krn)
60
Ray Profile of Z vs. range
45
9/ 7/1993 10: 920 ar 353.0 a 0.8
40
35
30
-
I _.
201020 304050
range (km)
so
Figure 2 Ray profiles of Ow.and Z versus range: widespread light rain on 9 July 1993
e-70 80
70 30
22

The 40Dp technique has several potential advantages over a simple measurement of Z whichwe address below:
Is the phase shift between two points on a range profile equal to the integratedrainfallbetween these two points?Does the phase technique measure only the rain but not respond to thehail which candominate the reflectivity?In regions where heavy clutter precludes the measurement of Z, is it possible toestimate the integrated rainfall by the phase shift from one side of the clutter regionto the other?
11 June 1993The data for this case are for a 6 second dwell at 1° elevation and so the radar beam is inthe rain and does not penetrate the ice. The maximum value of reflectivity, Z, at a range of60km of >50dBZ coincides with the steepest gradient of the differential phase. In thisexample the other polarisation parameters (such as differential reflectivity and the lineardepolarisation ratio) indicate that there is no hail present and so we would expect reasonableagreement between rainfall from the phase technique and the reflectivity approach.
The average rainfall has been estimated using the total phase difference betweentwo differentranges and then compared with that taken by a gate by gate integration of the rainfall fromthe reflectivity. If we consider the two stars at ranges 54 and 66km range then phase shiftgives lOmm/hr and Z gives 12mm/hr. Concentrating on the heavy rainfall region betweenthe circles at 58.8km and 60.4km then the phase gives 51mm/hr and the integratedZ gives57mm/hr.
9 July 1993In this case the reflectivities are much lower and the phase is only increasing very slowly withrange. Between the stars at 32 and 42km the phase method gives lmm./hr and the integratedZ yields a value of 3mm/hr; for the two circles at 18 and 68km the rates are again 1 and3mm/hr respectively. To illustrate the ground clutter technique, we draw attention to thephase spike of 60° at 22km range caused by differential phase shift on scattering from groundtargets, and note that the phase on either side of this spike is unaffected.
CONCLUSIONS AND ADDITIONAL REMARKS
We have established reliable algorithms for estimating differential phase and shown with afew examples that the results are consistent with those obtained using the conventionalreflectivity technique.
The next stage is to gather data and compare with a line of rain gauges deployed along anazimuth from the radar. This will provide independent confirmation of the rainfall rate, andshould demonstrate whether the phase technique is able to provide improved rainfallest imates.
REFERENCES
Blackman & Illingworth (1993) Proc 26th Im Conf on Radar Meteorol, Amer Meteorol Soc,Boston.
Sachidanada & Zrnic (1986) Rad Sci, 21, 235-247.
23

Institution: Dept. of Water Resources, Agricultural University, Wageningen, TheNetherlands
Pro'ect Leader: Han Stricker
Institutions coo eratin : Dept. of Telecommunicationand Remote SensingTechnology, Faculty of Electrical Engineering, DelftUniversity of Technology, Delft, The Netherlands (TUD)
Royal Netherlands Meteorological Institute, De Bilt, TheNetherlands (KNMI)
Water Authority of DeBland, Delft, The Netherlands
Water Authority of West Brabant, Breda, The Netherlands
Title of ro'ect: STORMS, FLOODS AND RADAR HYDROLOGY
MAIN OBJECTIVES
The scientific goals of the CEC project involve investigationinto the following:
the rainfall measurement problem
the rainfall forecasting problem
application to flood warning and control
application to storm hazard assessment
METHODS AND MATERIALS
The Dutch contribution to the project aims to address these problems along three lines ofresearch:
A dataset of 41 rainfall events from the KNMI C-band weather radar and a networkof 16 tipping bucket raingauges sampling an area of 1500 km2 within the WaterAuthority of West Brabant has been collected, analyzed and calibrated during anearlier investigation. The accuracy of radar rainfall estimates obtained using differentadjustment procedures as compared to raingauge measurements will be investigated.Moreover, the rainfall fields obtained will be usedas input to a previously developedurban waterbalance model describing a regional wastewater transportation system.
A dataset of 5 rainfall events from colocated X-band and multipararneter S-band
24

research radars (both operated by TUD) and a network of 10 tipping bucketraingauges sampling an urban area of 100 km' within the Water Authorityof Delllandhas been collected during the current and an earlier CEC project. For 2 additionalevents data from the C-band weather radar and the X-band research radar areavailable. Since the rainfall fields are measured on 4 different spatial scales and arange of temporal scales, a nested approach will be adopted to tackle the associatedsampling problems.
(iii) The above-mentioned sampling problems will be explored more fundamentallythrough the development of mathematical and computer models at differentcomplexity levels describing the space-time structure of rainfall at the droplet scaleand radar and raingauge measurements.
Results (January to December 1993)
(1) Accuracy of Radar Rainfall Estimates Compared to Raingauge Measurements and aHydrological Application
The objectives of this study were (Hakvoort et al., 1993):
to determine the accuracy of C-band weather radar rainfall estimates in comparisonwith raingauge measurements;to examine the effect of a number of adjustment methods - using an increasingnumber of adjustment raingauges - on the accuracy of radar rainfall estimates;to evaluate the accuracy of radar-derived rainfall amounts for hydrologicalpurposes,in particular their application as input to a rainfall-runoff model of a regional sewersystem.
During an earlier investigation (of which the results were presented in the FinalReport of theCEC-EPOCH project "Weather Radar and Storm and Flood Hazard") rainfall data from bothradar and raingauges were collected for a total of 41 events. To allow for a statisticalapproach, a subset of 13 events was selected for which the number of operational raingaugeswas at least 6 and the number of 15-minuteperiods covering the event was at least 20.
Two types of verification were applied, namely one in which the accuracy of radar rainfallestimates was determined only in pixels where a raingauge was located and another in whichthe complete areal field of radar rainfall estimates was considered. In the first case, theaccuracy of unadjusted radar data was compared with the accuracy of radar data adjustedusing either one or the arithmetic mean of all available raingauges. In the secondcase, radarrainfall estimates at all radar pixels were adjusted using an increasing number of raingauges.Each raingauge used for adjustment was thought to represent a sub-area corresponding to aThiessen polygon. After assigning the raingauge measurement to all radar pixels within thecorresponding adjustment domain, an average adjustment factor was computed from theindividual adjustment factors. Three different ways of averaging the individual adjustmentfactors within the adjustment domains were considered, namely arithmetically, geometricallyand volumetrically. As the number of adjustment raingauges increased, the number ofraingauges left for verification decreased. In order to avoid biased statistics, all possiblecombinations of adjustment and verification raingauges were taken into account.
The accuracy of radar rainfall estimates was determined assuming raingauges to represent the
25
"ground truth". Radar and raingauge data were compared on the basis of the differencesbetween individual pixel values and on the basis of their ratios. Both for the absolute and forthe relative comparison, the statistics considered were the mean and the standard deviationcomputed over all relevant locations and all time steps in the event.
As for the synchronization of radar and raingauge data, two types of radar rainfallaccumulation were compared, namely forward extrapolation and a space-time interpolationmethod based on the displacement vector principle (van den Assem, 1991). Two differentaccumulation periods were compared, namely 15 minutes (corresponding to the time periodbetween two radar scans) and 30 minutes.
Some of the previously obtained rainfall fields were used as input for a rainfall-runoff modeldesigned to simulate at a 15 minute time step the transformation process of both sewage andrainfall water from 27 urban areas through a regional pressure pipe system to discharge at thepurification plant. The rainfall fields considered were measurements from all operationalgauges interpolated using Thiessen polygons and radar rainfall estimates without adjustmentand with adjustment by one and all minus one raingauges (obtained using the space-timeinterpolation method and the adjustment domain approach). Measured and simulated outflowhydrographs at the regional purification plant were compared on the basis of several statistics,of which the relative mean bias error and the relative root mean square error corrected forbias were the most important. Figures 1 and 2 show examples of model inputs and outputs,respectively.
The most important results of this study are:
The absolute comparison of radar rainfall estimates with raingauge measurements ismore transparent and especially for hydrological purposes more valuable. The relativestatistic fluctuates heavily and is therefore hard to interpret.
Radar rainfall estimates calculated according to the space-time interpolation methodprovide more accurate results than those calculated according to the forwardextrapolation method. This is especially true when the radar rainfall estimates areadjusted and when special meteorological circumstances (bright band, anaprop) arepresent.
For 4 out of 13 rainfall events the unadjusted radar rainfall estimates, on the average,overestimate the raingauge measurements, whereas for 3 events they underestimatethe raingauge measurements. For the remaining 6 rainfall events the radar rainfallestimates match well with the raingauge measurements.
Increasing the length of the time period for which radar rainfall estimates andraingauge measurements are accumulated from 15 minutes to 30 minutes does notincrease the accuracy of the radar rainfall estimates.
Arithmetical averaging of individual adjustment factors provides better results interms of reducing the bias error than geometrical or volumetrical averaging.
For 10 out of 13 rainfall events adjustment of radar rainfall estimates using alloperational raingauges minus 1 results in an increase of the accuracy as compared tounadjusted radar rainfall estimates.
26

8000
RISS lino Soon - tv44Unceaslad Dodo islinale
3000
eaeo
70007000 12500 7
60006000 ?toot,
5000 ?
5000 ? I 1500 40001:
4000 2
3000
; IODO
3000 71
2000a
-t2I 500
10002000o
° 15 ItS 215 315 415 515flaw (Iv]
0 -a. iris 144741 .4.31 la (1145/0 4•01 Yet. 60424as)
Roinlol Time Series - Event 8 licsingouo• mousuroments
3000 c
.1f 2500
72000
O 1500
1/7ka 1000
0
500 51 :1: 1000
15 115 215 315 515Time Ltd
-a - Irdol (14305 rn3) 1141(19902 nal) te141 (56111 ID1)
la
Fig. 1 Time series of rainfall flux used as input for rainfall-runoff model for event 8(December 9th, 1988). Ridaal = rainfall input volume for the urban area ofRoosendaal; BoZ = rainfall input volume for the urban area of Bergen op Zoom;Total = total rainfall input volume for all 27 impervious areas, a: raingaugemeasurements; b: unadjusted radar estimates.
4000
3500
Event I Out flow Both
4000
3500
le 30 00
Event 1 Outflow Bath
415
lb
3000. 2500
? 2000. 2500
"? 2000
500
1500 'org 1000
01630 1800 1930 2100 2230 2400 130 300 430
thn• [1.1
3, 1500
-A1000
500
2b
01630 r-1801-0 1930 2100 2230 2400 130 300 430
lime Dv]
— measured -e- rodar -1- roingouges
—mdas0.44 rola • 5 act
2a
Fig. 2 Hydrographs of measured and simulated ouylow at regional wastewaterpunficationplant Bathfor event 1 (September 12th, 1988). a: comparison of measured dischargewith simulated discharges using unadjusted radar data and raingauge data; b:comparison of measured discharge with simulated discharge using radar dataadjusted with 5 raingauges.
27

When radar rainfall estimates adjusted with I raingauge and radar rainfall estimatesadjusted with all operational raingauges minus 2 are compared, it can be concludedthat the accuracy only slightly increases in favour of using more raingauges foradjustment.
The effect of computing an adjustment factor using all radar pixels (including thosein which no raingauge was installed) and using limits to restrict the value of the meanadjustment factor appears to be rewarding for reducing the random error, especiallyin case of special meteorological circumstances.
Concerning the accuracy of radar and raingauge rainfall estimates for hydrologicalpurposes, it can be concluded that raingauge measurements provide more accuraterainfall estimates than unadjusted radar data. Adjusting the radar rainfall estimatesusing one raingauge can both improve and deteriorate the accuracy of the simulatedoutflow hydrograph, depending on which raingauge is chosen for adjustment.Adjusting radar rainfall estimates using all operational raingauges minus 1 does notyield the best nor the worst result in terms of accuracy of the simulated outflowhydrograph, but appears to be the most reliable method on the average.
Adjusted radar rainfall estimates using all operational raingauges minus 1 or 2 aremore reliable than all other rainfall estimation methods considered. Althoughadjustment using one raingauge can both improve and deteriorate the results,depending on the location of the raingauge chosen for adjustment, adjusted radarrainfall estimates using the best performing single raingauge are more accurate thanthose obtaincd using any other method considered. Therefore, it is recommended todevelop a model which decides per time step which raingauge is used for adjustment.
(ii) Application of Different Types of Weather Radars for Rainfall Estimation Over anUrban Area for Water Management Purposes
All three radars involved in this study have not been available for measurements during asignificant part of the year as a result of either software or hardware updating. The data-processing software of the KNMI C-band weather radar at De Bilt was improved through theinclusion of a clutter suppression program. The S-band FM-CW Doppler-polarimetric DelftAtmospheric Research Radar (DARR) received an entirely new and ultrafast computer toimprove its real-time data-processing capability. Since this mini-supercomputer is equippedwith parallel processors, the data-processing software had to be rewritten completely. Thesubsequent change in the format of the output of this software implied that the analysissoftware already developed for this study had to be rewritten, too. This process is currentlyunder way and the first results are expected early in 1994. The computer formerly connectedwith DARR serves now as the data-processor for the X-band FM-CW Solid State weathersurveillance radar (SOLIDAR) operated by TUD.
Measurements with the above-mentioned radars and with a network of 10 tipping bucketraingauges installed in an area largely covered with greenhouses within the Water Authorityof Delfland were carried out on 5 days in 1993, namely 5, 11 and 12 August, 21 October and10 November. The data were transferred from the radar sites to Wageningen AgriculturalUniversity via Internet and are now waiting to be treated by the data-analysis software. Thefirst results of measurements in the framework of this multi-sensor study have already beenreported in the Final Report of the CEC-EPOCH project "Weather Radar and Storm and
28

Flood Hazard" and were presented at the 4th International Conference on Precipitation heldat The University of Iowa in April 1993 (Uijlenhoet, 1993).
(iii) Numerical Studies of the Radar Rainfall Measurement Problem at the Droplet Scale
Most radar observables and rainfall integral parameters can be closely approximated by theproduct of a moment of the raindrop size distribution and a proportionality factor. This caneasily be shown if it is assumed that multiple scattering effects of microwaves on raindropscan be neglected and that the dependence of raindrop terminal fall velocity and thebackscattering and extinction cross-sections of raindrops on drop diameter are described bypower laws. The validity of these assumptions has been frequently reported in the literaturefor rainfall rate, liquid water content, kinetic energy flux density, radar reflectivity factor,specific attenuation coefficient and mean Doppler velocity.
Probability distributions that have been used over the years to parameterise observed raindropsize spectra include the gamma, Weibull and lognormal distributions. These are all two-parameter distributions completely characterized by a scale and a shape parameter (of coursean additional parameter in the form of a raindrop concentration or arrival rate is necessaryto fully characterize actual, not normalized, raindrop size spectra). The widely usedexponential distribution is a special case of both the gamma and the Weibull distributions andcan be closely approximated by a lognormal distribution. It can be shown that the momentsabout the origin of all these distributions (including their truncated forms) exhibit a similarfunctional form. They are all products of two terms, where the first term is a function of thescale parameter and the order of the moment and the second term is a function of the shapeparameter and the order of the moment. In the case of the lognomml distribution the formof both these functions is particularly simple, namely power laws, whereas for the gamma andWeibull distributions this is only true for the first function.
Based on this observation, it was possible to derive simple analytical expressions for classicaldimensionless distribution shape parameters such as the coefficients of variation, skewnessand kurtosis and for characteristic sizes, dimensionless shape parameters and functionalcorrelation coefficients introduced in the literature on raindrop size distributions-. Thisaccomplishment, although of limited importance in itself, stimulated belief in the fact that itwould be possible to derive closed form expressions for two more important problems thatrecently received attention in the literature: the properties of the sampling distributions ofrainfall integral parameters and radar observables (Smith et al., 1993) and thedependence ofthe coefficients of power law relationships between rainfall integral parameters and radarobservables on the parameters of the raindrop size distribution (Smith, 1993; Smith andKrajewski, 1993).
Smith et al. (1993) presented the results of a Monte Carlo simulation study towards thesampling distributions of (among others) normalized rainfall integral parameters and radarobservables, i.e. the ratios of sample and the corresponding population values. Based uponthe same assumptions, namely that the raindrop concentration follows a Poisson distributionand that the sample volume is independent of the raindrop size distribution, analyticalexpressions were derived for all relevant statistical properties of these sampling distributions.These expressions are valid not only for the exponential raindrop size distribution as in Smithet al. (1993), but for the general case of a gamma, Weibull or lognormal distribution. Oneimportant conclusion that can be drawn from this theoretical exercise is that although thesampling distributions are indeed highly skewed toward underestimation for smaller sample
29
sizes (as was shown by Smith et at. (1993)), on the average the sample values equal thepopulation values.
Smith (1993) and Smith and Krajewski (1993) presented modeling studies of raindrop sizedistributions and rainfall rate-radar reflectivity relationships. Using basically the sameassumptions as Smith et al. (1993), they tied the sample-volume process to the drop-arrivalprocess and demonstrated the importance of the temporal (co)fluctuations of the parametersof the raindrop size distribution. As far as the dependence of the coefficients of power lawrelationships between rainfall integral parameters and radar observables on the parameters ofthe raindrop size distribution is concerned, two approaches can be distinguished, namely aphysical-deterministic and a statistical. The first approach is associated with the (ratheracademic) problem of determining the power law coefficients from a set of rainfall integralparameters and radar observables corresponding to one raindrop size distribution. Since thisproblem contains more unknowns than equations, it is generally tackled through eliminationof the most sensitive raindrop size distribution parameter(s). The second approach isassociated with the (more practically relevant) problem of determining the power lawcoefficients from sets of rainfall integral parameters and radar observables corresponding toa time series of raindrop size distributions. Since this problem contains more equations thanunknowns, it is generally tackled through linear regression of the logarithms of the rainfallintegral parameters on the logarithms of the radar observables.
Due to the convenient functional form of the moments of the lognormal distribution, it waspossible to derive various interesting relationships between power law coefficients anddistribution parameters for this particular distribution. For instance, it was derived that theobservation of three integral parameters of the lognormal raindrop size distribution allows thecalculation of a fourth through a simple power law relationship with coefficients that areindependent of the parameters of the raindrop size distribution. Of more practical interest arethe analytical expressions derived for the coefficients of statistical power law relationships forsingle and dual parameter radar observation in terms of the variances of and covariancesbetween raindrop size distribution parameters.
CONCLUSIONS AND ADDITIONAL REMARKS
(0 A study to examine the effect of a number of adjustment methods - using anincreasing number of adjustment raingauges - on the accuracy of radar rainfallestimates and to evaluate the accuracy of radar derived rainfall amounts forhydrological purposes, in particular their application as input for a rainfall-runoffmodel of a regional sewer system, has been completed.
i) A set of data from the KNMI C-band weather radar, colocated X-band andmultiparametcr S-band research radars (both operated by TUD) and a network oftipping bucket raingauges sampling an urban area within the Water Authority ofDelfland has been collected. Software to process these data and to integrate andanalyze them is currently being developed. It is anticipated that the first results of anested approach adopted to tackle the associated spatial and temporal samplingproblems will become available early in 1994.
(iii) Several theoretical models have been developed which describe different aspects ofthe space-time structure of rainfall at the droplet scale and radar and raingauge measurements. They are currently being applied to a large dataset of dropsize spectra
30
collected at the KNMI and it is anticipated that the first practical results will becomeavailable early in 1994. Collaborative work with the French group hasbeen arrangedon further development and hydrological application of an available rainfall-radar-raingauge simulation model.
REFERENCES
Assem, S. van den (1991). Calibration of weather radar data in The Netherlands. In:Hydrological Applications of Weather Radar (eds. I.D. Cluckie and C.G. Collier).Ellis Horwood, Chichester, pp. 15-24.
Hakvoort, H.A.M., Uijlenhoet, R. & J.N.M. Stricker (1993). Accuracy of radar rainfallestimates compared to raingauge measurements and a hydrological application. Report41, Dept. of Water Resources, Agricultural University, Wageningen, 69 pp.
Smith, J.A. (1993). Marked point process models of raindrop-size distributions. Journal ofApplied Meteorology, 32, 284-296.
Smith, J.A. & W.F. Krajewski (1993). A modeling study of rainfall rate-reflectivityrelationships. Water Resources Research, 29, 2505-2514.
Smith, P.L., Liu, Z. & J. Joss (1993). A study of sampling-variability effects in raindropsize observations. Journal of Applied Meteorology, 32, 1259-1269.
Uijlenhoet, R. (1993). Radar measurements and simulations of precipitation: amulti-polarizedFM-CW Doppler radar perspective. Proceedings of the 4th International Conferenceon Precipitation (Hydrological and Meteorological Aspects of Rainfall Measurementand Predictability), The University of Iowa, April 1994, 130-131.
31

Institution: Instituto da Agua (INAG), Portugal
Pro'ect Leader: Vit6ria Silva
Institutions c ratin : Instituto de Meteorologia (IM)
CEHIDRO - Instituto Superior Tecnico
Title of rosect: STORMS, FLOODS AND RADAR HYDROLOGY
MAIN OBJECTIVES
The main goals of the project are:
Adjustment of radar estimates of precipitation with raingauge data;Very short precipitation forecasting using weather radar;Use of weather radar to develop and to implement flood warning systems.
METHODS AND MATERIALS
The weather radar system used in the project is based on an old C-band weather radar sitedat Lisbon Airport. Precipitation and flow data are available from the hydrometric network inthe area covered by the weather radar. Development of real-time rainfall-runoff models in theAlenquer river catchment area are supported by telemetering raingauge and water stagestations at Olhalvo and Ponte Barnabe.
The following tasks surnmarise the activities that are being undertaken:
(I) Development and assessment of algorithms for adjustment of radar estimates ofprecipitation with raingauge data;
Very short precipitation forecasting based on radar data using numerical algorithmsfor simulation of rainfall intensity fields;
Improvement of rainfall-runoff models in flood-prone areas. Emphasis will be placedon models appropriate for flood forecasting application using spatial radar dataavailable on a square grid;
Application of available rainfall-runoff models using both statistically calibrated radardata and rainfall data. Comparative analysis of the results;
Studies of selected flood-prone areas in order to improve prevention and control ofthe risks associated with floods.
32
RESULTS
Development and assessment of algorithms for adjustment of radar estimates ofprecipitation with raingauge data
Existing algorithms for adjustment of radar estimates of precipitation with raingauge data havebeen further developed. Improvements were introduced in the Kalman filter technique usedfor generating the calibration factors. An algorithm based on multiquadratic interpolation hasalso been developed to generate a calibration surface using the above mentioned calibrationfactors. The new algorithms were implemented in a software package running in the computersystem environment where radar data are being processed on-line and its performance wassuccessfully assessed using 154 hours of rainfall data over a 256 km' area of hydrologicalinterest.
Very - short precipitation forecasting based on radar data
The performance of the existing software package based on an echo centroid trackingalgorithm was assessed using 623 hours of rainfall data. Three different success indices werecomputed for various time periods up to 3 hours. The results of this assessment study, namelythe values obtained for the Critical Success Index, suggested the need for furtherimprovements. As a consequence, the echo centroid tracking algorithm was relinquished anda new one based on cross-correlation between images was developed and implemented in asoftware package to run in the computer system environment where radar data are beingprocessed. The new software package was assessed using the same data and better resultswere obtained for the Critical Success Index. Along with this performance analysis the speedand direction of echo pattern movement were computed.
Rainfall - runoff modelling
Work on rainfall-runoff modelling was developed on various fronts, related to the followingtopics:
(I) Digitisation and archival of historical graphic records of precipitation and river waterstage;
Quality control, retrieval and processing of digitised hydrological data;
Digitisation and archival of geographical elements of the catchment area;
Retrieval in graphical form of the digitised geographical elements of the catchmentarea;
Remote polling of rainfall and river water stage stations;
Hydraulic modelling of the flow of the Alenquer river through Alenquer village.
In the context of topic (I) the following four programs were developed:
33

DIGI: monitors the other three programs.SIFDIA: digitises and archives graphical chart data from siphon raingauges.BASDIA: digitises and archives graphical data from tipping bucket raingauges.LIMNI: digitises and archives graphical water stage data.
The full description of topic (I) can be found in the internal report (in Portuguese)"Digitisation of hydrological variables records: rainfall and water stage".
In the context of topic (2), quality control, retrieval and processing of the hydrologicaldigitised data, the following programs were developed:
DSIFM: draws the siphon raingauge digitised records, a month per page.RSIFM: makes detailed reports on amounts of precipitation, either on paper
or on disk files.DBASM: same as DSIFM, but for tipping bucket raingauge.RBASM: same as RSIFM, but for tipping bucket raingauge.
In the context of topic (3), digitisation and archival of geographical catchrnent basin elements,the DIGITA program was developed, which can handle the various cartographic coordinatesystems used in Portugal.
In the context of topic (4), retrieval in graphical form of the digitised geographic catchmentarea elements, the DESENHO program was developed, which draws the data in any media(display, printers and plotters, as well as exporting the data to other software systems).
In the context of topic (5), remote polling of rainfall and river water stage stations, thefollowing five programs were developed:
TESCOM: tests communications between computers.DESCK: describes the information of the communication.TELECOM: friendly communication with the remote stations.CONVUDO: translates the communications to the digitised rainfall database.CONVLIM: translates the communication to the digitised water stage database.
Also in this context, the entire Olhalvo rainfall station was revised, the tipping bucketraingauge calibrated and the first INAG water stage remote pollable station (solar powered)was installed near Barnabe bridge in Alenquer village.
In the context of topic (6), hydraulic modelling of the flow of the Alenquer river throughAlenquer village, field surveying furnished the cross sections needed by the HEC2 model.This model has been installed and, although still not calibrated, has provided order ofmagnitude estimates of the limiting discharge in Alenquer.
The work on this set of topics has proved essential in conceiving a flood warning system forAlenquer village. Indeed, the analysis of historical records would have been impossiblewithout the above data management tools. Similarly, work on hydrological distributedmodelling, whilst still at an initial stage, could not progress without a geographic informationsystem incorporating Portuguese maps. Furthermore, real-time calibration of radar rainfalland operation of hydrologic and hydraulic models cannot be done without real-time data. Inthis context, it is important to stress that for the first time INAG has installed and is runningremotely polled rainfall and water stage stations.
34
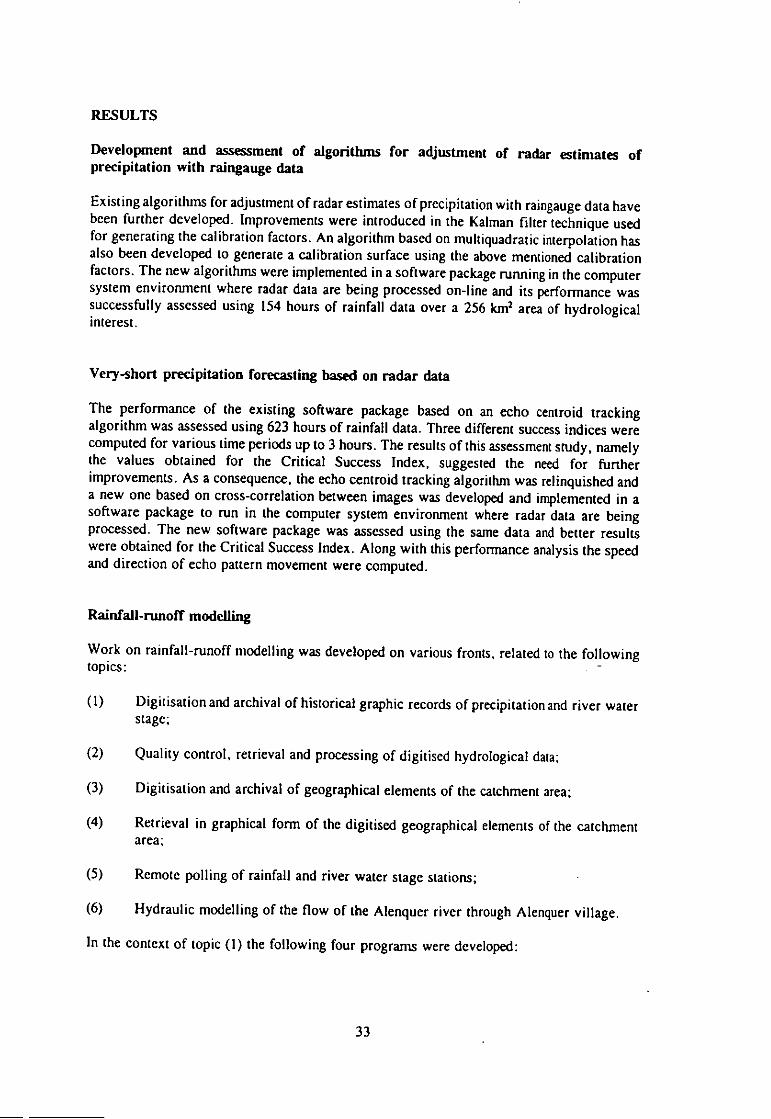
Finally, the water surface modelling ot the Alt:miner river through Alenquer
dramatic:all\ and in:qui:Ink II!hided 'Figure I) shov,ed Mat the illillil pressure on the Ileedplamhas sitting] \ ICLI ceLl the i.oinergence tit the dittilllet 111;11111V dt Ihe bral)4es Sta ('atarmaand Aguas (Itmie., 2 ,ind ) A. a ieil1 . en a !clam el% sinall discharge()) len m s can
result in flooding ol the \ ill:we It is foreseen that neYt yeat i WM41111114 System can becompletely .ind eskiblished
-"4 1.12•44.1
Figure 1 Flood inurA, iii 'lletie/lIet
REFERENCES
Ilipolito. J N A. R êc Nt.icedo, Ni F lYfl! nwitalitacae, dc ReviNiy. die A:a/Nivel.,
IlellIll Ica, e I mmigramas (Inletnal repel! In l'ortiwuese)
Rosa Dias, 1A1 1992)) Performance ()I a Very Short-range Precipihtion Forecasting
echmune based on Radar Observations Work hon on Rout/eli l'hy.stn /or Radar
Snub e‘.. n of, Orr Jan( 194)5
N A l< c Ilipolito. A. 1 (Po)) hstacao !ue tidometrica de nlhalvo,
l)esclicao e miettligavao (Internal repo!! In Portuguese)

26
24
22
Rio Alenquer
0=100 m3/s
(1=0An)
Pte,
E.
Santo
Pte.
Sta.
Isabel
Pte.
pedonal
CD
4-) 20
a
6
S.
Catarina
P.
Estacionanento
n992.00
OistgOcia (fr)
140.00 496.00 1488.001984.00
Figure 2 Alenquer River longitudinal profile through Alenquer village
Rio Alenquer
0=100 m3/5
26 Seccdo 11.1000
(Parque de estacionamento)
26
24
52 Sn=3 3
a M3
zo
16-76 99 -49 02 -22 65 4 52 31 62
Distäncla OTU
Figure 3 Cross-section upstream of Sta Catarina bridge, Alenquer village
36

Finally. the \\ Ater \lillace modelling ot the Alt:miner river through Alcnquetdrainaticalk and treguyntly flooded (I lellre I. `,hOweti that the inhan pressure un the floodplain.has strongly ieLltLed the comergyuce ot the clunnel nminly al the bridyys Sta Catarnmand Aguas thguics 2 and 31 As a i esilit. \ en a relato, (Hy small discharge ot I 00 ii s I can
result in flooding of the village It is foreseen that itc\ t year a warniny system Can hecompletek and sikgcssttilk estahlishyd
87
"re^ .
Figure I flood nN 1Icnocr
RE F ER ENCES
N \ P v Nlacedu, NI If Pnilt DciudIriacm Ic RQnst,,, (IC v;thavetsllidiiloeics thoylAIII.P, c I Iuitu'rnnas (Internal report In INginguese)
Rosa Dias, NI P ILFR) Performance of \ civ Slitgl range Precipitation ForecastingTechnique lygyd oil Ridir uh,vir WIR hop on R,Inful pn,,u( s for moor
Hdr, •0,ncl how I
N A lliPchuo, A l• ( 1993) 1..,hc:do Tcle 100111(.21Hk:a tIe "thalvo,lkscrictio Lrirc-rToca I Intyinal tepplt In Puriugueset

26
24
Pio Alenquer
0=100 813/6
(1=093)
22 -------
-71;
10
20
Li
Pte.
pedonal Pte.
E.
Santo
Tri
a
a
16
LUa
id0 00 496 00
n
992.001468 0
0
DistgrIcia (m)
19B4 00
Figure 2 Alenquer River longitudinal profile through Alenquer village
Ric Alenquer
G-100 m3/5
28Seccad 11 . COO
(Parque de estacionanent0)
2 6
24
3
linr3
•
3 ciCE
20
fa
16-76 99 -49 92 -22 65 4 52 31 69
DIsrenc la (49
Figure 3 Cross-section upstream of Sta Catarina bridge, Alenquer village
36

Institution: Direzione Regionale della Protezione Civile Regione Friuli-Venezia Giulia
Pr 'ect Le r: Prof. Sergio Fattorelli
Institution coo ratin : Università degli Studi di Padova
Title of r Sect: STORMS, FLOODS AND RADAR HYDROLOGY
MAIN OBJECTIVES
The scientific goals of the project involve investigation into the following:
analysis of the heterogeneity of the Vertical Profile of Reflectivity (VPR) anddevelopment of techniques able to identify VPR in order to improve ground rainfallestimation;
local rainfall forecasting using raingauge networks and weather radar;
use of advanced statistical methods to combine radar and raingauge rainfall data;
development of lumped and distributed real-time flood forecasting models usingradar, digital elevation data derived river networks and soil/landuse data; comparisonof different techniques for the updating process.
METHODS ANI) MATERIALS
The study will employ radar data primarily from the Doppler C-band weather radar withmultiple beam facility at Monte Grande hill. The area scanned by the radar covers a numberof mountainous, flood prone catchments. Volume scans and identification techniques will beused to investigate the experimental spatial distribution of the VPR, while the use of asimulation approach will allow testing of the accuracy of identificationtechniques in situationswhere attenuation of the echo signal is relevant and depends on the VPR itself (i.e. brightband). The raingauge network connected with the system will be used to assess radarestimates of rainfall rate and to merge remote sensing and ground based estimatesof rainfall.Particular attention will be devoted to the identification and removal of bias between the twoestimates. Techniques developed under an earlier_CEC project will be extended to VPRidentification, and the influence of the improvement of radar-based ground rainfallestimation
• on flood simulation in mountainous catchments will be assessed. Data from a number ofbasins located in mountainous regions will support the research on flood modelling and real-time forecasting.
37

RESULTS (JANUARY TO DECEMBER 1993)
VPR identification and analysis
A methodology was developed for testing an existing technique for Vertical Profile ofReflectivity (VPR) identification, the method considers the VPR constant along the range andis based on the radar reflectivity measurements of at least two elevation angles (PPIs). Itinitially computes the ratio between the radar reflectivity measurements at the diffcrentelevations, which filters out the horizontal variability in the reflectivity fields. Subsequently,the computed ratio values are used in the VPR identification procedure via a system of non-linear equations where the solution is the VPR values at discrete altitudes in the atmosphere.Two schemes for testing the VPR identification method were introduced. The first one usessynthetic radar reflectivity data from a three-dimensional radar-reflectivity simulation model.The model combines two dimensional synthetic rainfall fields, generated from a stochasticspace-time model, with physically-based simulation of the hydrometeor phase and the radarmeasurement sampling volume integration process. Particular attention was paid to the correctparameterisation of the rainfall models (Bacchi & Borga, 1993). The second approach usessimulated radar reflectivity measurements from the previous model based on the 1986COHMEX convective storm. Sensitivity of the identification method to different factors, suchas the radar characteristics and the distance from radar, was assessed.
Flood forecasting
Earlier work on comparison of different real-time flood forecasting models and on theimprovement from available radar-based rainfall estimates has focussed attention on buildinga framework for assessing the accuracy of different updating techniques using various formsof rainfall estimate. A model was built for real-time flood forecasting based on thecombination of a Probability Distributed soil moisture accounting model (PDM) (Moore,1985) with a simple linear transfer function, and operating in an adaptive mode through astate updating procedure or a parameter updating procedure. The state updating technique isbased on a Kalman filter algorithm. The differentiability of the algebraic expressions and thefew parameters employed in the model allow reliable parameter estimation procedures to beused. After an objective function is calculated, formed as the sum of squares of thedifferences between observed and calculated discharges, a function minimisation method canbe employed for parameter estimation and also for on-line calibration.
As a first step, particular attention was paid to the identification of a transfer function basedon digital elevation data derived river network. In this work channel networks were identifiedemploying the method based on the work of O'Callaghan and Mark (1984). In this type ofalgorithm, a threshold area is chosen and all cells with more contributing cells than thethreshold area are included as part of the drainage network. In this way the threshold area,A,, represents the minimum support area required to drain to a point for a channel to form.Hence different threshold area values can be chosen to derive networks of different drainagedensity. The effects of threshold area selection, both on the morphometric and scalingproperties (such as drainage density, total channel length. Horton's laws and fractaldimension) (Helmlinger et al., 1993), and the associated network hydrologic responsefunctions, were analysed.
For these purposes firstly automatic procedures were developed for obtaining a quantitative geomorphic description of the basin and its DEM data derived network using the ordering scheme proposed by Horton and Strahler. Hence two different hydrologic response models,
38

obtained in the framework of the Geomorphologic Instantaneous Unit Hydrograph (GIUH)theory, were considered. In the first model the function is parameterized in terms of theassociated Strahler stream ordering system, where the geomorphologicdescription of the basinis given by Horton's laws; the second model is obtained by averaging a flow equation withrespect to the network structure that is described by the width function. Applications wereperformed for the mountainous basins of the Torre and Posina rivers and the differentresponses obtained by the DEM data derived network for different threshold area values wereanalysed.
The variability of geomorphic parameters results in an unpredictable instability of thebehaviour of the transfer function model with respect to different threshold area values whenthis is obtained using the Strahler ordering system. Figure 1shows how these drastic changesresult in the unpredictable differences existing through unit hydrographs obtained fromdifferent A, values. Figure 2 shows how the model based on the width function is able toreduce the effects of the variability of morphometric characteristics on the response. A regularreduction of the lag time of the IUH as A, increases can be observed. This is due to thenetwork centroid approaching the outlet as the drainage density decreases as the result ofremoving many lower order streams. Moreover it is shown that the shape of the IUH is betterrelated to the actual structure of the channel network.
REFERENCES
Bacchi, B. & Borga, M. (1993) Spatial correlation patterns and rainfall field analysis.Excerpta.
Helmlinger, K.R., Kumar, P. & Foufoula-Georgiou, E. (1993) On the Use of DigitalElevation Model Data for Hortonian and Fractal Analyses of channel Networks.Water Resour. Res. 29(8), 2599-2613.
Moore, R.J. (1985) The probability-distributed principle and runoff production at point andbasin scales. Hydrological Sciences Journal, 30, 2, 273-297.
O'Callaghan, J.F. & Mark, D.M. (1984) The extraction of drainage networks from digitalelevation data. Comput. Vision, Graphics Image Process, 28, 323-344.
39

0.4
0.3
0.2
v v 2.0 m/s
—— At 0.0576 km2
At0 1162 km2
At v! 0.2300 km.2
At • 0.6912 km2
0.1
0
0 1 2 3 4 5 6 7 8
time (hr)
Figure I Effects of threshold area on geomorphologic instantaneous unit hydrographobtained by digital elevation data derived networksfor the mountainous TorreRiver basin. GIUH is based on the Honon-Stahler ordering system.
0.4
— v./ 2.0 m/s
-----' / D=1000 mats0.3\ ';. /
— — — — At = 0.0576 km2/ 1 \,N
r / At = 0.1152 km2
C . m
0.2 ; i At - 0.2304 k2—
= / \,,,, =. 1 \ \ \
/ , ‘—
/ \ , \\ \ At t 0.6912 krn2
0
0 1 2 3 4 5 6 7 8
time MO
Figure 2 Effects of threshold area on geomorphologic instantaneous unit hydrographobtained by digital elevation data derived networksfor the mountainous TorreRiver basin. GRIN is based on the width function.
0.1
N7*,
40
Institution: National Technical University of Athens, Greece
Project Leader: m A Minukou
I titutions oo ratin :
Title f ro'ec : STORMS, FLOODS AM) RADAR HYDROLOGY
MAIN OBJECTIVES
The research is primarily focused on the implementation of weather radar for hydrologicalapplications and especially for spatial rainfall measurement and estimation, and consequentlyfor storm and flash flood forecasting and warning.
More specifically the scientific goals of the project involve research in the following areas.(i) analysis and processing of acquired radar reflectivity data sets, (ii) development of methodsfor local short-term rainfall forecasting using weather radar, and (iii) development ofprocedures for flood flow forecasting using weather radar.
METHODS AND MATERIALS
The study involves the use of a digital WSR-74 S-band weather radar system. The radar scanarea covers a significant part of Central and Northwestern Greece including the twocatchments of research interest, namely the Venetikos and Pyli basins with drainage areas of817 km' and 135 km' respectively. The basin of Pyli is combined with three other basins inorder to form a large basin, the Pinios river basin with drainage area of 2763 km', for abetter utilisation of the weather radar. Twenty five recording raingauges over the two basinsare used to support the research by providing ground truth. The study will employ and extendthe methods and procedures developed under an earlier CEC project for the assessmentof theaccuracy of rainfall measurements (Mimikou, 1992). A number of storm events are analysedand processed. Techniques relating to ground clutter suppression, anomalous propagation,beam refraction and merging procedures have been developed. These techniques have beenutilised in the implementation of weather radar for short-term rainfall forecasting andconsequently flood-flow forecasting. For each storm event, on-site raingauge observations andsurface and upper-air meteorological data are obtained. Rainfall forecasting is focused on thedevelopment and comparison of two different approaches, namely the linear extrapolation ofthe centroids of features of rainfall cells and the cross-correlation of radar rainfall fields.Finally, attention will be paid to the evalnation of existing rainfall-runoff models and thedevelopment of a distributed flood forecasting model to be used in conjunction with radarrainfall data, both forecast and observed.
41

RESULTS TO DATE
The results to date are reported under three major topics of the project, namely analysis andprocessing of radar data for rainfall estimation, development of short-term rainfall forecastingmethods and development of a lumped and distributed rainfall-runoff model.
Analysis and Processing of Radar Data
Despite the efforts to maintain a high level of quantitative accuracy in estimating rainfall usingweather radar data, it is certain that errors will be encountered in these estimates. Indeedthere is a variety of factors that can cause systematic, random, and range dependent errors.These errors can result from the drop-size distribution determining the Z-R relationship,ground clutter occultation and shielding, anomalous propagation, abnormal beam refractionand losses, interference of signal from targets other than rain, attenuation in the atmosphereand calibration of the electronics of the radar (Mimikou et al., 1993c). Suitable rainfall eventshave been identified for the assessment of the accuracy of rainfall estimation. Initially aground clutter map was utilised for the detection and suppression of the ground clutter fromradar rainfall fields. The Z-R relationship used for the conversion of the reflectivities torainfall rate was the Marshall-Palmer exponential form where a=200 and b=1.6. Theinfluence function method, which is able to identify observations which are inconsistent withthe spatial correlation in the radar field, has been employed. Two different approaches,namely the Kalman filter method and the Brandes method, have been employed to mergeradar and raingage rainfall information and thereby improve radar rainfall estimates in anumber of storms. An attempt has been made to explain quantitatively the rainfall amountsindicated by the two different measurement techniques.
Rainfall Forecasting
A basic rainfall forecasting scheme including two different modified approaches, namely thelinear extrapolation of the centroids of features of rainfall cells and the cross-correlationanalysis of radar rainfall fields, was developed for short-term rainfall forecasting (Baltas etal., I993a, b and c). In the first approach centroids of features of rainfall cells at one timeare matched with those at a subsequent time. Constraints are usually applied to the calculatedmotion to aid the matching procedure. Figure 1 shows two successive radar rainfall fields attime tc,and t1 used for the definition of the centroids of the features of rainfall cells (shadedarea).
The second method using a cross-correlation technique is also used to match portions of oneradar image with portions of subsequent ones. The computation of the velocity of a spatialrainfall pattern used for the translation of the current field requires the calculation of thecorrelation coefficient between the two known spatial rainfall fields at time c and t, as shownin Figure 2a and b. The radar field at time t1 is shifted a single grid point at a time on the x-yplane for both directions tit. ±y and the correlation coefficient between the two fields attime c and ti only for the overlapping region each time is calculated. Figure 2c shows theradar field at time t, shifted right a single grid point. For the overlapping region between thefields at (a) and (c) (the shaded area) the correlation coefficient is calculated.
42

RADAR FIELD AT TIME RADAR FIELD AT TIME t1
:41U I
Dh.
Figure 1 Definition of features of rainfall cells above the threshold (I mm/lm) at timesto and I.,.
RADAR FIELD AT TIME t
D
DOCD nem(a)
RADAR FIELD AT TIME t SHIFTED RADAR FIELD AT TIME ti
11 1.1033 :.^;!,Si!.1'.'i!;:.z,4.4.33"a7•1&uou
1.0;1101
•
V:MOD loam)
(1)) mlou(c)
Figure 2 Procedure of cross-correlating the different radar fields.
43

A series of storm events have been analysed with both methods. Various lead-time rainfallforecasts were compared against the rainfall amounts observed on the ground during theforecast interval. Forecasting results evaluated by statistics such as the radar calibrationfactor, the mean catchment error and mean absolute difference are of acceptable accuracy.
(iii) Flow Forecasting
Application of a region- wideflood forecasting system
Initially the well known HEC1F flood forecasting model has been applied to the Venetikosand Pyli basins. The rainfall-runoff model HEC1F makes short-term forecasts of flood-runoffusing a two-parameter unit-hydrograph model, a two-parameter loss model and a three-parameter base flow model. The HEC1F model was calibrated twice, once in a lumpedmanner using the entire basin and again in a semi-distributed manner by dividing the basininto a number of sub-basins in order to incorporate the extreme spatial variability of the stormevents and accurately simulate the evolution of the resulting flash-flood in the study region(Mimikou et al., 1993a and b). A number of storm events were used to demonstrate thequality of calibration of the model. It has been shown that the model performs better in thesemi-distributed than in the lumped form, thus justifying the modifications made to the initiallumped form of the model. Furthermore, the HEC1F model was applied using as rainfallinput the average radar rainfall over the basin in order to take into account the extremelyuneven and non-uniform rainfall distribution in the study region. As depicted in Figures 3 and4, the model's performance appears to be improved when applied using weather radar data,thus encouraging the use of weather radar for flood flow forecasting.
Development of a distributed flood forecasting model
The results of the previously mentioned study support the idea of developing a flood flowforecasting model in a fully distributed manner on a 2x2 km' or 4x4 km' grid networkcombined with distributed on-site and remotely sensed rainfall input information from thenearby S-band radar. This part of the research project is focused on deducing basin structureand isochrones from a digital elevation model (DEM) represented by an array of elevationsz(x,y) for integer x and y ignoring the effects of inertia, friction, and infiltration into the soiland sink holes. An instantaneous unit hydrograph (IUH) model will be applied to transformexcess rain by a transfer function for each grid square dividing the basin. Optimisationtechniques such as the minimisation of the sum of squares between the model forecasts andobserved flows will be employed for on-line estimation of parameters. Parameter estimationtechniques will be employed to improve the performance of the flood forecasting model.
CONCLUSIONS AND ADDITIONAL REMARKS
(i) An assessment of estimation of spatial rainfall fields over basins of hydrologicalinterest has been conducted. Data quality control methods in terms of ground cluttersuppression, anomalous propagation as well as development and assessment ofalgorithms of deterministic and stochastic procedures for merging radar and raingagedata have been completed.
44

120
cu 100
80
60
40_c
20
o
Observed
Computedby usingradar
Computedby usingraingages
E vent of 18-11-92
4
40 600 20 80 100
TIME (hours)
Figure 3 Observed and modelled flood hydrographs based on raingauge and radardata
Six-hour forecast by using radar
20) 120 ObservedC-n- 100
cri u8
,-
40 ,./,,---
brayduasring
<E 80 Compudr,......60
.cu 20,co Six-hour3 0 i - i
forecastby0 10 20 30using radar
TIME (hours)
Figure 4 Six-hour forecast using radar data
45

High resolution short-term rainfall forecasting using weather radar data including twodifferent modified approaches, namely the linear extrapolation of the centroids offeatures of rainfall cells and the cross-correlation of radar rainfall fields, have beenestablished .
Initial results have shown that weather radar data are used for flash flood forecastingtaking into account the extremely uneven and non-uniform spatial rainfall distribution.Therefore, the development of a fully distributed flood forecasting model arises as anecessary task.
The principal investigator Mr. E. Baltas attended a special interest workshop on RainfallPhysic for Radar Studies in Barcelona, Spain, June 1-2, 1993, where a paper was presented.A visit to Professor Fattorelli's group in Padova is being arranged for early next year in theframework of establishing collaborative links between the two teams involved in floodforecasting research.
REFERENCES
Baltas, E.A. (1993a) Intercomparison of two different methods for rainfall forecasting. Paperpresented at the special interest workshop on Rainfall Physics for Radar Studies. June1-2, 1993, Barcelona, Spain.
Baltas, E.A. & Mimikou, M.A. (1993b) Short-term rainfall forecasting by using radar data.International Journal of Water Resources Development, Vol 10, No I.
Baltas, E.A. (1993c) Rainfall and Flash Flood Estimation and Forecasting by using RadarData. PhD plan of work, Dept. of Water Resources Hydraulic and MaritimeEngineering, National Technical University of Athens.
Mimikou, M.A. (1992) Weather Radar and Storm and Flood Hazards: Final Report, ContactNo. EPOC-CT-90-0026, December, 1992, 12 pp, National Technical University ofAthens.
Mimikou, M.A., Baltas, E.A. & Borga, M. (1993a) Flash-flood Forecasting by using theHEC1F Model. International Symposium of Engineering Hydrology, ASCE,Hydraulics Division; July 25-30, 1993 San Fransisco, USA.
Mimikou, M.A., Baltas, E.A. & Borga, M. (1993b) Improving the Efficiency of the HEC1FModel in Flood-Flow Forecasting. International Journal of Modelling and Simulation,(IASTED), Vol. 15, No. 1 (in press).
Mimikou, M.A., Baltas, E.A. & Anagnostou, E. (1993c) Rainfall Estimation by UsingWeather Radar and Raingages. Technika Chronika Scient. J., Technical Chamber ofGreece (in Greek).
46

Institution: Institut fuer Wasserwirtschaft, Universitaet Hannover, Germany
Pro'ect Leader: Dr. Hans-Reinhard Verworn
Institutions c ratin : Deutscher Wetterchenst (German Weather Service)Emschergenossenschaft
Title of r • t: STORMS, FLOODS AND RADAR HYDROLOGY
Operational Integration of X- and C-Band Data and Relevance of Rainfall Forecasts forReal-Time Control of Storage Facilities
MAIN OBJECTIVES
The scientific goals of the project involve investigation into the following:
I. Improvement of the accuracy of rainfall data and forecasts by combining theadvantages of X- and C-band measurements.
Specification of the required accuracy of forecast radar rainfall fields for successful real-time control.
Quantification of the sensitivity of control decision-finding procedures to inaccurate forecasts.
Investigation and quantification of the significance of differences in the overflow when rainfall data from either radar or ground gauges are used as a basis for thedecision-finding procedures.
METHODS AND MATERIALS
The study will employ rainfall data from a C- and an X-band radar at the same location. Inaddition, rain data from ground gauges and disdrometers will be available. These data willbe processed and used for comparison and evaluation to find suitable procedures for theintegration of all information sources This research will be carried out in close cooperationwith Italy and the Netherlands where C- and X-band data are also collected and processed.
The investigations concerning the control procedures are to be carried out in an urbancatchment with controllable detention tanks, where the overflow is discharged into ratherclean and therefore sensitive creeks. The variation of the rainfalldistribution is generally quitesignificant resulting in a high control potential.
The rainfall-runoff dynamics of the catchment will be simulated off-line as well as on-line
47

with hydrological and hydrodynamic models. Control decision-finding will be carried outusing an optimisation model. The relevance of various forecasting methods and the sensitivityof the control strategies will be tested through simulation of a representative set of rainfallevents with different characteristics.
RESULTS (JANUARY TO DECEMBER 1993)
Adaptation of rainfall-runoff models for the catchment and calibration of runoffparameters
The catchment of the treatment plant Gelsenkirchen-Picksmuehlenbach coversan area of about1200 ha of which 40% is impervious (Ared=475 ha). The area is divided into threesubcatchments (I to III) with a detention basin at the end of each one. Additionally the foulsewage from catchment IV is routed to the treatment plant. Presently, the system is designedto route a maximum runoff of twice the dry weather flow (2 Qdry) of each catchment to thetreatment plant. Surplus runoff is stored in the basins and discharged into thecreeks. Figure 1shows the layout of the system.
Pimping Station Po!Burn Bah Heeen-Beeech
V- KO ma
Hasa. tu
koniteniwt,
V - 1650 ma
BeenGE-Kaesel
s e' two.sad PISS
v.W0P77
0. - 427 he
Ass - 00.77 ha
SUI
- 10 trn
Fig. 1: Schematic layout of the system with control elements
The modelling of the catchment is based on the main sewer system and consists of 39catchment units, resulting in an average unit size of 0.3 km2which is just smaller than thesize of the radar bins for the X-band coverage of the area (0.36 km2, see Figure 2).
48

For the rainfall-runoff simulations a detailed surface runoff model and a hydrodynamic modelfor transport in the sewers have been set up. Additionally a simple linear transport model isused in connection with the control decision-finding. Initial simulation results show asatisfactory compliance with the measured values at the sites of the basins and the treatmentplant. An improvement of the model results is expected when data from additional measuringdevices, now being installed, will be available and used to calibrate the surface runoffparameters in more detail.
Definition of the control system and adaptation of the control decision - finding model
For the application of the optimisation procedure the system had to be further simplified toconsist of nodes and transport elements only (Figure 3). This linearised system providesstorage at certain nodes and routes the runoff down the transport elements to the next nodewith a predefined constant velocity, i.e. with fixed travel times. The maximum runoff rateof the transport elements is set dependant on their capacity. Surface runoff for the catchmentsforms the input at the subcatchment nodes. If the runoff exceeds the capacity of the transportsewer to the next node the excess runoff is modelled to be stored within the catchment.Though these assumptions do not fully comply with the system behaviour more exactlysimulated by the hydrodynamic model, various applications and test runs have shown that thisdoes not affect the validity of the control decisions. The aims for the control decisions weredefined as follows in order of priority:
I) no or minimum surcharge/storage at the catchment nodes;
transport of as much runoff as possible to the treatment plant to make use of its maximum capacity;
no or minimum combined sewer overflow into the creeks.
With the surface runoff of various events, local control as well as global optimal control hasbeen simulated to investigate the control potential of the system. The results indicatesuperiority of the global strategy for all events. While with local control not more than 2 Qin.of each subcatchment is routed on to the treatment plant, the global control strategy allowslarger local runoffs to be routed on if only the total capacity of the treatment plant is notexceeded. The control potential of the system, i.e. the amount of overflow that can bereduced by global control in comparison to local control, will be found by multiple eventsimulations using ground gauge rain data from a 20 year period.
Rainfall data from X - and C - band radars, raingauges and disdrometers
Data from the X-band radar with a spatial resolution of 0.6 x 0.6 km and a time resolutionof I minute have been collected and processed using a mean Z/R relation as well as actualZ/R relations derived from two disdrometers. The unprocessed Z values in polar coordinates(300m x 0.7°) are stored as well to investigate attenuation effects and validity of Z/Rrelations. Due to building activities in the area between the radar site and the nearby buildingof the German Weather Service, where the radar control unit and the computers were located,the cable connection was disrupted. Consequently, the system set-up had to be changed, andthe transfer of all control and computer equipment to a newly installed container just besidesthe radar tower lead to an interruption in data collection.
49

INT 0.6km
1km
Ineeneem C ro n
MainPipe
PumpingStation
DetentionBasin
TreatmentPlant
Fig. 2: Catchment with X- and C-band radar grid
Connection,nostorage
Subcatchment(withstorage)
Detentionbasin(storage)
Treatmentplant(systemoutlet)
TransKftEltracalSTransportsewawithlimitedcapacity
Outletinto creek
Pump
ElementsNodes
•
Fig. 3: Simplified linear system for control decisionfinding
50
The data from the C-band radar of the German Weather Service are supplied with a spatialresolution of 1 x 1 km every five minutes as rain rates derived from a fixed Z/R relationwithout any ground gauge calibration. This provides the possibility to degrade data back toZ values for comparisons with the X-band data. The overlapping fabric of the spatialresolution is indicated in Figure 2. Alternatively, reflectivities in polar coordinates(1 km x 0) may be stored as well.
Data from a set of 19 ground gauges continously and automatically collected by theEmschergenossenschaft are added to the database for evaluations of radar data from both X-and C-band.
CONCLUSIONS AND ADDITIONAL REMARKS
The hydrological and hydrodynamic modelling of the catchment has been found toform a sound basis for the evaluation and forecast of the system behaviour as well asfor the application of the control decision-finding model. Even better correspondencewith the actual runoff is expected when additional measured data can be used tocalibrate the surface runoff parameters.
An assessment of the advantages of global control strategies over local control hasbeen made. The control potential is to be found out by simulating all relevant eventsof a longer period comparing both methods.
Databases for radar and ground rain data have been set up. Software for theevaluation and comparison of the data has been developed. The databaseswill providethe necessary input for the development and assessment of forecast procedures to beused with the control decision-finding.
It is planned to further investigate the quality of the radar data by additionally obtainingvertical profiles. Collaborative work with the UK group at Salford has been arranged onapplying their vertical pointing radar in the catchment area.
51
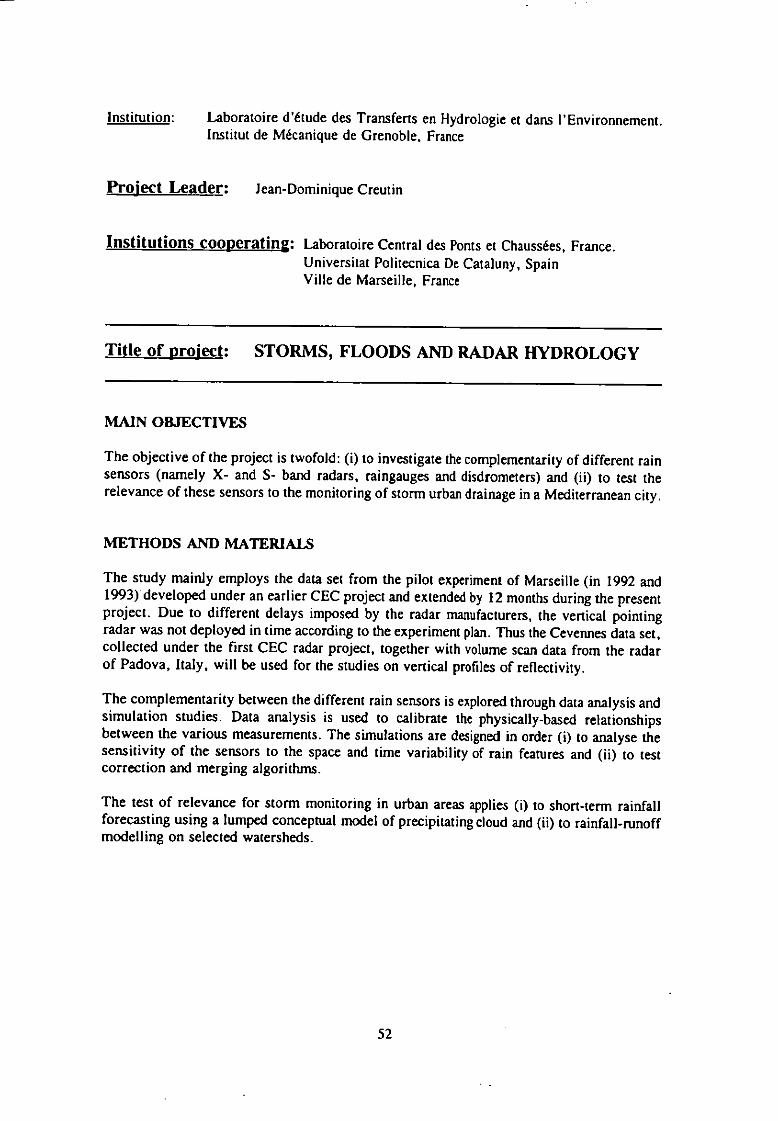
Institution: Laboratoire d'étude des Transferts en Hydrologic et dans l'Environnement.Institut de Mécanique de Grenoble, France
Pro'ect Le der: Jean-Dominique Creutin
Institutions coo eratin : Laboratoire Central de.sPonts et Chaussées, France.Universitat Politecnica De Cataluny, SpainVille de Marseille, France
TM of ro'ec : STORMS, FLOODS AND RADAR HYDROLOGY
MAIN OBJECTIVES
The objective of the project is twofold: (i) to investigate the complementarily of different rain sensors (namely X- and S- band radars, raingauges and disdrometers) and (ii) to test the relevance of these sensors to the monitoring of storm urban drainage in a Mediterranean city.
METHODS AND MATERIALS
The study mainly employs the data set from the pilot experiment of Marseille (in 1992 and1993) developed under an earlier CEC project and extended by 12 months during the presentproject. Due to different delays imposed by the radar manufacturers, the vertical pointingradar was not deployed in time according to the experiment plan. Thus the Cevennes data set,collected under the first CEC radar project, together with volume scan data from the radarof Padova, Italy, will be used for the studies on vertical profiles of reflectivity.
The complementarity between the different rain sensors is explored through data analysis andsimulation studies. Data analysis is used to calibrate the physically-based relationshipsbetween the various measurements. The simulations are designed in order (i) to analyse thesensitivity of the sensors to the space and time variability of rain features and (ii) to testcorrection and merging algorithms.
The test of relevance for storm monitoring in urban areas applies (i) to short-term rainfallforecasting using a lumped conceptual model of precipitating cloud and (ii) to rainfall-runoffmodelling on selected watersheds.
52
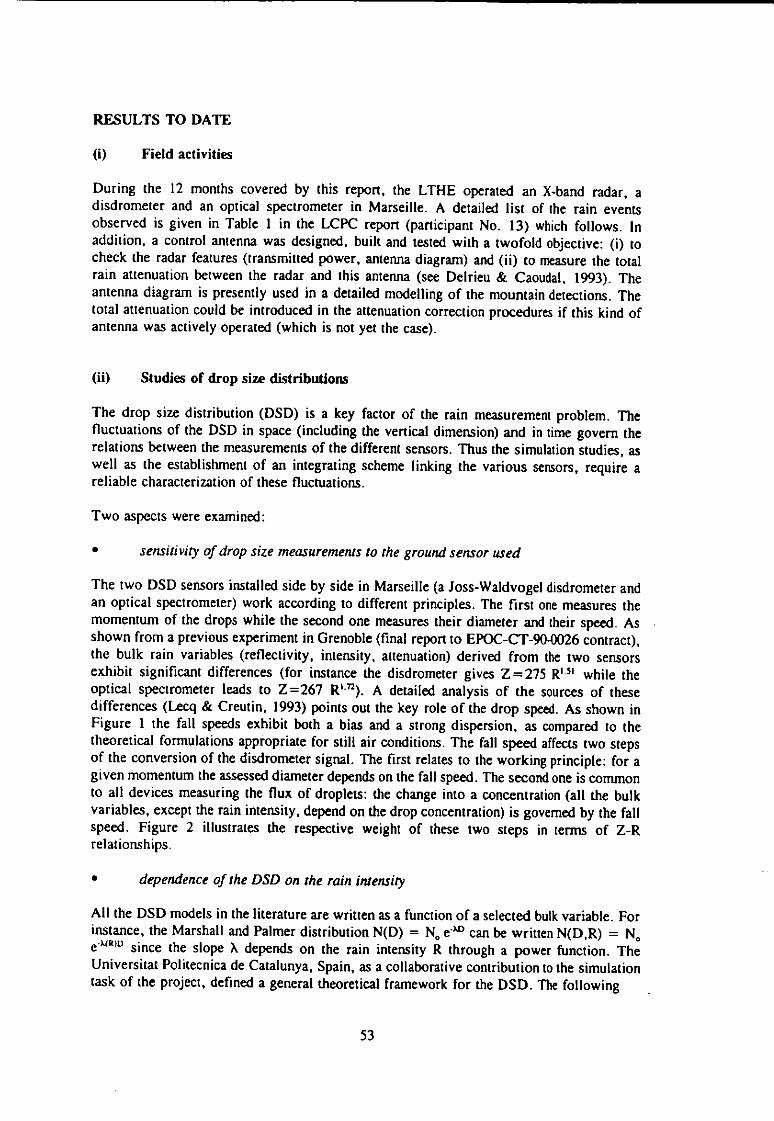
RESULTS TO DATE
Field activities
During the 12 months covered by this report, the LTHE operated an X-band radar, adisdrometer and an optical spectrometer in Marseille. A detailed list of the rain eventsobserved is given in Table 1 in the LCPC report (participant No. 13) which follows. Inaddition, a control antenna was designed, built and tested with a twofold objective: (i) tocheck the radar features (transmitted power, antenna diagram) and (ii) to measure the totalrain attenuation between the radar and this antenna (see Delrieu & Caoudal, 1993). Theantenna diagram is presently used in a detailed modelling of the mountain detections. Thetotal attenuation could be introduced in the attenuation correction procedures if this kind ofantenna was actively operated (which is not yet the case).
Studies of drop size distributions
The drop size distribution (DSD) is a key factor of the rain measurement problem. Thefluctuations of the DSD in space (including the vertical dimension) and in time govern therelations between the measurements of the different sensors. Thus the simulation studies, aswell as the establishment of an integrating scheme linking the various sensors, require areliable characterization of these fluctuations.
Two aspects were examined:
sensitivity of drop size measurements to the ground sensor used
The two DSD sensors installed side by side in Marseille (a Joss-Waldvogel disdrometer andan optical spectrometer) work according to different principles. The first one measures themomentum of the drops while the second one measures their diameter and their speed. Asshown from a previous experiment in Grenoble (final report to EPOC-CT-90-0026 contract),the bulk rain variables (reflectivity, intensity, attenuation) derived from the two sensorsexhibit significant differences (for instance the disdrometer gives Z=275 12" while theoptical spectrometer leads to Z=267 12'). A detailed analysis of the sources of thesedifferences (Lecq & Creutin, 1993) points out the key role of the drop speed. As shown inFigure 1 the fall speeds exhibit both a bias and a strong dispersion, as compared to thetheoretical formulations appropriate for still air conditions. The fall speed affects two stepsof the conversion of the disdrometer signal. The first relates to the working principle: for agiven momentum the assesseddiameter depends on the fall speed. The second one is commonto all devices measuring the flux of droplets: the change into a concentration (all the bulkvariables, except the rain intensity, depend on the drop concentration) is govemed by the fallspeed. Figure 2 illustrates the respective weight of these two steps in terms of Z-Rrelationships.
dependence of the DSD on the rain intensity
All the DSD models in the literature are written as a function of a selected bulk variable. Forinstance, the Marshall and Palmer distribution N(D) = N. eal" can be written N(D,R) = N.ea(R)Dsince the slope X depends on the rain intensity 12 through a power function. TheUniversitat Politecnica de Catalunya, Spain, as a collaborative contribution to the simulationtask of the project, defined a general theoretical framework for the DSD. The following
53

10
-
- . • : :=1•v I.
8
6
4
2
•
0 "0 0.1 0 2 0 3 0.4 0.t
Diametre ( cm )
Vovenne
Vaess• aeCira
V.tente C.unri et Kaurer
Figure 1 Scattergrwn of the fall speed of the rain dropsas a function of their diamtermeasured by the optical spectrometer. Eachpoint represents the mean fallspeed of the drips seen during one minute in each class of diameter. 7hebroken line is the mean value of the one minutemean speeds over all the setsof data. The curves represent the theoreticalfall speed in still air predictedby Gunn and Kinzer (dotted line) and Beard (dashed).
105
(.) a)
10 4
102
Figure 2
020406080100intensite
Z-R relationships derivedfrom the disdrometer (one of the bottom curves) andfrom the spectrometer (top continuous curve). If a theoretical speedrelationship is used in the change of flux intoconcentration to compute Z, themiddle dashed curve is obtained from the spectrometer data. If, in addition,the size of the drops is derived from the measured diamter and speedaccording to the disdrometer principle (momentumconversion to size for stillair conditions) the second bottom curve is obtained.
54
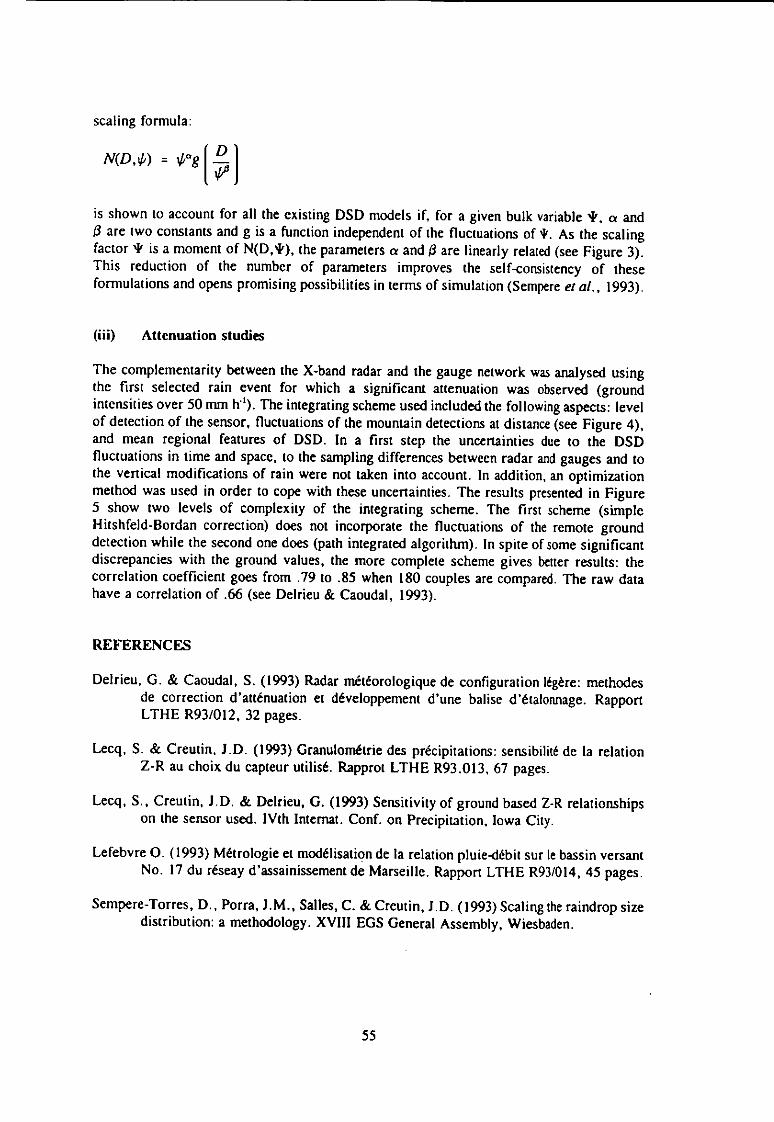
scaling formula:
N(Dok) = I l I
is shown to account for all the existing DSD models if, for a given bulk variable it, a andare two constants and g is a function independent of the fluctuations of 4/. As the scaling
factor 4, is a moment of N(D,*), the parameters a and f3 are linearly related (see Figure 3).This reduction of the number of parameters improves the self-consistency of theseformulations and opens promising possibilities in terms of simulation (Sempere et al., 1993).
(iii) Attenuation studies
The complementarity between the X-band radar and the gauge network was analysed usingthe first selected rain event for which a significant attenuation was observed (groundintensities over 50 mm h''). The integrating scheme used included the following aspects: levelof detection of the sensor, fluctuations of the mountain detections at distance (see Figure 4),and mean regional features of DSD. In a first step the uncertainties due to the DSDfluctuations in time and space, to the sampling differences between radar and gauges and tothe vertical modifications of rain were not taken into account. In addition, an optimizationmethod was used in order to cope with these uncertainties. The results presented in Figure5 show two levels of complexity of the integrating scheme. The first scheme (simpleHitshfeld-Bordan correction) does not incorporate the fluctuations of the remote grounddetection while the second one does (path integrated algorithm). In spite of some significantdiscrepancies with the ground values, the more complete scheme gives better results: thecorrelation coefficient goes from .79 to .85 when 180 couples are compared. The raw datahave a correlation of .66 (see Delrieu & Caoudal, 1993).
REFERENCES
Delrieu, G. & Caoudal, S. (1993) Radar meteorologique de configuration légere: methodesde correction d'atténuation et développement d'une balise d'etalonnage. RapportLTHE R93/012, 32 pages.
Lecq, S. & Creutin, J.D. (1993) Granulometrie des precipitations: sensibilité de la relationZ-R au choix du capteur utilise. Rapprot LTHE R93.013, 67 pages.
Lecq, S., Creutin, 1.D. & Delrieu, G. (1993) Sensitivity of ground based Z-R relationshipson the sensor used. IVth Internat. Conf. on Precipitation, Iowa City.
Lefebvre 0. (1993) Métrologie et modelisation de la relation pluie-débit sur le bassin versantNo. 17 du réseay d'assainissement de Marseille. Rapport LTHE R93/014, 45 pages.
Sempere-Torres, D., Porra, 1.M., Salles, C. & Crcutin,J.D. (1993) Scaling the raindrop sizedistribution: a methodology. XVIII EGS General Assembly, Wiesbaden.
55
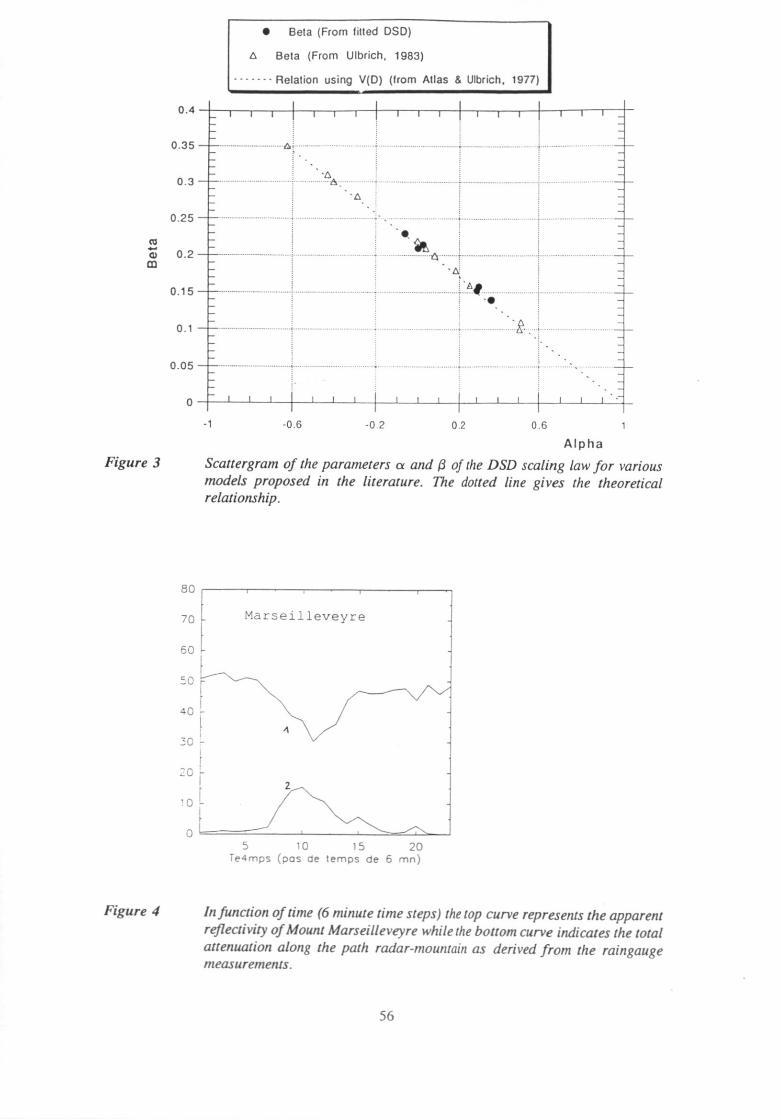
• Beta (From lifted DSD)
Beta (From Ulbrich, 1983)
Relation using V(D) (from Atlas 8. Ulbrich, 1977)
A
0.4
0.35
0.3
0.25
0.1
0.05
1 _1 114 t I I t
0 6 0 2 0 2 0 6
Alpha
Figure 3 Scattergram of the parameters a and fi of the DSD scaling law for variousmodels proposed in the literature. The dotted line gives the theoreticalrelationship.
MareiJ1evevre
Figure 4 Infunction of time (6 minute titne steps) thetop curve represents the apparentreflectivity of Mount Marseilleveyre while thebottom curve indicates the totalattenuation along the path radar-mountain as derived from the raingaugemeasurements.
56

1009080706050403020100
100908070605040302010
02 4 6 8 10 12 14 16 2 4 6 8 10 12 14 16
Distance au rodor (km) Distance ou radar (km)
15h46
15h52
100
100
90
90
80
80
70
70
60
60
50
50
40
40
:1 I t •
30
I
30
‘1. \•
20
20
10
10
-,
0
0
2 4 6 8 10 12 14 16
2 4 6 8 10 12 14 16Distance au radar (km) Distance au radar (km)
15h58 16h04
1009080706050403020100
10090807060504030f: t2010A0
2 4 6 8 10 12 14 16 2 4 6 8 10 12 14 16Distonce au radar (km) Distance au radar (km)
16h10 16hi6
Figure 5 Rain profiles (in mm) along the azimuth including the MountMarseilleveyre at 17 km range. The block curve represents the raw datameasurements. The other curves are obtained using the Hitshfeld-Bordanalgorithm (dotted line) and the Path Integrated Attenuation algorithm(dashed line). The crosses are the readingsfrom 5 gauges operated along thisazimuth. Six time-steps are considered.
57

Institution: Laboratoire Central des Pants et Chaussées, Division Eau, France
Project Leader: Nerve S. Andrieu
I titutions coo ratin : Institut de Mecanique de GrenobleVille de Marseille
Title f ro'ec : STORMS, FLOODS AND RADAR HYDROLOGY
MAIN OBJECTIVES
The objective of the project is to improve the hydrometeorogical survey of urbanMediterranean regions prone to long and intense rain events. Jointly with the IMG group,the investigation concerns the following tasks:
Contribution to the Marseille Experiment by collecting and processing of datarecorded by Meteo France;
Correction of the errors due to the Vertical Profile of Reflectivity
Test of a short-term rainfall forecasting model based on radar data and a conceptualrainfall model.
Evaluation of the complementarity between a local radar (X-band) and a radar of thenational meteorological network
METHODS AND MATERIALS
The first part of the project focuses on experimental aspects. The goal of the Marseille 93experiment is to collect all hydrological and meteorologicaldata useful to describe intense rainevents affecting a big Mediterranean city. The initial part concerns the constitution of thedatabase, grouping all the recorded data. This task includes different stages collection ofdata, consistency of data coming from different sensors working at different spatial andtemporal recording resolution, and preprocessing of radar data recorded by the radar locatedin Nimes. The work devoted to the vertical profile of reflectivity (VPR) will be based ondata of the Cevennes Experiment and data recorded by the Italian group. The goal is toextend a VPR identification method in order to define local VPR instead of a mean VPR andto test the hydrological interest of this VPR correction procedure. Rainfall forecastingconsists of testing the conceptual approach proposed by the University of Iowa. This test willbe based on the rain events recorded during the Cevennes Experiment which have a strongorographic component.
58
RESULTS IN 1993
(.1) Erperimental Database
The database contains data recorded by the following sensors :
a meteorological station installed in the Marseille city during the experiment. Itmeasures: pressure, temperature, relative humidity, wind (velocity and direction)every 30 minutesX-band light configuration radarS-band radar located near Nimes (80 km far away from Marseille)Meteosat satellite (visible and infrared images)a raingage network of 20 devices
It is planned to collect the analysis and forecasts performed by the meteorological modelARPEGE for the most interesting rain events.
The main rain events presently available occured during the last Autumn season (Septemberand October 1993). Table 1 details the present content of the Marseille database (Faure et al,1993) and Figure 1 compares images from the two radars.
Identification of Vertical Profile of Reflectivity
The vertical variability of reflectivity in the radar beam is one of the main sources of errorin estimating radar rainfall intensity. This vertical variability is characterized by a functioncalled the Vertical Profile of Reflectivity. A method for identifying the vertical profile ofreflectivity has been proposed. In its initial version this procedure only requires the use ofradar images from at least two different elevation angles. The efficiency of the proposedmethod is appreciated from a hydrological point of view. A comparison is performed at thecatchrnent scale between hourly rainfall intensities measured with a dense network ofraingauges and radar data. The analysis shows that the introduction of the identification andthe correction of the influence of vertical profiles of reflectivity improve the accuracy ofrainfall estimates from radar. Preliminary results show that the method could be operationallyapplicable (Faure, 1993). On-going work will consist of extending this method to full volumescan data. In this respect, a collaboration with other groups of the project (Salford, Padova)is envisaged.
Rainfall Forecasting
The study of rainfall forecasting is based on a recent approach well adapted to hydrologicalapplications, proposed by the Hydrometeorological group of the University of Iowa. Thebasic idea is that the rain cloud over a basin can be represented by an atmospheric column,the rainfall at the ground level depending on the liquid water content of this column. Thetemporal evolution of this column is assumed to be described by a conceptual model whichcan be combined with a classical advective scheme. Work was initiated during a six monthsstay at the University of Iowa (Andrieu, 1993 and French et al, 1993). Ongoing workconcerns evaluation of the dynamical part of the model in the orographic context of rainevents recorded during Cevennes Experiment (Berthier and Thauvin, 1993 and Thauvin,1993).
59
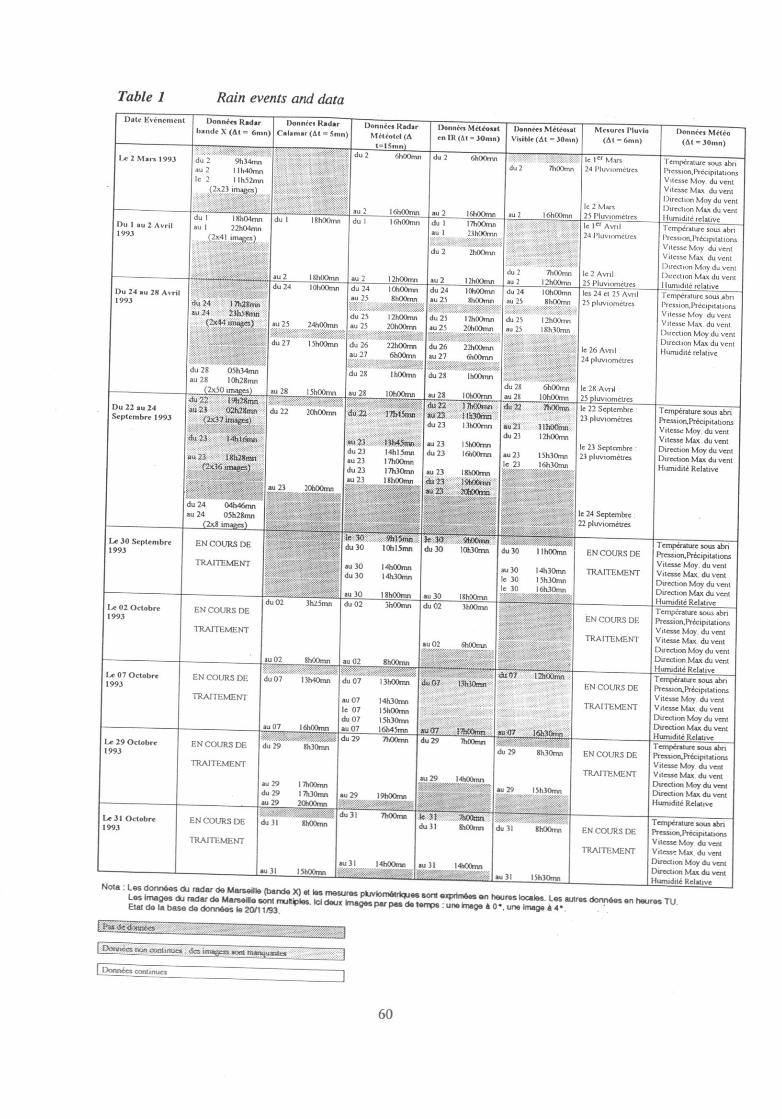
Table l Rain events and dataDate Evenement Donnie Radar Donner Radar
baud< X (At = 6n1) Catania. = 5nue
Lc 2 Man 1993
du 1 I8h04nin du 1Du I au 2 Avril au I 22h04mn1993
(lx4l unaeo
su 2 18h0Oran au 2 I 2h0Omn au 2 111100inn au 2 121100m 25 Pluviornetrcs
du 24 10h0Ornn du 24 I01101rtin du 24 101100mri du 24 101100om les 24 et 25 Awe
au 25 Mg/Orrin au 25 81t0Orrm au 25 81100mn 25 pluviameas
du 25 12h0Ornn du 25 12Mernn du 25 12/100mn
24h0Orrin au 25 20hOtein au 25 20110Drim su 25 18h3Onin
du 27 151100mn du 26 22/100mn du 26 22hCOnin ""clc 26 Avril
au 27 bleOmn au 27 ORIOnin 11. 24 pluviomeacs 313331'1'1'1!3'.11113TNIEJ.381.WIE1.31::.:111:3E1W.11R81.T1/3III3I;;111.1:(131:
du 28 11100mn du 28 11100nm 1333;
du 28 &worm lc 28 Avn/au 28 I51100ne au 28 10h0Omn au 28 10140mn au 28 101300mn 25 lumometres
:1311181338111881818113:311333318311.Pda 1n1.00p*. 412;M le 22 septembredu 22 201100rtin than flM3pt an lIk ,t
23 plueomeires13b0Omn Au23 lanam
du 23 121103nm
du 23au 23
du 23
au 23au 23213h0Orte
Du 24 au 28 Avril1993
du 28 05h34rtm
au 28 10h28mn
2x50i cs
du12..
'TIViE2182gen:DU 22 au 24Septembre 1993
au 2 161100nm18/10Orrui du I
Demers Radar
Meteotel (A
t-ISmn
du 2 61100nui
Donnie Mithosat Donnie Meleosat Mesures Pluvlo
en IR (At = 30mn) Visible (At - Rinir0 (Al = Ornr)
du 2
10100mrt du 1 171r)Omn
au I 231300mn
do 2 2h0Omn
le 2 Mam
n 25 Pluviamarcs
lc ler Aynl
24 Pluviametas
au 23 15100mn
du 23 16hatirrn
au 23 181100arm
au 23 15h3Orrin 23 pluviometres
le 23 16630nm;:systa."
le 23 Scptembre
Donner, Melee
(At -30mn)
Temperature sous abnPassion.PrecipaationsViten May du vent
V nese Max du vent
Direallon May du vent
Direction Max du ventIfiundue relative
Temperature sous abn
PassimPrecipitationsViscose May du vent
V gest Max du vent
Direction May du vent
Direct ion MS%du vent1beadle relative
lamperature sous abn
ProssionPrecimauonsV itessc May du vent
VIICSse MIN du ventDirection Moy du vent
Direction Max du vent
Humidite relative
Temperature sous abri
PtessionPreciptations
VireSW Moy du vent
Vitesse Max du vent
Direction Mar du ventDirection Max du vent
Humidste Relative
1 IhCOmn
du 24 04h46mn
au 24 031128nm
201
Le 30 Septembre
1993EN COURS DE
TRAITEMENT
au 30 181,00nin au 30 1111,00mn
du 02 31107mri du 02 3h0Oinn
du 3o 10130mn du 30
au 30 14110Orrindu 30 14h3Ciron
au 30 141130nut
le 30 15h3Chnnle 30 161t3Omn818:11.133:1388313813M8.1133111,1313
du 0231115mn
Tenperature sous aleEN COURS DE PressionPreambearis
TRAITEMENTV nesse May du vetVarese Max du vast
Dirocuon Moy du ventau 31 14200irsT au 31 14810mnau 31 151100mn :f;V:"1"--71 au 31 15h3Oinn
Direction Max du vent
Hurnichte RelativeNote : Les donnees cki radar de Marseille (ben% 19 et les :insures plavlornialques tont ezprimies en &sureslocales. Les axes &Tees en hangs TU.
Les Images du radar de Mamie sont multiples.Id deux Imagespa, pas de terms : une Frage &Os. une image a 4*.Etat de la base de donnees le 20/11193.
Dvtéanxa oonirnuea . des sort
Donnee continua
so
du 29 7h0Ormy
au 02 61300nut
=107
E11.8a11, du 29 81130mn
1211.10su
au 02 MOOmn au 02
11.38:1 E.13V/313131(11du 07 131140inn du 07
au 07
le 07 du 07
aLl 07 legerrin au 07
9 ma du29du 29 sh3Ornn
81100mn
hOOrras
141330trin
IShOOmn151,30mn
la45mn
7h0Omit
lc 24 Septcrnbrc
22 pluviornetres
EN COURS DE
TRA /YEMENI
EN COUPS DE
TRA1TEMENT
EN COORS DE
TRAITEMENT
EN COURS DE
TRAITEMENT
Temperature sous mho
Pression.Precipttations
Vitesse Moy. du vent
Vitesse Mast du ventDirection May du sent
Direction Max du ventHunuchte Relative
Temperature sous abn
Pression.Pricipitations3/Hesse May. du vent
Vitcsse Max du vent
Direction Moy du vent
Direction Max du vent
Hunudite Relative
Temperature sous abnPression.PrécipiknOns
Vacsse Moy du vent
V nesse Max du vent
Direction May du vent
Direction Max du vent
Humiclite Relative
Tarmeraturc sous abri
Pression.PrecipitationsVitesse Moy du vent
Vitcssc Max du vent
Direction Moy du ventDirection Max du vent
HurnIchte Relative
Le 02 Octobre
1993
Le 07 Octobre1993
Le 29 Octobre1993
EN COURS DE
TRA1TEMENT
EN COURS DE
TRA1TEMENT
EN COURS DE
TRAITE MENT
au 29 17h13Orrindu 29 I 7hDnin au 29 191,00mn ,
au 29 201100nm
du31 0190iondr 31 8hOlinin
du 31 8h0Dnn
I51130mn
31
Le 31 Octobre EN COURS DE
1993
TRAITEMENT
60

RADAR B AND E X 22:28:00 93092220.30 METEOTEL
-+'
4,37
COCIIIILWNICC.m Iambc,t UI
Ground Detection
RADAR BANDE X 22:40:00
60 7
ctaxclareei en tarot:en Ill coordornee m bun bat [ll
93092220.45 METE TEL
MI7
Echelle des couleuts
Intensith en mmili
Sup a 365.0
6.5 - 11.5_ii
205.0 - 365.0 .11 3.7 - 6.5
115.0 - 205.0-
2.0 - 3.7
64.8 - 115.0 111. 1.1 -2.0
36.5 -64.8 111. 0.6 - 1.1
20.5 - 36.5 -0.2 - 0.6
11.5 - 20.5
0,0 - 0.2
Sectuur non explore
Figure I Images Irrmi the X-band and S-band (MeteoteI) radars.
61

CONCLUSIONS AND ADDITIONAL REMARKS
The initial effort consists of building a structured data set regrouping numerousparameters representative of the rainfall variability. This preliminary effort is verytime consuming, but it is a necessary step to further use of these data in goodconditions.
A collaboration with other national groups would be very fruitful to test and evaluatethe VPR identification and the associated correction in a more robust way.
Radar rainfall forecasting based on full volume scan radar data coupled with aconceptual model remains to be evaluated carefully. But it appears to be a convenientand simple means to approach microphysical and dynamical models of rainfallforecasting.
REFERENCES
Faure, D. (1993) Application a l'Hydrologie du Radar Météorologique - Comparaisond'Estimations Radar et Pluviometriques pour des Lames d'eau Horaires sur de petitsBassins Versants Cévenols, Doctorat de l'Université de Grenoble, 310 pages
Faure, D., H. Andrieu, J.M. Rouaud: (1993) Constitution d'une base de données etpremieres comparaisons des images des radars de Nimes et Marseille, RapportLCPC/IMG, 45 pages.
French, M.N., H. Andrieu & W. Krajewski (1993) A Model For Real-Time RainfallForecasting Using Remote Sensing: 2 Cases Studies, to appear, Water Res. Research.
Berthier, E. & V. Thauvin (1993) Pitiable a l'evaluation d'un modele de prevision par radardes intensités pluvieuses a tres courte echéance, Rapport LCPC, 64 pages+ Annexes.
Andrieu, H. (1993) An Introduction to Rainfall Forecasting for Hydrological Needs, 2ndWorkshop on Rainfall Physics for Radar Studies, Universiti Polytechnique deCatalogne, 1-2 June.
Andrieu, H. (1993) The interest of Correcting The effect of Vertical Profiles of Reflectivity,2nd Workshop on Rainfall Physics for Radar Studies, Universitat Polytechnica deCataluny, 1-2 June.
Thauvin, V. (1993) Rain Forecasting in the Cevennes Region: a Preliminary Study, 2ndWorkshop on Rainfall Physics for Radar Studies, Universitat Politecnica de Cataluny,1-2 June.
62
Institution: University of Ljublyana, FAFF - Hydraulics Division, Slovenia
Pro'ect Leader: Mitja Bully
Institutions coo eratin : Biotechnical Faculty - Agronomy Department, Faculty ofSciences - Chair of Meteorology, HydrometereologicalInstitute, and Water Management Institute.
Title of ro'ect: STORMS, FLOODS AND RADAR HYDROLOGY
MAIN OBJECTIVES
The scientific goals of the project include investigation into the following:
Setting up a network for telemetering and acquisition of hydrometeorologicaldata forthe validation and proper operation of hydrological mathematical models. Ahydrometereological database for 3 events will be established using GIS for modelcalibration and validation. Study of historical data for flood events inSoeawatershed.
Use deterministic and stochastic procedures for merging radar and raingaugeprecipitation data.
Development and calibration of real-time flood forecasting model. Development ofinterfaces to the GIS. Creation of the cartographic and topographic database for SoOariver.
METHODS AND MATERIALS
The study will employ radar data primarily from the Teolo (Italy) and Lisca (Slovenia) radarswhich have been in operation for a few years. Meteorological radar data fromGrado (Italy)and Slavnik (Slovenia) will be also used if they are in operation next year. PCcomputers anda mainframe computer with UNIX operating system will be used with GeographicalInformation Systems GEO/SQL and SPANSE.
Hydrometeorological data from 9 raingauge stations and 8 river level gauges are to be used(Figure l). Topographic data are digitised from maps at a scale of 1:25000.
63

RESULTS (JUNE TO DECEMBER 1993)
(i) Historical data analysis
The So6a,(Isonzo) river watershed is a region which experiences the maximum precipitationin Slovenia, and in Friuli-Venezia Giulia, ranking also veryhigh in Europe. It is also a partof a belt (at the southern flank of the Alps, from Mediterranean to the Pannonian climate),where there is most probably a European maximum of days with storms. High mountainswith a lot of snow being accumulated during the winter contribute to the danger of floods aswell.
A,STRIA
LEGENDo existing roingage
—power plant gauge
Y hydrometric gauge
rodor station
RIZ
MONG CEINC
0
VA GORICA
TR STEADRIATIC SEA
Figure 1 Soect river watershed with gauge stations
On the upper part of the Soca river basin thunderstorm and flood events are quite frequent.Long term statistical analysis of thunderstorms shows more than40 events per year. Statisticsdata for analysed gauges are presented in Table 1.
During 1992 and 1993 more than six floods have occurred. Hydrographs for the Soca riverfor the years 1992 and 1993 are presented in Figure 2. Floodevents were chosen for furtheranalysis and data collection. Precipitation data at five minutes time intervals were collectedfor stations presented in Figure 1.
64

1992
1000 -
1993
Ovp 935 mlis900
800
700
500
500
400
300
APR MAJ JUN XX AUG 8kM OKT
00, 95.5 ROM
ser Onp .19 5 ma's
NOV DECJAN FED MAR
o 833/5
T140
130
120
110
100
00
80
70 —
JAN FEE! MAR APR MAJ JUN Ak
Cvp = 149 m.3/t
Onp • 23 2 mlis
SEP Orr NOV DEC
Figure 2 Hydrographs for the Soea river at gauging station Solkan, near Nova Gorica
65

Three of the selected flood events with the best meteorological radar measurements will betreated in further hydrological analysis.
Table I Statisticalparameters on the days with thunderstorms per year (data: 1951 -
Station
1986)
Mean Mod s' Cocfvar.
Max. Min. Var. Max. monthint. (%) month
Boyce 48.1 50 160.69 26 75 17 58 10.2 (6)tepovan 49.4 52 80.87 18 72 24 48 104 (7)Godnje 42.6 45 132.13 27 65 14 51 8.4 (7)Komen Na Krasu 342 41 184.44 40 63 4 59 6.2 (7)Kredarica 37.3 41 49.86 19 53 24 29 8.3 (7)Novelo Prit 27.6 37 112.78 38 47 10 37 5.5 (6)Postojna 372 44 177.95 36 61 5 56 7.6 (6)Ratete-Planica 31.7 30 44.93 21 44 20 24 7.4 (7)Rovte 18.4 26 84.91 50 36 0 36 4.8 (6)Slap pri Vipavi 29.8 31 119.03 37 55 12 43 6.1 (6.7)Stan Futina 40.9 43 86.93 23 64 25 39 8.8 (7)Tolmin 25.9 28 125.42 43 44 6 38 6.0 (7)Vojsko 47.1 58 94.69 21 60 22 38 10.4 (7)
(iii) Creating GIS database
Streams with watershed boundaries were digitised from maps at a scale of1:25000. A digitalmodel of relief with a mesh of 100 x 100 metres was also constructed.
CONCLUSIONS AND ADDITIONAL REMARKS
A great number of flood events occur each year in the Sota basin giving very goodexperimental data for further investigation and analysis.
The Slovenian component of this CEC project was only given formal approval in October1993. As a result there has been limited progress to date. Visits to the Italian partners and tothe coordinator in the UK have taken place in order to progress integration of this newpartner into the project.
REFERENCES
Brilly, M. & Rakovec, J. (1992) "Using Meteorological Radar for Flood Warning", 2ndInternational Symposium on Hydrological Applications of Weather Radar, Hannover.
66

á

A Natural
EnvironmentResearchCouncil


![[Hydrology] Groundwater Hydrology - David K. Todd (2005)](https://img.dokumen.tips/doc/110x75/548ce7beb47959e2288b45f9/hydrology-groundwater-hydrology-david-k-todd-2005.jpg)

![[Hydrology] groundwater hydrology david k. todd (2005)](https://img.dokumen.tips/doc/110x75/55a8e6001a28ab6c2f8b4687/hydrology-groundwater-hydrology-david-k-todd-2005-55b0d9a792c06.jpg)


![[hydrology] groundwater hydrology - david k. todd (2005).pdf](https://img.dokumen.tips/doc/110x75/577c77961a28abe0548cb0b1/hydrology-groundwater-hydrology-david-k-todd-2005pdf.jpg)