Embed Size (px)
Citation preview

Introduction
Testing RF components and circuits against designspecifications often requires a simulated input signal to replace missing components or analyze the devicecharacteristic under different signal conditions. For CWand modulated signals at frequencies above 100 MHz,
RF generators have been the tool of choice for manyyears. Recently, modern arbitrary/function generators(AFGs) have been finding increasing use in a number ofRF test applications, thanks to significant improvementsin versatility, flexibility and frequency range, enabled byadvances in instrumentation technology.
Arbitrary/Function Generators provide versatilestimulus in RF Applications
Application Note
Arbitrary/Function Generators provide versatile stimulus in RF Applications Application Note
Aside from CW and modulated signals, AFGs are able to generate swept sine waves and signal bursts.Multicarrier signals can be created via the arbitrarywaveform function. Dual channel models even allow thegeneration of I/Q signals. This document described thefollowing typical RF test applications for which AFGs are often the tool of choice:
– Measuring bandwidth of passband filters and IF amplifiers
– Measuring intermodulation distortion
– Measuring quadrature error and gain imbalance of IQ modulators
– Simulating pulsed radar signals
– Pulsed noise figure measurement
These application examples are based on the AFG3251and AFG3252 models of the AFG300 Series of arbitrary/function generators. These instruments cangenerate CW signals up to 240 MHz, and pulse signalsup to 120 MHz, with an output power of up to 16 dBm.The signals can be modulated in frequency, amplitudeand phase via a built-in modulation generator or anexternal source up to modulation frequencies of 50 kHz.
Benefits of Using Arbitrary/FunctionGenerators in RF Applications
Users of the AFG3000 Series benefit from 25 dedicatedbuttons on the front panel that provide direct access tomost frequently used parameters and functions. Thisshortens set-up and evaluation time compared to manyother instruments in the category where parametershave to be accessed through layers of soft menus.
All waveform parameters are adjustable on the fly viarotary knob or numeric key pad. The amplitude can bedisplayed in Vpp, Vrms or dBm. During timing parameteradjustments, the output signal remains free from glitches or dropouts, which is important, for example,when characterizing devices with a frequency sweep.
A large 5.6" Color LCD displays all relevant instrumentsettings at a single glance along with a graphical representation of the generated waveform. This givesthe operator full confidence in the instrument settings. In amplitude modulation mode, for example, the instrument not only shows the frequency and amplitudesettings of the carrier, but also the modulation frequency, depth and waveform.
2 www.tektronix.com/signal_generators
Figure 1. Front panel of the AFG3000 Series. Figure 2. Display of the AFG3000 Series.

Arbitrary/Function Generators provide versatile stimulus in RF ApplicationsApplication Note
For applications that require more than one input signal,such as RF and IF, or I and Q signals, dual channelmodels are available at significant cost savings over two separate single channel generators. Since theAFG3000 Series is based on Direct Digital Synthesis(DDS), signal shape and frequency can be selectedcompletely independently in both channels. The signals
can also be locked together in frequency and/or amplitude. In this case, the phase relationship betweenboth channels can be manually adjusted, which isextremely useful for example for measuring channel to channel timing differences in devices.
Table 1 summarizes the RF related capabilities of theAFG3251 and AFG3252.
3www.tektronix.com/signal_generators
Table 1. RF related specifications of AFG3251/52.
Model AFG3251 / AFG3252
Channels 1 / 2
Sine Wave 1 µHz to 240 MHz
Amplitude
<200 MHz 50 mVp-p to 5 Vp-p / –30 dBm to 18.0 dBm
>200 MHz 50 mVp-p to 4 Vp-p / –30 dBm to 16.0 dBm
Harmonic Distortion (1 Vp-p)
10 Hz to 1 MHz <–60 dBc
1 MHz to 5 MHz <–50 dBc
5 MHz to 25 MHz <–37 dBc
>25 MHz <–30 dBc
THD (10 Hz – 20 kHz, 1 Vp-p) <0.2%
Spurious (1 Vp-p)
10 Hz to 1 MHz <–50 dBc
1 MHz to 25 MHz <–47 dBc
>25 MHz <–47 dBc + 6 dBc/octave
Phase Noise, typical <–110 dBc/Hz at 20 MHz, 10 kHz offset, 1 Vp-p
Residual Clock Noise –57 dBm
Modulation AM, FM, PM
Source Internal/External
Internal Modulation Frequency 2 mHz to 50.00 kHz
Frequency Shift Keying 2 keys
Source Internal/External
Internal Modulation Frequency 2 mHz to 1.000 MHz
Sweep Linear, logarithmic
Burst Triggered, gated
Internal Trigger Rate 1.000 ms to 500.0 s
Gate and Trigger Sources Internal, external, remote interface
Arbitrary Waveforms 1 mHz to 120 MHz
Sample Rate 2 GS/s
Waveform Memory 2 to 128 K

Arbitrary/Function Generators provide versatile stimulus in RF ApplicationsApplication Note
Engineers who work on different designs benefit fromthe versatility of AFGs. Aside from sine, pulse and arbitrary waveforms, the AFG3000 Series also excels atgenerating ramps, and seven other standard functions.
When using AFGs in RF test applications one needs to consider that their phase noise performance does not reach the levels provided by some dedicated RF generators, limiting their use, for example, in sensitivity testing.
Measuring Bandwidth of Passband Filtersand IF Amplifiers
Every new RF amplifier and filter design has bandpasscharacteristics that must be measured to ensure theproduct's compliance with design goals. Most amplifiersare designed to deliver a linear response over a range offrequencies appropriate to their application. Similarly, filters are designed to pass predetermined bands of frequencies and reject all others.
Both types of components tend to have a frequencyrange where the amplitude response is relatively "flat".At either end of this range, the amplitude responsesteadily decreases. The points where response is -3 dB
down from the peak-to-peak amplitude defines thebandwidth boundaries.
In this application example we will examine a 140 MHzIF amplifier and measure the lower and upper frequencywhere the output amplitude is -3 dB down, which isequivalent to the 70.71% of the peak-to-peak value. TheAFG provides a swept sinewave as the input signal tothe amplifier and a spectrum analyzer traces the signaloutput in peak hold mode.
Pressing the AFG’s sweep mode button brings up ascreen with all the essential waveform settings in view,including a representation of the waveform itself (seeFigure 3). Take a close look at the waveform frame nearthe bottom of the screen. It summarizes all of the salientdetails about the generated signal: amplitude; the frequency endpoints; the slope of the “ramp” thatsteadily increases the frequency; and the total length(time) of the sweep.
Figure 4 depicts the measurement trace of the spectrumanalyzer. Using markers, the measurement results are afrequency range of 133 MHz to 147 MHz. Outside thisbandwidth, the amplifier response decays below the -3 dB point.
4 www.tektronix.com/signal_generators
Figure 3. AFG3000 Series display in sweep mode. Figure 4. Response of 140 MHz amplifier.

Arbitrary/Function Generators provide versatile stimulus in RF ApplicationsApplication Note
In this example, the AFG’s user interface and architectural advantages play a key role in getting thejob done efficiently. The sweep setup procedure makesit easy to define the needed stimulus signal. The displayconfirms the waveform characteristics at a glance, whilethe numerical parameters on the same screen yieldquick, precise answers about amplitude, frequency, and more.
Measuring Intermodulation Distortion
When two or more tones interact in amplifiers, modulators or other electronic devices, they producemultiple intermodulation products. This effect is referredto as intermodulation distortion (IMD) and is caused bynon-linearities of the device. In RF communication, thispresents a problem as it widens the signal spectrum,interferes with the transmission signal, and reduces thedynamic range of wireless transceivers.
To measure IMD of an RF device, it needs to be stimulated with a dual tone signal and its outputresponse measured with a spectrum analyzer. You couldgenerate both tones separately with channels 1 and 2 ofthe AFG3252 and mix them externally. A more elegantapproach, without the need for an external mixer, is tocreate the dual tone as an arbitrary waveform and generate it using only one channel of the AFG.
The dual tone arbitrary waveform can be defined conveniently via the waveform math function of the PCsoftware package ArbExpress®. In this example, theAFG3252 is generating dual tones at 3.5 MHz and 4.5 MHz to test the IMD of an IQ modulator.
After the waveform files are created, they can be savedon a USB memory device for transfer to thearbitrary/function generator: Plug the USB memory withthe waveform files into the front panel USB port of theAFG3252. Press the button "Edit", select "Read from…"from the screen menu, then "USB", and select the filefor channel 1 from the list on the screen. Next, select"more" from the screen menu, then "Write to…" andload the arbitrary waveform into the memory User1 ofthe instrument. Lastly, program the AFG3252 with thesettings as shown in Table 2.
5www.tektronix.com/signal_generators
Table 2. AFG3252 settings for IMD measurement.
Parameters Setting
Run Mode Continuous
Function Arb
Arb Waveform Menu User1
Frequency 500 kHz
Amplitude 0.5 Vpp
Figure 5. AFG3252 display for dual tone waveform.
Arbitrary/Function Generators provide versatile stimulus in RF ApplicationsApplication Note
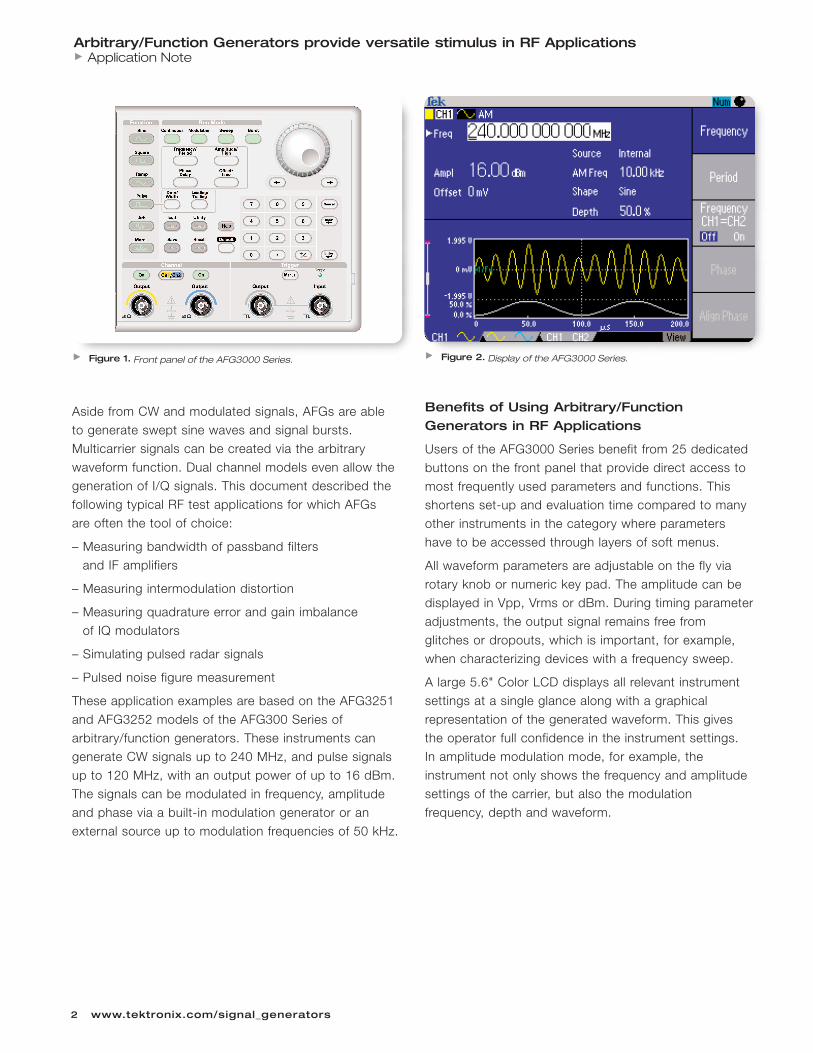
The response of the IQ modulator to the dual tone stimulus is depicted in the spectrum analyzer screenshot in Figure 6. The 3.5 MHz and 4.5 MHz dualtones are centered in the screen to the right of the localoscillator frequency. Conventional measures for quantifying device linearity are the output interceptpoints (OIP). These can be calculated mathematicallyfrom the power of the strongest intended tone and thesuppression of the inter-modulation products relative tothe power of the reference tone.
An important point to consider for IMD measurements isthat the signal generator generates IMD of its own dueto non-linearity in the output stage. The measured IMDat the device output is the vector sum of source anddevice IMD. Through a separate measurement, it wasdetermined that the source IMD only leads to a measurement error of ±0.02 dB for the second orderIMD of the device, and ±0.13 dB for the third-order IMD.
(For more information on IMD measurements and creat-ing dual tones with ArbExpress see application note75W-20744-0 "Characterization of IQ ModulatorsCounts On Flexible Signal Generator Stimulus".)
Measuring Quadrature Error and GainImbalance of IQ Modulators
IQ modulators play a critical role in modern telecommunication. Designers are concerned aboutamplitude imbalance and phase error between in-phaseand quadrature arms of an IQ modulator, because theyresult in carrier feed-through and undesired sidebandleakage. LO leakage is caused by minute DC offsets
between the differential baseband inputs and is independent of the quadrature error. The undesiredsideband leakage is dependent on both amplitudeimbalance and quadrature error.
To measure the amplitude imbalance and quadratureerror, we can make use of the fact that the sidebandsuppression can be optimized by adjusting phase andamplitude offsets between I and Q channel. When onlyone parameter is adjusted, sideband suppressionasymptotically approaches a limit. Therefore, gain andphase need to be adjusted consecutively in severalsteps until the undesired sideband leakage is minimized.The opposite values of the Q channel adjustments thenreflect the mismatch inherent to the modulator.
6 www.tektronix.com/signal_generators
Figure 6. Spectrum analyzer measurement of inter-modulation dis-tortion.
Arbitrary/Function Generators provide versatile stimulus in RF ApplicationsApplication Note
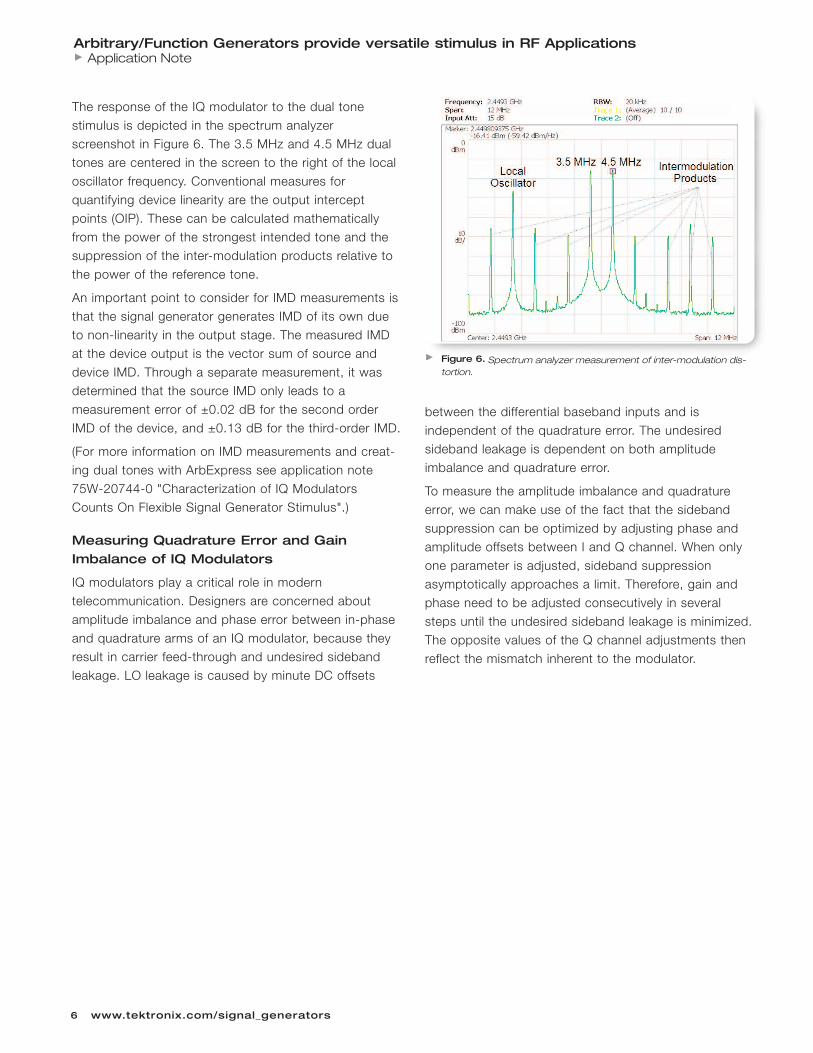
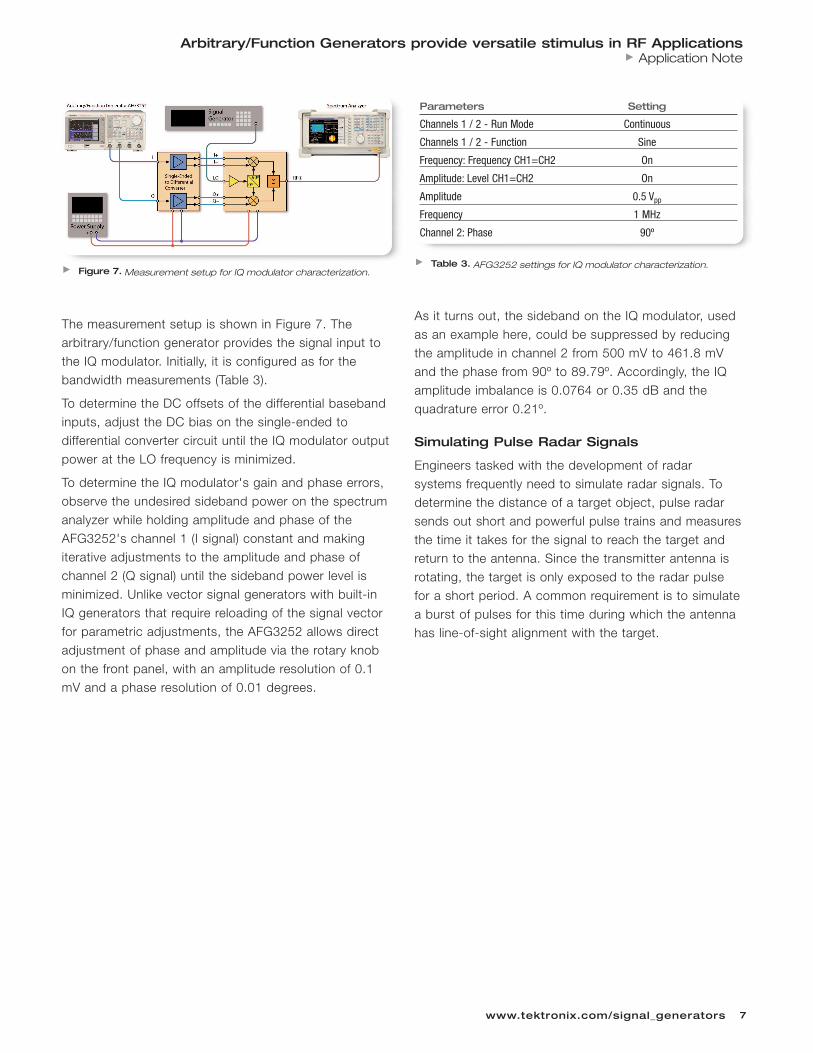
The measurement setup is shown in Figure 7. The arbitrary/function generator provides the signal input tothe IQ modulator. Initially, it is configured as for thebandwidth measurements (Table 3).
To determine the DC offsets of the differential basebandinputs, adjust the DC bias on the single-ended to differential converter circuit until the IQ modulator outputpower at the LO frequency is minimized.
To determine the IQ modulator's gain and phase errors,observe the undesired sideband power on the spectrumanalyzer while holding amplitude and phase of theAFG3252's channel 1 (I signal) constant and makingiterative adjustments to the amplitude and phase ofchannel 2 (Q signal) until the sideband power level isminimized. Unlike vector signal generators with built-inIQ generators that require reloading of the signal vectorfor parametric adjustments, the AFG3252 allows directadjustment of phase and amplitude via the rotary knobon the front panel, with an amplitude resolution of 0.1mV and a phase resolution of 0.01 degrees.
As it turns out, the sideband on the IQ modulator, usedas an example here, could be suppressed by reducingthe amplitude in channel 2 from 500 mV to 461.8 mVand the phase from 90º to 89.79º. Accordingly, the IQamplitude imbalance is 0.0764 or 0.35 dB and thequadrature error 0.21º.
Simulating Pulse Radar Signals
Engineers tasked with the development of radar systems frequently need to simulate radar signals. Todetermine the distance of a target object, pulse radarsends out short and powerful pulse trains and measuresthe time it takes for the signal to reach the target andreturn to the antenna. Since the transmitter antenna isrotating, the target is only exposed to the radar pulsefor a short period. A common requirement is to simulatea burst of pulses for this time during which the antennahas line-of-sight alignment with the target.
7www.tektronix.com/signal_generators
Figure 7. Measurement setup for IQ modulator characterization.Table 3. AFG3252 settings for IQ modulator characterization.
Parameters Setting
Channels 1 / 2 - Run Mode Continuous
Channels 1 / 2 - Function Sine
Frequency: Frequency CH1=CH2 On
Amplitude: Level CH1=CH2 On
Amplitude 0.5 Vpp
Frequency 1 MHz
Channel 2: Phase 90º
Arbitrary/Function Generators provide versatile stimulus in RF ApplicationsApplication Note
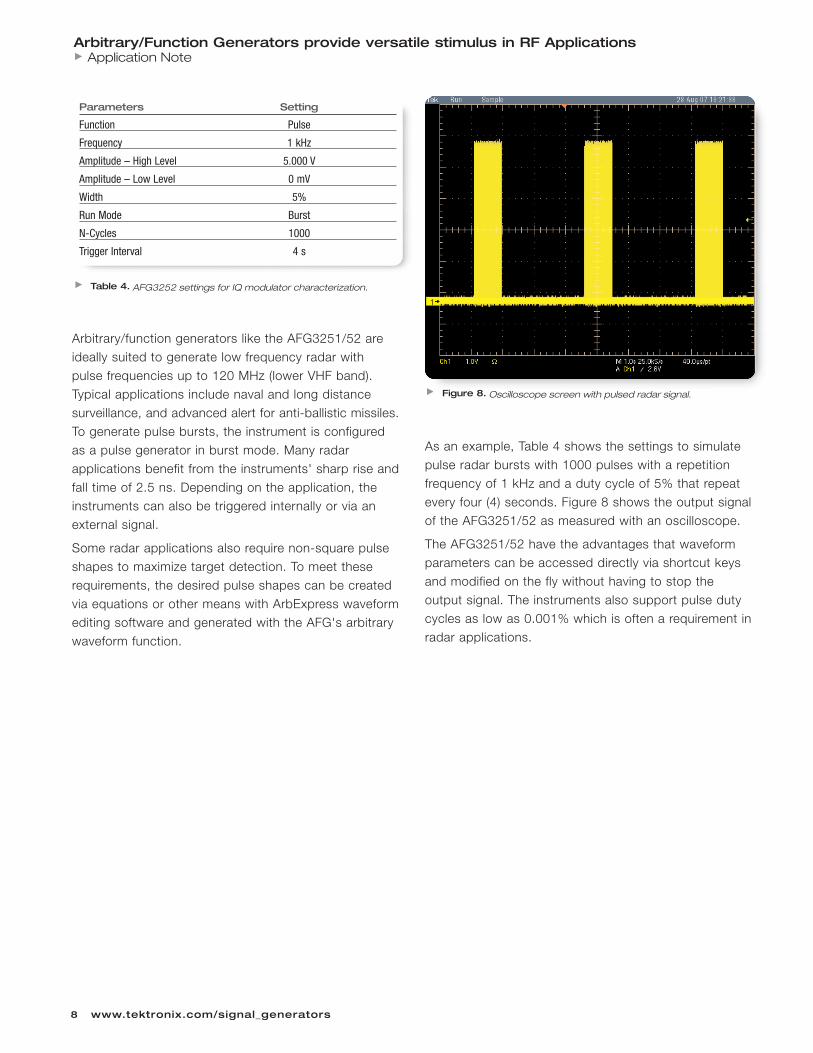
Arbitrary/function generators like the AFG3251/52 areideally suited to generate low frequency radar with pulse frequencies up to 120 MHz (lower VHF band).Typical applications include naval and long distance surveillance, and advanced alert for anti-ballistic missiles.To generate pulse bursts, the instrument is configured as a pulse generator in burst mode. Many radar applications benefit from the instruments' sharp rise andfall time of 2.5 ns. Depending on the application, theinstruments can also be triggered internally or via anexternal signal.
Some radar applications also require non-square pulseshapes to maximize target detection. To meet theserequirements, the desired pulse shapes can be createdvia equations or other means with ArbExpress waveformediting software and generated with the AFG's arbitrarywaveform function.
As an example, Table 4 shows the settings to simulatepulse radar bursts with 1000 pulses with a repetitionfrequency of 1 kHz and a duty cycle of 5% that repeatevery four (4) seconds. Figure 8 shows the output signalof the AFG3251/52 as measured with an oscilloscope.
The AFG3251/52 have the advantages that waveformparameters can be accessed directly via shortcut keysand modified on the fly without having to stop the output signal. The instruments also support pulse dutycycles as low as 0.001% which is often a requirement inradar applications.
8 www.tektronix.com/signal_generators
Table 4. AFG3252 settings for IQ modulator characterization.
Parameters Setting
Function Pulse
Frequency 1 kHz
Amplitude – High Level 5.000 V
Amplitude – Low Level 0 mV
Width 5%
Run Mode Burst
N-Cycles 1000
Trigger Interval 4 s
Figure 8. Oscilloscope screen with pulsed radar signal.

Arbitrary/Function Generators provide versatile stimulus in RF ApplicationsApplication Note
Pulsed Noise Figure Measurement
Noise figure is an important parameter of telecommuni-cation amplifiers as it specifies how much noise theamplifier contributes to the noise in the output signal. Itdescribes the degradation of the signal to noise ratiocaused by the components in the signal chain. It isdefined as the ratio of the signal to noise ratio at theoutput to that at the input:
Cellular hand-set and base station amplifiers for TDMA,GSM and other burst-type radio standards are onlypowered during the active time slots to conserve power.To obtain accurate measurement results, the noise figure must be measured with the amplifier operated inpulse mode as during normal operation.
One popular method of measuring noise figure is the Y Factor method. It relies on a calibrated noise sourcewith known excess noise ratio (ENR) that is connectedto the input of the amplifier under test (see Figure 9).Channel 1 of the AFG3252 turns the amplifier on and off via a pulse signal that drives the amplifier bias input.Pulse width and repetition rate are set according to the standard to be tested. The spectrum analyzer isconfigured in time gated mode to measure the amplifieroutput only during the switch-on phase. Channel 2 ofthe AFG generates the trigger signal to the spectrumthat is synchronous to the pulse driving the amplifier bias.
To derive the noise figure with this method we first needto determine the so called Y factor which is the ratio ofoutput noise densities from the noise source in its ON andOFF states. To obtain reproducible measurement resultssufficient averaging of the measurements is required.
With the measured Y factor and the ENR provided by thenoise source manufacturer for the frequency of interest,the noise figure can now be calculated as follows:
NF= ENRdB – (10log(Y-1))
As an example, let us assume that ENR is 5.28 dB andthat the measured noise density increased from -90dBm/Hz to -87 dBm/Hz after the noise source wasturned on. This yields a Y factor of 3 dB which thenneeds to be converted to a linear value for use in theabove equation. Using the formula Y(lin) = 10Y(dB)/10, weobtain Y(lin) = 1.995. Plugging this value into the aboveformula for the noise figure yields NF = 5.3 dB.
The advantage of using the AFG3000 in this applicationis that it offers two channels that can be synchronized infrequency and have independently adjustable amplitudeto match the required bias level at the amplifier and thetrigger input of the spectrum analyzer or noise figure meter.
9www.tektronix.com/signal_generators
Figure 9. Test setup for pulsed noise figure measurement.
Arbitrary/Function Generators provide versatile stimulus in RF ApplicationsApplication Note
Summary
Modern arbitrary/function generators are versatile, flexible and affordable tools that support numerous RFtest applications. The AFG3000 Series can generate twoindependent or tightly synchronized RF, IF and IQ signals up to 240 MHz. Custom waveforms can be generated via the arbitrary waveform function.
The AFG3000 Series helps users save setup timebecause the more important parameters can be selected on the AFG3000 Series via designated buttonsmuch faster than the layered menus of alternative
instruments. A large screen that shows all relevant settings and a graphical wave shape representationgives the user full confidence in their instrument settings.
All waveform parameters including the phase betweenchannels 1 and 2 can be adjusted on the fly while thetest keeps running. This shortens evaluation time significantly compared to other solutions that requirereloading of the waveform for parameter changes.
Despite all their benefits, arbitrary/function generatorshave limitations over dedicated RF generators, especially where frequencies higher than 240 MHz orlow phase noise are a requirement.
10 www.tektronix.com/signal_generators

Arbitrary/Function Generators provide versatile stimulus in RF ApplicationsApplication Note
11www.tektronix.com/signal_generators
Our most up-to-date product information is available at: www.tektronix.com
Copyright © 2007, Tektronix. All rights reserved. Tektronix products are covered by U.S. and foreignpatents, issued and pending. Information in this publication supersedes that in all previously published material. Specification and price change privileges reserved. TEKTRONIX and TEK areregistered trademarks of Tektronix, Inc. All other trade names referenced are the service marks,trademarks or registered trademarks of their respective companies.
9/07 FLG/WOW 75W-21197-0
Contact Tektronix:ASEAN / Australasia (65) 6356 3900
Austria +41 52 675 3777
Balkan, Israel, South Africa and other ISE Countries +41 52 675 3777
Belgium 07 81 60166
Brazil & South America (11) 40669400
Canada 1 (800) 661-5625
Central East Europe, Ukraine and the Baltics +41 52 675 3777
Central Europe & Greece +41 52 675 3777
Denmark +45 80 88 1401
Finland +41 52 675 3777
France +33 (0) 1 69 86 81 81
Germany +49 (221) 94 77 400
Hong Kong (852) 2585-6688
India (91) 80-22275577
Italy +39 (02) 25086 1
Japan 81 (3) 6714-3010
Luxembourg +44 (0) 1344 392400
Mexico, Central America & Caribbean 52 (55) 5424700
Middle East, Asia and North Africa +41 52 675 3777
The Netherlands 090 02 021797
Norway 800 16098
People’s Republic of China 86 (10) 6235 1230
Poland +41 52 675 3777
Portugal 80 08 12370
Republic of Korea 82 (2) 6917-5000
Russia & CIS +7 (495) 7484900
South Africa +27 11 206 8360
Spain (+34) 901 988 054
Sweden 020 08 80371
Switzerland +41 52 675 3777
Taiwan 886 (2) 2722-9622
United Kingdom & Eire +44 (0) 1344 392400
USA 1 (800) 426-2200
For other areas contact Tektronix, Inc. at: 1 (503) 627-7111
Updated 1 June 2007