Embed Size (px)
Citation preview
AQR Capital Management, LLC | Two Greenwich Plaza, Third Floor | Greenwich, CT 06830 | T: 203.742.3600 | F: 203.742.3100 | www.aqr.com
Trading Costs of Asset Pricing Anomalies
Andrea FrazziniAQR Capital Management
Ronen IsraelAQR Capital Management
Tobias J. MoskowitzUniversity of Chicago, NBER, and AQR
Copyright 2014 © by Andrea Frazzini, Ronen Israel, and Tobias J. Moskowitz. The views and opinions expressed herein are those of the author and do not necessarily reflect the views of AQR Capital Management, LLC its affiliates, or its employees. The information set forth herein has been obtained or derived from sources believed by author to be reliable. However, the author does not make any representation or warranty, express or implied, as to the information’s accuracy or completeness, nor does the author recommend that the attached information serve as the basis of any investment decision. This document is intended exclusively for the use of the person to whom it has been delivered by the author, and it is not to be reproduced or redistributed to any other person. This presentation is strictly for educational purposes only.
Motivation
Cross-section of expected returns typically analyzed gross of transactions costs
Questions regarding market efficiency should be net of transactions costs
• Are profits within trading costs?
Research Questions:
• How large are trading costs faced by large arbitrageurs?
• How robust are anomalies in the literature after realistic trading costs?
• At what size do trading costs start to constrain arbitrage capital?
• What happens if we take transactions costs into account ex ante?
– Tradeoff between expected returns and trading costs varies across anomalies
Trading Costs of Asset Pricing Anomalies - Frazzini, Israel, and Moskowitz 2
Objectives
Measure trading costs of an “arbitrageur”
Understand the cross-section of net returns on anomalies
Model of trading costs for descriptive and prescriptive purposes
Constructing optimized portfolios
Conclusion
3Trading Costs of Asset Pricing Anomalies - Frazzini, Israel, and Moskowitz
What We Do
Take all (longer-term) equity orders and executions from AQR Capital• 1998 to 2013, $1.1 trillion worth of trades, traded using automated algorithms
• U.S. (NYSE and NASDAQ) and 18 international markets—
• *Exclude “high frequency” (intra-day) trades
Use actual trade sizes and prices to calculate • Price impact and implementation shortfall (e.g., Perold (1988))
More accurate picture of real-world transactions costs and tradeoffs• Get vastly different measures than the literature
• Actual costs are 1/10 the size of those estimated in the literature
• Why? 1) Average trading cost ≠ cost facing an arbitrageur 2) Design portfolios that endogenously respond to expected trading costs
4Trading Costs of Asset Pricing Anomalies - Frazzini, Israel, and Moskowitz
Measuring Trading Costs
Literature has used a variety of models and types of data to approximate trading costs:
• Daily spread and volume data[Roll (1984), Huang and Stoll (1996), Chordia, Roll, and Subrahmanyam (2000), Amihud (2002), Acharya and Pedersen (2005), Pastor and Stambaugh (2003), Watanabe and Watanabe (2006), Fujimoto (2003), Korajczyk and Sadka (2008), Hasbrouck (2009), and Bekaert, Harvey, and Lundblad (2007)]
• Transaction-level data (TAQ, Rule 605, broker)[Hasbrouck (1991a, 1991b), Huberman and Stanzl (2000), Breen, Hodrick, and Korajczyk (2002), Loeb (1983), Keim and Madhavan (1996), Knez and Ready (1996), Goyenko (2006), Sadka (2006), Holden (2009), Goyenko, Holden, and Trzcinka (2009), Lesmond, Ogden, and Trzcinka (1999), Lesmond (2005), Lehmann (2003), Werner (2003), Hasbrouck (2009), and Goyenko, Holden, and Trzcinka (2009)]
• Proprietary broker data [Keim (1995), Keim and Madhavan (1997), Engle, Ferstenberg, and Russell (2008)]
Several papers have applied trading cost models to anomalies, chiefly size, value, and momentum. Most find costs are significantly binding.
• Chen, Stanzl, and Watanabe (2002)
• Korajczyk and Sadka (2004)
• Lesmond, Schill, and Zhou (2003)
5Trading Costs of Asset Pricing Anomalies - Frazzini, Israel, and Moskowitz

Trading Execution Database
Trade execution database from AQR Capital Management• Institutional investor, around 118 billion USD in assets (October 2014)
• Data compiled by the execution desk and covers all trades executed algorithmically in any of the firm’s funds since inception (*excluding stat arb trades)
Information on orders, execution prices and quantities• Common stocks only: restrict to cash equity and equity swaps
• 19 Developed markets (drop emerging markets trades)
• Drop liqudity/statistical arbitrage trades
• Result: ~9,300 global stocks , 1.1 trillion USD worth of trades
Price, return and volume data• Union of the CRSP tapes and the XpressFeed Global database
6Trading Costs of Asset Pricing Anomalies - Frazzini, Israel, and Moskowitz
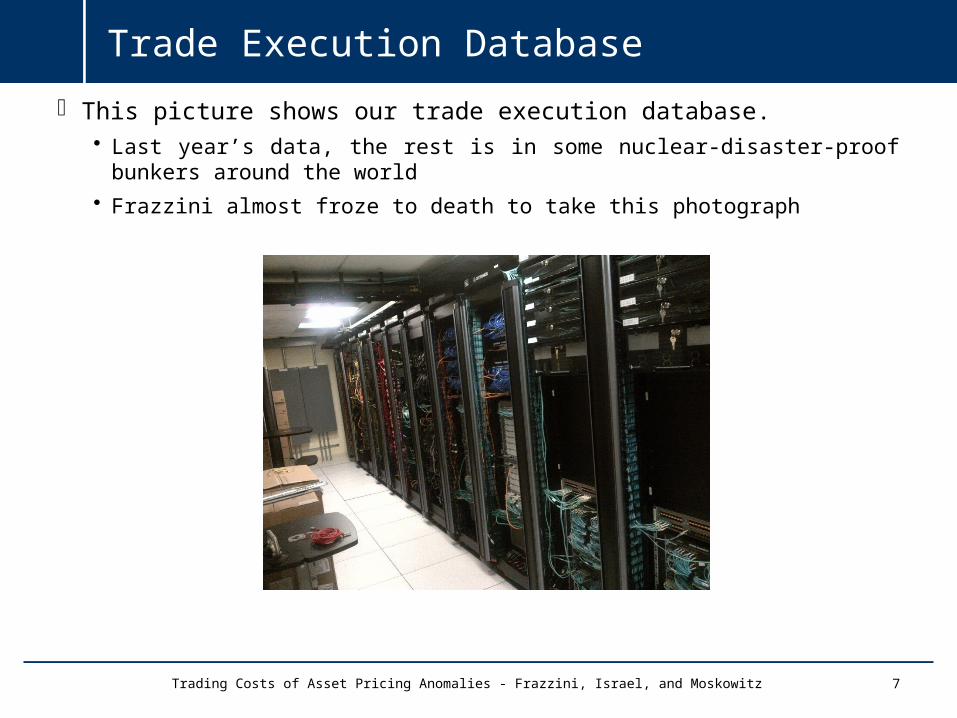
Trade Execution Database
This picture shows our trade execution database.• Last year’s data, the rest is in some nuclear-disaster-proof bunkers around the world
• Frazzini almost froze to death to take this photograph
7Trading Costs of Asset Pricing Anomalies - Frazzini, Israel, and Moskowitz
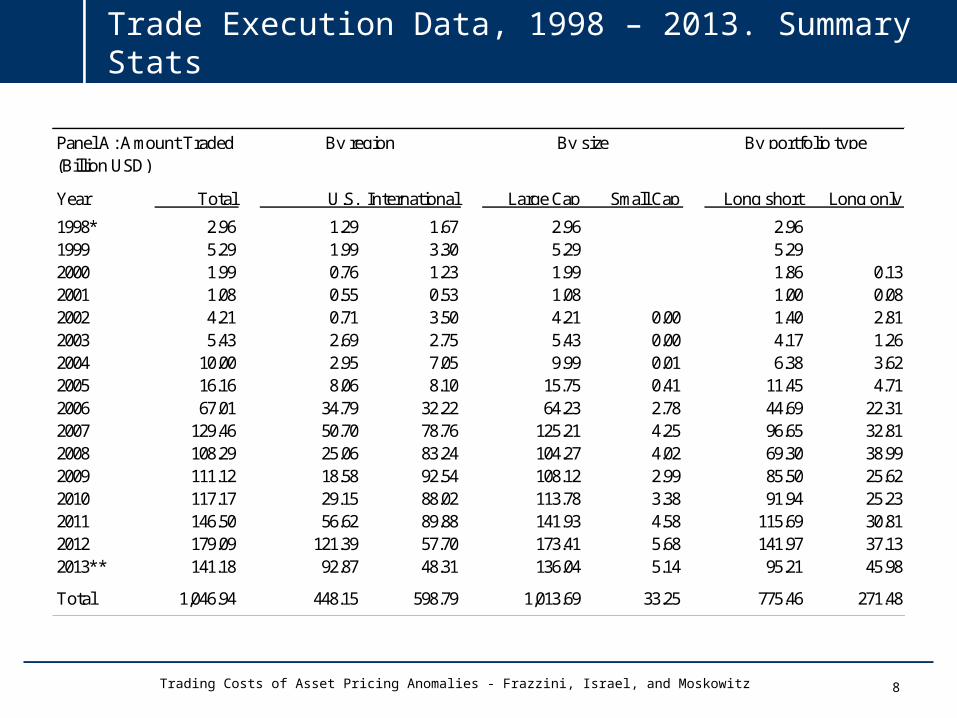
Trade Execution Data, 1998 – 2013. Summary Stats
8Trading Costs of Asset Pricing Anomalies - Frazzini, Israel, and Moskowitz
(Billion USD)
Year Total U.S. International Large Cap Small Cap Long short Long only
1998* 2.96 1.29 1.67 2.96 0.00 2.96 0.001999 5.29 1.99 3.30 5.29 0.00 5.29 0.002000 1.99 0.76 1.23 1.99 0.00 1.86 0.132001 1.08 0.55 0.53 1.08 0.00 1.00 0.082002 4.21 0.71 3.50 4.21 0.00 1.40 2.812003 5.43 2.69 2.75 5.43 0.00 4.17 1.262004 10.00 2.95 7.05 9.99 0.01 6.38 3.622005 16.16 8.06 8.10 15.75 0.41 11.45 4.712006 67.01 34.79 32.22 64.23 2.78 44.69 22.312007 129.46 50.70 78.76 125.21 4.25 96.65 32.812008 108.29 25.06 83.24 104.27 4.02 69.30 38.992009 111.12 18.58 92.54 108.12 2.99 85.50 25.622010 117.17 29.15 88.02 113.78 3.38 91.94 25.232011 146.50 56.62 89.88 141.93 4.58 115.69 30.812012 179.09 121.39 57.70 173.41 5.68 141.97 37.132013** 141.18 92.87 48.31 136.04 5.14 95.21 45.98
Total 1,046.94 448.15 598.79 1,013.69 33.25 775.46 271.48
By region By size By portfolio typePanel A: Amount Traded
Summary Stats cont.
9Trading Costs of Asset Pricing Anomalies - Frazzini, Israel, and Moskowitz
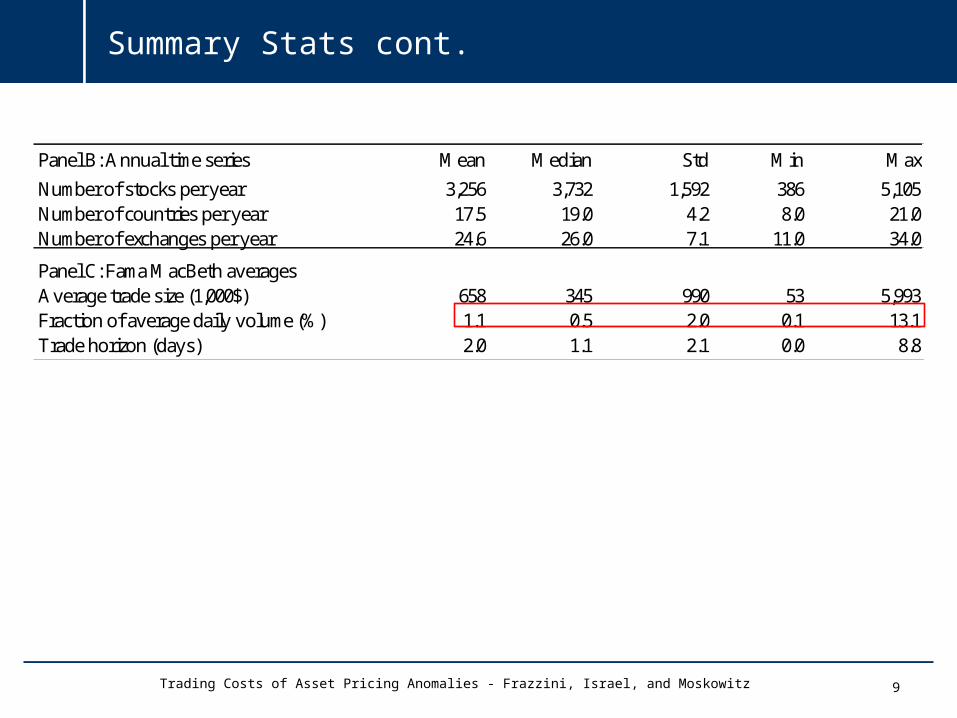
Panel B: Annual time series Mean Median Std Min Max
Number of stocks per year 3,256 3,732 1,592 386 5,105Number of countries per year 17.5 19.0 4.2 8.0 21.0Number of exchanges per year 24.6 26.0 7.1 11.0 34.0
Panel C: Fama MacBeth averagesAverage trade size (1,000$) 658 345 990 53 5,993Fraction of average daily volume (%) 1.1 0.5 2.0 0.1 13.1Trade horizon (days) 2.0 1.1 2.1 0.0 8.8
Summary Stats cont.
10Trading Costs of Asset Pricing Anomalies - Frazzini, Israel, and Moskowitz
Trading Execution Algorithm
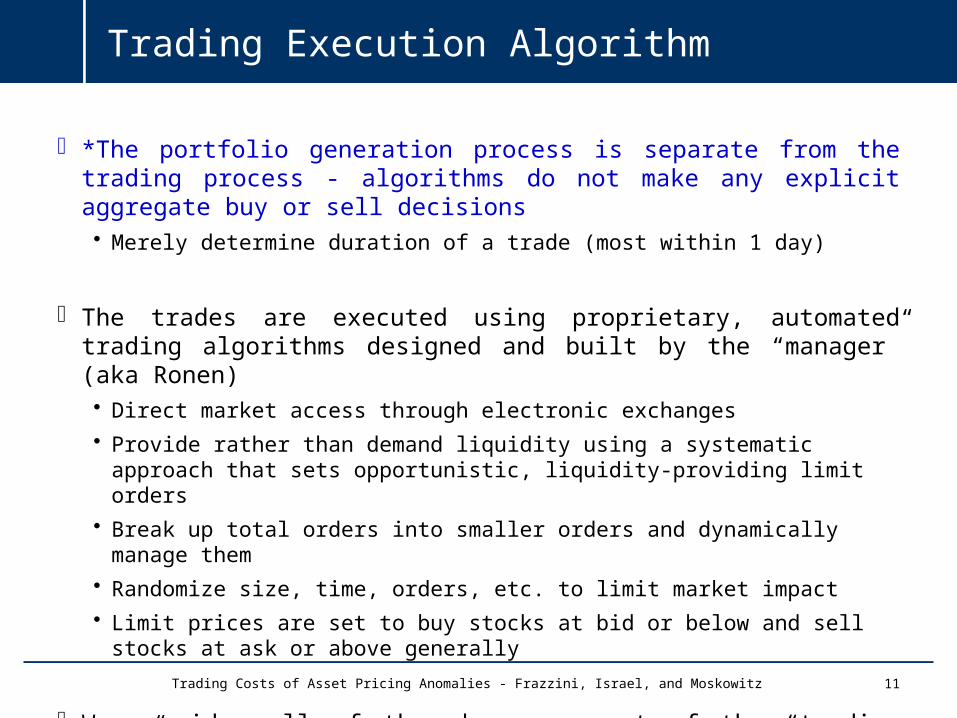
*The portfolio generation process is separate from the trading process - algorithms do not make any explicit aggregate buy or sell decisions• Merely determine duration of a trade (most within 1 day)
The trades are executed using proprietary, automated trading algorithms designed and built by the “manager” (aka Ronen)• Direct market access through electronic exchanges
• Provide rather than demand liquidity using a systematic approach that sets opportunistic, liquidity-providing limit orders
• Break up total orders into smaller orders and dynamically manage them
• Randomize size, time, orders, etc. to limit market impact
• Limit prices are set to buy stocks at bid or below and sell stocks at ask or above generally
We consider all of the above as part of the “trading cost” of a large arbitrageur
11Trading Costs of Asset Pricing Anomalies - Frazzini, Israel, and Moskowitz

Click to edit Master title style-5
0
5
10
15
12
Market Impact(BPs)
Time
Portfolio Formation
Order Submission
PortfolioCompleted
ExecutionPeriod
Pre-execution
ExecutionPrices
Market Impact
PermanentImpact
TemporaryImpact
Measuring Market Impact: A Theoretical Example
Trading Costs of Asset Pricing Anomalies - Frazzini, Israel, and Moskowitz
AverageMarket Impact = 11 bps
TemporaryImpact = 2.5 bps
PermanentImpact = 8.5 bps
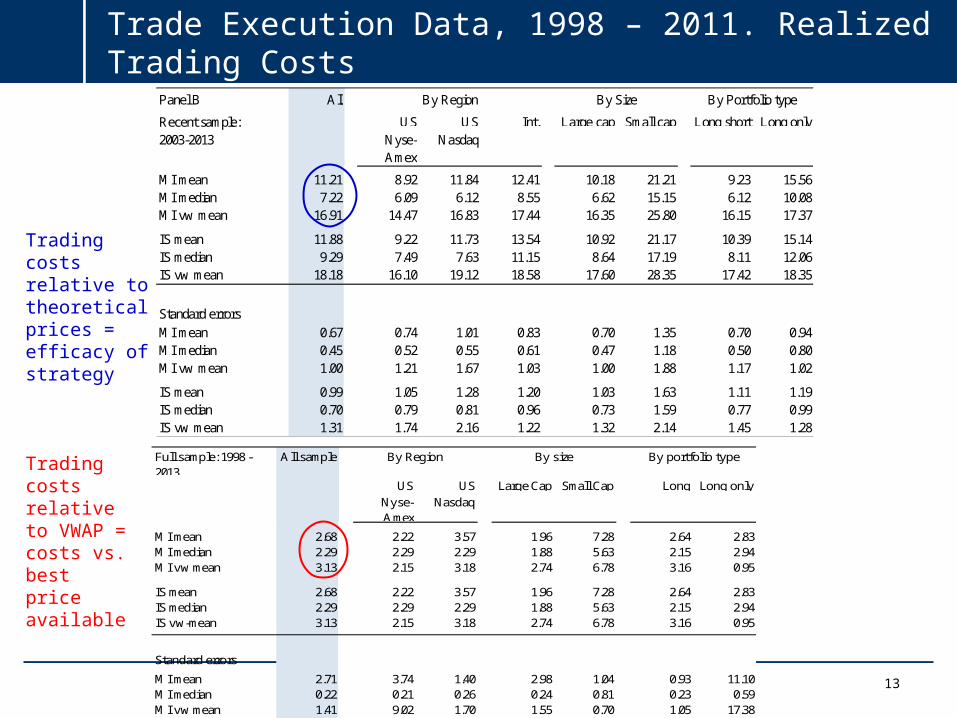
Full sample: 1998 - 2013
All sample
US US Large Cap Small Cap Long short
Long onlyNyse-Amex
Nasdaq
MI mean 2.68 # 2.22 3.57 # 1.96 7.28 # 2.64 2.83MI median 2.29 # 2.29 2.29 # 1.88 5.63 # 2.15 2.94MI vw mean 3.13 # 2.15 3.18 # 2.74 6.78 # 3.16 0.95
IS mean 2.68 # 2.22 3.57 # 1.96 7.28 # 2.64 2.83IS median 2.29 # 2.29 2.29 # 1.88 5.63 # 2.15 2.94IS vw-mean 3.13 # 2.15 3.18 # 2.74 6.78 # 3.16 0.95
Standard errors
MI mean 2.71 3.74 1.40 2.98 1.04 0.93 11.10MI median 0.22 0.21 0.26 0.24 0.81 0.23 0.59MI vw mean 1.41 9.02 1.70 1.55 0.70 1.05 17.38
IS mean 2.71 3.74 1.40 2.98 1.04 0.93 11.10IS median 0.22 0.21 0.26 0.24 0.81 0.23 0.59IS vw-mean 1.41 9.02 1.70 1.55 0.70 1.05 17.38
By Region By size By portfolio type
Panel B All sampleRecent sample: US US Int. Large cap Small cap Long short Long only
2003-2013 Nyse-Amex
Nasdaq
MI mean 11.21 # 8.92 11.84 12.41 # 10.18 21.21 # 9.23 15.56MI median 7.22 # 6.09 6.12 8.55 # 6.62 15.15 # 6.12 10.08MI vw mean 16.91 # 14.47 16.83 17.44 # 16.35 25.80 # 16.15 17.37
IS mean 11.88 # 9.22 11.73 13.54 # 10.92 21.17 # 10.39 15.14IS median 9.29 # 7.49 7.63 11.15 # 8.64 17.19 # 8.11 12.06IS vw mean 18.18 # 16.10 19.12 18.58 # 17.60 28.35 # 17.42 18.35
Standard errors
MI mean 0.67 0.74 1.01 0.83 0.70 1.35 0.70 0.94MI median 0.45 0.52 0.55 0.61 0.47 1.18 0.50 0.80MI vw mean 1.00 1.21 1.67 1.03 1.00 1.88 1.17 1.02
IS mean 0.99 1.05 1.28 1.20 1.03 1.63 1.11 1.19IS median 0.70 0.79 0.81 0.96 0.73 1.59 0.77 0.99IS vw mean 1.31 1.74 2.16 1.22 1.32 2.14 1.45 1.28
By Region By Size By Portfolio type
Trade Execution Data, 1998 – 2011. Realized Trading Costs
13
Trading costs relative to theoretical prices = efficacy of strategy
Trading costs relative to VWAP = costs vs. best price available
Interpretation
How generalizable are the results?
How exogenous are trading costs to the portfolios being traded by our manager?
Trading costs we estimate are fairly independent from the portfolios being traded.
1. Only examine live trades of longer-term strategies, where portfolio formation process is separate from the trading process executing it.
2. Set of intended trades is primarily created from specific client mandates that often adhere to a benchmark subject to a tracking error constraint of a few percent.
3. Manager uses proprietary trading algorithms, but algorithms cannot make any buy or sell decisions. Only determine duration of trade (1-3 days).
4. Exclude all high frequency trading.
We also examine only the first trade from new inflows.
14Trading Costs of Asset Pricing Anomalies - Frazzini, Israel, and Moskowitz
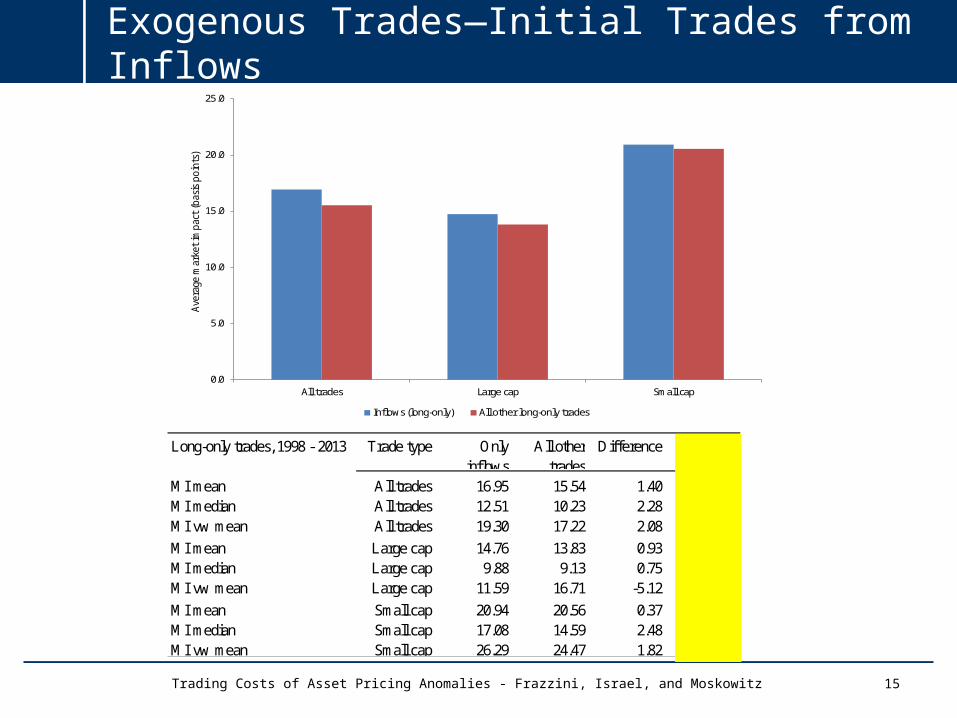
Long-only trades, 1998 - 2013 Trade type Only inflows
All other trades
Difference t -statistics
MI mean All trades 16.95 15.54 1.40 0.20MI median All trades 12.51 10.23 2.28 0.35MI vw mean All trades 19.30 17.22 2.08 0.31
MI mean Large cap 14.76 13.83 0.93 0.11MI median Large cap 9.88 9.13 0.75 0.09MI vw mean Large cap 11.59 16.71 -5.12 -0.66
MI mean Small cap 20.94 20.56 0.37 0.07MI median Small cap 17.08 14.59 2.48 0.54MI vw mean Small cap 26.29 24.47 1.82 0.25
Exogenous Trades—Initial Trades from Inflows
15Trading Costs of Asset Pricing Anomalies - Frazzini, Israel, and Moskowitz
0.0
5.0
10.0
15.0
20.0
25.0
All trades Large cap Small cap
Ave
rage
mar
ket
impa
ct (b
asis
poi
nts)
Inflows (long-only) All other long-only trades
Regression Results: Tcost Model
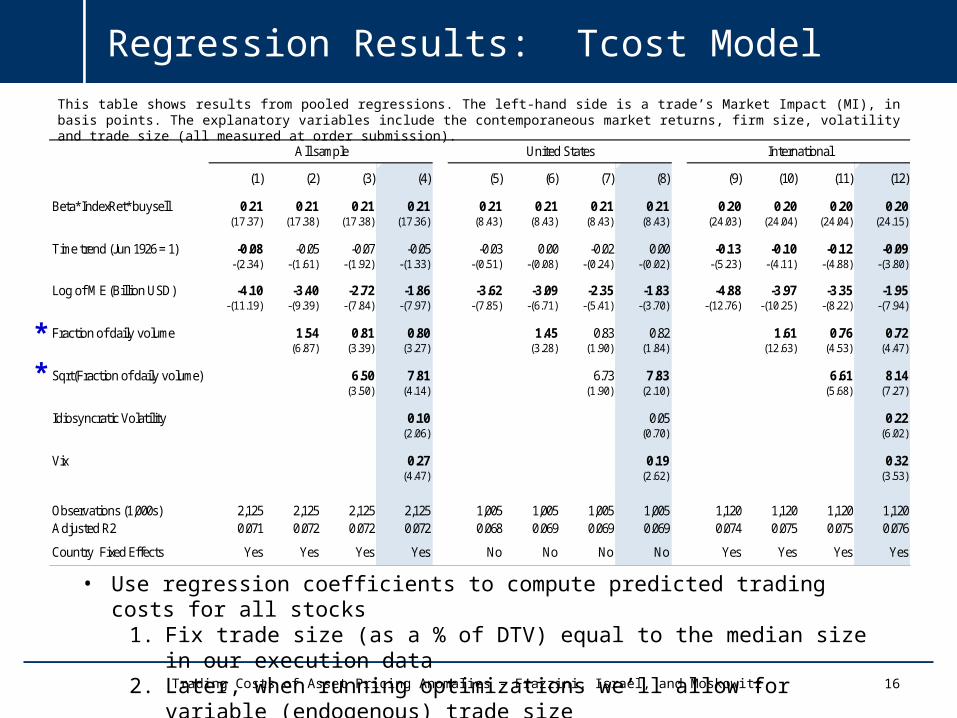
This table shows results from pooled regressions. The left-hand side is a trade’s Market Impact (MI), in basis points. The explanatory variables include the contemporaneous market returns, firm size, volatility and trade size (all measured at order submission).
16Trading Costs of Asset Pricing Anomalies - Frazzini, Israel, and Moskowitz
*
*
• Use regression coefficients to compute predicted trading costs for all stocks1. Fix trade size (as a % of DTV) equal to the median size in our execution data2. Later, when running optimizations we’ll allow for variable (endogenous) trade size
(1) (2) (3) (4) (5) (6) (7) (8) (9) (10) (11) (12)
Beta*IndexRet*buysell 0.21 0.21 0.21 0.21 0.21 0.21 0.21 0.21 0.20 0.20 0.20 0.20(17.37) (17.38) (17.38) (17.36) (8.43) (8.43) (8.43) (8.43) (24.03) (24.04) (24.04) (24.15)
Time trend (Jun 1926 = 1) -0.08 -0.05 -0.07 -0.05 -0.03 0.00 -0.02 0.00 -0.13 -0.10 -0.12 -0.09-(2.34) -(1.61) -(1.92) -(1.33) -(0.51) -(0.08) -(0.24) -(0.02) -(5.23) -(4.11) -(4.88) -(3.80)
Log of ME (Billion USD) -4.10 -3.40 -2.72 -1.86 -3.62 -3.09 -2.35 -1.83 -4.88 -3.97 -3.35 -1.95-(11.19) -(9.39) -(7.84) -(7.97) -(7.85) -(6.71) -(5.41) -(3.70) -(12.76) -(10.25) -(8.22) -(7.94)
Fraction of daily volume . 1.54 0.81 0.80 . 1.45 0.83 0.82 . 1.61 0.76 0.72
.(6.87) (3.39) (3.27)
.(3.28) (1.90) (1.84)
.(12.63) (4.53) (4.47)
Sqrt(Fraction of daily volume) . . 6.50 7.81 . . 6.73 7.83 . . 6.61 8.14
. .(3.50) (4.14)
. .(1.90) (2.10)
. .(5.68) (7.27)
Idiosyncratic Volatility . . . 0.10 . . . 0.05 . . . 0.22
. . .(2.06)
. . .(0.70)
. . .(6.02)
Vix . . . 0.27 . . . 0.19 . . . 0.32
. . .(4.47)
. . .(2.62)
. . .(3.53)
Observations (1,000s) 2,125 2,125 2,125 2,125 1,005 1,005 1,005 1,005 1,120 1,120 1,120 1,120Adjusted R2 0.071 0.072 0.072 0.072 0.068 0.069 0.069 0.069 0.074 0.075 0.075 0.076
Country Fixed Effects Yes Yes Yes Yes No No No No Yes Yes Yes Yes
All sample United States International
Market Impact by Fraction of Trading Volume, 1998 – 2011
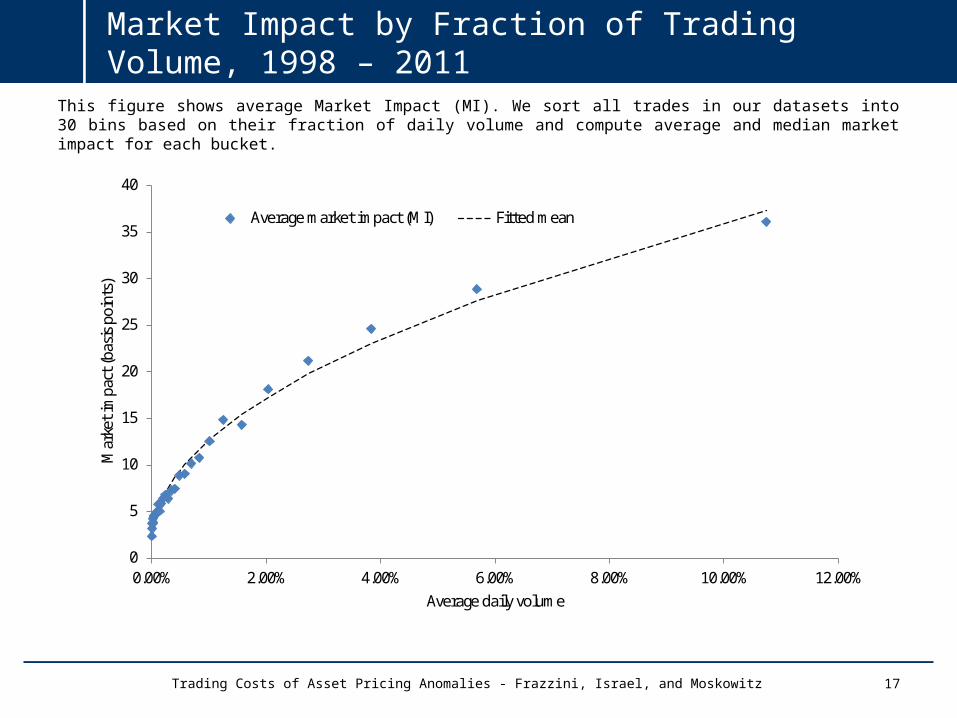
This figure shows average Market Impact (MI). We sort all trades in our datasets into 30 bins based on their fraction of daily volume and compute average and median market impact for each bucket.
17Trading Costs of Asset Pricing Anomalies - Frazzini, Israel, and Moskowitz
0
5
10
15
20
25
30
35
40
0.00% 2.00% 4.00% 6.00% 8.00% 10.00% 12.00%
Mar
ket i
mpa
ct (b
asis
poi
nts)
Average daily volume
Average market impact (MI) Fitted mean
SMB HML UMD Combo SMB HML UMD ComboDollar traded per month (Billion USD) 9.69 5.97 6.18 9.69 11.80 7.15 8.38 12.77Implied Fund size (Billion USD) 18.18 9.42 5.21 16.91 17.88 10.09 6.85 19.74
Realized cost 1.47 1.35 3.03 1.46 1.70 1.54 2.24 1.24Break-even cost 2.95 4.95 8.20 5.39 -0.17 5.78 7.65 4.68Realized minus breakeven -1.48 -3.61 -5.17 -3.93 1.87 -4.24 -5.40 -3.44t statistics (-7.78) (-18.55) (-12.59) (-21.81) (7.50) (-16.52) (-17.64) (-19.95)
Return (Gross) 7.98 4.86 2.26 5.04 1.17 5.59 4.02 3.59(3.01) (1.12) (0.40) (3.17) (0.75) (1.83) (0.92) (2.88)
Return (Net) 6.52 3.51 -0.77 3.58 -0.53 4.05 1.78 2.35(2.48) (0.80) -(0.14) (2.23) -(0.33) (1.32) (0.41) (1.86)
Turnover (monthly) 0.53 0.63 1.19 0.57 0.66 0.71 1.22 0.65MI (bps) 22.94 17.71 21.30 21.22 21.42 18.12 15.27 16.02
Sharpe ratio (gross) 0.78 0.29 0.10 0.82 0.20 0.47 0.24 0.75Sharpe ratio (net) 0.65 0.21 -0.04 0.58 -0.09 0.34 0.11 0.48
Number of months 178 178 178 178 178 178 178 178
Panel B: International trade execution sample, 1998 - 2013Panel A: U.S. trade execution sample, 1998 - 2013
Returns Results – Trade Execution Sample – U.S.
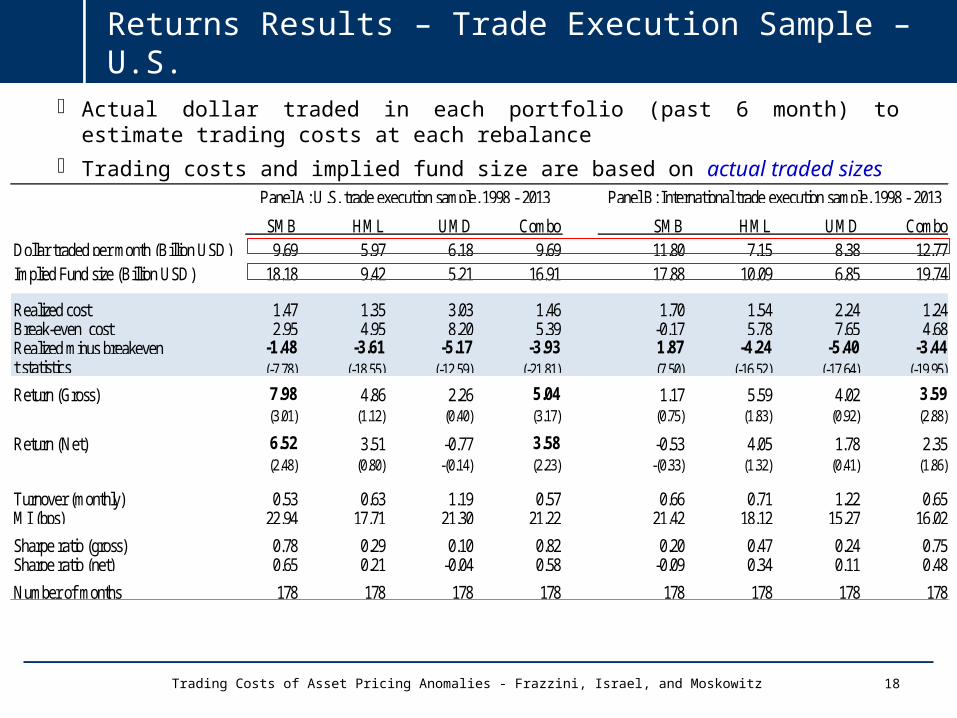
Actual dollar traded in each portfolio (past 6 month) to estimate trading costs at each rebalance
Trading costs and implied fund size are based on actual traded sizes
18Trading Costs of Asset Pricing Anomalies - Frazzini, Israel, and Moskowitz
Optimized Portfolios
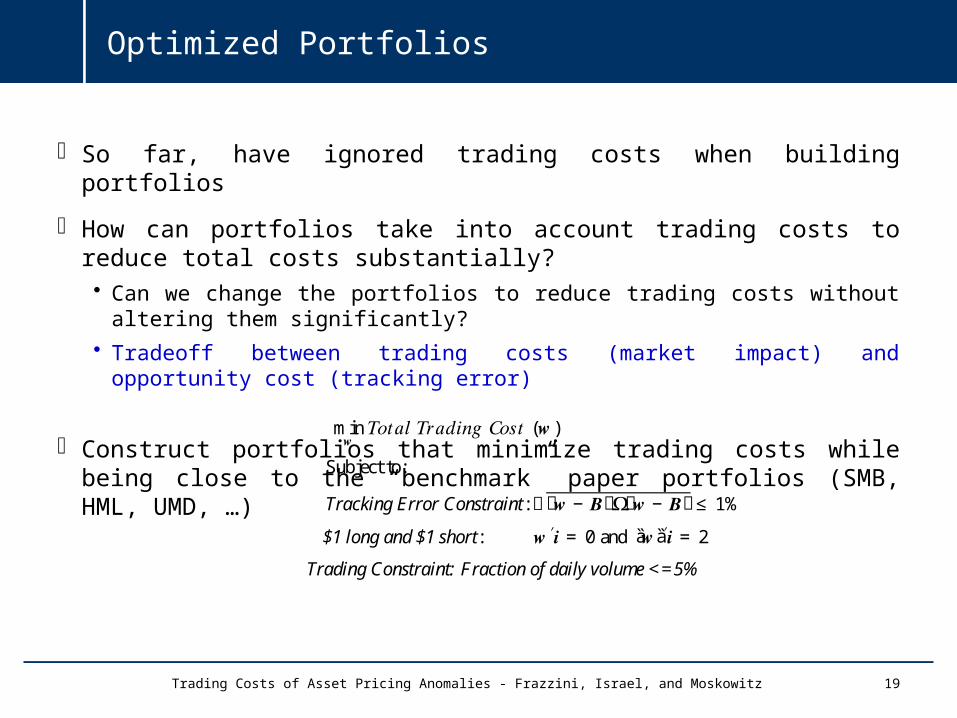
So far, have ignored trading costs when building portfolios
How can portfolios take into account trading costs to reduce total costs substantially?• Can we change the portfolios to reduce trading costs without altering them significantly?
• Tradeoff between trading costs (market impact) and opportunity cost (tracking error)
Construct portfolios that minimize trading costs while being close to the “benchmark” paper portfolios (SMB, HML, UMD, …)
*Working on separating tracking error into style drift vs. idiosyncratic error (done)
19
min𝒘 𝑇𝑜𝑡𝑎𝑙 𝑇𝑟𝑎𝑑𝑖𝑛𝑔 𝐶𝑜𝑠𝑡 (𝒘)
Subject to:
Tracking Error Constraint: ඥሺ𝒘− 𝑩ሻ𝛀ሺ𝒘− 𝑩ሻ≤ 1%
$1 long and $1 short: 𝒘′𝒊 = 0 and ȁ�𝒘ȁ�′𝒊 = 2
Trading Constraint: Fraction of daily volume <=5%
Trading Costs of Asset Pricing Anomalies - Frazzini, Israel, and Moskowitz
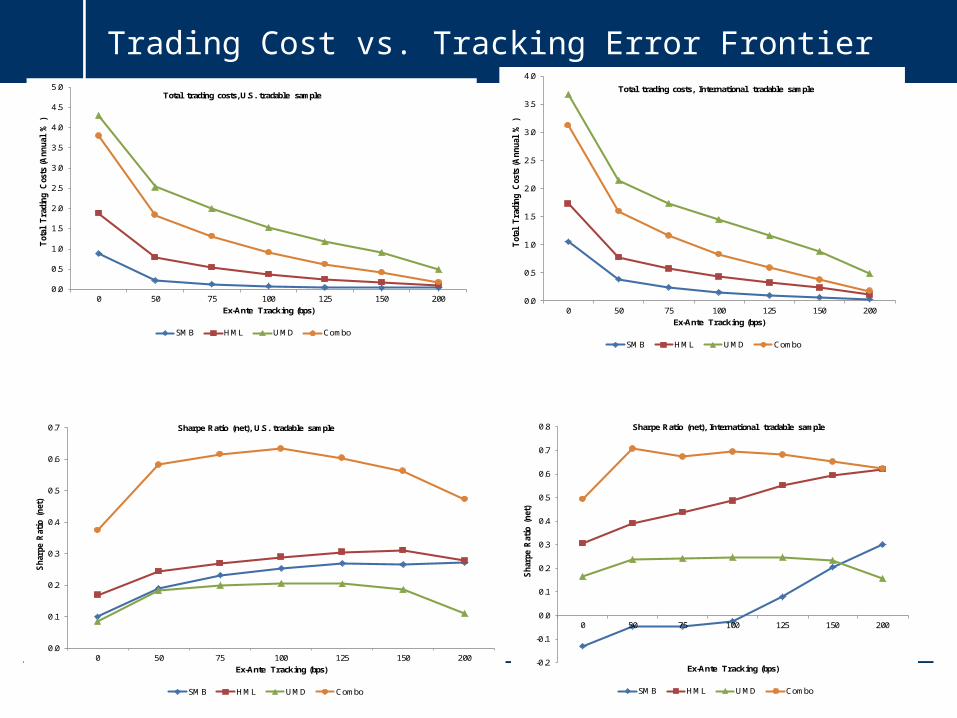
Trading Cost vs. Tracking Error Frontier
20Trading Costs of Asset Pricing Anomalies - Frazzini, Israel, and Moskowitz
0.0
0.5
1.0
1.5
2.0
2.5
3.0
3.5
4.0
4.5
5.0
0 50 75 100 125 150 200
Tot
al T
radi
ng
Cos
ts (
An
nu
al %
)
Ex-Ante Tracking (bps)
Total trading costs, U.S. tradable sample
SMB HML UMD Combo
0.0
0.1
0.2
0.3
0.4
0.5
0.6
0.7
0 50 75 100 125 150 200
Sh
arpe
Rat
io (
net
)
Ex-Ante Tracking (bps)
Sharpe Ratio (net), U.S. tradable sample
SMB HML UMD Combo
0.0
0.5
1.0
1.5
2.0
2.5
3.0
3.5
4.0
0 50 75 100 125 150 200
Tot
al T
radi
ng
Cos
ts (
An
nu
al %
)
Ex-Ante Tracking (bps)
Total trading costs, International tradable sample
SMB HML UMD Combo
-0.2
-0.1
0.0
0.1
0.2
0.3
0.4
0.5
0.6
0.7
0.8
0 50 75 100 125 150 200
Sh
arpe
Rat
io (
net
)
Ex-Ante Tracking (bps)
Sharpe Ratio (net), International tradable sample
SMB HML UMD Combo
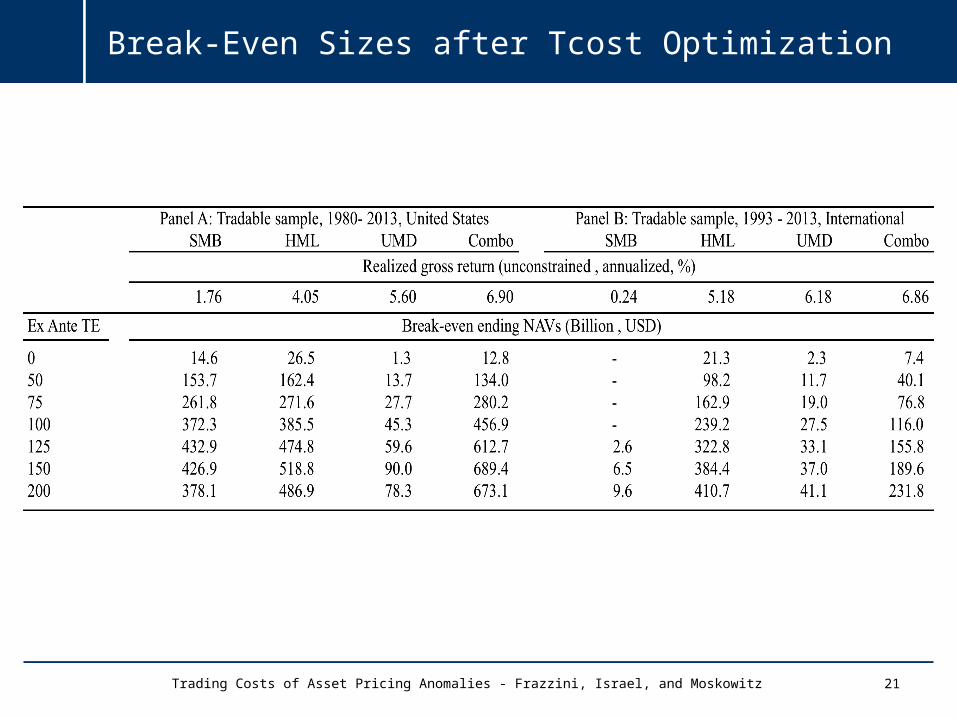
Break-Even Sizes after Tcost Optimization
21Trading Costs of Asset Pricing Anomalies - Frazzini, Israel, and Moskowitz
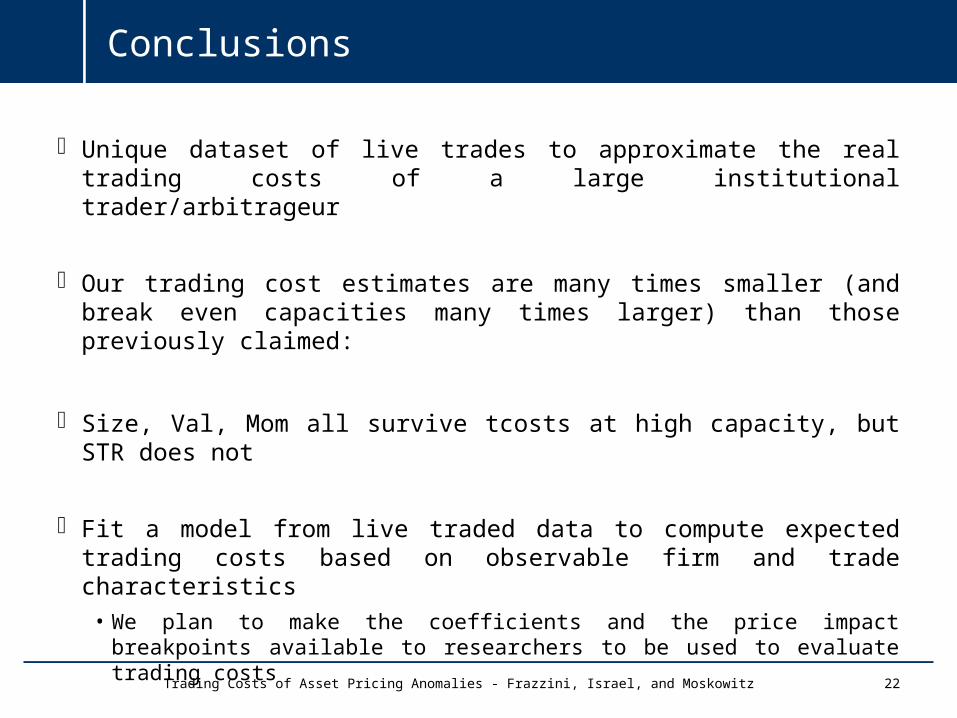
Conclusions
Unique dataset of live trades to approximate the real trading costs of a large institutional trader/arbitrageur
Our trading cost estimates are many times smaller (and break even capacities many times larger) than those previously claimed:
Size, Val, Mom all survive tcosts at high capacity, but STR does not
Fit a model from live traded data to compute expected trading costs based on observable firm and trade characteristics
• We plan to make the coefficients and the price impact breakpoints available to researchers to be used to evaluate trading costs
22Trading Costs of Asset Pricing Anomalies - Frazzini, Israel, and Moskowitz
APPENDIX
23Trading Costs of Asset Pricing Anomalies - Frazzini, Israel, and Moskowitz
Defining Trading Costs
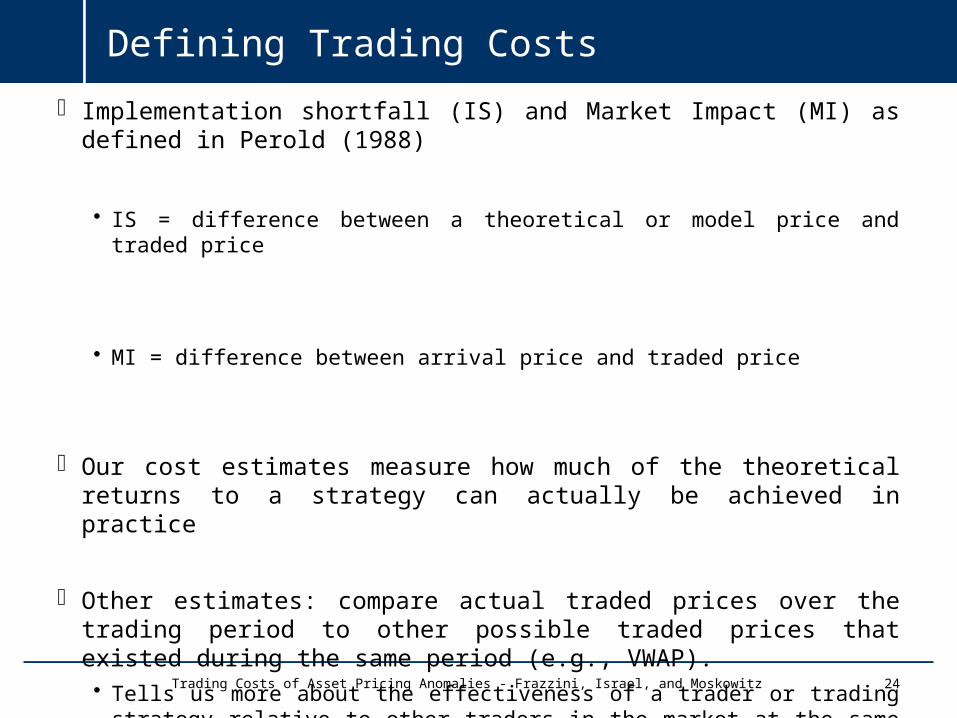
Implementation shortfall (IS) and Market Impact (MI) as defined in Perold (1988)
• IS = difference between a theoretical or model price and traded price
• MI = difference between arrival price and traded price
Our cost estimates measure how much of the theoretical returns to a strategy can actually be achieved in practice
Other estimates: compare actual traded prices over the trading period to other possible traded prices that existed during the same period (e.g., VWAP). • Tells us more about the effectiveness of a trader or trading strategy relative to other traders
in the market at the same time, not the efficacy of an investment strategy
24Trading Costs of Asset Pricing Anomalies - Frazzini, Israel, and Moskowitz
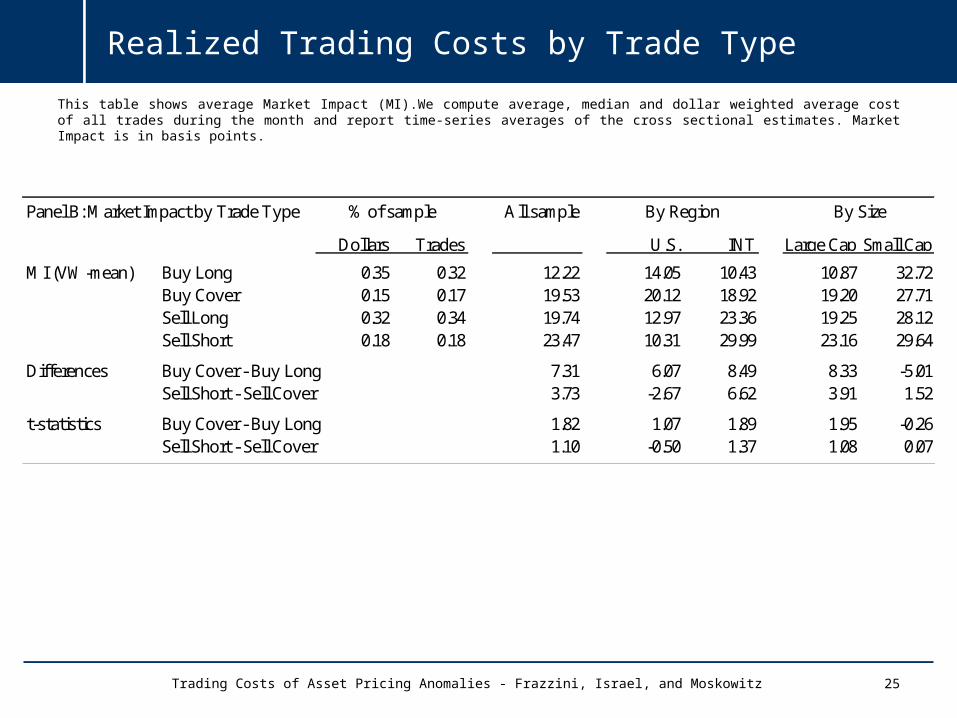
Realized Trading Costs by Trade Type
This table shows average Market Impact (MI).We compute average, median and dollar weighted average cost of all trades during the month and report time-series averages of the cross sectional estimates. Market Impact is in basis points.
25
All sample
Dollars Trades U.S. INT Large Cap Small Cap
MI (VW-mean) Buy Long 0.35 0.32 12.22 14.05 10.43 10.87 32.72Buy Cover 0.15 0.17 19.53 20.12 18.92 19.20 27.71Sell Long 0.32 0.34 19.74 12.97 23.36 19.25 28.12Sell Short 0.18 0.18 23.47 10.31 29.99 23.16 29.64
Differences Buy Cover - Buy Long 7.31 6.07 8.49 8.33 -5.01Sell Short - Sell Cover 3.73 -2.67 6.62 3.91 1.52
t-statistics Buy Cover - Buy Long 1.82 1.07 1.89 1.95 -0.26Sell Short - Sell Cover 1.10 -0.50 1.37 1.08 0.07
Panel B: Market Impact by Trade Type By Region By Size% of sample
Trading Costs of Asset Pricing Anomalies - Frazzini, Israel, and Moskowitz
SMB HML UMD Combo SMB HML UMD Combo
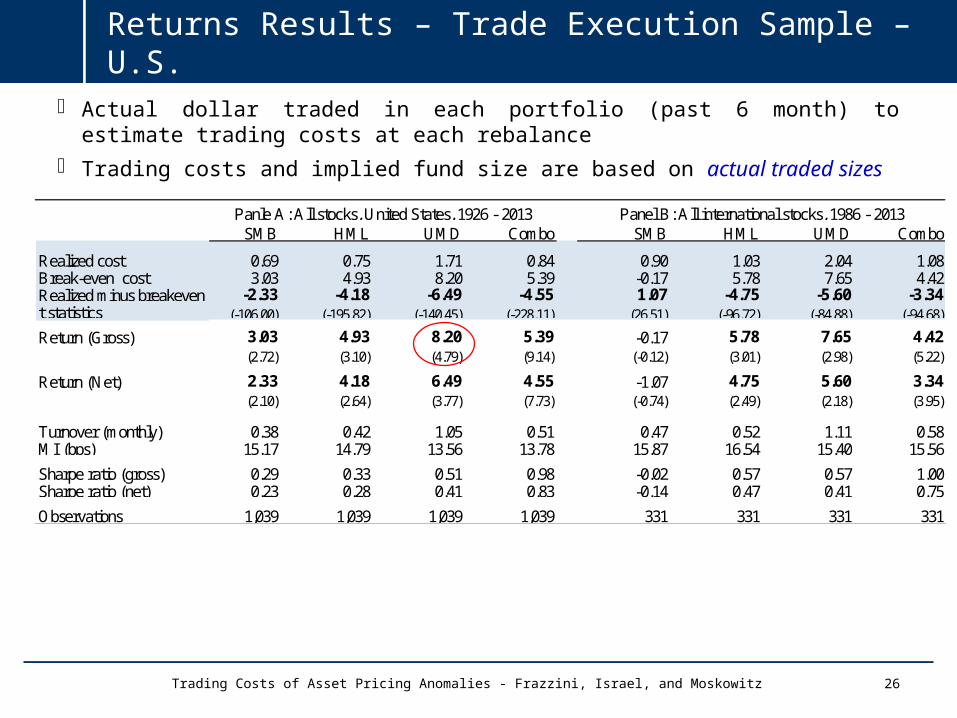
Realized cost 0.69 0.75 1.71 0.84 0.90 1.03 2.04 1.08Break-even cost 3.03 4.93 8.20 5.39 -0.17 5.78 7.65 4.42Realized minus breakeven -2.33 -4.18 -6.49 -4.55 1.07 -4.75 -5.60 -3.34t statistics (-106.00) (-195.82) (-140.45) (-228.11) (26.51) (-96.72) (-84.88) (-94.68)
Return (Gross) 3.03 4.93 8.20 5.39 -0.17 5.78 7.65 4.42(2.72) (3.10) (4.79) (9.14) (-0.12) (3.01) (2.98) (5.22)
Return (Net) 2.33 4.18 6.49 4.55 -1.07 4.75 5.60 3.34(2.10) (2.64) (3.77) (7.73) (-0.74) (2.49) (2.18) (3.95)
Turnover (monthly) 0.38 0.42 1.05 0.51 0.47 0.52 1.11 0.58MI (bps) 15.17 14.79 13.56 13.78 15.87 16.54 15.40 15.56
Sharpe ratio (gross) 0.29 0.33 0.51 0.98 -0.02 0.57 0.57 1.00Sharpe ratio (net) 0.23 0.28 0.41 0.83 -0.14 0.47 0.41 0.75
Observations 1,039 1,039 1,039 1,039 331 331 331 331
Panle A: All stocks, United States, 1926 - 2013 Panel B: All international stocks, 1986 - 2013
Returns Results – Trade Execution Sample – U.S.
Actual dollar traded in each portfolio (past 6 month) to estimate trading costs at each rebalance
Trading costs and implied fund size are based on actual traded sizes
26Trading Costs of Asset Pricing Anomalies - Frazzini, Israel, and Moskowitz
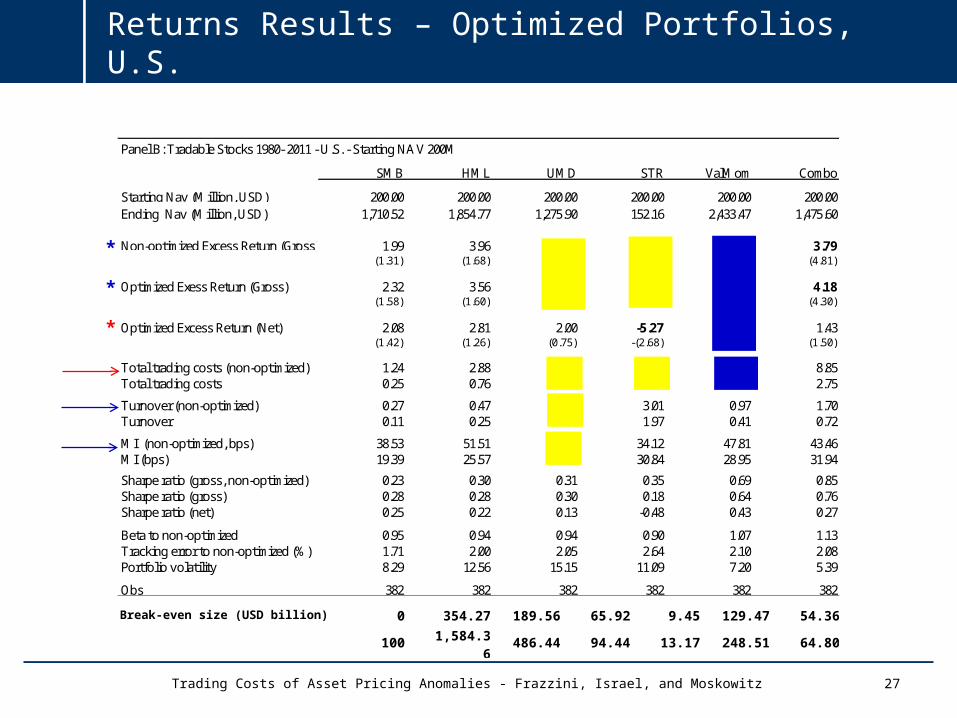
Returns Results – Optimized Portfolios, U.S.
27
Panel B: Tradable Stocks 1980- 2011 - U.S. - Starting NAV 200M
SMB HML UMD STR ValMom Combo
Starting Nav (Million, USD) 200.00 200.00 200.00 200.00 200.00 200.00Ending Nav (Million, USD) 1,710.52 1,854.77 1,275.90 152.16 2,433.47 1,475.60
Non-optimized Excess Return (Gross) 1.99 3.96 4.96 4.23 4.46 3.79(1.31) (1.68) (1.75) (1.98) (3.89) (4.81)
Optimized Exess Return (Gross) 2.32 3.56 4.57 2.03 4.56 4.18(1.58) (1.60) (1.70) (1.01) (3.58) (4.30)
Optimized Excess Return (Net) 2.08 2.81 2.00 -5.27 3.12 1.43(1.42) (1.26) (0.75) -(2.68) (2.45) (1.50)
Total trading costs (non-optimized) 1.24 2.88 5.83 12.31 5.54 8.85Total trading costs 0.25 0.76 2.56 7.30 1.44 2.75
Turnover (non-optimized) 0.27 0.47 1.09 3.01 0.97 1.70Turnover 0.11 0.25 0.68 1.97 0.41 0.72
MI (non-optimized, bps) 38.53 51.51 44.34 34.12 47.81 43.46MI (bps) 19.39 25.57 31.28 30.84 28.95 31.94
Sharpe ratio (gross, non-optimized) 0.23 0.30 0.31 0.35 0.69 0.85Sharpe ratio (gross) 0.28 0.28 0.30 0.18 0.64 0.76Sharpe ratio (net) 0.25 0.22 0.13 -0.48 0.43 0.27
Beta to non-optimized 0.95 0.94 0.94 0.90 1.07 1.13Tracking error to non-optimized (%) 1.71 2.00 2.05 2.64 2.10 2.08Portfolio volatility 8.29 12.56 15.15 11.09 7.20 5.39
Obs 382 382 382 382 382 382
Trading Costs of Asset Pricing Anomalies - Frazzini, Israel, and Moskowitz
*
*
*
Break-even size (USD billion) 0 354.27 189.56 65.92 9.45 129.47 54.36
100 1,584.36 486.44 94.44 13.17 248.51 64.80