Embed Size (px)
Citation preview
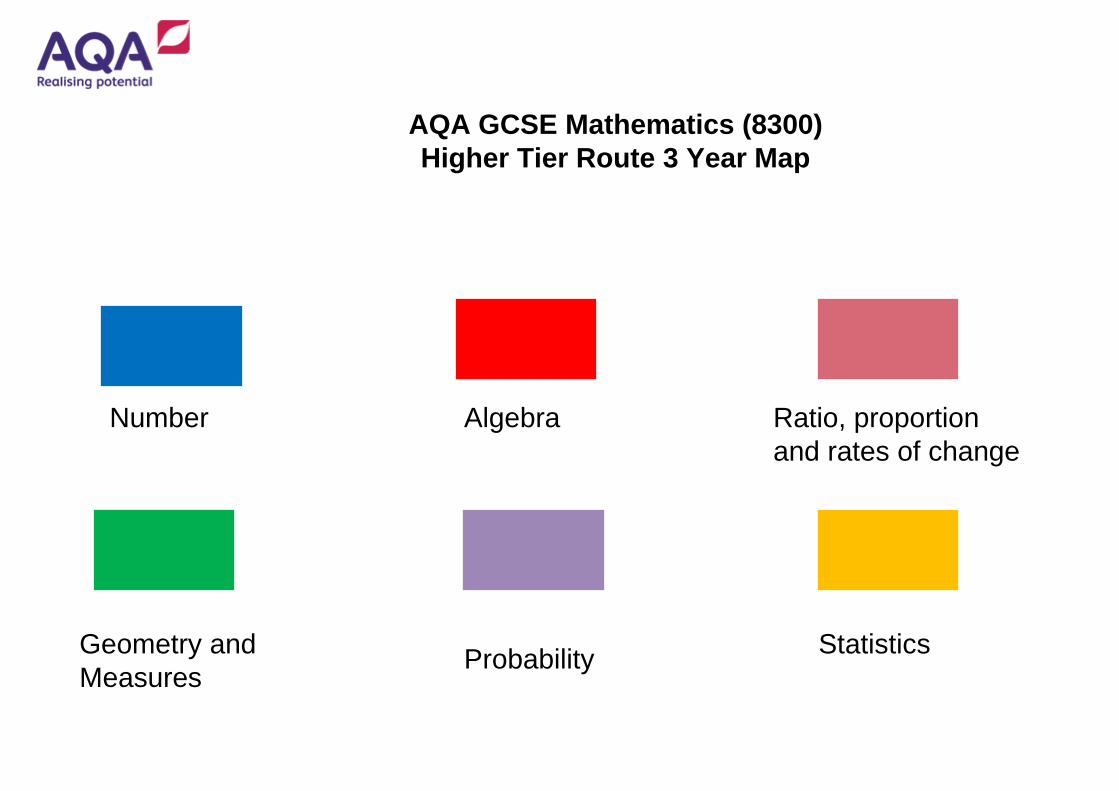
GCSE Mathematics Linear Route Map – Higher Tier
Topic TopicTopic
Number Algebra Geometry & Measures
Topic
Statistics
Number Algebra
Statistics
Ratio, proportion
and rates of change
Geometry and
MeasuresProbability
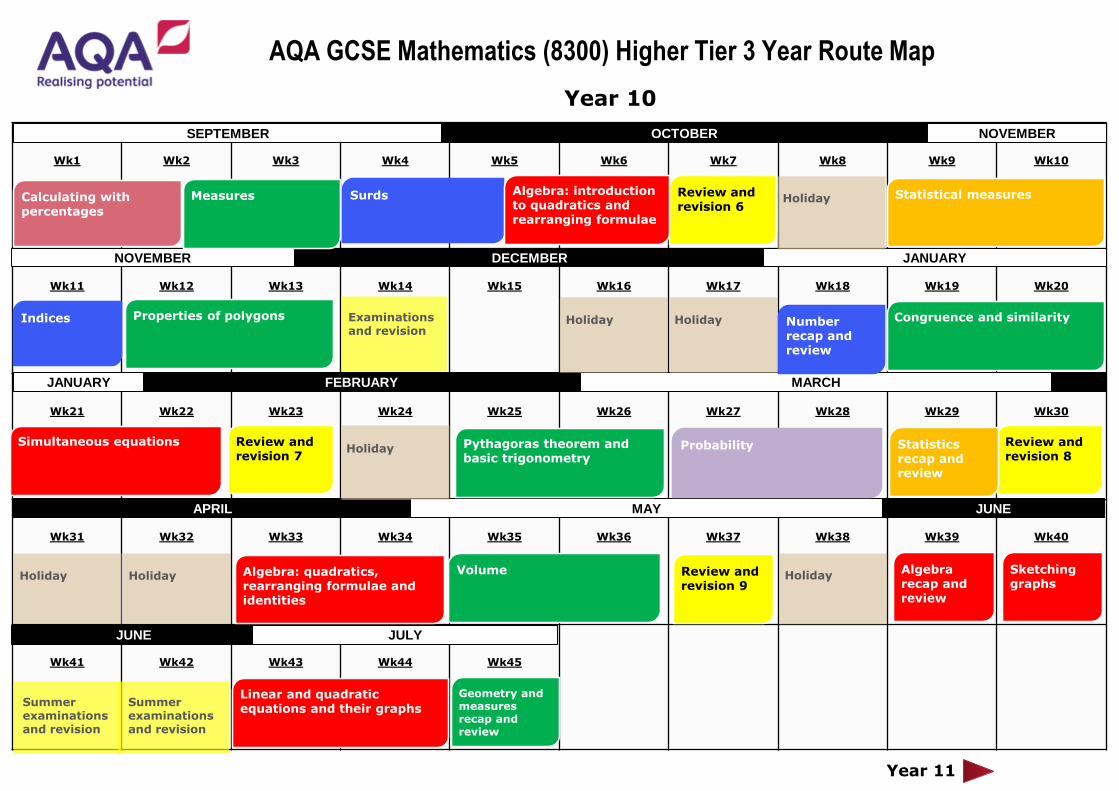
AQA GCSE Mathematics (8300)
Higher Tier Route 3 Year Map

Wk1 Wk2 Wk3 Wk4 Wk5 Wk6 Wk7 Wk8 Wk9 Wk10
Wk11 Wk12 Wk13 Wk14 Wk15 Wk16 Wk17 Wk18 Wk19 Wk20
Wk21 Wk22 Wk23 Wk24 Wk25 Wk26 Wk27 Wk28 Wk29 Wk30
Wk31 Wk32 Wk33 Wk34 Wk35 Wk36 Wk37 Wk38 Wk39 Wk40
Wk41 Wk42 Wk43 Wk44 Wk45
SEPTEMBER OCTOBER NOVEMBER
NOVEMBER DECEMBER JANUARY
JANUARY FEBRUARY MARCH
APRIL MAY JUNE
JUNE JULY
Holiday Holiday
Holiday
Holiday
Holiday
Holiday
Holiday
Basic decimals
Angles
Year 9
Coordinatesand linear graphs
Sequences
Summerexaminationsand revision
Ratio and proportion (Part 1)
Basic algebra
Real life graphsRounding 2D representations of 3D shapes
Equations
Collecting and representing data
Circumference and area
Basic probability
Basic number
Basic percentages
Transformations
Scale diagrams and bearings
Factors & multiples
Basic fractions
Rev
iew
1
Scatter graphs
Standard form
Constructions and loci
AQA GCSE Mathematics (8300) Higher Tier 3 Year Route Map
Perimeter and area (Part 2)
Ratio and proportion (Part 2)
Rev
iew
2
Rev
iew
3
Review 5
Perimeter and Area (Part 1)
Rev
iew
4
Wk1 Wk2 Wk3 Wk4 Wk5 Wk6 Wk7 Wk8 Wk9 Wk10
Wk11 Wk12 Wk13 Wk14 Wk15 Wk16 Wk17 Wk18 Wk19 Wk20
Wk21 Wk22 Wk23 Wk24 Wk25 Wk26 Wk27 Wk28 Wk29 Wk30
Wk31 Wk32 Wk33 Wk34 Wk35 Wk36 Wk37 Wk38 Wk39 Wk40
Wk41 Wk42 Wk43 Wk44 Wk45
SEPTEMBER OCTOBER NOVEMBER
NOVEMBER DECEMBER JANUARY
JANUARY FEBRUARY MARCH
APRIL MAY JUNE
JUNE JULY
Holiday Holiday
Holiday
Holiday
Holiday
Holiday
Holiday
Year 10
Year 11
Summerexaminationsand revision
Summerexaminationsand revision
Examinationsand revision
Statistical measuresCalculating with percentages
Congruence and similarity
SurdsMeasures
Indices Properties of polygons
Review and revision 6
Review and revision 8
Review and revision 7
Number recap and review
Pythagoras theorem and basic trigonometry
Simultaneous equations Probability
Review and revision 9
Statistics recap and review
Algebra: introduction to quadratics and rearranging formulae
Volume Algebra recap and review
Linear and quadratic equations and their graphs
Sketching graphs
Geometry and measures recap and review
Algebra: quadratics, rearranging formulae and identities
AQA GCSE Mathematics (8300) Higher Tier 3 Year Route Map

Wk1 Wk2 Wk3 Wk4 Wk5 Wk6 Wk7 Wk8 Wk9 Wk10
Wk11 Wk12 Wk13 Wk14 Wk15 Wk16 Wk17 Wk18 Wk19 Wk20
Wk21 Wk22 Wk23 Wk24 Wk25 Wk26 Wk27 Wk28 Wk29 Wk30
Wk31 Wk32 Wk33 Wk34 Wk35 Wk36 Wk37 Wk38 Wk39 Wk40
Wk41 Wk42 Wk43 Wk44 Wk45
SEPTEMBER OCTOBER NOVEMBER
NOVEMBER DECEMBER JANUARY
JANUARY FEBRUARY MARCH
APRIL MAY JUNE
JUNE JULY
Holiday
Holiday
Holiday
Holiday
Holiday
Holiday
HolidayFurther equations and graphs
Year 11
Transforming functions
Pre-calculus and area under a curve
Vectors
Juneexaminations
Juneexaminations
Inequalities
Revision
Growth and decay
Mockexaminations and revision
Trigonometry recap and extension
Circle theorems
Revision
Further sketching graphs
Sine and cosine rules
Equation of a circle
Direct and inverse proportion
Numerical methods
Gradients and rate of change
Review and revision 10
Review and revision 11
Review and revision 12
Review and revision 13
AQA GCSE Mathematics (8300) Higher Tier 3 Year Route Map
Specification content: Specification notes:
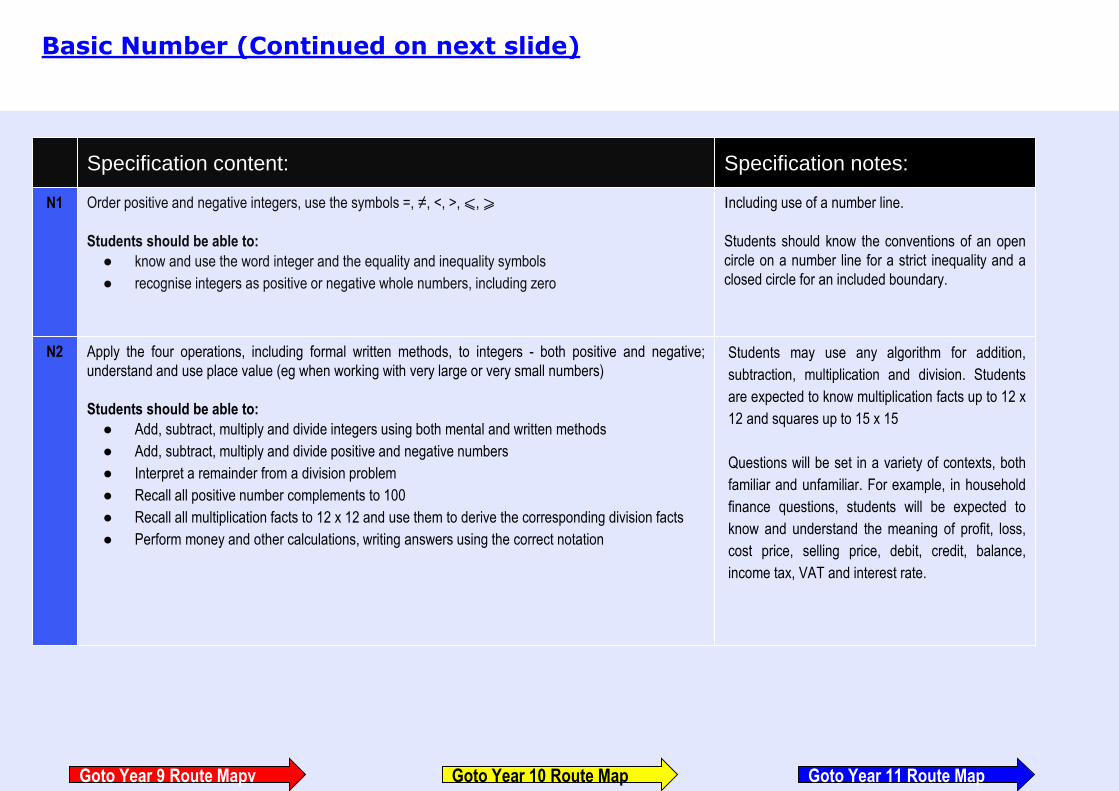
N1 Order positive and negative integers, use the symbols =, ≠, <, >,⩽, ⩾
Students should be able to:
● know and use the word integer and the equality and inequality symbols
● recognise integers as positive or negative whole numbers, including zero
Including use of a number line.
Students should know the conventions of an open
circle on a number line for a strict inequality and a
closed circle for an included boundary.
N2 Apply the four operations, including formal written methods, to integers - both positive and negative;
understand and use place value (eg when working with very large or very small numbers)
Students should be able to:
● Add, subtract, multiply and divide integers using both mental and written methods
● Add, subtract, multiply and divide positive and negative numbers
● Interpret a remainder from a division problem
● Recall all positive number complements to 100
● Recall all multiplication facts to 12 x 12 and use them to derive the corresponding division facts
● Perform money and other calculations, writing answers using the correct notation
Students may use any algorithm for addition,
subtraction, multiplication and division. Students
are expected to know multiplication facts up to 12 x
12 and squares up to 15 x 15
Questions will be set in a variety of contexts, both
familiar and unfamiliar. For example, in household
finance questions, students will be expected to
know and understand the meaning of profit, loss,
cost price, selling price, debit, credit, balance,
income tax, VAT and interest rate.
Basic Number (Continued on next slide)
Goto Year 9 Route Mapv Goto Year 11 Route MapGoto Year 10 Route Map

Specification content: Specification notes:
N3 Recognise and use relationships between operations,
including inverse operations (eg cancellation to simplify calculations and expressions); use conventional
notation for priority of operations, including brackets, powers, roots and reciprocals.
Students should be able to:
● add, subtract, multiply and divide using commutative, associative and distributive laws
● understand and use inverse operations
● use brackets and the hierarchy of operations
● solve problems set in words.
Questions requiring these number skills could be
set, for example, as a numerical part of a question
testing time, fractions, decimals, percentages, ratio
or proportion, interpreting graphs, using a formula in
words or substituting into an algebraic expression,
interpreting a statistical diagram or interrogating a
data set.
N14 Estimate answers; check calculations using approximation and estimation, including answers obtained using
technology.
Students should be able to:
● make sensible estimates of a range of measures in everyday settings
● make sensible estimates of a range of measures in real-life situations, for example estimate the
height of a man
● evaluate results obtained
● use approximation to estimate the value of a calculation
● work out the value of a calculation and check the answer using approximations.
Students should know that when using
approximations for estimating answers, numbers
should be rounded to one significant figure before
the estimating is done.
Basic Number
Goto Year 9 Route Mapv Goto Year 11 Route MapGoto Year 10 Route Map

Specification content: Specification notes:
N4 Use the concepts and vocabulary of prime numbers, factors (divisors), multiples, common factors,
common multiples, highest common factor, lowest common multiple, prime factorisation, including
using product notation and the unique factorisation theorem.
Students should be able to:
● Identify multiples, factors and prime numbers from lists of numbers
● Write out lists of multiples and factors to identify common multiples or common factors of
two or more integers
● Write a number as the product of its prime factors and use formal (eg using Venn
diagrams) and informal methods (eg trial and error) for identifying highest common factors
(HCF) and lowest common multiples (LCM)
● Work out a root of a number from a product of prime factors.
The unique factorisation theorem states that every integer
greater than 1 is prime or can be written as the product of
prime numbers.
Writing a number as the product of its prime factors including
writing in index form.
Abbreviations will not be used in examination papers.
N5 Apply systematic listing strategies
Students should be able to:
● Identify all permutations and combinations and represent them in a variety of formats.
● know and understand why if there are x ways to do task 1 and y ways to do task 2, then there are
xy ways to do both tasks in sequence.
Including using lists, tables and diagrams.
Factors and Multiples
Goto Year 9 Route Mapv Goto Year 11 Route MapGoto Year 10 Route Map

Specification content: Specification notes:
G1 Use conventional terms and notations: points, lines, vertices, edges, planes, parallel lines,
perpendicular lines, right angles, polygons, regular polygons and polygons with reflection and /
or rotation symmetries; use the standard conventions for labelling and referring to the sides and
angles of triangles; draw diagrams from written description.
Students should be able to:
● distinguish between acute, obtuse, reflex and right angles
● name angles
● use one lower-case letter or three upper-case letters to represent an angle, for
example x or ABC
● understand and draw lines that are parallel
● understand that two lines that are perpendicular are at 90o to each other
● identify lines that are perpendicular
● draw a perpendicular line in a diagram
● use geometrical language
● use letters to identify points and lines
● recognise that, for example, in a rectangle ABCD the points A, B, C and D go around in
order
● recognise reflection symmetry of 2D shapes
● understand line symmetry
● identify lines of symmetry on a shape or diagram
● draw lines of symmetry on a shape or diagram
● draw or complete a diagram with a given number of lines of symmetry
● recognise rotational symmetry of 2D shapes
● identify the order of rotational symmetry on a shape or diagram
● draw or complete a diagram with rotational symmetry
● identify and draw lines of symmetry on a Cartesian grid
● identify the order of rotational symmetry of shapes on a Cartesian grid
● draw or complete a diagram with rotational symmetry on a Cartesian grid.
Angles (Continued on next slide)
Goto Year 9 Route Mapv Goto Year 11 Route MapGoto Year 10 Route Map

Specification content: Specification notes:
G3 Apply the properties of angles at a point, angles at a point on a straight line, vertically opposite
angles; understand and use alternate and corresponding angles on parallel lines; derive and
use the sum of angles in a triangle (eg to deduce and use the angle sum in any polygon, and to
derive properties of regular polygons)
Students should be able to:
● work out the size of missing angles at a point
● work out the size of missing angles at a point on a straight line
● know that vertically opposite angles are equal
● estimate the size of an angle in degrees
● justify an answer with explanations such as ‘angles on a straight line’, etc.
● understand and use the angle properties of parallel lines
● recall and use the terms alternate angles and corresponding angles
● work out missing angles using properties of alternate angles, corresponding angles
and interior angles
● understand the consequent properties of parallelograms
● understand the proof that the angle sum of a triangle is 180o
● understand the proof that the exterior angle of a triangle is equal to the sum of the
interior angles at the other two vertices
● use angle properties of equilateral, isosceles and right-angled triangles
Colloquial terms such as Z angles are not acceptable
and should not be used.
Angles
Goto Year 9 Route Mapv Goto Year 11 Route MapGoto Year 10 Route Map
Specification content: Specification Notes:
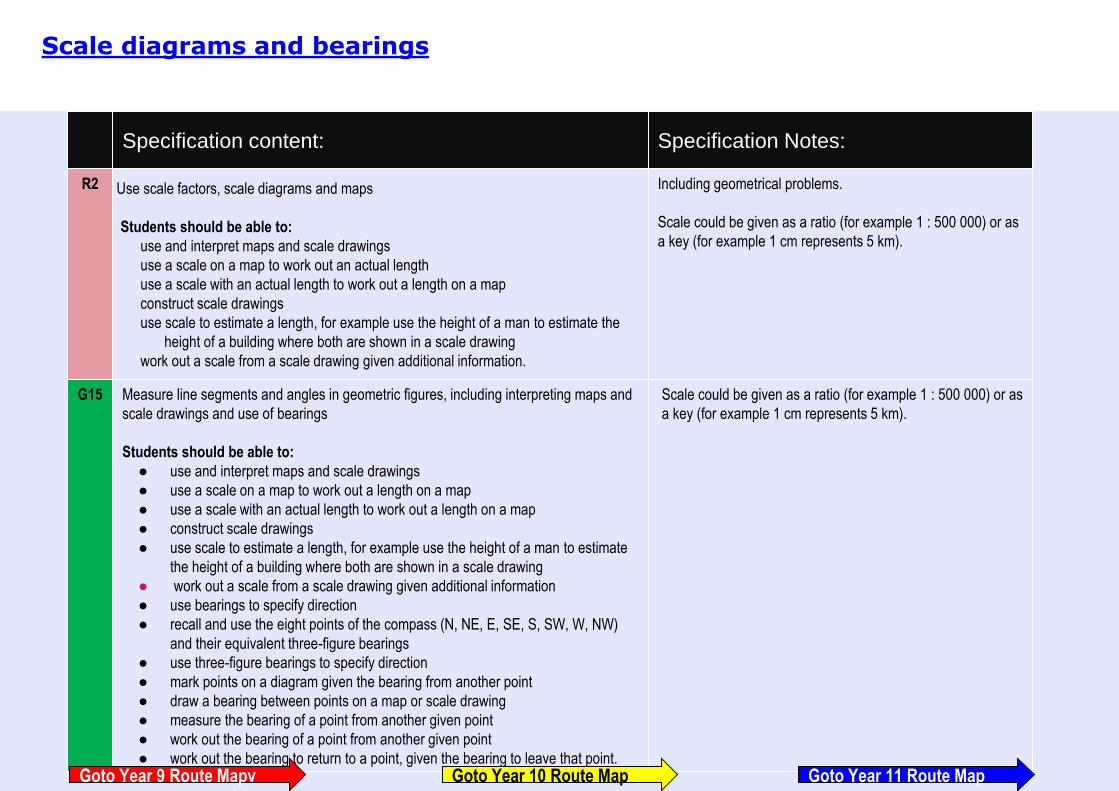
R2 Use scale factors, scale diagrams and maps
Students should be able to:
use and interpret maps and scale drawings
use a scale on a map to work out an actual length
use a scale with an actual length to work out a length on a map
construct scale drawings
use scale to estimate a length, for example use the height of a man to estimate the
height of a building where both are shown in a scale drawing
work out a scale from a scale drawing given additional information.
Including geometrical problems.
Scale could be given as a ratio (for example 1 : 500 000) or as
a key (for example 1 cm represents 5 km).
G15 Measure line segments and angles in geometric figures, including interpreting maps and
scale drawings and use of bearings
Students should be able to:
● use and interpret maps and scale drawings
● use a scale on a map to work out a length on a map
● use a scale with an actual length to work out a length on a map
● construct scale drawings
● use scale to estimate a length, for example use the height of a man to estimate
the height of a building where both are shown in a scale drawing
● work out a scale from a scale drawing given additional information
● use bearings to specify direction
● recall and use the eight points of the compass (N, NE, E, SE, S, SW, W, NW)
and their equivalent three-figure bearings
● use three-figure bearings to specify direction
● mark points on a diagram given the bearing from another point
● draw a bearing between points on a map or scale drawing
● measure the bearing of a point from another given point
● work out the bearing of a point from another given point
● work out the bearing to return to a point, given the bearing to leave that point.
Scale could be given as a ratio (for example 1 : 500 000) or as
a key (for example 1 cm represents 5 km).
Scale diagrams and bearings
Goto Year 9 Route Mapv Goto Year 11 Route MapGoto Year 10 Route Map
Specification content: Specification notes:
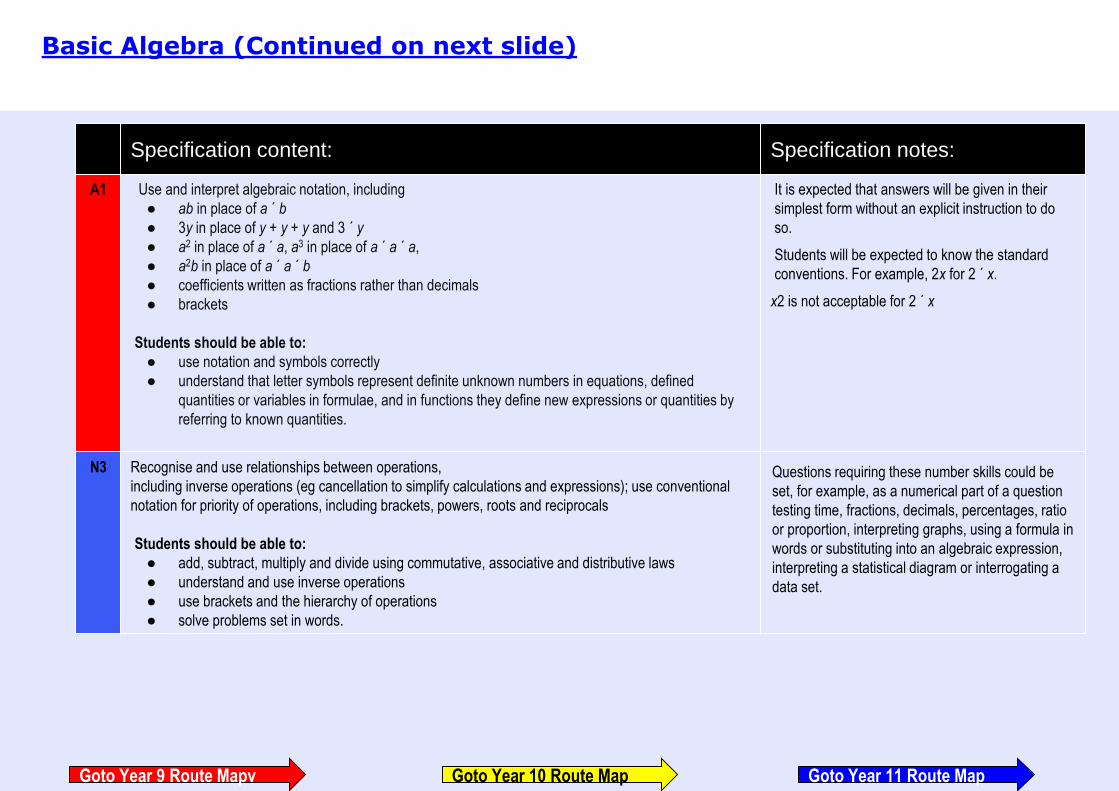
A1 Use and interpret algebraic notation, including
● ab in place of a ´ b
● 3y in place of y + y + y and 3 ´ y
● a2 in place of a ´ a, a3 in place of a ´ a ´ a,
● a2b in place of a ´ a ´ b
● coefficients written as fractions rather than decimals
● brackets
Students should be able to:
● use notation and symbols correctly
● understand that letter symbols represent definite unknown numbers in equations, defined
quantities or variables in formulae, and in functions they define new expressions or quantities by
referring to known quantities.
It is expected that answers will be given in their
simplest form without an explicit instruction to do
so.
Students will be expected to know the standard
conventions. For example, 2x for 2 ´ x.
x2 is not acceptable for 2 ´ x
N3 Recognise and use relationships between operations,
including inverse operations (eg cancellation to simplify calculations and expressions); use conventional
notation for priority of operations, including brackets, powers, roots and reciprocals
Students should be able to:
● add, subtract, multiply and divide using commutative, associative and distributive laws
● understand and use inverse operations
● use brackets and the hierarchy of operations
● solve problems set in words.
Questions requiring these number skills could be
set, for example, as a numerical part of a question
testing time, fractions, decimals, percentages, ratio
or proportion, interpreting graphs, using a formula in
words or substituting into an algebraic expression,
interpreting a statistical diagram or interrogating a
data set.
Basic Algebra (Continued on next slide)
Goto Year 9 Route Mapv Goto Year 11 Route MapGoto Year 10 Route Map
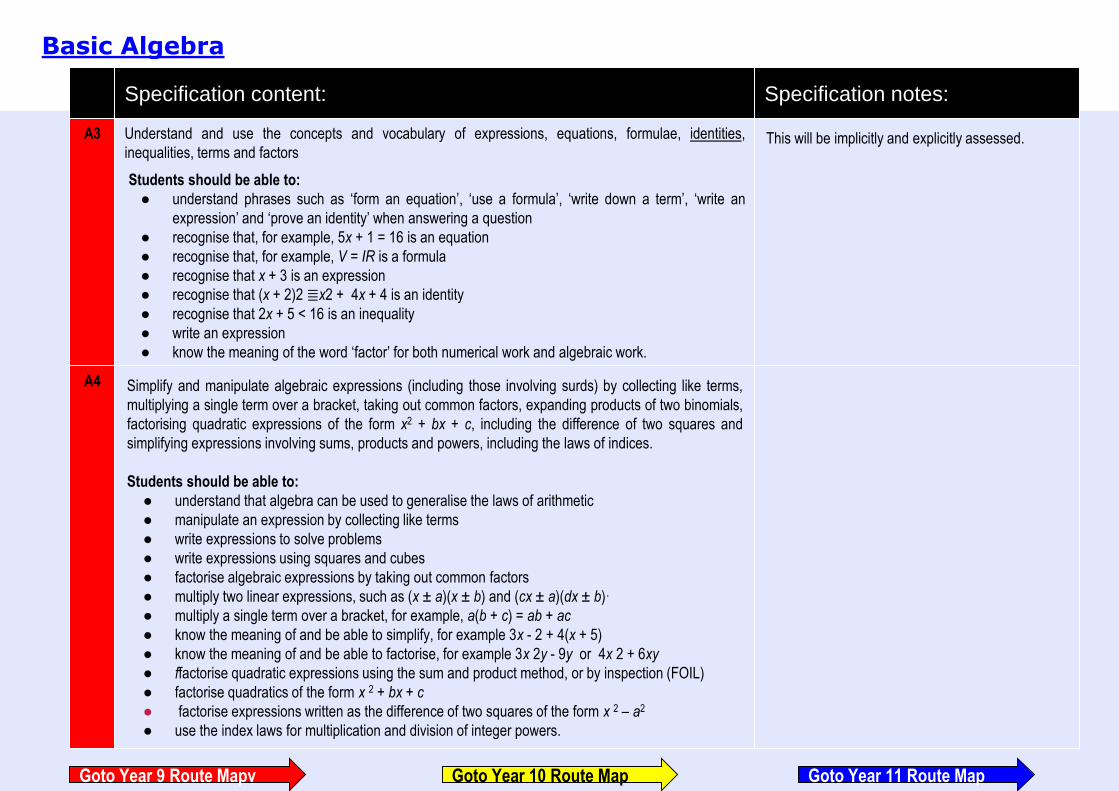
Basic Algebra
Specification content: Specification notes:
A3 Understand and use the concepts and vocabulary of expressions, equations, formulae, identities,
inequalities, terms and factors
Students should be able to:
● understand phrases such as ‘form an equation’, ‘use a formula’, ‘write down a term’, ‘write an
expression’ and ‘prove an identity’ when answering a question
● recognise that, for example, 5x + 1 = 16 is an equation
● recognise that, for example, V = IR is a formula
● recognise that x + 3 is an expression
● recognise that (x + 2)2 ≣x2 + 4x + 4 is an identity
● recognise that 2x + 5 < 16 is an inequality
● write an expression
● know the meaning of the word ‘factor’ for both numerical work and algebraic work.
This will be implicitly and explicitly assessed.
A4 Simplify and manipulate algebraic expressions (including those involving surds) by collecting like terms,
multiplying a single term over a bracket, taking out common factors, expanding products of two binomials,
factorising quadratic expressions of the form x2 + bx + c, including the difference of two squares and
simplifying expressions involving sums, products and powers, including the laws of indices.
Students should be able to:
● understand that algebra can be used to generalise the laws of arithmetic
● manipulate an expression by collecting like terms
● write expressions to solve problems
● write expressions using squares and cubes
● factorise algebraic expressions by taking out common factors
● multiply two linear expressions, such as (x ± a)(x ± b) and (cx ± a)(dx ± b)·
● multiply a single term over a bracket, for example, a(b + c) = ab + ac
● know the meaning of and be able to simplify, for example 3x - 2 + 4(x + 5)
● know the meaning of and be able to factorise, for example 3x 2y - 9y or 4x 2 + 6xy
● ffactorise quadratic expressions using the sum and product method, or by inspection (FOIL)
● factorise quadratics of the form x 2 + bx + c
● factorise expressions written as the difference of two squares of the form x 2 – a2
● use the index laws for multiplication and division of integer powers.
Goto Year 9 Route Mapv Goto Year 11 Route MapGoto Year 10 Route Map
Specification content: Specification notes:
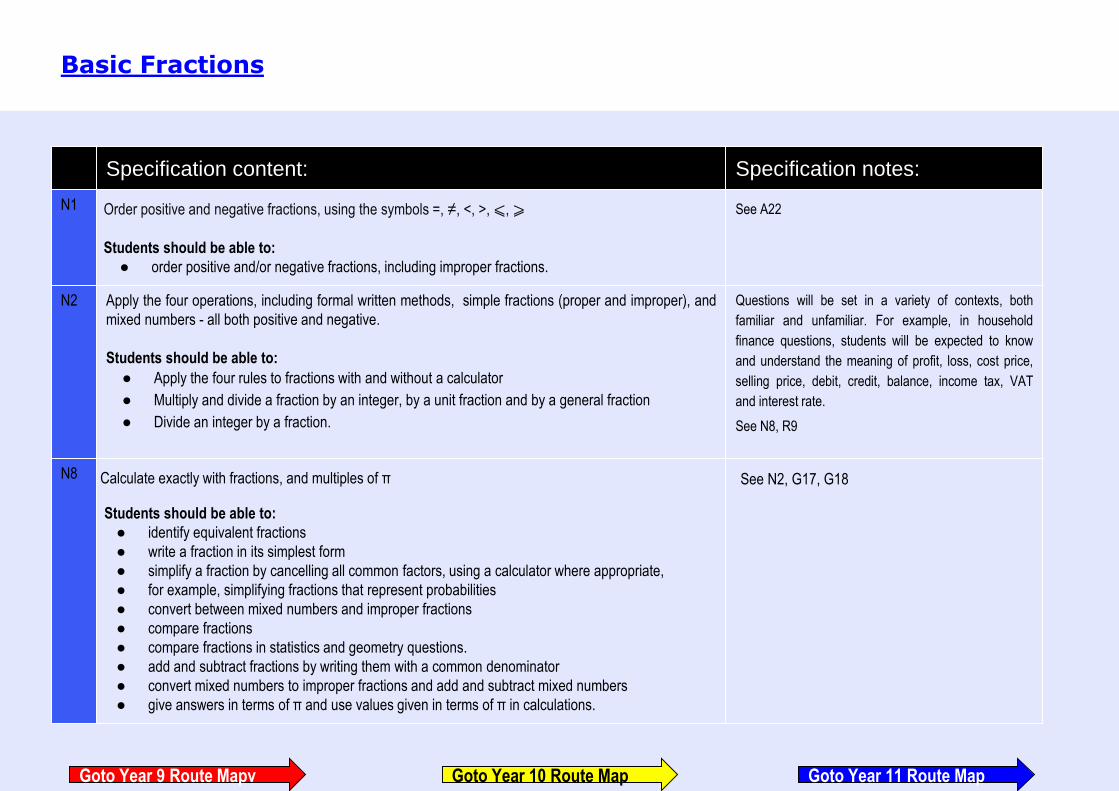
N1 Order positive and negative fractions, using the symbols =, ≠, <, >, ⩽, ⩾
Students should be able to:
● order positive and/or negative fractions, including improper fractions.
See A22
N2 Apply the four operations, including formal written methods, simple fractions (proper and improper), and
mixed numbers - all both positive and negative.
Students should be able to:
● Apply the four rules to fractions with and without a calculator
● Multiply and divide a fraction by an integer, by a unit fraction and by a general fraction
● Divide an integer by a fraction.
Questions will be set in a variety of contexts, both
familiar and unfamiliar. For example, in household
finance questions, students will be expected to know
and understand the meaning of profit, loss, cost price,
selling price, debit, credit, balance, income tax, VAT
and interest rate.
See N8, R9
N8 Calculate exactly with fractions, and multiples of π
Students should be able to:
● identify equivalent fractions
● write a fraction in its simplest form
● simplify a fraction by cancelling all common factors, using a calculator where appropriate,
● for example, simplifying fractions that represent probabilities
● convert between mixed numbers and improper fractions
● compare fractions
● compare fractions in statistics and geometry questions.
● add and subtract fractions by writing them with a common denominator
● convert mixed numbers to improper fractions and add and subtract mixed numbers
● give answers in terms of π and use values given in terms of π in calculations.
See N2, G17, G18
Basic Fractions
Goto Year 9 Route Mapv Goto Year 11 Route MapGoto Year 10 Route Map
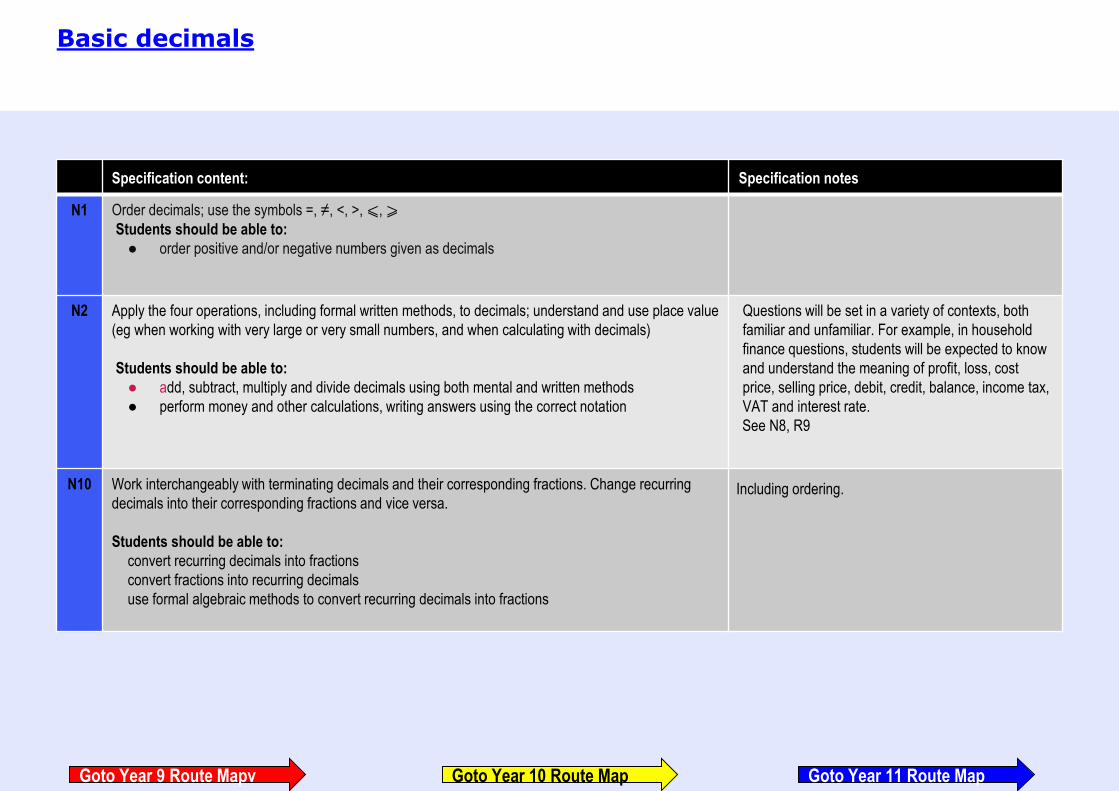
Basic decimals
Specification content: Specification notes
N1 Order decimals; use the symbols =, ≠, <, >, ⩽, ⩾Students should be able to:
● order positive and/or negative numbers given as decimals
N2 Apply the four operations, including formal written methods, to decimals; understand and use place value
(eg when working with very large or very small numbers, and when calculating with decimals)
Students should be able to:
● add, subtract, multiply and divide decimals using both mental and written methods
● perform money and other calculations, writing answers using the correct notation
Questions will be set in a variety of contexts, both
familiar and unfamiliar. For example, in household
finance questions, students will be expected to know
and understand the meaning of profit, loss, cost
price, selling price, debit, credit, balance, income tax,
VAT and interest rate.
See N8, R9
N10 Work interchangeably with terminating decimals and their corresponding fractions. Change recurring
decimals into their corresponding fractions and vice versa.
Students should be able to:
convert recurring decimals into fractions
convert fractions into recurring decimals
use formal algebraic methods to convert recurring decimals into fractions
Including ordering.
Goto Year 9 Route Mapv Goto Year 11 Route MapGoto Year 10 Route Map

Specification content Specification notes
A9 Plot graphs of equations that correspond to straight-line graphs in the coordinate plane; use the form y = mx + c to identify parallel
lines and perpendicular lines; find the equation of the line through two given points, or through one point with a given gradient
Students should be able to:
work out the gradients of lines that are parallel and perpendicular to a given line
show that two lines are parallel or perpendicular using gradients
manipulate the equations of straight lines so that it is possible to tell whether or not lines are perpendicular
know that the gradients of perpendicular lines are the negative reciprocal of each other.
Tables of values may or may not be
given.
A10 Identify and interpret gradients and intercepts of linear functions graphically and algebraically
Students should be able to:
● recognise that equations of the form y = mx + c correspond to straight-line graphs in the coordinate plane with gradient m
and y-intercept at (0, c).
● work out the gradient and the intersection with the axes.
A8 Work with coordinates in all four quadrants
Students should be able to:
plot points in all four quadrants
find and use coordinates of points identified by geometrical information, for example the fourth vertex of a rectangle given the
other three vertices
find coordinates of a midpoint, for example on the diagonal of a rhombus
identify and use cells in 2D contexts, relating coordinates to applications such as Battleships and Connect 4
Questions may be linked to shapes
and other geometrical applications,
for example transformations.
Students will be required to identify
points with given coordinates and
identify coordinates of given points.
G11 Solve geometrical problems on coordinate axes
Students should be able to:
● show step-by-step deduction in solving a geometrical problem.
Coordinates and linear graphs
Goto Year 9 Route Mapv Goto Year 11 Route MapGoto Year 10 Route Map

Specification content Specification notes
N15 Round numbers and measures to an appropriate degree of accuracy (eg to a specified number of
decimal places or significant figures); use inequality notation to specify simple error intervals due to
truncation or rounding
Students should be able to:
perform money calculations, writing answers using the correct notation
round numbers to the nearest whole number, 10, 100 or 1000
round numbers to a specified number of decimal places
round numbers to a specified number of significant figures
use inequality notation to specify error intervals due to truncation or rounding.
Including appropriate rounding for questions set in
context.
Students should know not to round values during
intermediate steps of a calculation.
Students should know that some answers need to
be rounded up and some need to be rounded
down.
Students should know that some answers are
inappropriate without some form of rounding, for
example 4.2 buses.
N16 Apply and interpret limits of accuracy including upper and lower bounds
Students should be able to:
write down the maximum or minimum figure for a value rounded to a given accuracy
combine upper or lower bounds appropriately to achieve an overall maximum or minimum for a
situation
work with practical problems involving bounds including in statistics. For example, finding the midpoint
of a class interval, such as 10 < t ⩽ 20, in order to estimate a mean.
For example, the maximum value of a - b is
obtained from use of the maximum value for a and
the minimum value for b.
Upper bounds do not necessarily require use of
recurring decimals. For example, if the answer to
the nearest integer is 7, the maximum could be
given as 7.5, 7.49 ... or 7.49
If this value of 7 represented £7, £7.49 would be
expected for the maximum.
For continuous variables, students may be asked
for the lower and upper limits rather than the
minimum and maximum values.
Rounding
Goto Year 9 Route Mapv Goto Year 11 Route MapGoto Year 10 Route Map
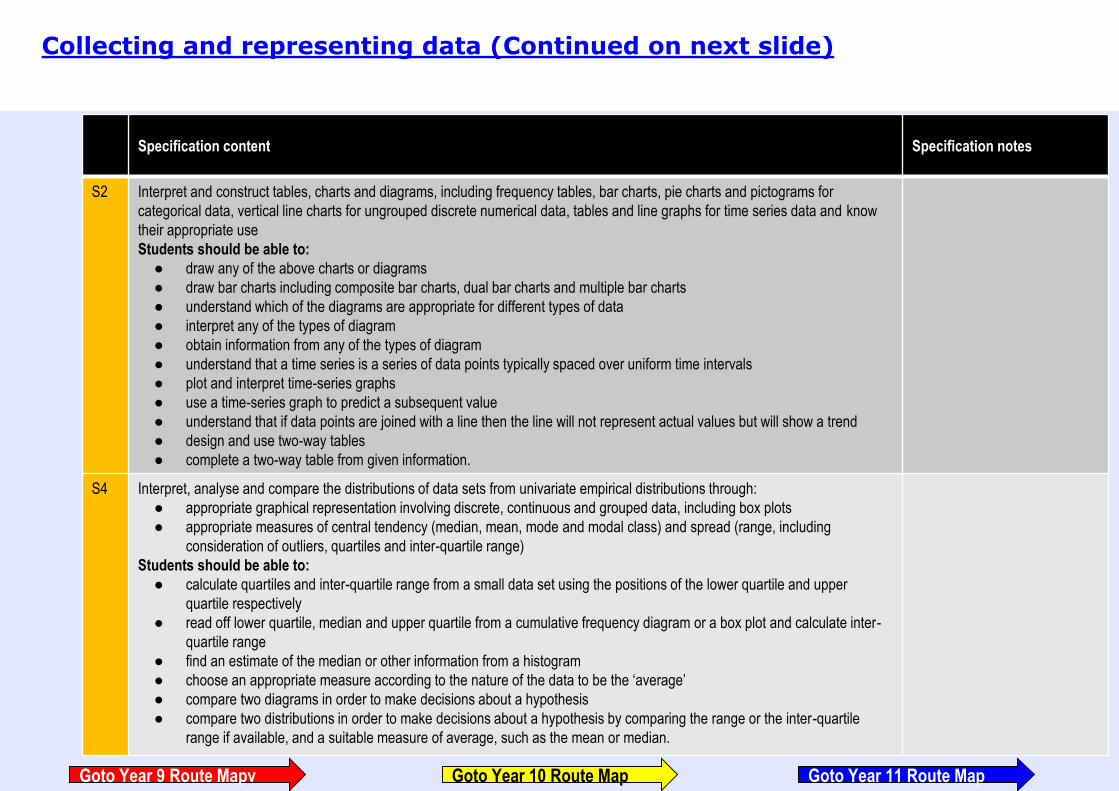
Specification content Specification notes
S2 Interpret and construct tables, charts and diagrams, including frequency tables, bar charts, pie charts and pictograms for
categorical data, vertical line charts for ungrouped discrete numerical data, tables and line graphs for time series data and know
their appropriate use
Students should be able to:
● draw any of the above charts or diagrams
● draw bar charts including composite bar charts, dual bar charts and multiple bar charts
● understand which of the diagrams are appropriate for different types of data
● interpret any of the types of diagram
● obtain information from any of the types of diagram
● understand that a time series is a series of data points typically spaced over uniform time intervals
● plot and interpret time-series graphs
● use a time-series graph to predict a subsequent value
● understand that if data points are joined with a line then the line will not represent actual values but will show a trend
● design and use two-way tables
● complete a two-way table from given information.
S4 Interpret, analyse and compare the distributions of data sets from univariate empirical distributions through:
● appropriate graphical representation involving discrete, continuous and grouped data, including box plots
● appropriate measures of central tendency (median, mean, mode and modal class) and spread (range, including
consideration of outliers, quartiles and inter-quartile range)
Students should be able to:
● calculate quartiles and inter-quartile range from a small data set using the positions of the lower quartile and upper
quartile respectively
● read off lower quartile, median and upper quartile from a cumulative frequency diagram or a box plot and calculate inter-
quartile range
● find an estimate of the median or other information from a histogram
● choose an appropriate measure according to the nature of the data to be the ‘average’
● compare two diagrams in order to make decisions about a hypothesis
● compare two distributions in order to make decisions about a hypothesis by comparing the range or the inter-quartile
range if available, and a suitable measure of average, such as the mean or median.
Collecting and representing data (Continued on next slide)
Goto Year 9 Route Mapv Goto Year 11 Route MapGoto Year 10 Route Map

Specification content Specification notes
S3 Construct and interpret diagrams for grouped discrete and continuous data, ie histograms with equal and unequal class intervals
and cumulative frequency graphs, and know their appropriate use
Students should be able to:
● understand which diagrams are appropriate for different types of data
● construct suitable diagrams for grouped discrete and continuous data interpret diagrams for grouped discrete and
continuous data.
Collecting and representing data
Goto Year 9 Route Mapv Goto Year 11 Route MapGoto Year 10 Route Map

Specification content Specification notes
A23 Generate terms of a sequence from either a term-to-term or a position-to-term rule
Students should be able to:
generate linear sequences
work out the value of the nth term of a linear sequence for any given value of n
generate sequences with a given term-to-term rule
generate a sequence where the nth term is given
work out the value of the nth term of any sequence for any given value of n
generate simple sequences derived from diagrams and complete a table of results that describes the pattern
shown by the diagrams
describe how a sequence continues.
Including from patterns and diagrams.
A24 Recognise and use sequences of triangular, square and cube numbers, simple arithmetic progressions, Fibonacci-
type sequences, quadratic sequences and simple geometrical progressions (r n where n is an integer and r is a
rational number > 0 or a surd) and other sequences
Students should be able to:
● work out the value of the nth term of a sequence for any given value of n.
A25 Deduce expressions to calculate the nth term of linear and quadratic sequences
Students should be able to:
● work out a formula for the nth term of a sequence, which may contain linear or quadratic parts.
Sequences
Goto Year 9 Route Mapv Goto Year 11 Route MapGoto Year 10 Route Map

Specification content Specification notes
R9 Define percentage as ‘number of parts per 100’; interpret percentages and percentage changes as a fraction or a decimal, and interpret
these multiplicatively; express one quantity as a percentage of another; compare two quantities using percentages; work with percentages
greater than 100%; solve problems involving percentage change, including percentage increase / decrease and original value problems,
and simple interest including in financial mathematics
Students should be able to:
● convert values between percentages, fractions and decimals in order to compare them, for example with probabilities
● use percentages in real-life situations
● interpret percentage as the operator ‘so many hundredths of’
● work out the percentage of a shape that is shaded
● shade a given percentage of a shape
● calculate a percentage increase or decrease
● solve percentage increase and decrease problems, for example, use 1.12 ´ Q to calculate a 12% increase in the value of Q and
0.88 ´ Q to calculate a 12% decrease in the value of Q
● work out one quantity as a percentage of another quantity
● use percentages, decimals or fractions to calculate proportions
● calculate reverse percentages
● solve simple interest problems.
N12 Interpret fractions and percentages as operators
Students should be able to:
● calculate a fraction of a quantity
● calculate a percentage of a quantity
● use fractions, decimals or percentages to find quantities
● use fractions, decimals or percentages to calculate proportions of shapes that are shaded
● use fractions, decimals or percentages to calculate lengths, areas or volumes
● understand and use unit fractions as multiplicative inverses
● multiply and divide a fraction by an integer, by a unit fraction and by a general fraction
● interpret a fraction, decimal or percentage as a multiplier when solving problems
● use fractions, decimals or percentages to interpret or compare statistical diagrams or data sets
● convert between fractions, decimals and percentages to find the most appropriate method of calculation in a question; for example,
62% of £80 is 0.62 ´ £80 and 25% of £80 is £80 ÷ 4
Students should understand that,
for example, multiplication by 1/5
is the same as division by 5
Including interpreting percentage
problems using a multiplier.
Basic percentages
Goto Year 9 Route Mapv Goto Year 11 Route MapGoto Year 10 Route Map
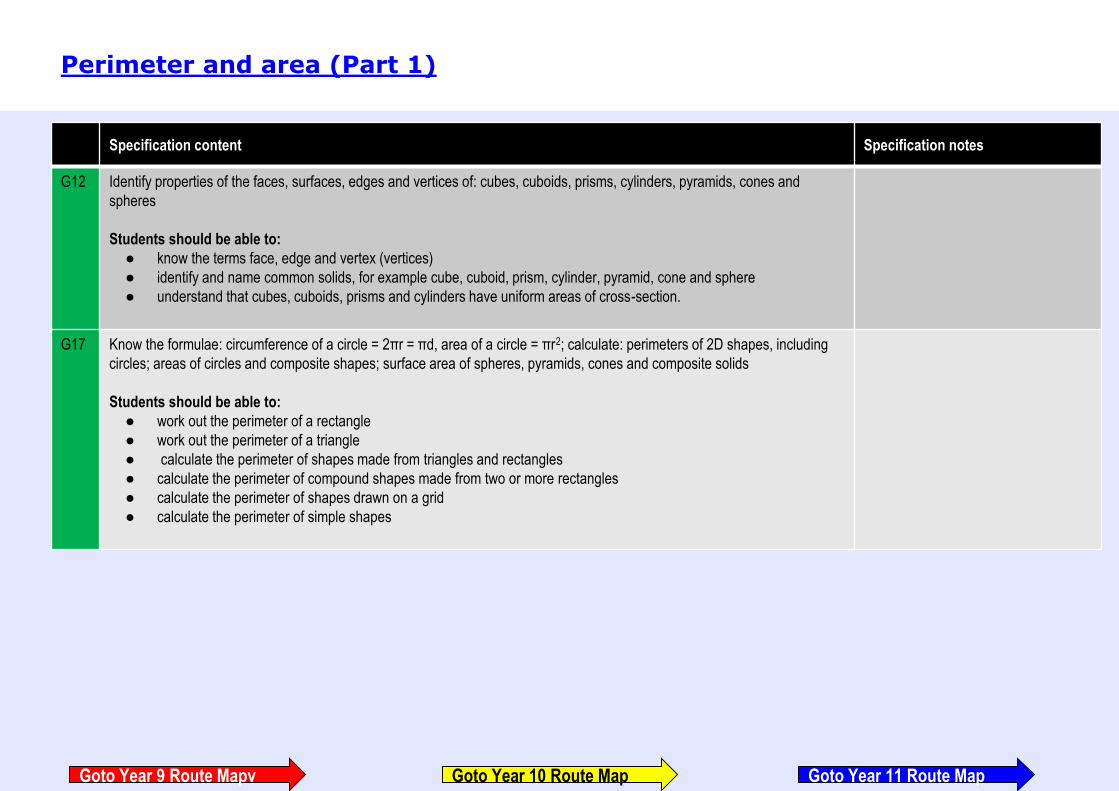
Specification content Specification notes
G12 Identify properties of the faces, surfaces, edges and vertices of: cubes, cuboids, prisms, cylinders, pyramids, cones and
spheres
Students should be able to:
● know the terms face, edge and vertex (vertices)
● identify and name common solids, for example cube, cuboid, prism, cylinder, pyramid, cone and sphere
● understand that cubes, cuboids, prisms and cylinders have uniform areas of cross-section.
G17 Know the formulae: circumference of a circle = 2πr = πd, area of a circle = πr2; calculate: perimeters of 2D shapes, including
circles; areas of circles and composite shapes; surface area of spheres, pyramids, cones and composite solids
Students should be able to:
● work out the perimeter of a rectangle
● work out the perimeter of a triangle
● calculate the perimeter of shapes made from triangles and rectangles
● calculate the perimeter of compound shapes made from two or more rectangles
● calculate the perimeter of shapes drawn on a grid
● calculate the perimeter of simple shapes
Perimeter and area (Part 1)
Goto Year 9 Route Mapv Goto Year 11 Route MapGoto Year 10 Route Map

Specification content Specification notes
G16 Know and apply formulae to calculate: area of triangles, parallelograms and trapezia
Students should be able to:
● recall and use the formulae for the area of a rectangle, triangle, parallelogram and trapezium
● work out the area of a rectangle
● work out the area of a triangle
● work out the area of a parallelogram
● work out the area of a trapezium
● calculate the area of compound shapes made from triangles and rectangles
● calculate the area of compound shapes made from two or more rectangles, for example an L shape or T shape
● calculate the area of shapes drawn on a grid
● calculate the area of simple shapes
● work out the surface area of nets made up of rectangles and triangles
Students may be required to measure
lengths in order to work out areas.
Perimeter and area (Part 2)
Goto Year 9 Route Mapv Goto Year 11 Route MapGoto Year 10 Route Map
Specification content Specification notes
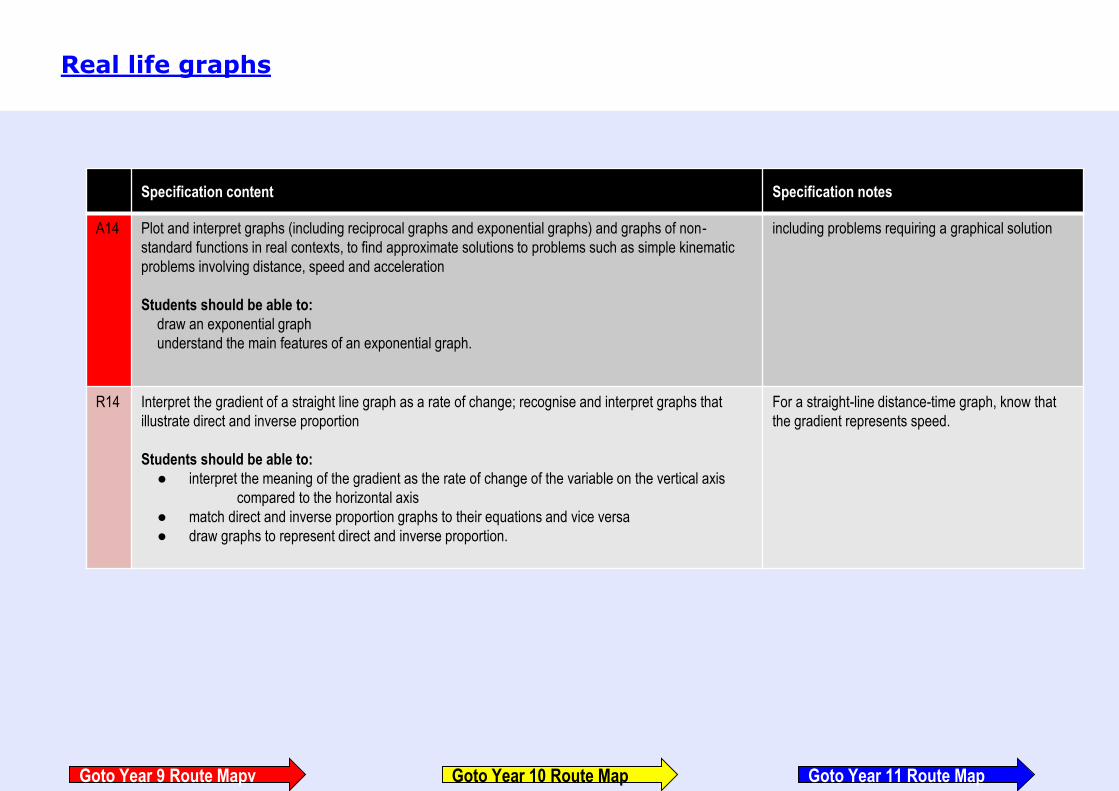
A14 Plot and interpret graphs (including reciprocal graphs and exponential graphs) and graphs of non-
standard functions in real contexts, to find approximate solutions to problems such as simple kinematic
problems involving distance, speed and acceleration
Students should be able to:
draw an exponential graph
understand the main features of an exponential graph.
including problems requiring a graphical solution
R14 Interpret the gradient of a straight line graph as a rate of change; recognise and interpret graphs that
illustrate direct and inverse proportion
Students should be able to:
● interpret the meaning of the gradient as the rate of change of the variable on the vertical axis
compared to the horizontal axis
● match direct and inverse proportion graphs to their equations and vice versa
● draw graphs to represent direct and inverse proportion.
For a straight-line distance-time graph, know that
the gradient represents speed.
Real life graphs
Goto Year 9 Route Mapv Goto Year 11 Route MapGoto Year 10 Route Map
Specification content Specification notes
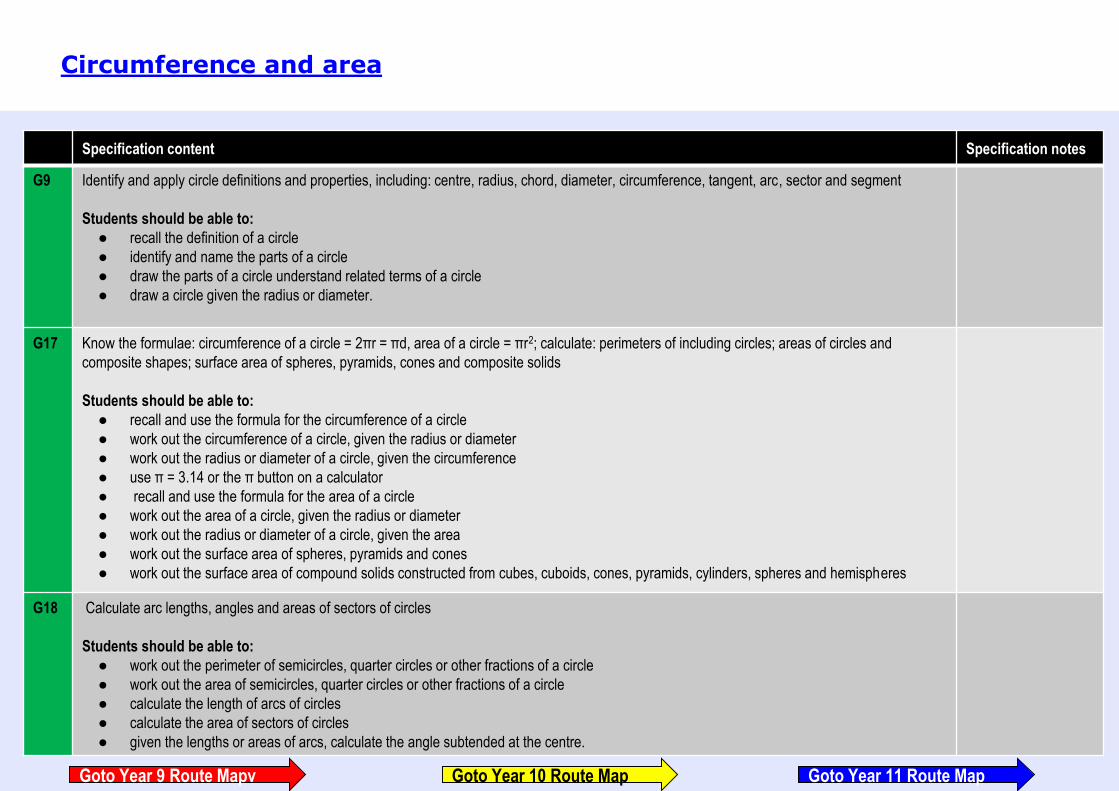
G9 Identify and apply circle definitions and properties, including: centre, radius, chord, diameter, circumference, tangent, arc, sector and segment
Students should be able to:
● recall the definition of a circle
● identify and name the parts of a circle
● draw the parts of a circle understand related terms of a circle
● draw a circle given the radius or diameter.
G17 Know the formulae: circumference of a circle = 2πr = πd, area of a circle = πr2; calculate: perimeters of including circles; areas of circles and
composite shapes; surface area of spheres, pyramids, cones and composite solids
Students should be able to:
● recall and use the formula for the circumference of a circle
● work out the circumference of a circle, given the radius or diameter
● work out the radius or diameter of a circle, given the circumference
● use π = 3.14 or the π button on a calculator
● recall and use the formula for the area of a circle
● work out the area of a circle, given the radius or diameter
● work out the radius or diameter of a circle, given the area
● work out the surface area of spheres, pyramids and cones
● work out the surface area of compound solids constructed from cubes, cuboids, cones, pyramids, cylinders, spheres and hemispheres
G18 Calculate arc lengths, angles and areas of sectors of circles
Students should be able to:
● work out the perimeter of semicircles, quarter circles or other fractions of a circle
● work out the area of semicircles, quarter circles or other fractions of a circle
● calculate the length of arcs of circles
● calculate the area of sectors of circles
● given the lengths or areas of arcs, calculate the angle subtended at the centre.
Circumference and area
Goto Year 9 Route Mapv Goto Year 11 Route MapGoto Year 10 Route Map

Ratio and proportion (Part 1)
Specification content Specification notes
N11 Identify and work with fractions in ratio problems
Students should be able to:
● understand the meaning of ratio notation
● interpret a ratio as a fraction
● use fractions and ratios in the context of geometrical problems, for example similar shapes, scale drawings
and problem solving involving scales and measures
● understand that a line divided in the ratio 1 : 3 means that the smaller part is one-quarter of the whole.
Ratio may be linked to probability, for
example, students should know that if red
balls and blue balls in a bag are in the ratio
3 : 4 then the probability of randomly
obtaining a red ball is 3/7
R3 Express one quantity as a fraction of another, where the fraction is less than 1 or greater than 1
Students should be able to:
work out one quantity as a fraction or decimal of another quantity
use a fraction of a quantity to compare proportions.
R4 Use ratio notation, including reduction to simplest form
Students should be able to:
understand the meaning of ratio notation
simplify ratios to their simplest form a : b where a and b are integers
write a ratio in the form 1 : n or n : 1
R5 Divide a given quantity into two parts in a given part : part or part : whole ratio; express the division of
a quantity into two parts as a ratio; apply ratio to real contexts and problems (such as those involving conversion,
comparison, scaling, mixing, concentrations)
Students should be able to:
● use ratios in the context of geometrical problems, for example similar shapes, scale drawings and problem
solving involving scales and measures
● interpret a ratio in a way that enables the correct proportion of an amount to be calculated.
● use ratio to solve, for example geometrical, algebraic, statistical, and numerical problems
● use ratio to solve word problems using informal strategies or using the unitary method of solution
● solve best-buy problems using informal strategies or using the unitary method of solution.
Including better value or best buy problems
Goto Year 9 Route Mapv Goto Year 11 Route MapGoto Year 10 Route Map
Specification content Specification notes
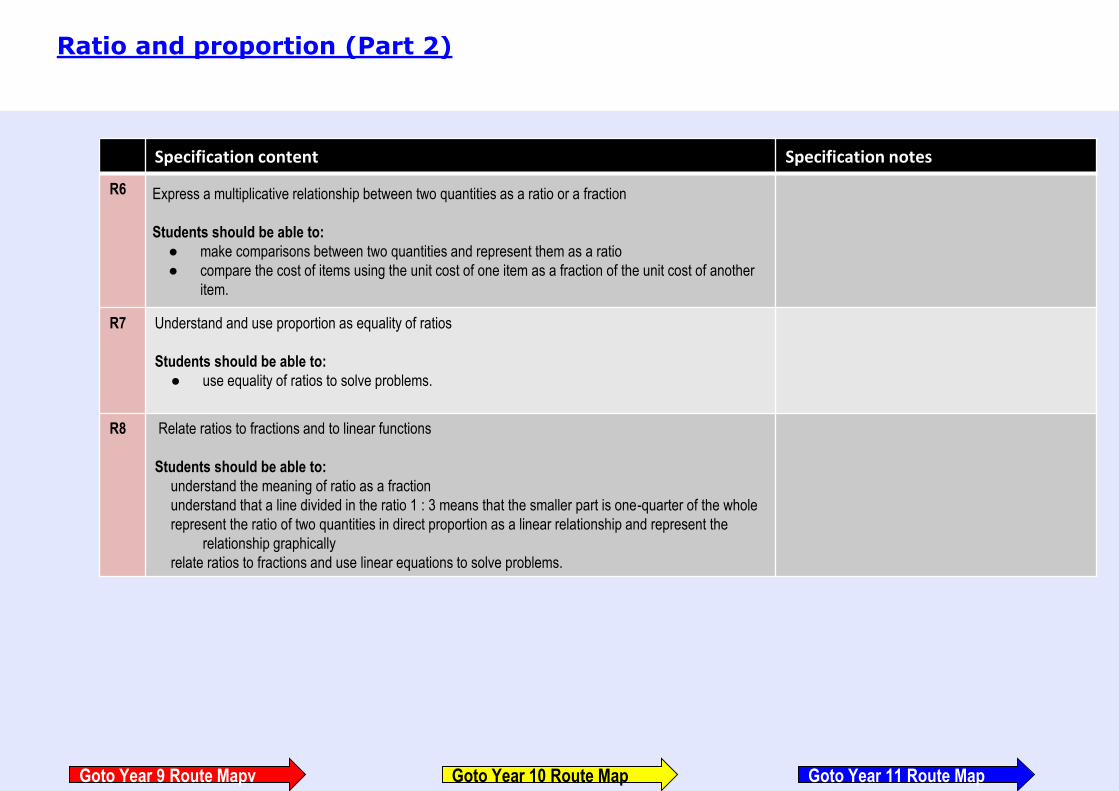
R6 Express a multiplicative relationship between two quantities as a ratio or a fraction
Students should be able to:
● make comparisons between two quantities and represent them as a ratio
● compare the cost of items using the unit cost of one item as a fraction of the unit cost of another
item.
R7 Understand and use proportion as equality of ratios
Students should be able to:
● use equality of ratios to solve problems.
R8 Relate ratios to fractions and to linear functions
Students should be able to:
understand the meaning of ratio as a fraction
understand that a line divided in the ratio 1 : 3 means that the smaller part is one-quarter of the whole
represent the ratio of two quantities in direct proportion as a linear relationship and represent the
relationship graphically
relate ratios to fractions and use linear equations to solve problems.
Ratio and proportion (Part 2)
Goto Year 9 Route Mapv Goto Year 11 Route MapGoto Year 10 Route Map
Specification content Specification notes
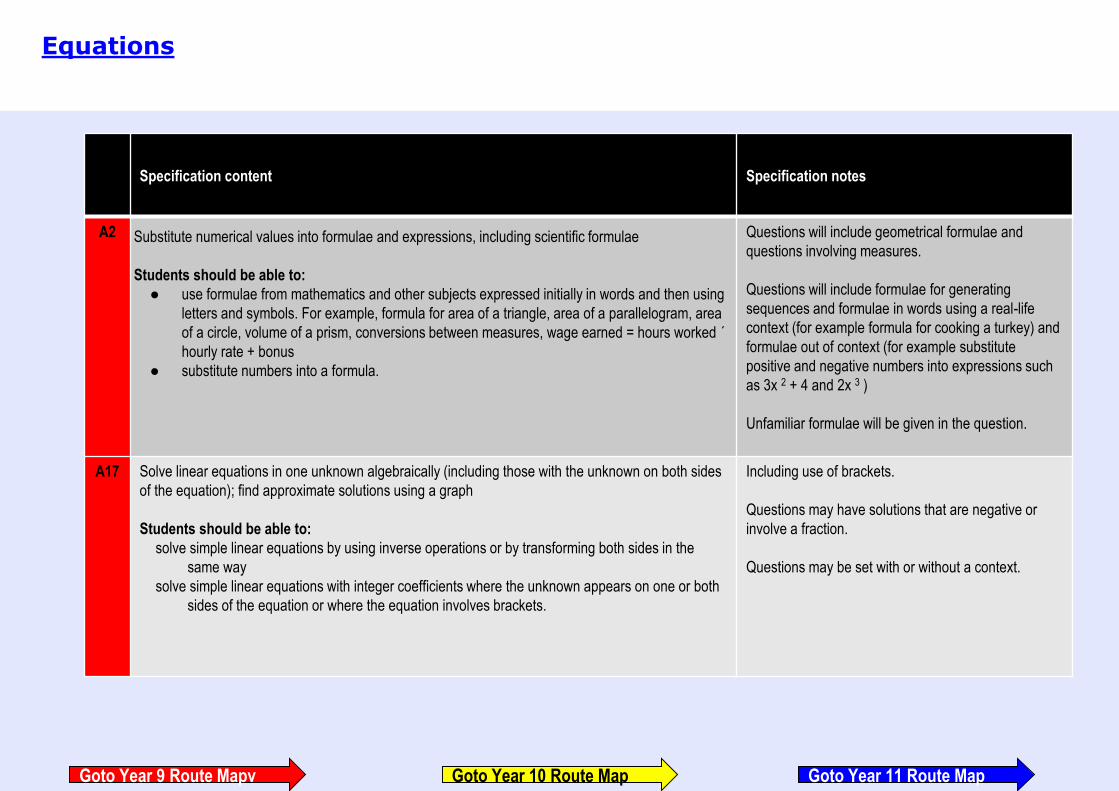
A2 Substitute numerical values into formulae and expressions, including scientific formulae
Students should be able to:
● use formulae from mathematics and other subjects expressed initially in words and then using
letters and symbols. For example, formula for area of a triangle, area of a parallelogram, area
of a circle, volume of a prism, conversions between measures, wage earned = hours worked ´
hourly rate + bonus
● substitute numbers into a formula.
Questions will include geometrical formulae and
questions involving measures.
Questions will include formulae for generating
sequences and formulae in words using a real-life
context (for example formula for cooking a turkey) and
formulae out of context (for example substitute
positive and negative numbers into expressions such
as 3x 2 + 4 and 2x 3 )
Unfamiliar formulae will be given in the question.
A17 Solve linear equations in one unknown algebraically (including those with the unknown on both sides
of the equation); find approximate solutions using a graph
Students should be able to:
solve simple linear equations by using inverse operations or by transforming both sides in the
same way
solve simple linear equations with integer coefficients where the unknown appears on one or both
sides of the equation or where the equation involves brackets.
Including use of brackets.
Questions may have solutions that are negative or
involve a fraction.
Questions may be set with or without a context.
Equations
Goto Year 9 Route Mapv Goto Year 11 Route MapGoto Year 10 Route Map
Specification content Specification notes
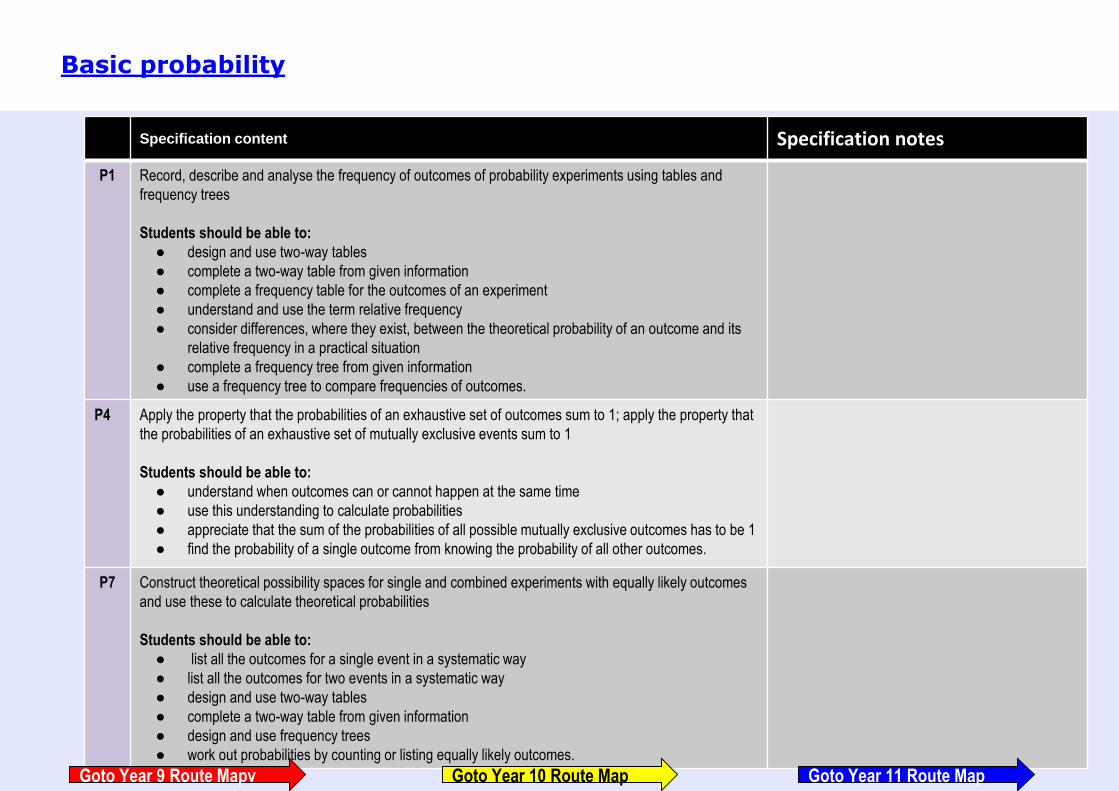
P1 Record, describe and analyse the frequency of outcomes of probability experiments using tables and
frequency trees
Students should be able to:
● design and use two-way tables
● complete a two-way table from given information
● complete a frequency table for the outcomes of an experiment
● understand and use the term relative frequency
● consider differences, where they exist, between the theoretical probability of an outcome and its
relative frequency in a practical situation
● complete a frequency tree from given information
● use a frequency tree to compare frequencies of outcomes.
P4 Apply the property that the probabilities of an exhaustive set of outcomes sum to 1; apply the property that
the probabilities of an exhaustive set of mutually exclusive events sum to 1
Students should be able to:
● understand when outcomes can or cannot happen at the same time
● use this understanding to calculate probabilities
● appreciate that the sum of the probabilities of all possible mutually exclusive outcomes has to be 1
● find the probability of a single outcome from knowing the probability of all other outcomes.
P7 Construct theoretical possibility spaces for single and combined experiments with equally likely outcomes
and use these to calculate theoretical probabilities
Students should be able to:
● list all the outcomes for a single event in a systematic way
● list all the outcomes for two events in a systematic way
● design and use two-way tables
● complete a two-way table from given information
● design and use frequency trees
● work out probabilities by counting or listing equally likely outcomes.
Basic probability
Goto Year 9 Route Mapv Goto Year 11 Route MapGoto Year 10 Route Map
Specification content Specification notes
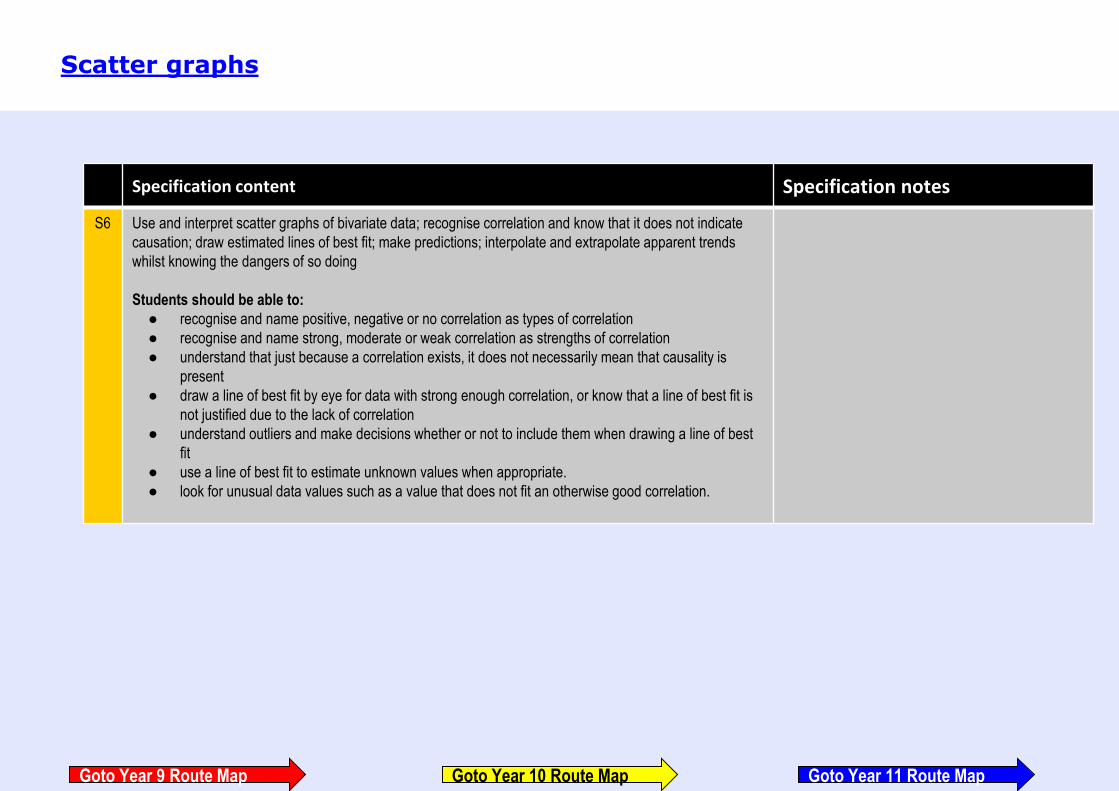
S6 Use and interpret scatter graphs of bivariate data; recognise correlation and know that it does not indicate
causation; draw estimated lines of best fit; make predictions; interpolate and extrapolate apparent trends
whilst knowing the dangers of so doing
Students should be able to:
● recognise and name positive, negative or no correlation as types of correlation
● recognise and name strong, moderate or weak correlation as strengths of correlation
● understand that just because a correlation exists, it does not necessarily mean that causality is
present
● draw a line of best fit by eye for data with strong enough correlation, or know that a line of best fit is
not justified due to the lack of correlation
● understand outliers and make decisions whether or not to include them when drawing a line of best
fit
● use a line of best fit to estimate unknown values when appropriate.
● look for unusual data values such as a value that does not fit an otherwise good correlation.
Scatter graphs
Goto Year 9 Route Map Goto Year 11 Route MapGoto Year 10 Route Map
Specification content Specification notes
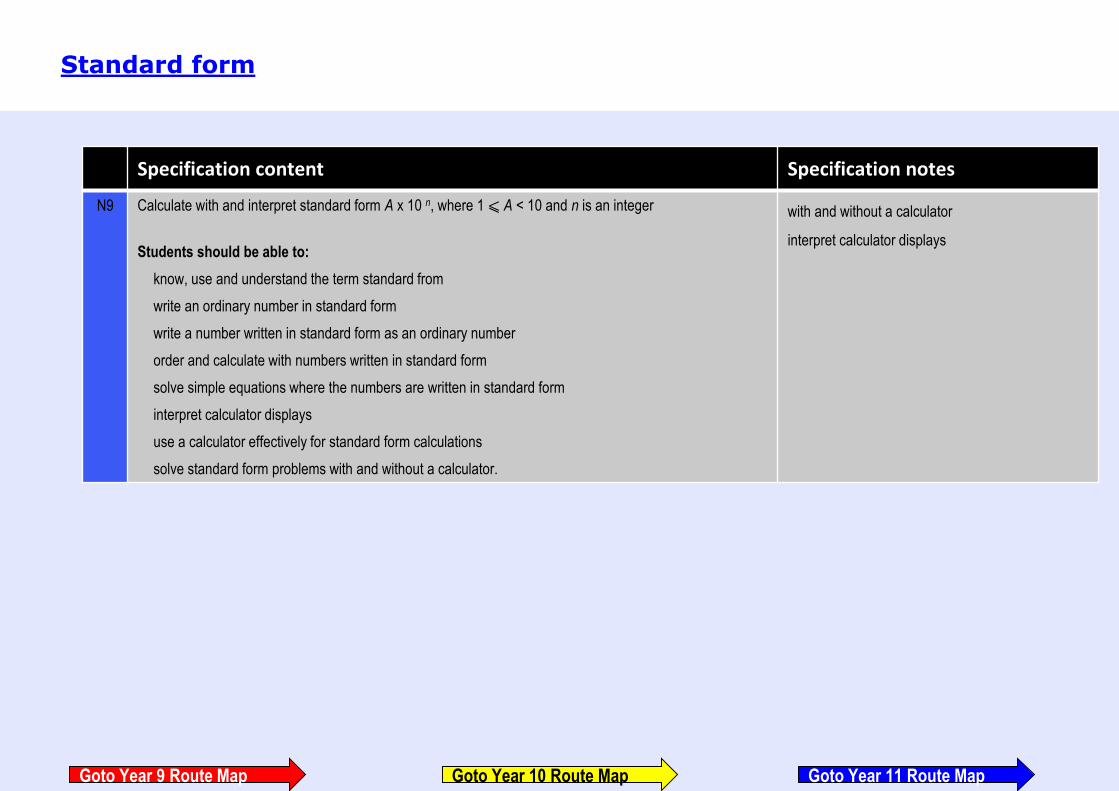
N9 Calculate with and interpret standard form A x 10 n, where 1 ⩽ A < 10 and n is an integer
Students should be able to:
know, use and understand the term standard from
write an ordinary number in standard form
write a number written in standard form as an ordinary number
order and calculate with numbers written in standard form
solve simple equations where the numbers are written in standard form
interpret calculator displays
use a calculator effectively for standard form calculations
solve standard form problems with and without a calculator.
with and without a calculator
interpret calculator displays
Standard form
Goto Year 9 Route Map Goto Year 11 Route MapGoto Year 10 Route Map
Specification content Specification notes
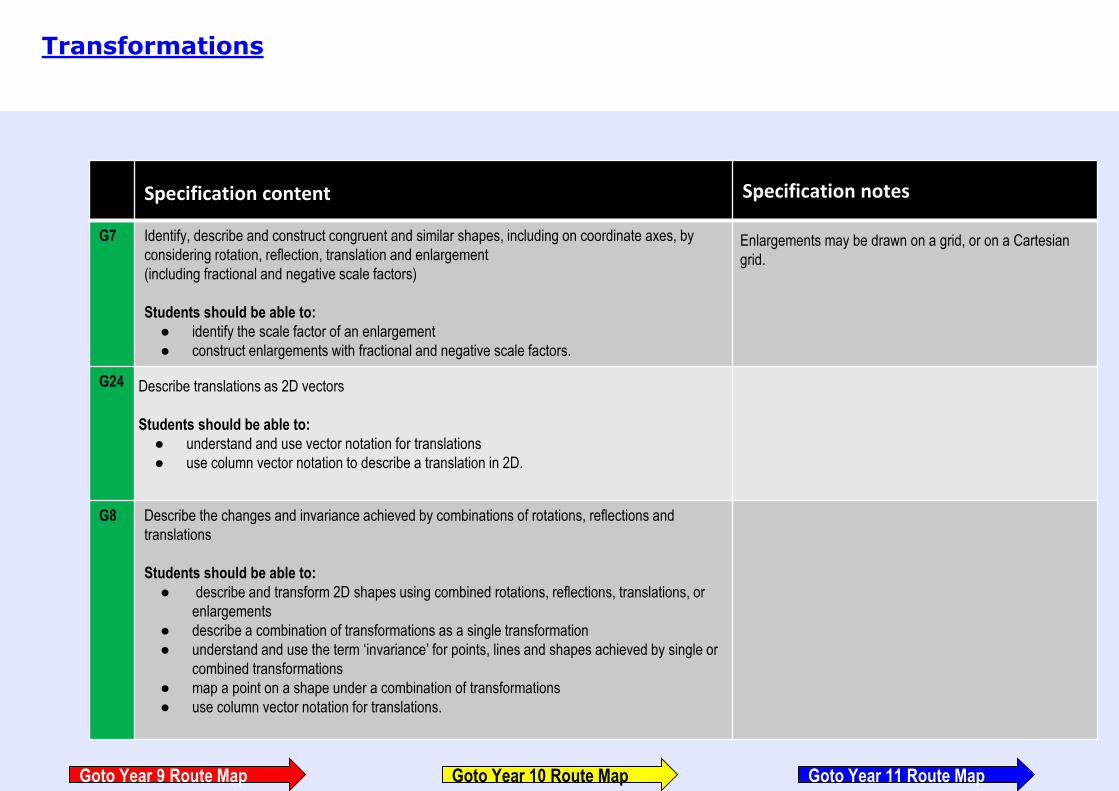
G7 Identify, describe and construct congruent and similar shapes, including on coordinate axes, by
considering rotation, reflection, translation and enlargement
(including fractional and negative scale factors)
Students should be able to:
● identify the scale factor of an enlargement
● construct enlargements with fractional and negative scale factors.
Enlargements may be drawn on a grid, or on a Cartesian
grid.
G24 Describe translations as 2D vectors
Students should be able to:
● understand and use vector notation for translations
● use column vector notation to describe a translation in 2D.
G8 Describe the changes and invariance achieved by combinations of rotations, reflections and
translations
Students should be able to:
● describe and transform 2D shapes using combined rotations, reflections, translations, or
enlargements
● describe a combination of transformations as a single transformation
● understand and use the term ‘invariance’ for points, lines and shapes achieved by single or
combined transformations
● map a point on a shape under a combination of transformations
● use column vector notation for translations.
Transformations
Goto Year 9 Route Map Goto Year 11 Route MapGoto Year 10 Route Map
Specification content Specification notes
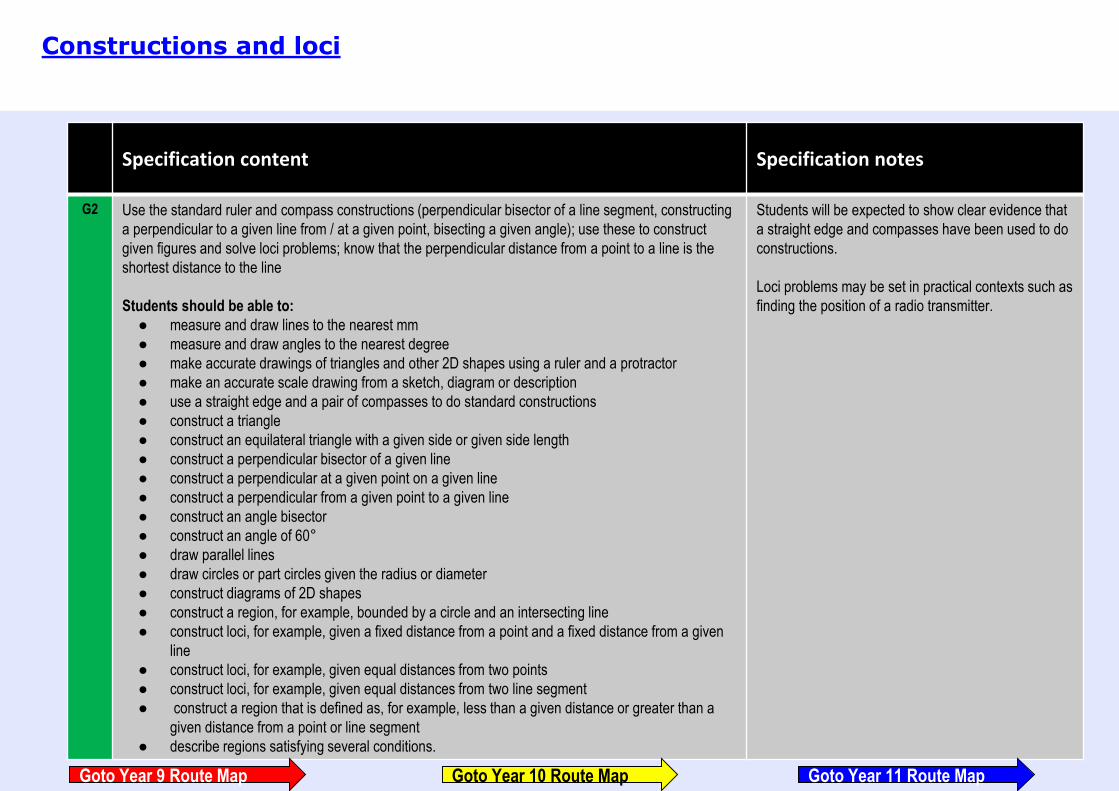
G2 Use the standard ruler and compass constructions (perpendicular bisector of a line segment, constructing
a perpendicular to a given line from / at a given point, bisecting a given angle); use these to construct
given figures and solve loci problems; know that the perpendicular distance from a point to a line is the
shortest distance to the line
Students should be able to:
● measure and draw lines to the nearest mm
● measure and draw angles to the nearest degree
● make accurate drawings of triangles and other 2D shapes using a ruler and a protractor
● make an accurate scale drawing from a sketch, diagram or description
● use a straight edge and a pair of compasses to do standard constructions
● construct a triangle
● construct an equilateral triangle with a given side or given side length
● construct a perpendicular bisector of a given line
● construct a perpendicular at a given point on a given line
● construct a perpendicular from a given point to a given line
● construct an angle bisector
● construct an angle of 60°
● draw parallel lines
● draw circles or part circles given the radius or diameter
● construct diagrams of 2D shapes
● construct a region, for example, bounded by a circle and an intersecting line
● construct loci, for example, given a fixed distance from a point and a fixed distance from a given
line
● construct loci, for example, given equal distances from two points
● construct loci, for example, given equal distances from two line segment
● construct a region that is defined as, for example, less than a given distance or greater than a
given distance from a point or line segment
● describe regions satisfying several conditions.
Students will be expected to show clear evidence that
a straight edge and compasses have been used to do
constructions.
Loci problems may be set in practical contexts such as
finding the position of a radio transmitter.
Constructions and loci
Goto Year 9 Route Map Goto Year 11 Route MapGoto Year 10 Route Map
Specification content Specification notes
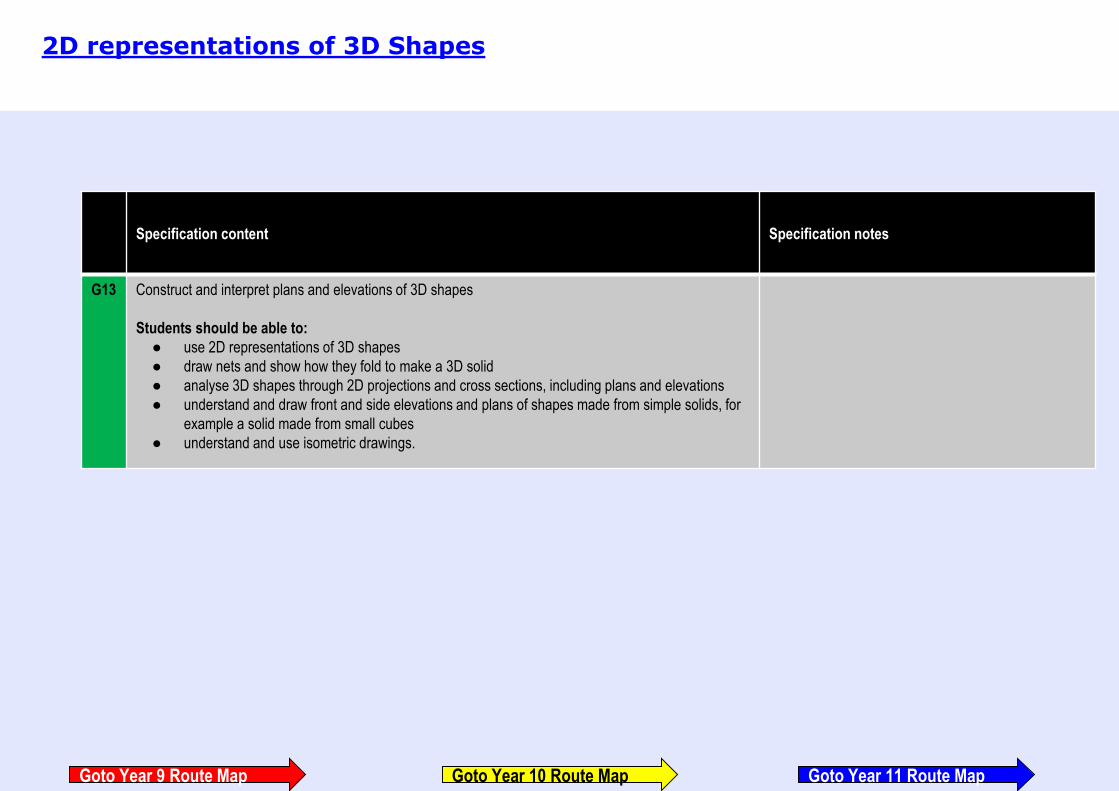
G13 Construct and interpret plans and elevations of 3D shapes
Students should be able to:
● use 2D representations of 3D shapes
● draw nets and show how they fold to make a 3D solid
● analyse 3D shapes through 2D projections and cross sections, including plans and elevations
● understand and draw front and side elevations and plans of shapes made from simple solids, for
example a solid made from small cubes
● understand and use isometric drawings.
2D representations of 3D Shapes
Goto Year 9 Route Map Goto Year 11 Route MapGoto Year 10 Route Map
Specification content Specification notes
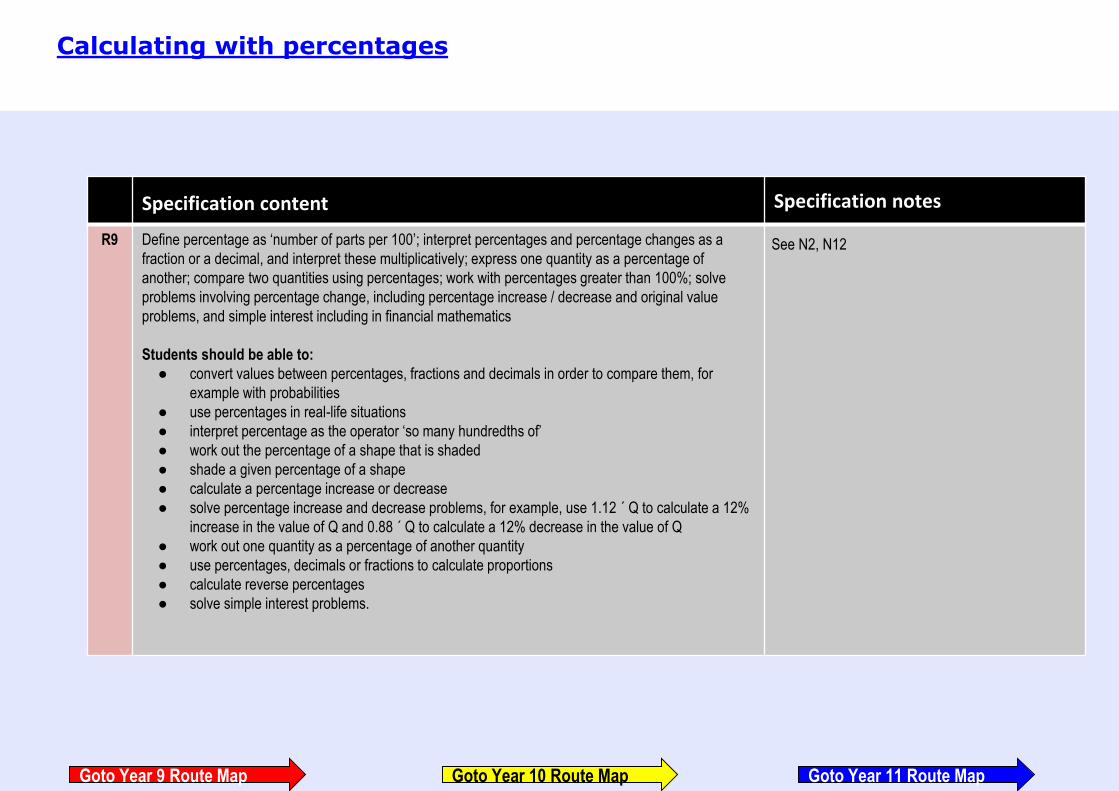
R9 Define percentage as ‘number of parts per 100’; interpret percentages and percentage changes as a
fraction or a decimal, and interpret these multiplicatively; express one quantity as a percentage of
another; compare two quantities using percentages; work with percentages greater than 100%; solve
problems involving percentage change, including percentage increase / decrease and original value
problems, and simple interest including in financial mathematics
Students should be able to:
● convert values between percentages, fractions and decimals in order to compare them, for
example with probabilities
● use percentages in real-life situations
● interpret percentage as the operator ‘so many hundredths of’
● work out the percentage of a shape that is shaded
● shade a given percentage of a shape
● calculate a percentage increase or decrease
● solve percentage increase and decrease problems, for example, use 1.12 ´ Q to calculate a 12%
increase in the value of Q and 0.88 ´ Q to calculate a 12% decrease in the value of Q
● work out one quantity as a percentage of another quantity
● use percentages, decimals or fractions to calculate proportions
● calculate reverse percentages
● solve simple interest problems.
See N2, N12
Calculating with percentages
Goto Year 9 Route Map Goto Year 11 Route MapGoto Year 10 Route Map
Specification content Specification notes
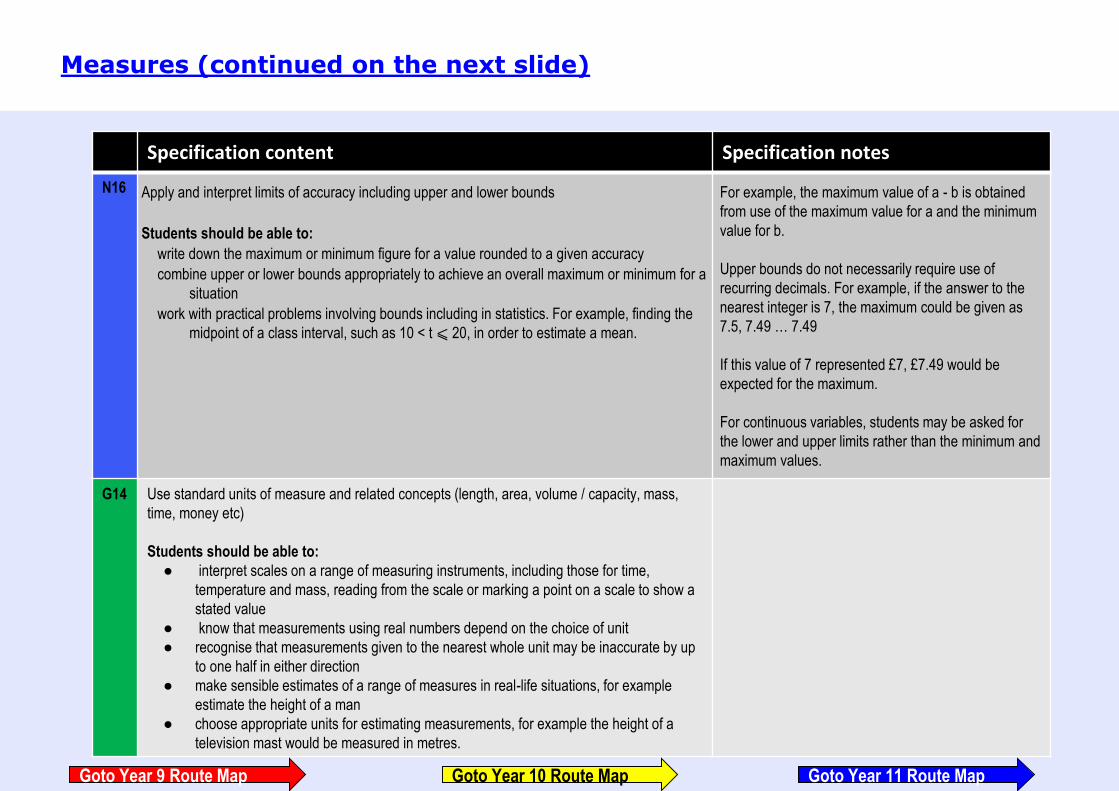
N16 Apply and interpret limits of accuracy including upper and lower bounds
Students should be able to:
write down the maximum or minimum figure for a value rounded to a given accuracy
combine upper or lower bounds appropriately to achieve an overall maximum or minimum for a
situation
work with practical problems involving bounds including in statistics. For example, finding the
midpoint of a class interval, such as 10 < t ⩽ 20, in order to estimate a mean.
For example, the maximum value of a - b is obtained
from use of the maximum value for a and the minimum
value for b.
Upper bounds do not necessarily require use of
recurring decimals. For example, if the answer to the
nearest integer is 7, the maximum could be given as
7.5, 7.49 … 7.49
If this value of 7 represented £7, £7.49 would be
expected for the maximum.
For continuous variables, students may be asked for
the lower and upper limits rather than the minimum and
maximum values.
G14 Use standard units of measure and related concepts (length, area, volume / capacity, mass,
time, money etc)
Students should be able to:
● interpret scales on a range of measuring instruments, including those for time,
temperature and mass, reading from the scale or marking a point on a scale to show a
stated value
● know that measurements using real numbers depend on the choice of unit
● recognise that measurements given to the nearest whole unit may be inaccurate by up
to one half in either direction
● make sensible estimates of a range of measures in real-life situations, for example
estimate the height of a man
● choose appropriate units for estimating measurements, for example the height of a
television mast would be measured in metres.
Measures (continued on the next slide)
Goto Year 9 Route Map Goto Year 11 Route MapGoto Year 10 Route Map

Specification content Specification notes
N13 Use standard units of mass, length, time, money and other measures (including
standard compound measures) using decimal quantities where appropriate
Students should be able to:
know and use standard metric and imperial measures
know and use compound measures such as area, volume and speed
choose appropriate units for estimating measurements, for example a television
mast would be measured in metres.
Know and use metric conversion factors for length, area, volume and capacity.
Imperial / metric conversions will be given in the question.
Correct money notation is expected in all answers.
R1 Change freely between related standard units (eg time, length, area, volume /
capacity, mass) and compound units (eg speed, rates of pay, prices, density,
pressure) in numerical and algebraic contexts
Students should be able to:
convert between metric measures
recall and use conversions for metric measures for length, area, volume and
capacity
use conversions between imperial units and metric units and vice versa using
common approximations, for example 5 miles » 8 kilometres, 1 gallon » 4.5
litres, 2.2 pounds » 1 kilogram, 1 inch » 2.5 centimetres
Any imperial to metric conversions will be stated in the question.
Conversions between capacity and volume will be given in the question.
R11 Use compound units such as speed, rates of pay, unit pricing, density and pressure
Students should be able to:
● understand and use compound measures and compound units including
area, volume, speed, rates of pay, density and pressure
● understand speed and know the relationship between speed, distance and
time
● understand units in common usage such as miles per hour or metres per
second. The values used in the question will make the required unit clear.
Units of speed will be given as miles per hour (mph), kilometres per hour (km / h), or
metres per second (m / s or m s -1). Students who express speed in alternative units
such as metres per minute will not be penalised as long as the units are clearly stated.
Units of density will be given as g/cm 3 or kg / m 3. Students who express density in
alternative units such as grams per cubic metre will not be penalised as long as the
units are clearly stated. Compound measures may be expressed in the form metres
per second, m / s or m s -1. Other compound measures that are non-standard would
be defined in the question, for example population density is population / km 2
Including making comparisons.
Measures
Goto Year 9 Route Map Goto Year 11 Route MapGoto Year 10 Route Map
Specification content Specification notes
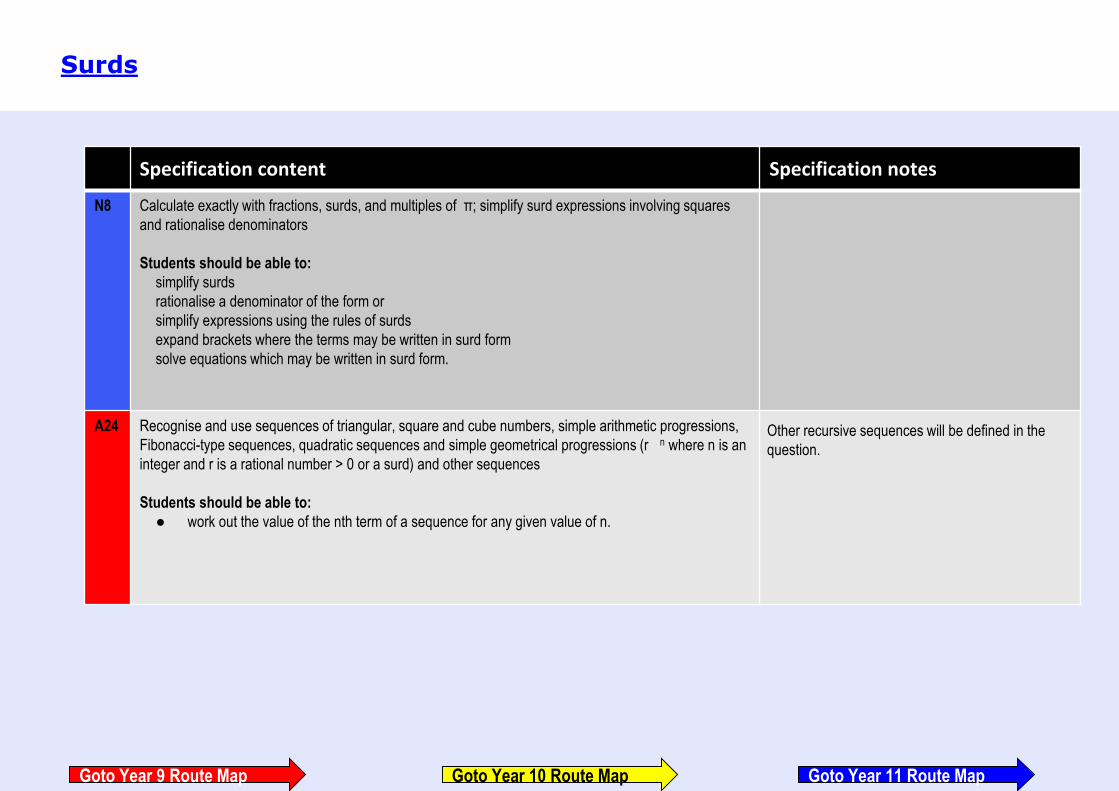
N8 Calculate exactly with fractions, surds, and multiples of π; simplify surd expressions involving squares
and rationalise denominators
Students should be able to:
simplify surds
rationalise a denominator of the form or
simplify expressions using the rules of surds
expand brackets where the terms may be written in surd form
solve equations which may be written in surd form.
A24 Recognise and use sequences of triangular, square and cube numbers, simple arithmetic progressions,
Fibonacci-type sequences, quadratic sequences and simple geometrical progressions (r n where n is an
integer and r is a rational number > 0 or a surd) and other sequences
Students should be able to:
● work out the value of the nth term of a sequence for any given value of n.
Other recursive sequences will be defined in the
question.
Surds
Goto Year 9 Route Map Goto Year 11 Route MapGoto Year 10 Route Map
Specification content Specification notes
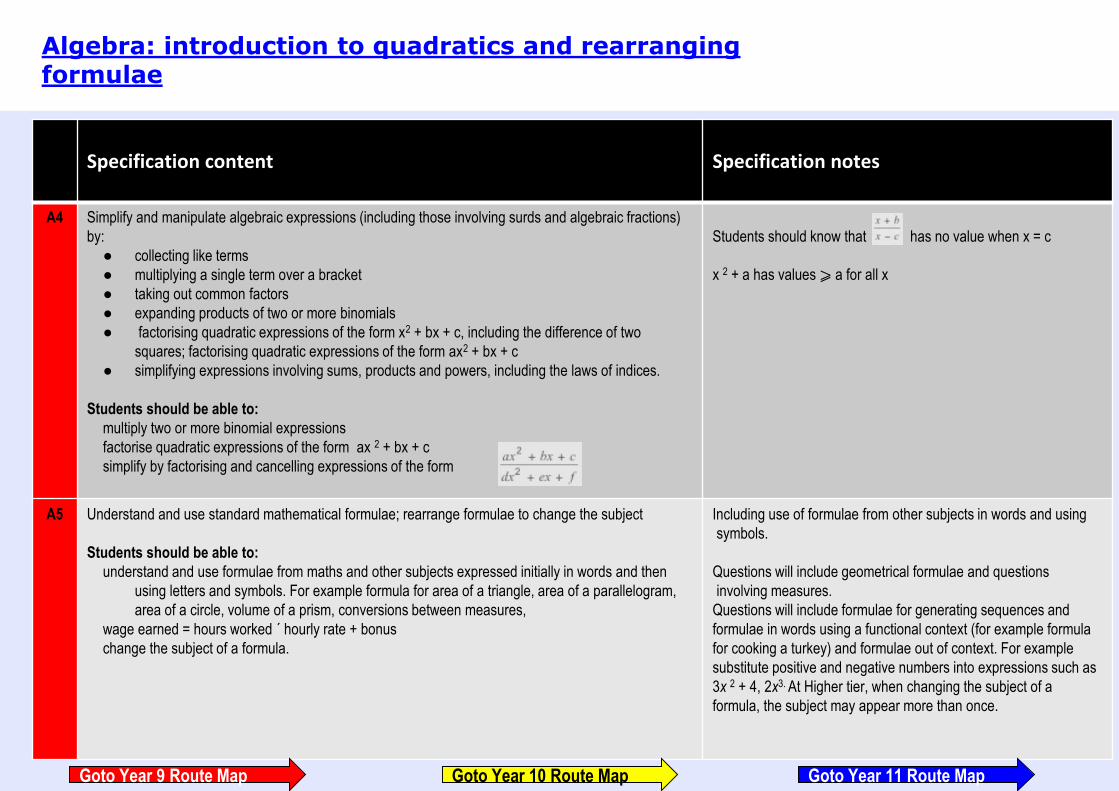
A4 Simplify and manipulate algebraic expressions (including those involving surds and algebraic fractions)
by:
● collecting like terms
● multiplying a single term over a bracket
● taking out common factors
● expanding products of two or more binomials
● factorising quadratic expressions of the form x2 + bx + c, including the difference of two
squares; factorising quadratic expressions of the form ax2 + bx + c
● simplifying expressions involving sums, products and powers, including the laws of indices.
Students should be able to:
multiply two or more binomial expressions
factorise quadratic expressions of the form ax 2 + bx + c
simplify by factorising and cancelling expressions of the form
Students should know that has no value when x = c
x 2 + a has values ⩾ a for all x
A5 Understand and use standard mathematical formulae; rearrange formulae to change the subject
Students should be able to:
understand and use formulae from maths and other subjects expressed initially in words and then
using letters and symbols. For example formula for area of a triangle, area of a parallelogram,
area of a circle, volume of a prism, conversions between measures,
wage earned = hours worked ´ hourly rate + bonus
change the subject of a formula.
Including use of formulae from other subjects in words and using
symbols.
Questions will include geometrical formulae and questions
involving measures.
Questions will include formulae for generating sequences and
formulae in words using a functional context (for example formula
for cooking a turkey) and formulae out of context. For example
substitute positive and negative numbers into expressions such as
3x 2 + 4, 2x3. At Higher tier, when changing the subject of a
formula, the subject may appear more than once.
Algebra: introduction to quadratics and rearranging formulae
Goto Year 9 Route Map Goto Year 11 Route MapGoto Year 10 Route Map
Specification content Specification notes
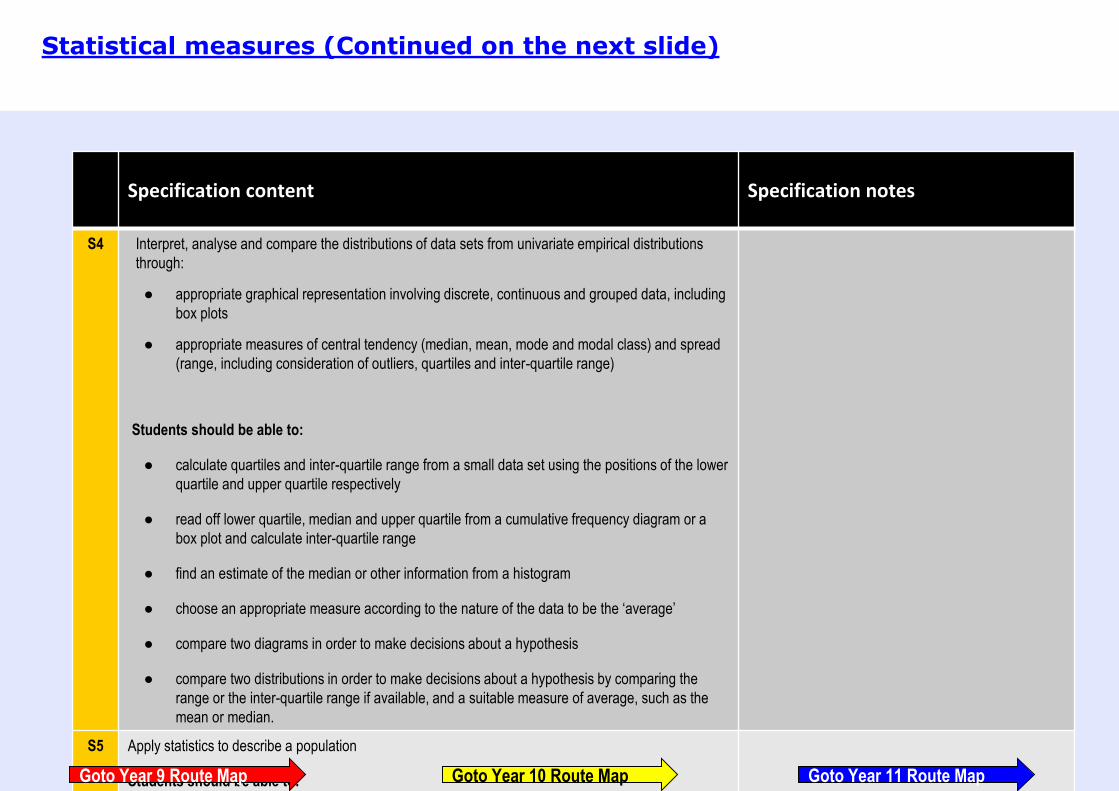
S4 Interpret, analyse and compare the distributions of data sets from univariate empirical distributions
through:
● appropriate graphical representation involving discrete, continuous and grouped data, including
box plots
● appropriate measures of central tendency (median, mean, mode and modal class) and spread
(range, including consideration of outliers, quartiles and inter-quartile range)
Students should be able to:
● calculate quartiles and inter-quartile range from a small data set using the positions of the lower
quartile and upper quartile respectively
● read off lower quartile, median and upper quartile from a cumulative frequency diagram or a
box plot and calculate inter-quartile range
● find an estimate of the median or other information from a histogram
● choose an appropriate measure according to the nature of the data to be the ‘average’
● compare two diagrams in order to make decisions about a hypothesis
● compare two distributions in order to make decisions about a hypothesis by comparing the
range or the inter-quartile range if available, and a suitable measure of average, such as the
mean or median.
S5 Apply statistics to describe a population
Students should be able to:
Statistical measures (Continued on the next slide)
Goto Year 9 Route Map Goto Year 11 Route MapGoto Year 10 Route Map

Specification content Specification notes
S1 Infer properties of populations or distributions from a sample, whilst knowing the limitations of sampling
Students should be able to:
● find patterns in data that may lead to a conclusion being drawn
● look for unusual data values such as a value that does not fit an otherwise good correlation
● understand that samples may or may not be representative of a population
● understand that the size and construction of a sample will affect how representative it is.
Statistical measures
Goto Year 9 Route Map Goto Year 11 Route MapGoto Year 10 Route Map
Specification content Specification notes
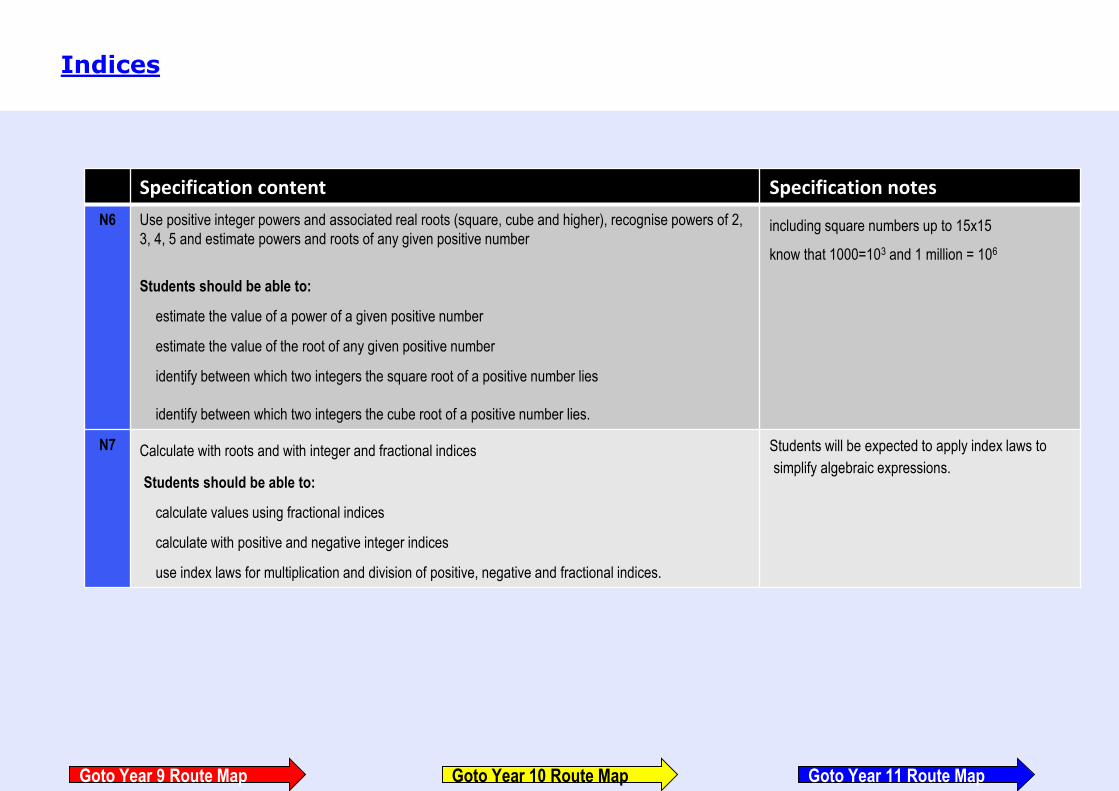
N6 Use positive integer powers and associated real roots (square, cube and higher), recognise powers of 2,
3, 4, 5 and estimate powers and roots of any given positive number
Students should be able to:
estimate the value of a power of a given positive number
estimate the value of the root of any given positive number
identify between which two integers the square root of a positive number lies
identify between which two integers the cube root of a positive number lies.
including square numbers up to 15x15
know that 1000=103 and 1 million = 106
N7 Calculate with roots and with integer and fractional indices
Students should be able to:
calculate values using fractional indices
calculate with positive and negative integer indices
use index laws for multiplication and division of positive, negative and fractional indices.
Students will be expected to apply index laws to
simplify algebraic expressions.
Indices
Goto Year 9 Route Map Goto Year 11 Route MapGoto Year 10 Route Map
Specification content Specification notes
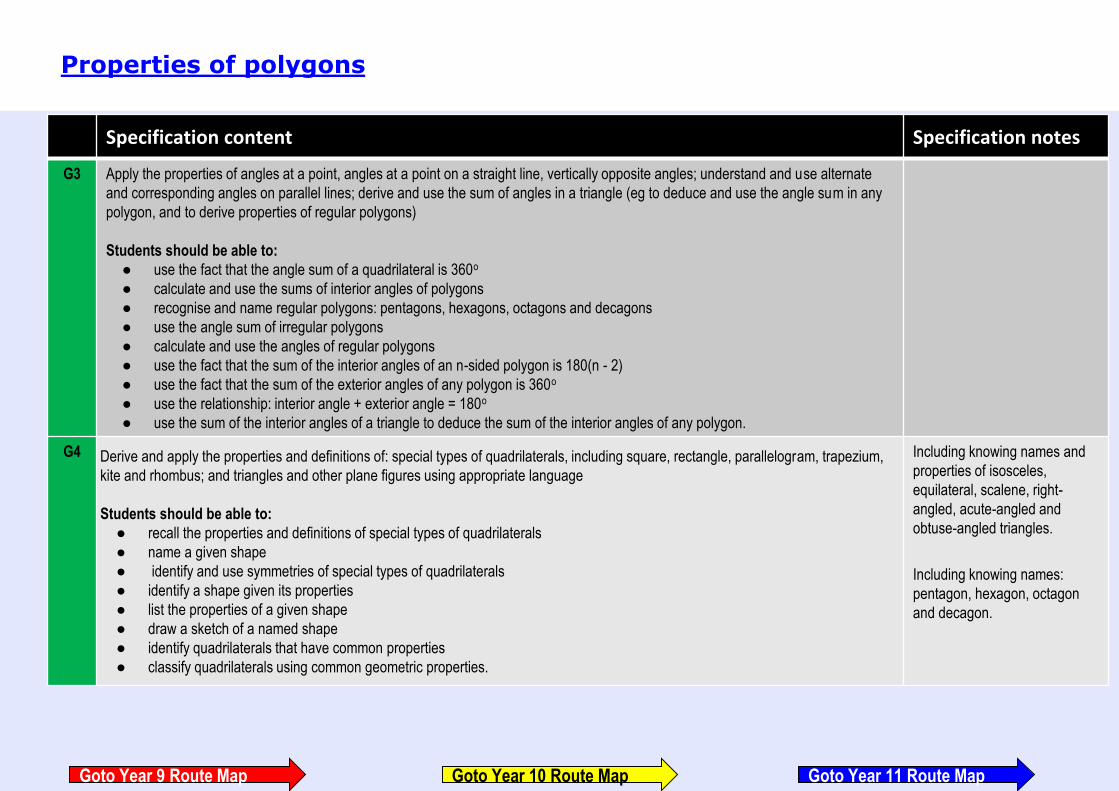
G3 Apply the properties of angles at a point, angles at a point on a straight line, vertically opposite angles; understand and use alternate
and corresponding angles on parallel lines; derive and use the sum of angles in a triangle (eg to deduce and use the angle sum in any
polygon, and to derive properties of regular polygons)
Students should be able to:
● use the fact that the angle sum of a quadrilateral is 360o
● calculate and use the sums of interior angles of polygons
● recognise and name regular polygons: pentagons, hexagons, octagons and decagons
● use the angle sum of irregular polygons
● calculate and use the angles of regular polygons
● use the fact that the sum of the interior angles of an n-sided polygon is 180(n - 2)
● use the fact that the sum of the exterior angles of any polygon is 360o
● use the relationship: interior angle + exterior angle = 180o
● use the sum of the interior angles of a triangle to deduce the sum of the interior angles of any polygon.
G4 Derive and apply the properties and definitions of: special types of quadrilaterals, including square, rectangle, parallelogram, trapezium,
kite and rhombus; and triangles and other plane figures using appropriate language
Students should be able to:
● recall the properties and definitions of special types of quadrilaterals
● name a given shape
● identify and use symmetries of special types of quadrilaterals
● identify a shape given its properties
● list the properties of a given shape
● draw a sketch of a named shape
● identify quadrilaterals that have common properties
● classify quadrilaterals using common geometric properties.
Including knowing names and
properties of isosceles,
equilateral, scalene, right-
angled, acute-angled and
obtuse-angled triangles.
Including knowing names:
pentagon, hexagon, octagon
and decagon.
Properties of polygons
Goto Year 9 Route Map Goto Year 11 Route MapGoto Year 10 Route Map
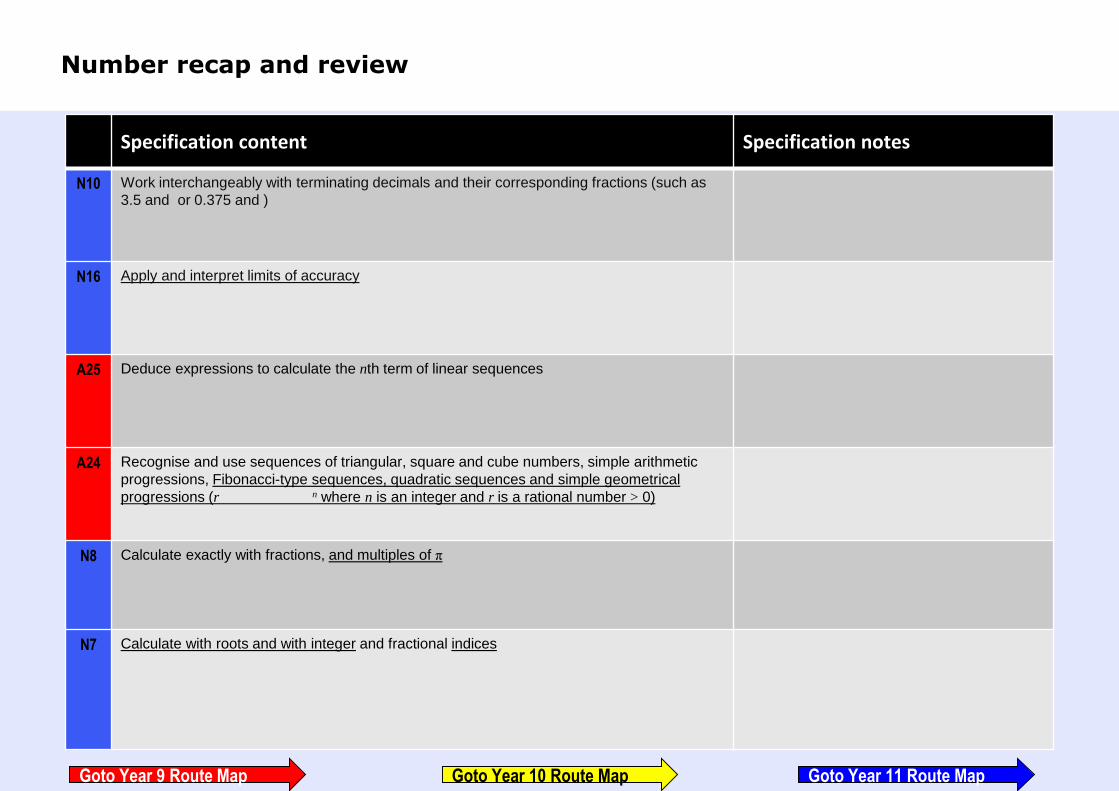
Specification content Specification notes
N10 Work interchangeably with terminating decimals and their corresponding fractions (such as
3.5 and or 0.375 and )
N16 Apply and interpret limits of accuracy
A25 Deduce expressions to calculate the nth term of linear sequences
A24 Recognise and use sequences of triangular, square and cube numbers, simple arithmetic
progressions, Fibonacci-type sequences, quadratic sequences and simple geometrical
progressions (r n where n is an integer and r is a rational number > 0)
N8 Calculate exactly with fractions, and multiples of π
N7 Calculate with roots and with integer and fractional indices
Number recap and review
Goto Year 9 Route Map Goto Year 11 Route MapGoto Year 10 Route Map
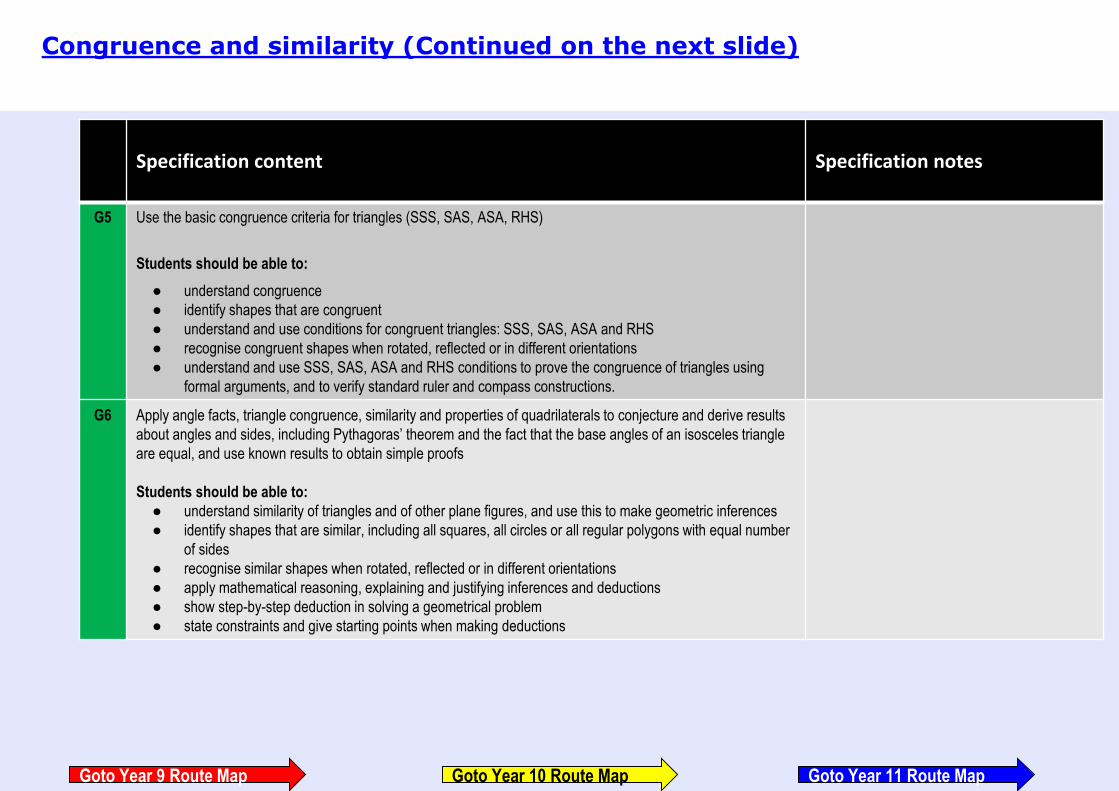
Specification content Specification notes
G5 Use the basic congruence criteria for triangles (SSS, SAS, ASA, RHS)
Students should be able to:
● understand congruence
● identify shapes that are congruent
● understand and use conditions for congruent triangles: SSS, SAS, ASA and RHS
● recognise congruent shapes when rotated, reflected or in different orientations
● understand and use SSS, SAS, ASA and RHS conditions to prove the congruence of triangles using
formal arguments, and to verify standard ruler and compass constructions.
G6 Apply angle facts, triangle congruence, similarity and properties of quadrilaterals to conjecture and derive results
about angles and sides, including Pythagoras’ theorem and the fact that the base angles of an isosceles triangle
are equal, and use known results to obtain simple proofs
Students should be able to:
● understand similarity of triangles and of other plane figures, and use this to make geometric inferences
● identify shapes that are similar, including all squares, all circles or all regular polygons with equal number
of sides
● recognise similar shapes when rotated, reflected or in different orientations
● apply mathematical reasoning, explaining and justifying inferences and deductions
● show step-by-step deduction in solving a geometrical problem
● state constraints and give starting points when making deductions
Congruence and similarity (Continued on the next slide)
Goto Year 9 Route Map Goto Year 11 Route MapGoto Year 10 Route Map
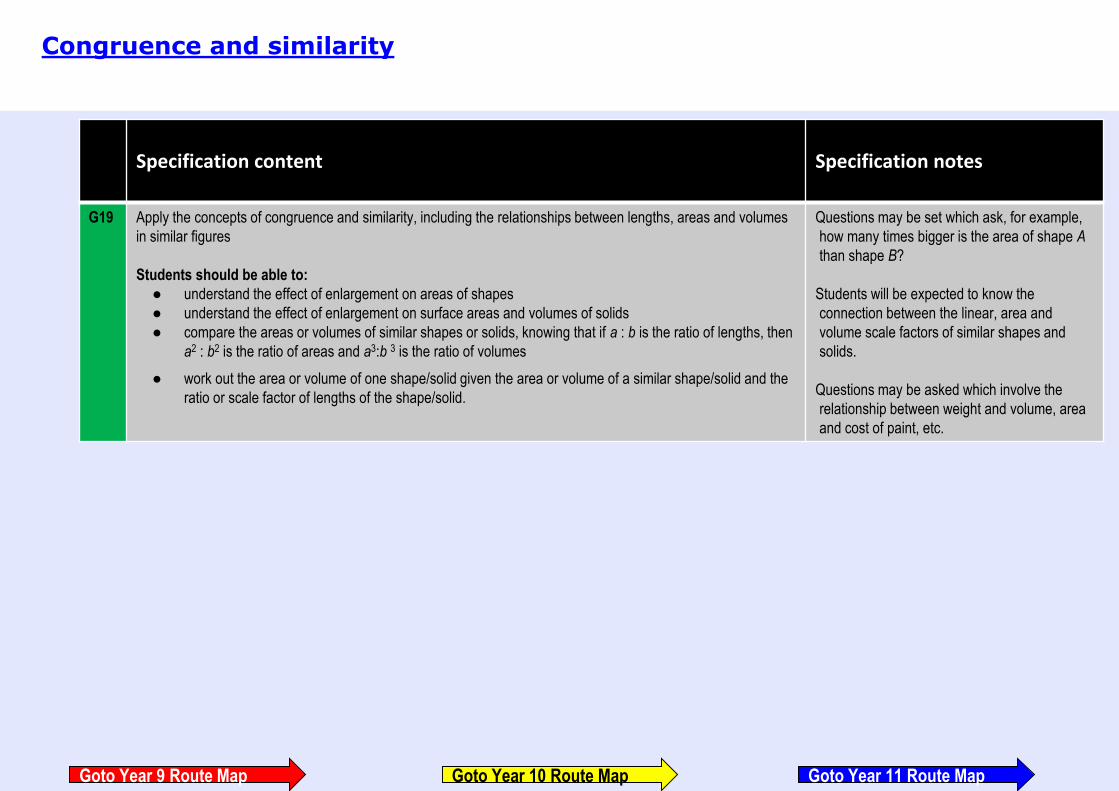
Specification content Specification notes
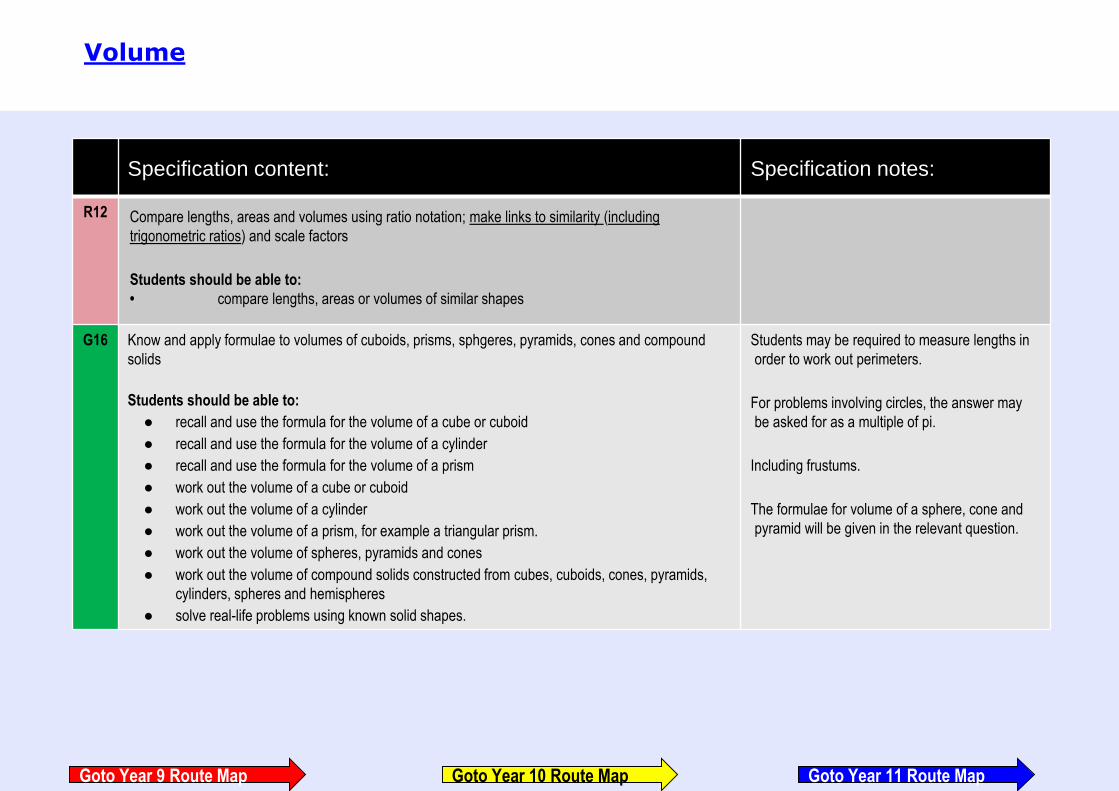
G19 Apply the concepts of congruence and similarity, including the relationships between lengths, areas and volumes
in similar figures
Students should be able to:
● understand the effect of enlargement on areas of shapes
● understand the effect of enlargement on surface areas and volumes of solids
● compare the areas or volumes of similar shapes or solids, knowing that if a : b is the ratio of lengths, then
a2 : b2 is the ratio of areas and a3:b 3 is the ratio of volumes
● work out the area or volume of one shape/solid given the area or volume of a similar shape/solid and the
ratio or scale factor of lengths of the shape/solid.
Questions may be set which ask, for example,
how many times bigger is the area of shape A
than shape B?
Students will be expected to know the
connection between the linear, area and
volume scale factors of similar shapes and
solids.
Questions may be asked which involve the
relationship between weight and volume, area
and cost of paint, etc.
Congruence and similarity
Goto Year 9 Route Map Goto Year 11 Route MapGoto Year 10 Route Map
Specification content Specification notes
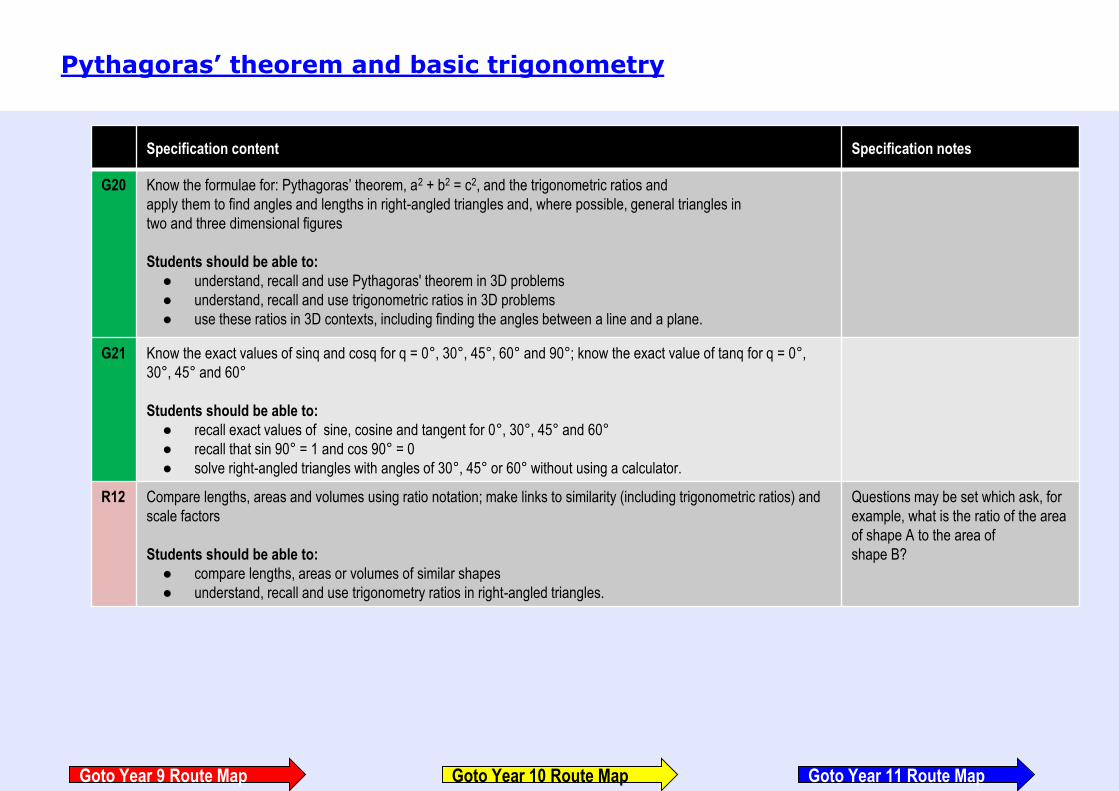
G20 Know the formulae for: Pythagoras’ theorem, a2 + b2 = c2, and the trigonometric ratios and
apply them to find angles and lengths in right-angled triangles and, where possible, general triangles in
two and three dimensional figures
Students should be able to:
● understand, recall and use Pythagoras' theorem in 3D problems
● understand, recall and use trigonometric ratios in 3D problems
● use these ratios in 3D contexts, including finding the angles between a line and a plane.
G21 Know the exact values of sinq and cosq for q = 0°, 30°, 45°, 60° and 90°; know the exact value of tanq for q = 0°,
30°, 45° and 60°
Students should be able to:
● recall exact values of sine, cosine and tangent for 0°, 30°, 45° and 60°
● recall that sin 90° = 1 and cos 90° = 0
● solve right-angled triangles with angles of 30°, 45° or 60° without using a calculator.
R12 Compare lengths, areas and volumes using ratio notation; make links to similarity (including trigonometric ratios) and
scale factors
Students should be able to:
● compare lengths, areas or volumes of similar shapes
● understand, recall and use trigonometry ratios in right-angled triangles.
Questions may be set which ask, for
example, what is the ratio of the area
of shape A to the area of
shape B?
Pythagoras’ theorem and basic trigonometry
Goto Year 9 Route Map Goto Year 11 Route MapGoto Year 10 Route Map
Specification content Specification notes
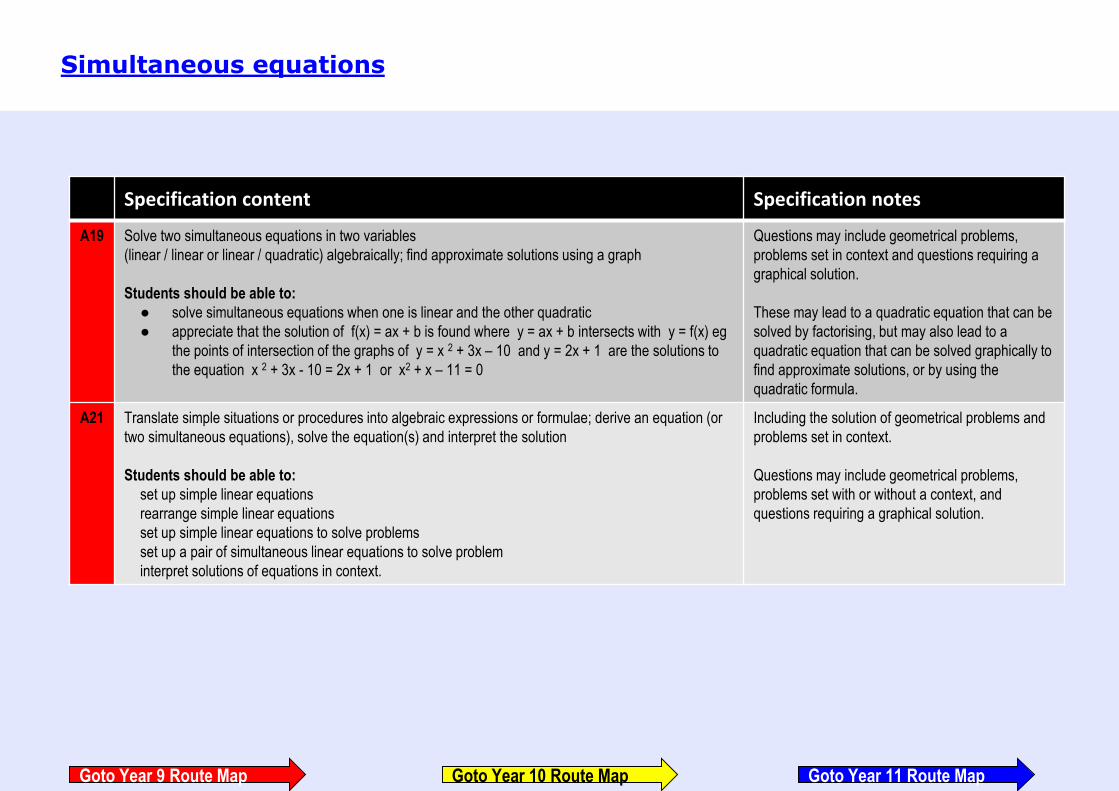
A19 Solve two simultaneous equations in two variables
(linear / linear or linear / quadratic) algebraically; find approximate solutions using a graph
Students should be able to:
● solve simultaneous equations when one is linear and the other quadratic
● appreciate that the solution of f(x) = ax + b is found where y = ax + b intersects with y = f(x) eg
the points of intersection of the graphs of y = x 2 + 3x – 10 and y = 2x + 1 are the solutions to
the equation x 2 + 3x - 10 = 2x + 1 or x2 + x – 11 = 0
Questions may include geometrical problems,
problems set in context and questions requiring a
graphical solution.
These may lead to a quadratic equation that can be
solved by factorising, but may also lead to a
quadratic equation that can be solved graphically to
find approximate solutions, or by using the
quadratic formula.
A21 Translate simple situations or procedures into algebraic expressions or formulae; derive an equation (or
two simultaneous equations), solve the equation(s) and interpret the solution
Students should be able to:
set up simple linear equations
rearrange simple linear equations
set up simple linear equations to solve problems
set up a pair of simultaneous linear equations to solve problem
interpret solutions of equations in context.
Including the solution of geometrical problems and
problems set in context.
Questions may include geometrical problems,
problems set with or without a context, and
questions requiring a graphical solution.
Simultaneous equations
Goto Year 9 Route Map Goto Year 11 Route MapGoto Year 10 Route Map

Specification content: Specification notes:
P2 Apply ideas of randomness, fairness and equally likely events to calculate expected outcomes of multiple future experiments
Students should be able to:
● use lists or tables to find probabilities
● understand that experiments rarely give the same results when there is a random process involved
● appreciate the ‘lack of memory’ in a random situation, for example a fair coin is still equally likely to give heads or tails
even after five heads in a row.
P3 Relate relative expected frequencies to theoretical probability, using appropriate language and the 0 - 1 probability scale
Students should be able to:
● understand and use the term relative frequency
● consider differences where they exist between the theoretical probability of an outcome and its relative frequency in a
practical situation
● recall that an ordinary fair dice is an unbiased dice numbered 1, 2, 3, 4, 5 and 6 with equally likely outcomes
● estimate probabilities by considering relative frequency.
P5 Understand that empirical unbiased samples tend towards theoretical probability distributions, with increasing sample size
Students should be able to:
● understand that the greater the number of trials in an experiment, the more reliable the results are likely to be
● understand how a relative frequency diagram may show a settling down as sample size increases, enabling an estimate of
a probability to be reliably made; and that if an estimate of a probability is required, the relative frequency of the largest
number of trials available should be used.
Probability (Continued on the next slide)
Goto Year 9 Route Map Goto Year 11 Route MapGoto Year 10 Route Map

Specification content: Specification
notes:
P6 Enumerate sets and combinations of sets systematically, using tables, grids, Venn diagrams and tree diagrams
Students should be able to:
● complete tables and /or grids to show outcomes and probabilities
● complete a tree diagram to show outcomes and probabilities
● understand that P(A) means the probability of event A
● understand that P(A/) means the probability of event not A
● understand that P(A È B) means the probability of event A or B or both
● understand that P(A Ç B) means the probability of event A and B
● understand a Venn diagram consisting of a universal set and at most two sets, which may or may not intersect
● shade areas on a Venn diagram involving at most two sets, which may or may not intersect
● solve problems given a Venn diagram
● solve problems where a Venn diagram approach is a suitable strategy to use but a diagram is not given in the question.
P8 Calculate the probability of independent and dependent combined events, including using tree diagrams and other representations, and know the
underlying assumptions
Students should be able to:
● know when it is appropriate to add probabilities
● know when it is appropriate to multiply probabilities
● understand the meaning of independence for events
● calculate probabilities when events are dependent
● understand the implications of with or without replacement problems for the probabilities obtained
● complete a tree diagram to show outcomes and probabilities
● use a tree diagram as a method for calculating probabilities for independent or dependent events.
P9 Calculate and interpret conditional probabilities through representation using expected frequencies with two-way tables, tree diagrams and Venn diagrams
Students should be able to:
● understand conditional probability
● understand the implications of with or without replacement problems for the probabilities obtained
● complete a tree diagram to show outcomes and probabilities
● use a tree diagram as a method for calculating conditional probabilities
● use a Venn diagram as a method for calculating conditional probabilities.
Probability (Part 2)
Goto Year 9 Route Map Goto Year 11 Route MapGoto Year 10 Route Map
Specification content: Specification notes:
R12 Compare lengths, areas and volumes using ratio notation; make links to similarity (including
trigonometric ratios) and scale factors
Students should be able to:
• compare lengths, areas or volumes of similar shapes
G16 Know and apply formulae to volumes of cuboids, prisms, sphgeres, pyramids, cones and compound
solids
Students should be able to:
● recall and use the formula for the volume of a cube or cuboid
● recall and use the formula for the volume of a cylinder
● recall and use the formula for the volume of a prism
● work out the volume of a cube or cuboid
● work out the volume of a cylinder
● work out the volume of a prism, for example a triangular prism.
● work out the volume of spheres, pyramids and cones
● work out the volume of compound solids constructed from cubes, cuboids, cones, pyramids,
cylinders, spheres and hemispheres
● solve real-life problems using known solid shapes.
Students may be required to measure lengths in
order to work out perimeters.
For problems involving circles, the answer may
be asked for as a multiple of pi.
Including frustums.
The formulae for volume of a sphere, cone and
pyramid will be given in the relevant question.
Volume
Goto Year 9 Route Map Goto Year 11 Route MapGoto Year 10 Route Map

Specification content Specification notes
A12 Recognise, sketch and interpret graphs of linear functions, quadratic functions, simple cubic functions, the
reciprocal function, y = 1/x with x ≠ 0, exponential functions y = k x for positive values of k.
Students should be able to:
● draw, sketch, recognise and interpret graphs of the form y = k x for positive values of k
Graphs should be drawn as smooth curves.
Sketching graphs
Goto Year 9 Route Map Goto Year 11 Route MapGoto Year 10 Route Map
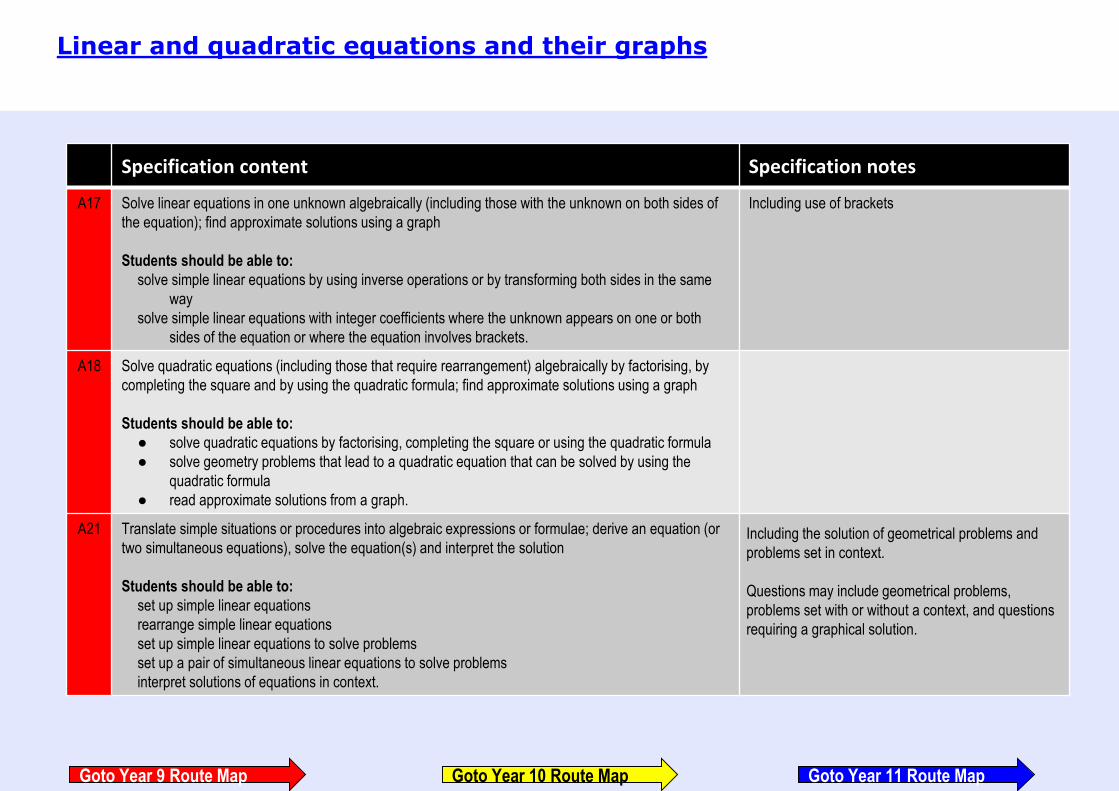
Specification content Specification notes
A17 Solve linear equations in one unknown algebraically (including those with the unknown on both sides of
the equation); find approximate solutions using a graph
Students should be able to:
solve simple linear equations by using inverse operations or by transforming both sides in the same
way
solve simple linear equations with integer coefficients where the unknown appears on one or both
sides of the equation or where the equation involves brackets.
Including use of brackets
A18 Solve quadratic equations (including those that require rearrangement) algebraically by factorising, by
completing the square and by using the quadratic formula; find approximate solutions using a graph
Students should be able to:
● solve quadratic equations by factorising, completing the square or using the quadratic formula
● solve geometry problems that lead to a quadratic equation that can be solved by using the
quadratic formula
● read approximate solutions from a graph.
A21 Translate simple situations or procedures into algebraic expressions or formulae; derive an equation (or
two simultaneous equations), solve the equation(s) and interpret the solution
Students should be able to:
set up simple linear equations
rearrange simple linear equations
set up simple linear equations to solve problems
set up a pair of simultaneous linear equations to solve problems
interpret solutions of equations in context.
Including the solution of geometrical problems and
problems set in context.
Questions may include geometrical problems,
problems set with or without a context, and questions
requiring a graphical solution.
Linear and quadratic equations and their graphs
Goto Year 9 Route Map Goto Year 11 Route MapGoto Year 10 Route Map
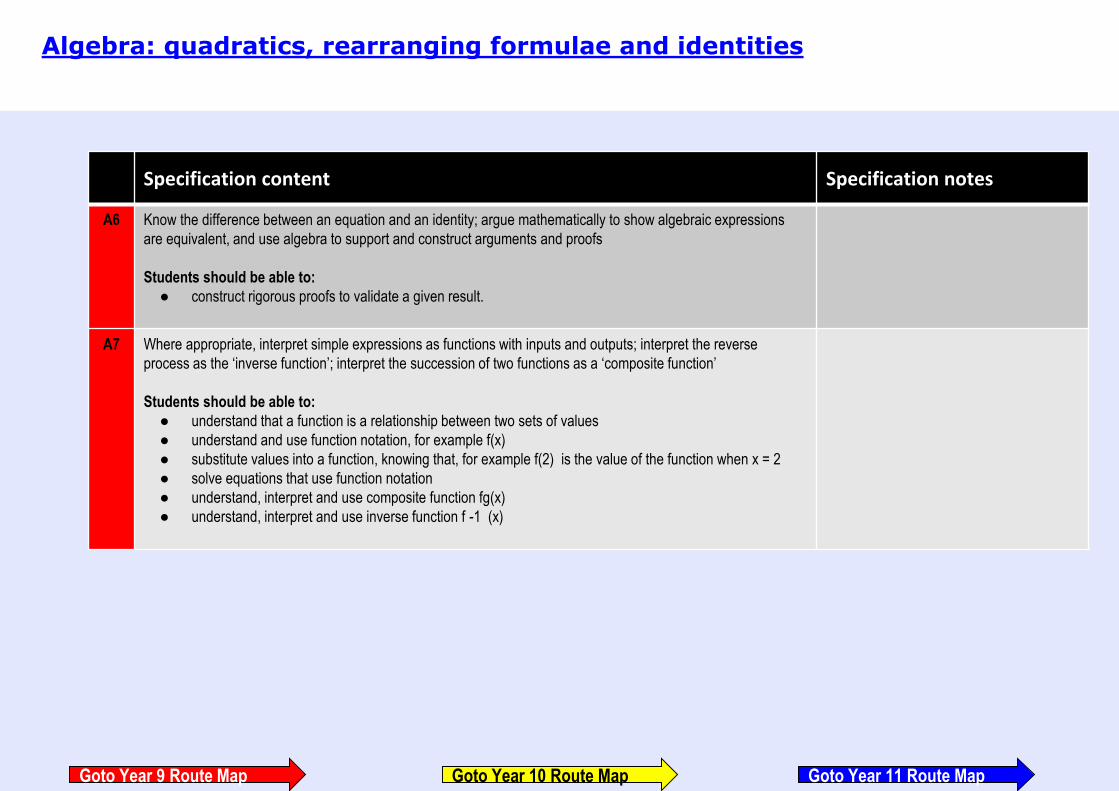
Specification content Specification notes
A6 Know the difference between an equation and an identity; argue mathematically to show algebraic expressions
are equivalent, and use algebra to support and construct arguments and proofs
Students should be able to:
● construct rigorous proofs to validate a given result.
A7 Where appropriate, interpret simple expressions as functions with inputs and outputs; interpret the reverse
process as the ‘inverse function’; interpret the succession of two functions as a ‘composite function’
Students should be able to:
● understand that a function is a relationship between two sets of values
● understand and use function notation, for example f(x)
● substitute values into a function, knowing that, for example f(2) is the value of the function when x = 2
● solve equations that use function notation
● understand, interpret and use composite function fg(x)
● understand, interpret and use inverse function f -1 (x)
Algebra: quadratics, rearranging formulae and identities
Goto Year 9 Route Map Goto Year 11 Route MapGoto Year 10 Route Map
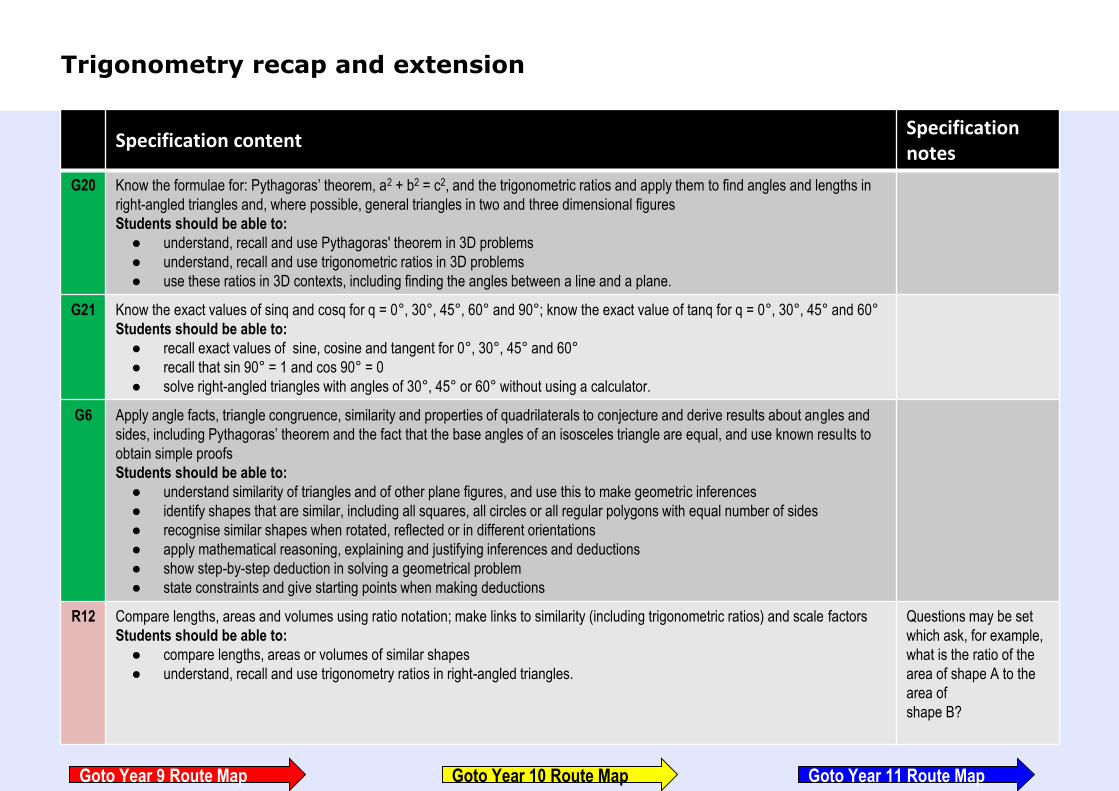
Specification contentSpecification notes
G20 Know the formulae for: Pythagoras’ theorem, a2 + b2 = c2, and the trigonometric ratios and apply them to find angles and lengths in
right-angled triangles and, where possible, general triangles in two and three dimensional figures
Students should be able to:
● understand, recall and use Pythagoras' theorem in 3D problems
● understand, recall and use trigonometric ratios in 3D problems
● use these ratios in 3D contexts, including finding the angles between a line and a plane.
G21 Know the exact values of sinq and cosq for q = 0°, 30°, 45°, 60° and 90°; know the exact value of tanq for q = 0°, 30°, 45° and 60°
Students should be able to:
● recall exact values of sine, cosine and tangent for 0°, 30°, 45° and 60°
● recall that sin 90° = 1 and cos 90° = 0
● solve right-angled triangles with angles of 30°, 45° or 60° without using a calculator.
G6 Apply angle facts, triangle congruence, similarity and properties of quadrilaterals to conjecture and derive results about angles and
sides, including Pythagoras’ theorem and the fact that the base angles of an isosceles triangle are equal, and use known resu lts to
obtain simple proofs
Students should be able to:
● understand similarity of triangles and of other plane figures, and use this to make geometric inferences
● identify shapes that are similar, including all squares, all circles or all regular polygons with equal number of sides
● recognise similar shapes when rotated, reflected or in different orientations
● apply mathematical reasoning, explaining and justifying inferences and deductions
● show step-by-step deduction in solving a geometrical problem
● state constraints and give starting points when making deductions
R12 Compare lengths, areas and volumes using ratio notation; make links to similarity (including trigonometric ratios) and scale factors
Students should be able to:
● compare lengths, areas or volumes of similar shapes
● understand, recall and use trigonometry ratios in right-angled triangles.
Questions may be set
which ask, for example,
what is the ratio of the
area of shape A to the
area of
shape B?
Trigonometry recap and extension
Goto Year 9 Route Map Goto Year 11 Route MapGoto Year 10 Route Map
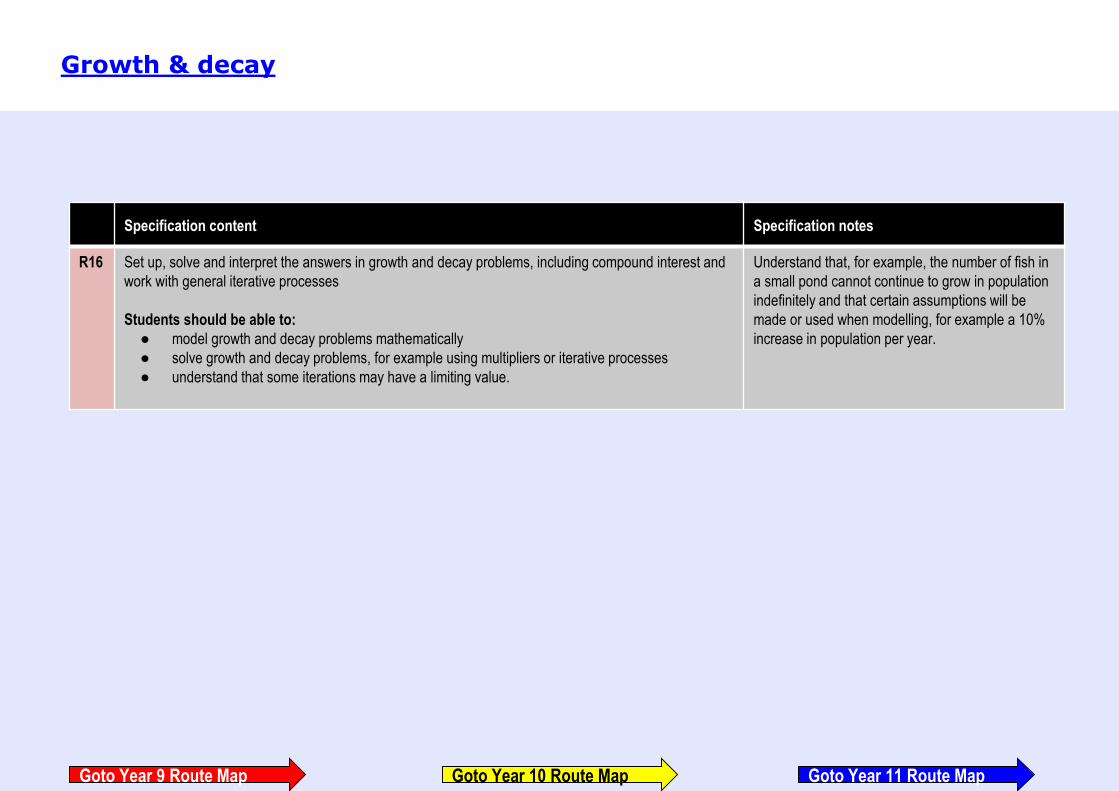
Specification content Specification notes
R16 Set up, solve and interpret the answers in growth and decay problems, including compound interest and
work with general iterative processes
Students should be able to:
● model growth and decay problems mathematically
● solve growth and decay problems, for example using multipliers or iterative processes
● understand that some iterations may have a limiting value.
Understand that, for example, the number of fish in
a small pond cannot continue to grow in population
indefinitely and that certain assumptions will be
made or used when modelling, for example a 10%
increase in population per year.
Growth & decay
Goto Year 9 Route Map Goto Year 11 Route MapGoto Year 10 Route Map
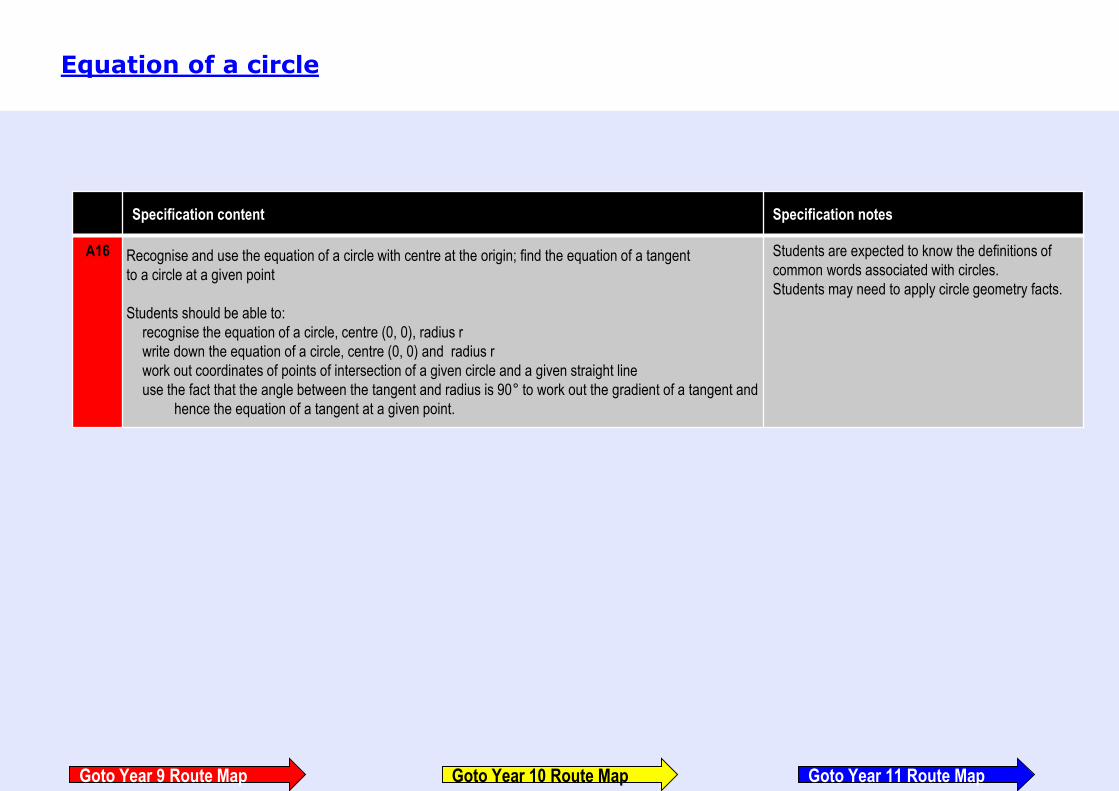
Specification content Specification notes
A16 Recognise and use the equation of a circle with centre at the origin; find the equation of a tangent
to a circle at a given point
Students should be able to:
recognise the equation of a circle, centre (0, 0), radius r
write down the equation of a circle, centre (0, 0) and radius r
work out coordinates of points of intersection of a given circle and a given straight line
use the fact that the angle between the tangent and radius is 90° to work out the gradient of a tangent and
hence the equation of a tangent at a given point.
Students are expected to know the definitions of
common words associated with circles.
Students may need to apply circle geometry facts.
Equation of a circle
Goto Year 9 Route Map Goto Year 11 Route MapGoto Year 10 Route Map

Specification content Specification notes
A17 Solve linear equations in one unknown algebraically (including those with the unknown on both sides of the
equation); find approximate solutions using a graph
Students should be able to:
solve simple linear equations by using inverse operations or by transforming both sides in the same way
solve simple linear equations with integer coefficients where the unknown appears on one or both sides of the
equation or where the equation involves brackets.
including use of brackets
A18 Solve quadratic equations (including those that require rearrangement) algebraically by factorising, by completing the
square and by using the quadratic formula; find approximate solutions using a graph
Students should be able to:
● solve quadratic equations by factorising, completing the square or using the quadratic formula
● solve geometry problems that lead to a quadratic equation that can be solved by using the quadratic formula
● read approximate solutions from a graph.
Students should know that trial and improvement is not
an acceptable method for solving quadratic equations.
Solutions to quadratic equations, using the quadratic
formula or by completing the square, may be left in
surd form where appropriate.
Students should know that the roots of an equation f(x)
= a can be found where y = a intersects with y = f(x)
A11 Identify and interpret roots, intercepts, turning points of quadratic functions graphically; deduce roots algebraically
and turning points by completing the square
Students should be able to:
complete the square
deduce turning points by completing the square.
including the symmetrical property of a quadratic
A21 Translate simple situations or procedures into algebraic expressions or formulae; derive an equation (or two
simultaneous equations), solve the equation(s) and interpret the solution
Students should be able to:
set up simple linear equations
rearrange simple linear equations
set up simple linear equations to solve problems
set up a pair of simultaneous linear equations to solve problems
interpret solutions of equations in context.
including solution of geometrical problems and
problems set in context
Further equations and graphs
Goto Year 9 Route Map Goto Year 11 Route MapGoto Year 10 Route Map
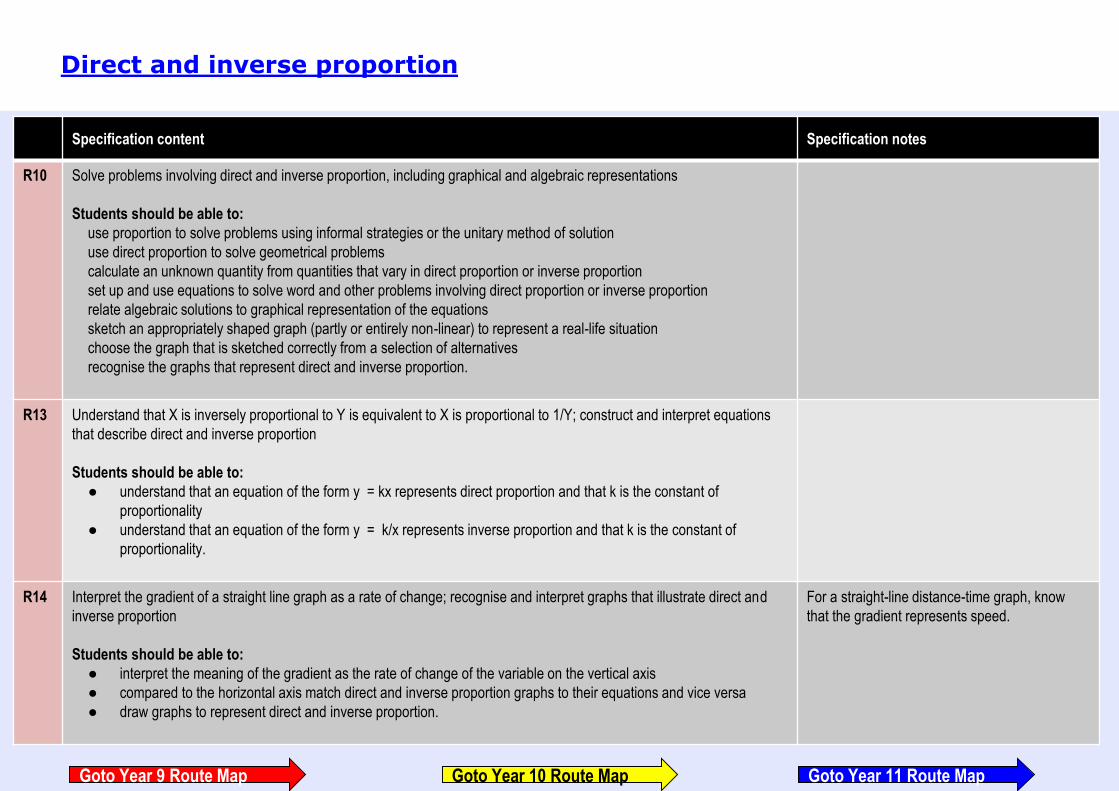
Specification content Specification notes
R10 Solve problems involving direct and inverse proportion, including graphical and algebraic representations
Students should be able to:
use proportion to solve problems using informal strategies or the unitary method of solution
use direct proportion to solve geometrical problems
calculate an unknown quantity from quantities that vary in direct proportion or inverse proportion
set up and use equations to solve word and other problems involving direct proportion or inverse proportion
relate algebraic solutions to graphical representation of the equations
sketch an appropriately shaped graph (partly or entirely non-linear) to represent a real-life situation
choose the graph that is sketched correctly from a selection of alternatives
recognise the graphs that represent direct and inverse proportion.
R13 Understand that X is inversely proportional to Y is equivalent to X is proportional to 1/Y; construct and interpret equations
that describe direct and inverse proportion
Students should be able to:
● understand that an equation of the form y = kx represents direct proportion and that k is the constant of
proportionality
● understand that an equation of the form y = k/x represents inverse proportion and that k is the constant of
proportionality.
R14 Interpret the gradient of a straight line graph as a rate of change; recognise and interpret graphs that illustrate direct and
inverse proportion
Students should be able to:
● interpret the meaning of the gradient as the rate of change of the variable on the vertical axis
● compared to the horizontal axis match direct and inverse proportion graphs to their equations and vice versa
● draw graphs to represent direct and inverse proportion.
For a straight-line distance-time graph, know
that the gradient represents speed.
Direct and inverse proportion
Goto Year 9 Route Map Goto Year 11 Route MapGoto Year 10 Route Map
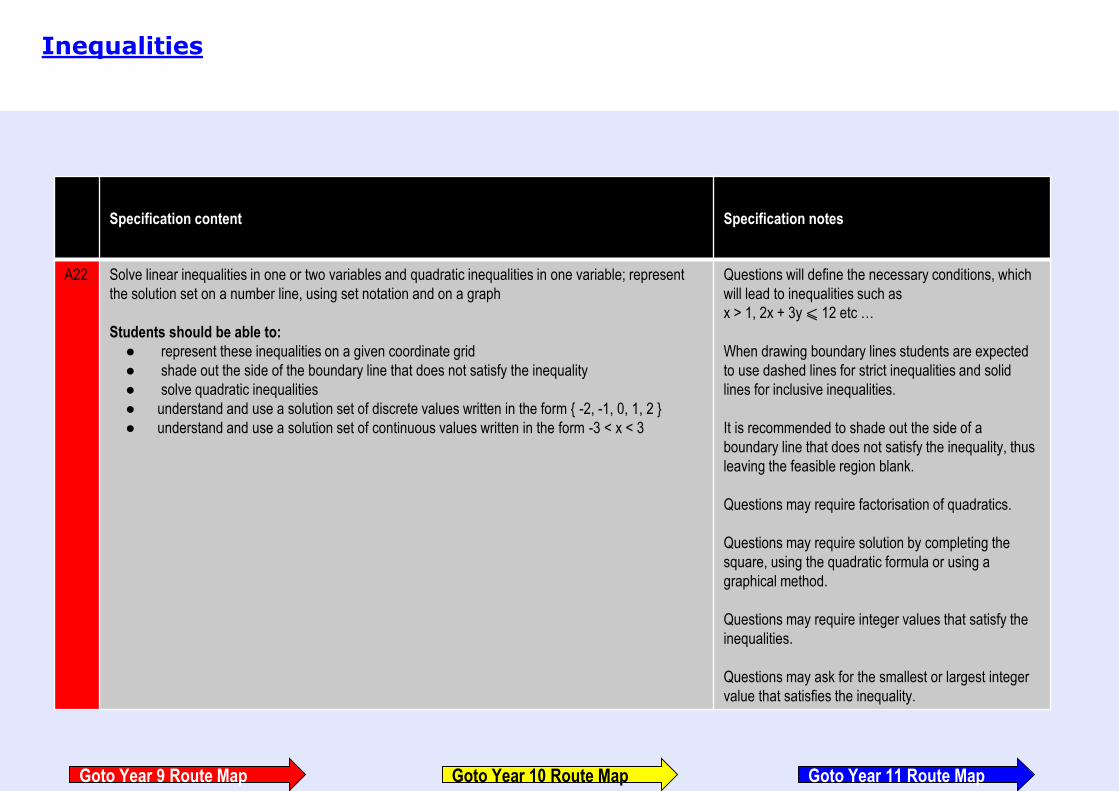
Specification content Specification notes
A22 Solve linear inequalities in one or two variables and quadratic inequalities in one variable; represent
the solution set on a number line, using set notation and on a graph
Students should be able to:
● represent these inequalities on a given coordinate grid
● shade out the side of the boundary line that does not satisfy the inequality
● solve quadratic inequalities
● understand and use a solution set of discrete values written in the form { -2, -1, 0, 1, 2 }
● understand and use a solution set of continuous values written in the form -3 < x < 3
Questions will define the necessary conditions, which
will lead to inequalities such as
x > 1, 2x + 3y ⩽ 12 etc …
When drawing boundary lines students are expected
to use dashed lines for strict inequalities and solid
lines for inclusive inequalities.
It is recommended to shade out the side of a
boundary line that does not satisfy the inequality, thus
leaving the feasible region blank.
Questions may require factorisation of quadratics.
Questions may require solution by completing the
square, using the quadratic formula or using a
graphical method.
Questions may require integer values that satisfy the
inequalities.
Questions may ask for the smallest or largest integer
value that satisfies the inequality.
Inequalities
Goto Year 9 Route Map Goto Year 11 Route MapGoto Year 10 Route Map

Specification content Specification notes
G25 Apply addition and subtraction of vectors, multiplication of vectors by a scalar, and diagrammatic and
column representations of vectors; use vectors to construct geometric arguments and proofs
Students should be able to:
● solve simple geometrical problems in 2D using vector methods
● apply vector methods for simple geometric proofs
● recognise when lines are parallel using vectors
● recognise when three or more points are colinear using vectors
● use vectors to show three or more points are collinear.
Bold type and arrows such as a = OA will be used
to represent vectors in geometrical problems.
Vectors
Goto Year 9 Route Map Goto Year 11 Route MapGoto Year 10 Route Map

Specification content Specification notes
A12 Recognise, sketch and interpret graphs of trigonometrical functions (with arguments in degrees) y = sin x, y
= cos x and y = tan x for angles
of any size
Students should be able to:
● know the shapes of the graphs of functions y = sin x , y = cos x and y = tan x
Students would be expected to sketch a graph of y
= sin x, y = cos x and y = tan x between 0° and
360°, and know that the maximum and minimum
values for sin and cos are 1 and –1
They would also be expected to know that the
graphs of sin, cos and tan are periodic.
Graphs should be drawn as smooth curves.
Further Sketching graphs
Goto Year 9 Route Map Goto Year 11 Route MapGoto Year 10 Route Map
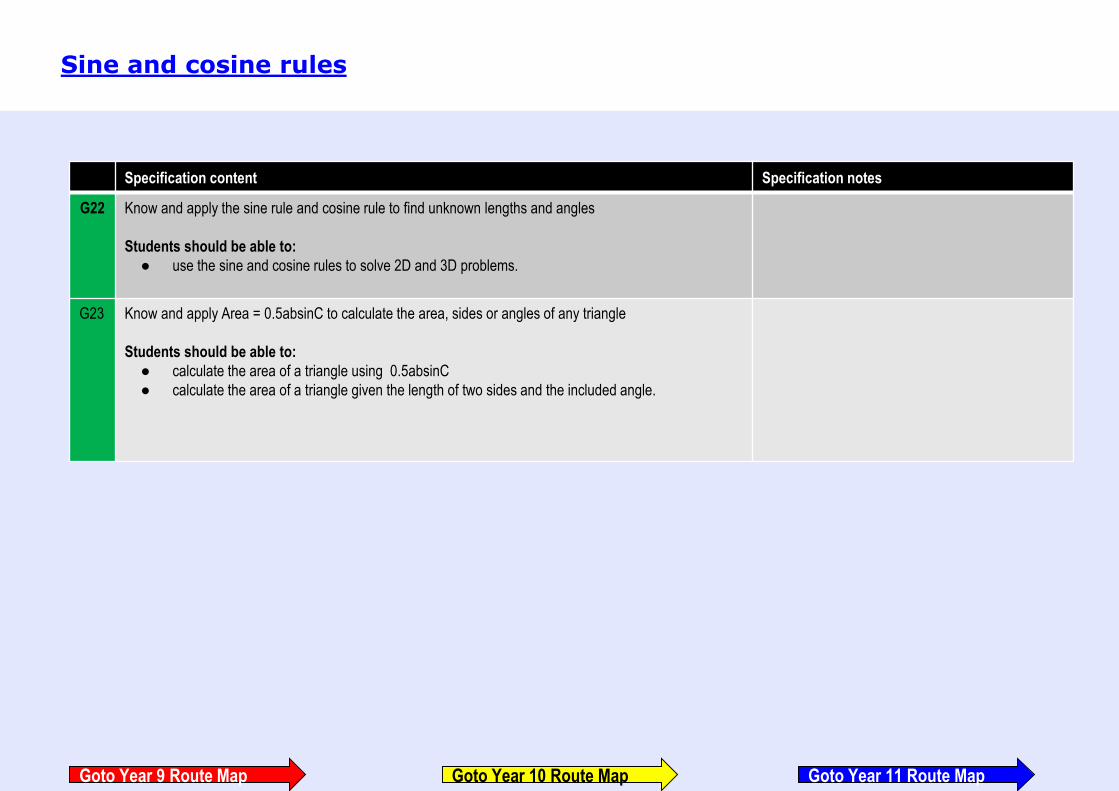
Specification content Specification notes
G22 Know and apply the sine rule and cosine rule to find unknown lengths and angles
Students should be able to:
● use the sine and cosine rules to solve 2D and 3D problems.
G23 Know and apply Area = 0.5absinC to calculate the area, sides or angles of any triangle
Students should be able to:
● calculate the area of a triangle using 0.5absinC
● calculate the area of a triangle given the length of two sides and the included angle.
Sine and cosine rules
Goto Year 9 Route Map Goto Year 11 Route MapGoto Year 10 Route Map

Specification content Specification notes
A13 Sketch translations and reflections of a given function
Students should be able to:
transform the graph of any function f(x) including: f(x) + a, f(x + b), -f(x) and f(-x) where a and b are
integers
recognise transformations of functions and be able to write down the function of a transformation given
the original function.
For example, transformations of the graphs of linear
and quadratic functions and of trigonometric
functions based on y = sin x and y = cos x for 0 ⩽x ⩽ 360 may be assessed.
Transforming functions
Goto Year 9 Route Map Goto Year 11 Route MapGoto Year 10 Route Map
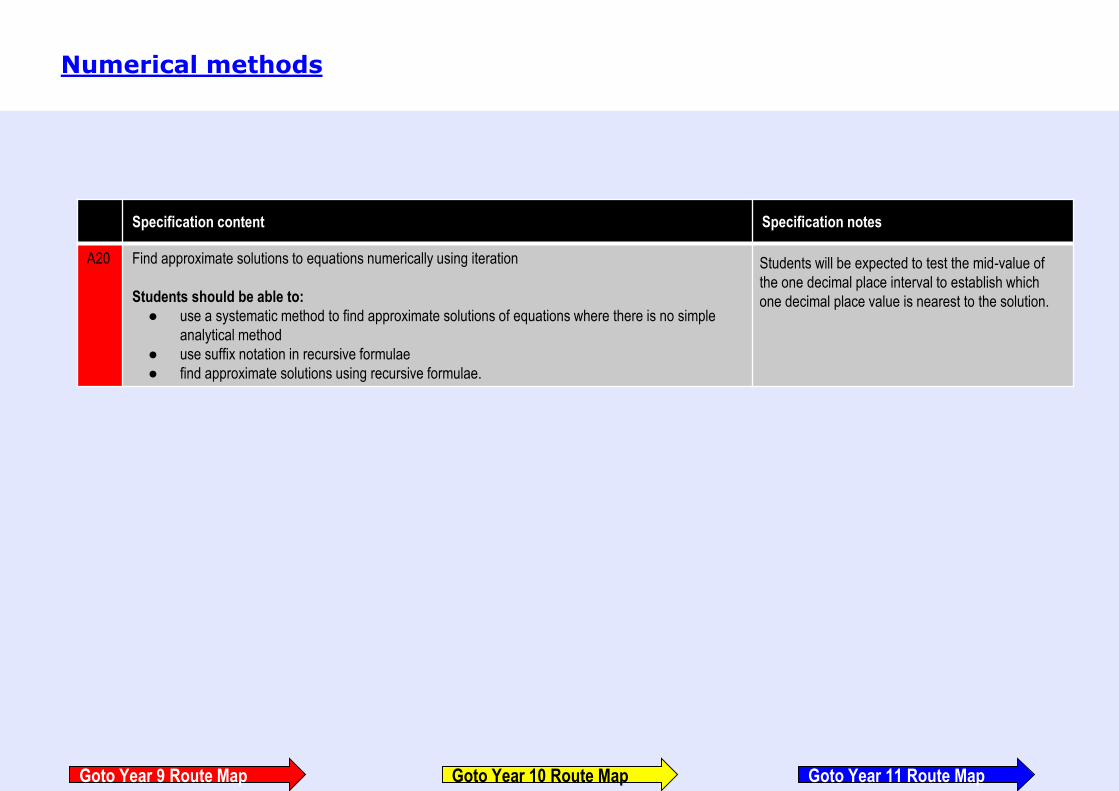
Specification content Specification notes
A20 Find approximate solutions to equations numerically using iteration
Students should be able to:
● use a systematic method to find approximate solutions of equations where there is no simple
analytical method
● use suffix notation in recursive formulae
● find approximate solutions using recursive formulae.
Students will be expected to test the mid-value of
the one decimal place interval to establish which
one decimal place value is nearest to the solution.
Numerical methods
Goto Year 9 Route Map Goto Year 11 Route MapGoto Year 10 Route Map

Specification content Specification notes
G10 Apply and prove the standard circle theorems concerning angles, radii, tangents and chords, and use
them to prove related results
Students should be able to:
● understand that the tangent at any point on a circle is perpendicular to the radius at that point
● understand and use the fact that tangents from an external point are equal in length
● use congruent triangles to explain why the perpendicular from the centre to a chord bisects the
chord
● understand that inscribed regular polygons can be constructed by equal division of a circle
● prove and use the fact that the angle subtended by an arc at the centre of a circle is twice the
angle subtended at any point on the circumference
● prove and use the fact that the angle subtended at the circumference by a semicircle is a right
angle
● prove and use the fact that angles in the same segment are equal
● prove and use the fact that opposite angles of a cyclic quadrilateral sum to 180°
● prove and use the alternate segment theorem.
In formal proofs, it is expected that clear and logical steps
are shown with reasons given.
Circle theorems
Goto Year 9 Route Map Goto Year 11 Route MapGoto Year 10 Route Map
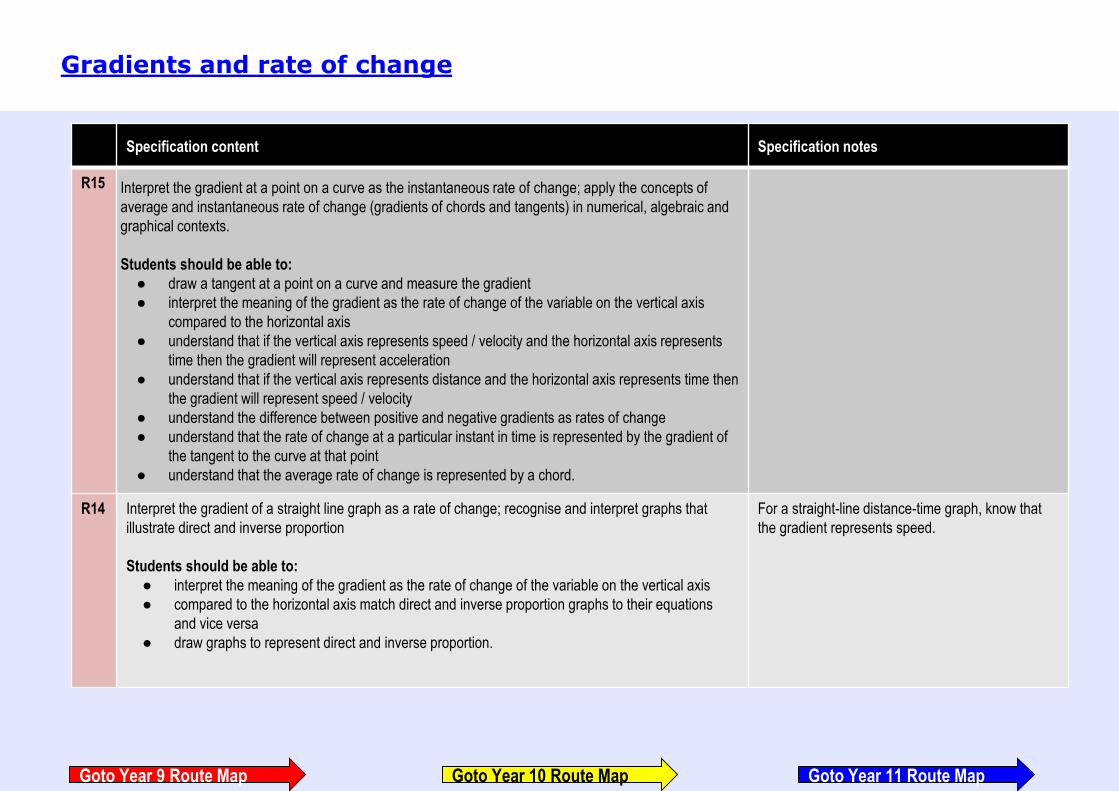
Specification content Specification notes
R15 Interpret the gradient at a point on a curve as the instantaneous rate of change; apply the concepts of
average and instantaneous rate of change (gradients of chords and tangents) in numerical, algebraic and
graphical contexts.
Students should be able to:
● draw a tangent at a point on a curve and measure the gradient
● interpret the meaning of the gradient as the rate of change of the variable on the vertical axis
compared to the horizontal axis
● understand that if the vertical axis represents speed / velocity and the horizontal axis represents
time then the gradient will represent acceleration
● understand that if the vertical axis represents distance and the horizontal axis represents time then
the gradient will represent speed / velocity
● understand the difference between positive and negative gradients as rates of change
● understand that the rate of change at a particular instant in time is represented by the gradient of
the tangent to the curve at that point
● understand that the average rate of change is represented by a chord.
R14 Interpret the gradient of a straight line graph as a rate of change; recognise and interpret graphs that
illustrate direct and inverse proportion
Students should be able to:
● interpret the meaning of the gradient as the rate of change of the variable on the vertical axis
● compared to the horizontal axis match direct and inverse proportion graphs to their equations
and vice versa
● draw graphs to represent direct and inverse proportion.
For a straight-line distance-time graph, know that
the gradient represents speed.
Gradients and rate of change
Goto Year 9 Route Map Goto Year 11 Route MapGoto Year 10 Route Map
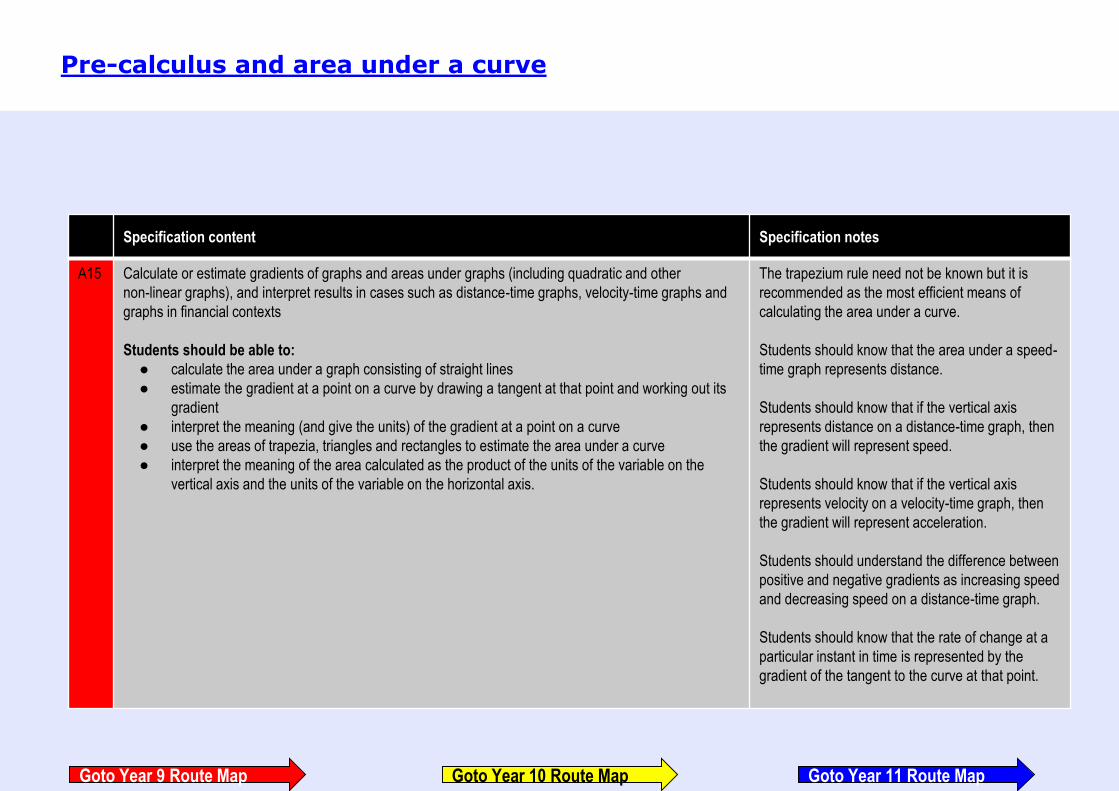
Specification content Specification notes
A15 Calculate or estimate gradients of graphs and areas under graphs (including quadratic and other
non-linear graphs), and interpret results in cases such as distance-time graphs, velocity-time graphs and
graphs in financial contexts
Students should be able to:
● calculate the area under a graph consisting of straight lines
● estimate the gradient at a point on a curve by drawing a tangent at that point and working out its
gradient
● interpret the meaning (and give the units) of the gradient at a point on a curve
● use the areas of trapezia, triangles and rectangles to estimate the area under a curve
● interpret the meaning of the area calculated as the product of the units of the variable on the
vertical axis and the units of the variable on the horizontal axis.
The trapezium rule need not be known but it is
recommended as the most efficient means of
calculating the area under a curve.
Students should know that the area under a speed-
time graph represents distance.
Students should know that if the vertical axis
represents distance on a distance-time graph, then
the gradient will represent speed.
Students should know that if the vertical axis
represents velocity on a velocity-time graph, then
the gradient will represent acceleration.
Students should understand the difference between
positive and negative gradients as increasing speed
and decreasing speed on a distance-time graph.
Students should know that the rate of change at a
particular instant in time is represented by the
gradient of the tangent to the curve at that point.
Pre-calculus and area under a curve
Goto Year 9 Route Map Goto Year 11 Route MapGoto Year 10 Route Map